Abstract
Characterizing the influence factors of exhaust gas based on the suspended road dust on paved roads, according to the number of vehicles and their distance with regard to driving pattern, is important in order to provide a coefficient for driving patterns to find a model equation. This has been a limitation of previous studies, in which this was difficult to carry out in a large area reflecting various driving patterns because some sections were selected according to empirical measurement results, and only one vehicle measurement was used to find the level of road dust. This study measured the concentration of suspended road dust that could occur, depending on the vehicle’s driving patterns, on an experimental road in Yongin, South Korea, from May to July 2023. The study was conducted to determine the degree of the effect of exhaust gas, according to the concentration of suspended road dust generated, by determining the separation distance based on real-time measurements. This study attempted to determine the changes in suspended road dust based on driving patterns in urban areas and factor in the concentration of suspended road dust with regard to emission characteristics in terms of exhaust gas and particulate matter with a diameter of 10 microns or less (PM10). This was in accordance with conditions evaluated using mobile laboratories, based on suspended-PM10-concentration-measuring equipment. This study mainly focused on the following main topics: (1) increasing the level of suspended particulate matter at less than 10 m intervals produced by exhaust gas; (2) decreasing the level of suspended road dust with an increase in the number of vehicles, with the area measured at a distance of three cars in front showing the lowest level of suspended road dust in the air and a low level for the rear vehicle; (3) demonstrating that PM10 is effective in measuring the generation of suspended road dust; and (4) evaluating suspended road dust levels by road section. Based on the results, this research is necessary to more appropriately set the focus of analyses that aim to characterize suspended road dust according to exhaust gas and PM10 content in silt.
1. Introduction
Previously, to construct necessary roads and related infrastructure, users utilized the facilities after the construction company had determined all the construction steps. However, in recent years, with the improvement in people’s quality of life, road management has transitioned to an era of identifying user services and providing related services. The road services provided currently encompass policies and technologies that consider not only user safety but also inconveniences such as fine dust, noise, and urban heat islands. This trend is evolving to offer progressive services that are friendly to both people and nature, rather than focusing solely on building new roads. According to Seoul City in South Korea (2017), the social cost of road and air pollution was estimated to be approximately KRW 0.64 trillion, with these factors constituting 50% of the road transportation fields [1].
Suspended road dust refers to particles discharged directly into the atmosphere without a specific outlet. It is generated by pollutants accumulating on the surfaces of paved and unpaved roads, and is suspended in the atmosphere due to vehicle body turbulence and shear stress caused by tire rotation when driving a car [2]. The air pollution process test standards define suspended road dust that is suspended in the atmosphere due to friction between the tires of vehicles driving on the road and the road surface. The EPA (AP-42 13.2.1 paved roads) indicates that suspended road dust can be defined as particles coming from various sources, deposited on the road, and then, suspended by driving vehicles [3,4].
Suspended road dust is just one source of particulate matter in the air, with various other contributors, including the open burning of domestic municipal solid waste [2]. Moreover, particulate matter (PM) generated by road dust can be classified as that from exhaust emissions (EEs) or from non-exhaust emissions (NEEs) depending on the source of the emissions [5]. EEs are formed from exhaust gas produced by the combustion of vehicle fuel and the volatilization of lubricants, whereas NEEs can be generated through the emission of dust from road surfaces such as tires, brakes, and road wear.
Research related to NEEs is gaining importance as it occurs step by step, not only from tire, road, and brake wear, but also from the suspension of road dust caused by turbulence from vehicles [6,7,8,9,10]. According to the European Environment Agency (EEA, 2016), it was estimated that nearly 90% of total PM emissions from road traffic would come from non-emission sources by the end of 2010 [7]. In a study on NEEs conducted abroad, D. Van der Gon et al. (2013) showed that the proportion of NEEs in the road transport sector increased from 20% to 40% from between 1990 and 2009 to between 1999 and 2010, respectively [8]. Moreover, PM emissions from vehicular exhaust and non-exhaust sources in the megacity of Delhi show that approximately 86% of emissions are NEEs. Additionally, the total PM10 emissions in Delhi, India (2019), were 31.5 Gg per year, with non-emission levels at 86%, which was six times higher than the emission levels (14%). The emission levels were further classified as originating from automobiles (34%), buses (23%), and heavy commercial vehicles (17%) [9].
In studies of exhaust gas, however, engines powered by modern diesel and compressed natural gas (CNG) showed the lowest PM concentrations and toxicological responses compared to other engine types [11]. Furthermore, there was a roughly positive relationship between transient CO, NOx, and HC emission rates and vehicle speeds, while the emission factors (EFs) decreased significantly with a speed decrease when the speed was ≤20 km/h [12]. With the grade of the road, the emission rates of NOx and HC tended to increase, and then, decrease as acceleration increased, peaking at 0 m/s2 without considering idling conditions. After reaching this distance, the emissions decreased as the vehicle speed continued to increase [13]. Speed and acceleration significantly impact emission rates, increasing with increases in speed and acceleration. Emissions were minimal at 40–60 kmph and −0.5–0.5 m/s2, but at 0 m/s, the relative pollutant fraction remained at a level of ~0.12, even at very long distances. Moreover, particles have a larger attenuation rate than gaseous pollutants, only above a particle number (PN) of ~0.6 m, and the diameters are very close to the background values. Solid particles can diffuse further in the vehicle’s transverse direction; when a car passes through a pedestrian area with a 3 m distance, pedestrians are exposed to 2.6–3-times-higher levels, according to the results of indoor experiments [14].
However, most studies related to exhaust gas have measured the concentration of carbon dioxide or PM, by conducting indoor experiments. But there has been a lack of research considering the various patterns that may occur in the city center or examining the effects of the difference in concentration occurring when a vehicle is actually driving at a constant speed [11,12]. Therefore, through this study, we tried to make this differentiation ourselves by identifying the dust concentration level that pedestrians passing by a road may be exposed to, the effective distance between the vehicles, and the correlation with silt loading and suspended road dust. Also, studies of suspended road dust rely on empirical methods by analyzing them according to traffic and environmental conditions at the time of measurement or selecting partial measurement areas [2,15]. In this study, the assertion is made that external factors can be more effectively minimized by measuring pollution levels within specific road sections while maintaining consistent conditions. In a previous study, a dust meter was permanently installed to assess the degree of pollution occurring when a vehicle passed. However, limitations arose in understanding pollution levels based on vehicle separation distance, as dust that accumulated on the road surface or that was generated by varying wind speeds was measured simultaneously. In contrast, this study aimed to uphold consistent conditions as much as possible, discerning the pollution levels generated when a vehicle passed at different separation distances. The findings of this study propose a nuanced approach, emphasizing the significance of considering variations in the distance of vehicle passage. During this period, only a single measurement vehicle was employed to determine the level of suspended road dust, revealing the limitation of addressing diverse driving patterns present in urban areas. Consequently, a hypothesis was formulated regarding the relationship between the generation of suspended road dust and the characteristics of dust emission, with the aim of exploring the quantitative correlation. To assess the impact of suspended road dust generated by vehicle movement on urban roads, this study introduced three pertinent impact conditions. Firstly, the study delved into the effect of exhaust gas produced during vehicle operation. Secondly, factors such as dust load and suspended road dust, akin to PM10 content, were measured. Finally, the factors under consideration excluded exhaust gas—the primary cause of road dust occurrence—due to the fixed measurement position behind the front tire, with a focus on the direct suspension impact. Employing this methodology, it is posited that road dust on urban roads can serve as foundational data for estimating suspended road dust through correction coefficients.
Additionally, the quantity of silt dust per unit area collected on the pavement is denoted as sL, with dust particles known to be <75 μm in size (PM75). However, as the suspended road dust concentration in this study focuses on PM10, representing fine dust, it is imperative to measure and analyze both the size and percentage (%) of the dust. Though applied to PM10 content within silt, if road dust particles are assumed to be typical spherical soil particles (density: approximately 2.5 g/cm³; dynamic shape coefficient: around 1.6), they can be considered similar. Hence, the PM10 content of the particle diameter measured by a particle size analyzer can be deemed as the same mass fraction (mass %) when measuring the same particle, corresponding to the volume fraction (volume%) in the silt [2,15].
2. Materials and Methods
2.1. Study Area
To establish a reasoned classification of PM10 characteristics on roads, locations were strategically chosen to be representative of typical vehicle operating conditions and environmental features. Measurements were conducted during a period aligned with the effects of exhaust gas and PM10 content, specifically, in October 2023. Throughout this measurement period, no weather events such as rainfall (0.01 inches of rain) occurred, which could have had a significant impact on fine dust concentration [16]. Furthermore, an additional set of measurements was taken on the concentration of suspended road dust on paved roads where traffic was non-operational to minimize external factors. Background PM10 data (observatory) were concurrently collected through the urban observatory monitoring system. As depicted in Figure 1, experiments were carried out on asphalt pavement in urban areas and on operating roads, categorized into industrial, residential, and commercial roads based on their characteristics. This approach allowed for the identification of suspended road dust concentration levels according to road texture and sL within the same asphalt. Moreover, exhaust gas experiments were conducted on residential roads.
2.2. Silt Loading (sL) and Suspended Road Dust Measurement
Suspended road dust refers to dust particles that remain airborne for an extended period as silt (sL) accumulates on the surface and is suspended in the atmosphere due to vehicle operations. This suspended road dust significantly contributes to PM10 concentration, and it can be inferred that the higher the amount of dust accumulated on the actual road, the greater the likelihood of suspended road dust contributing to PM10. This accumulation can be expressed as sL (g/m2), with road dust represented by measuring the weight of particles less than 75 μm deposited on a unit area (m2) of the road. In this study, sampling was conducted following the field sampling process outlined in the EPA AP-42 C-1 standards, and the analysis was carried out according to the laboratory analysis procedure of the EPA AP-42 C-2 standards. C-1 describes the sampling method and measurement of silt loading from road surface dust, while C-2 shows how to analyze the silt with indoor experiments [16]. From these appendix standards, the chemical composition and silt loading can be calculated. Furthermore, the results of the analysis of characteristics by particle size were confirmed along with a weight of mass dust of 75 μm or less. Methods for measuring sL include the broom sweep method, which involves collecting dust from the road using a broom, and the vacuum sweep method, which employs a vacuum cleaner.
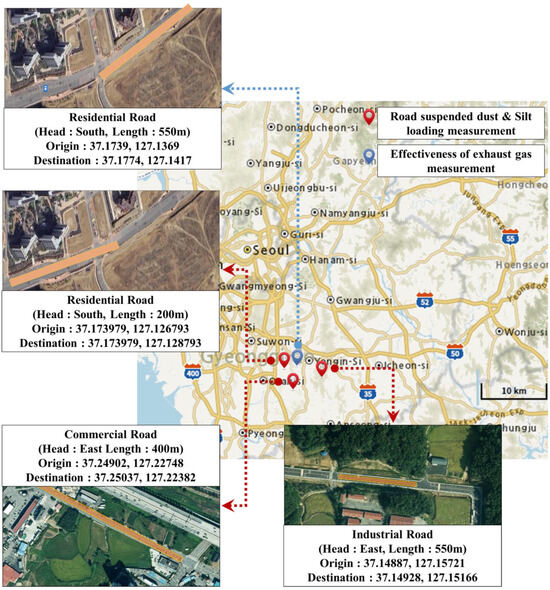
Figure 1.
Study area in Yongin, South Korea (residential road, commercial road, and industrial road).
In this study, sampling and analysis were performed using the vacuum sweep method. The measurement method was conducted as shown in Table 1 for analyzing sL and suspended road dust by road pavement type. During this study, with the aim of enhancing the sL evaluation method, the existing AP-42 C.1 methodology for real-time road measurement was partially adopted. To achieve this, a bag filter capable of collecting dust with a particle size of 1.0 μm or more was installed in a portable industrial cleaner (model: TENANT V3E), as illustrated in Figure 2. This setup was employed to comprehensively collect all dust present on the road surface.

Table 1.
Silt loading and detailed measurement methods for suspended road dust.
To mitigate potential errors in dust collection, where some dust might not be captured during measurements, a tool was fabricated to match the width of the road in the measurement section. A cleaner was then utilized with the intention of minimizing such errors. During this process, the collection of dust on the road surface was carried out for up to 20 min, aiming for a sample collection of approximately 200 g whenever possible [16]. Considering the EPA standard for a 3 m section, which was designed for 10 measurements based on the length of the vacuum cleaner sampling inlet (30 cm), efforts were made to establish a methodology that could effectively represent the entire 100 m section by determining the sampling location or number based on the 3 m section.

Figure 2.
Vacuum sweep method for silt loading measurement.
To sample the sL in the field, obtaining data for every 3 m at each site is challenging due to nighttime traffic blocking. Therefore, for convenience, 25 m sampling within the 100 m data range was adopted. For data analysis, a correlation analysis was conducted to assess the reliability of the data, and pre-processing operations were applied to the collected sL values.
During this process, if a section was deemed similar, grouping was performed to determine locations that could be sampled for each 100 m section using both 3 m and 25 m data. The sL and suspended road dust data measurements were conducted in continuous sections, with lane width adjusted based on field conditions. A 10 m interval gap was maintained between the 3 m and 25 m collection sections to minimize data overlap and reduce errors in measuring suspended road dust. Following the dust sampling methodology proposed by the U.S. EPA for measuring the sL of the sample road, 33 vacuum sampling samples were collected within a 100 m section, setting an area of 3 × 3.5 m (length × width). Additionally, four samples were taken in an area of 25 × 3.5 m (length × width) to measure the sL within the continuous 100 m section, as illustrated in Figure 3.
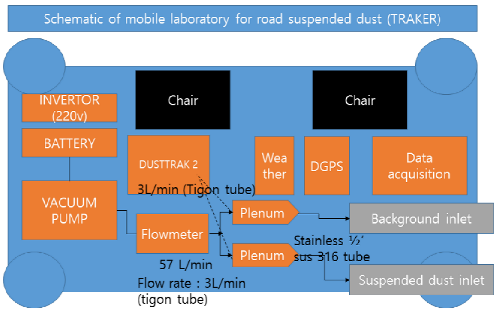
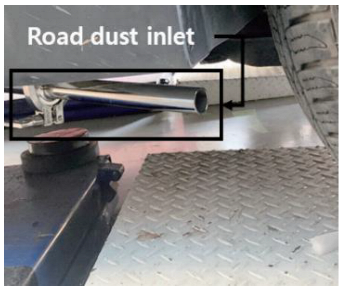
For road dust measurement, Table 2 describes a vehicle developed to measure suspended road dust according to the TRAKER-based mobile laboratory standard. This vehicle attaches a dust measurement inlet to the right front tire and the bumper in front of the car to measure the concentration of suspended road dust in the air by sL on the road in real time. By establishing a real-time mobile dust measurement system based on the Desert Research Institute (DRI)’s TRAKER method, the suspended road dust on urban pavement can be monitored, and the impact of road dust sources can be confirmed with various factors [17,18].

Table 2.
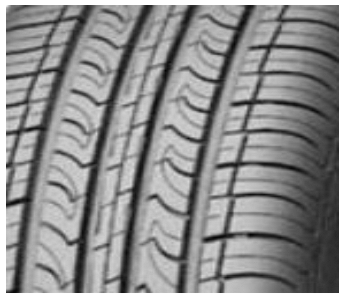
Vehicle and tire characteristics for measuring suspended road dust.
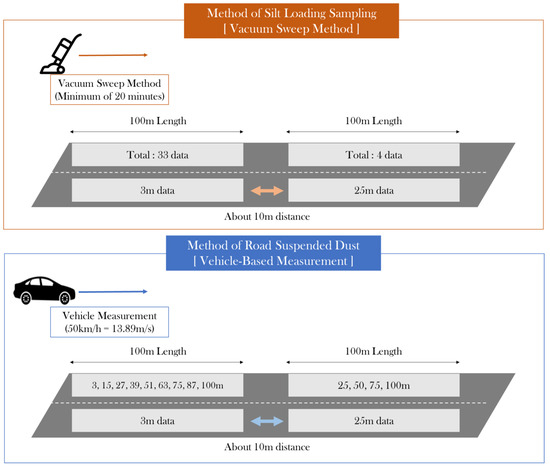
Figure 3.
Method of sampling road silt loading over 3 m and 25 m.
There are various methods for measuring the weight of dust concentration, crucial for quantifying the optical and physical properties of suspended road dust. One such method involves the light scattering technique, which measures the weight of dust passing through using light scattering. In this study, PM10 measurement was conducted using a TSI Dusttrak 8530. The Dusttrak equipment is capable of measuring a particle size range between 0.1 and 10 μm through the light scattering method. According to Inoka (2015), these instruments can measure the concentration of suspended road dust by utilizing the filter capability of Dusttrak equipment [19].
During the experiment, 1 min after the operation of the equipment was designated as the experimental time to ensure the stability of the flow rate and regular sampling conditions when inhaling dust. The actual measurement time within the sampling section, while maintaining a constant speed, was set at 5 s after entering the measurement section.
In general, suspended road dust can be influenced not only by various environmental factors such as temperature and humidity, but also by vehicle type, driving speed, and tire characteristics [20]. Dust measurements were conducted under the same conditions for driving speed in a single vehicle and tire characteristics were assessed to quantitatively analyze suspended road dust caused by dust emissions. During the 100 m section drive, covering approximately 14 m based on a speed of 50 km/h, it was possible to obtain about 6 to 7 data points in one measurement. Therefore, it was considered a sufficient section to measure the concentration of suspended road dust [21].
Subsequently, the IQR (Interquartile Range) method was employed to examine the distribution of sL and suspended road dust based on the sampling locations. IQR represents the basic value of the box plot, with the median in the box indicating the average value of the data. The Q1 (25th percentile) and Q3 (75th percentile) variations are positioned above and below the box, and the difference (Q3−Q1) constitutes the IQR. The minimum limit is calculated by subtracting 1.5 times the IQR from Q1, and the maximum limit is determined by adding 1.5 times the IQR to Q3.
2.3. Method of Measuring Effects of Vehicle Exhaust Gas and Suspended road dust
Firstly, an investigation of the distance affected by exhaust gas was carried out to determine the change in suspended road dust concentration based on the mobile laboratory. It was found that the impact can be minimized when the distance is maintained at more than 20 m from the front car, defined as an “Exhaust gas safety distance” capable of avoiding emissions from the front car [22]. Moreover, maintaining a distance of 20 m from the front car while driving at an average speed of 40 km/h in the city results in a nitrogen dioxide (NO2) concentration of 0.02~0.03 ppm in the air inhaled by the driver of the rear car, similar to the roadside level. Hence, it was established that a separation of at least 20 m was necessary based on the distance between the front and rear of the vehicle [22].
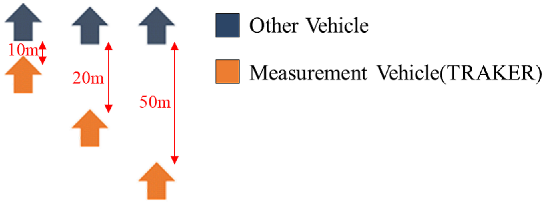
During the experiment, the driving speed was fixed at 50 km/h, the maximum speed according to the city center’s 5030 policy, and a safe distance was maintained to prevent collisions with cars that might suddenly stop while driving [21]. Typically, the safe distance of a vehicle is understood to be driving at a distance of 1 m for every 1 km/h when maintaining a distance from the vehicle in front proportional to the vehicle’s speed. Therefore, the suspended road dust concentration and sL were measured at separation distances of 10 m, 20 m, and 50 m between the front and rear of the vehicle, as a safe distance of 50 m/h needed to be secured. All data were measured more than 10 times each with the same conditions, and the measurement was conducted over three days to assess the effects of exhaust gas.
Furthermore, since most predictions for suspended road dust estimate the concentration generated when a measuring vehicle passes, the experiment focused on identifying the concentration of suspended road dust generated according to the vehicle’s driving behavior in the urban area. This approach aimed to present a unit that can be used as a coefficient. Therefore, the measurement was primarily conducted in a manner judged to have a significant turbulence effect on the ground generated by driving vehicles other than the measurement vehicle. All potential vehicle behaviors are outlined in Table 3 and Table 4.

Table 3.
Driving patterns of suspended road dust measurement with distance.

Table 4.
Driving patterns of suspended road dust measurement based on number of vehicles from measurement vehicles.
2.4. PM10 Content Measurement
An additional analysis was carried out by integrating the Helos & Rodos (Sympatec) laser particle size analyzer with a KS A ISO 13,320 application device, which measures particles in the range of 0.1 to 8750 μm. This analysis aimed to determine the degree of PM10 content within the collected silt [2]. The laser diffraction method employed by the device utilizes two phenomena of refraction and diffraction among light scattering methods. It quantitatively determines the level of PM10 fine dust contained in the particles [19]. The classification presented in Table 5, referring to an unspecified country, was used, and the weight of each particle size was obtained by multiplying a mass ratio of PM10 (2.5–10 μm) or less by the total weight of the sample passing through 75 μm [23].

Table 5.
Range of dust particle size distribution in US Countries.
In the case of the Helos & Rodos (Sympatec) laser particle size analyzer equipment, when the collected silt is input into the equipment, it allows for setting ranges below 10 microns and up to 70 microns. At this time, for sL, representing an amount of dust less than 75 μm, it was confirmed that 100% was measured, and a range below 10 microns was considered as the dust content of PM10 and recorded for analysis.
Moreover, if a detailed analysis of dust particle sizes was required, the intention was to utilize the Helos & Rodos (Sympatec) laser particle size analyzer to determine the size of the dust particles. Figure 4 provides an example of the results of particle size distribution when using the device, with a focus on 0.39% when conducting the analysis. This method calculated the PM10 content by collecting silt using the PM75 silt loading method and analyzing particle size. The data collection involved 33 silt points for the 3 m section and 4 silt points for the 25 m section at each site, revealing variations in suspended road dust concentration based on PM10 content. This method was based on the results of laser diffusions [2].

Figure 4.
Method of measuring size distribution of road dust and method of finding PM10 content (* means the distribution density of the particles).
3. Results
3.1. Relationship between Suspended Road Dust and Silt Loading
The spatial contamination distribution of the sL value, measured through tests on A~C sites, is estimated to exhibit various values for each collection point. Consequently, the sL value was measured, and the spatial contamination distribution was further analyzed using the results of measuring debris on the surface at one-second intervals through a TRAKER-based mobile laboratory system. All selected data were measured under the same conditions, ensuring consistency not only at the starting point but also during acceleration, constant speed, and at the endpoint within the measurement section. The concentration of suspended road dust according to the sL value was measured in accordance with the 50 km/h operation guidelines.
As a result, the average concentration of suspended road dust was calculated for each sL collection section measured within the 100 m section by converting the travel distance from the starting point using GPS coordinates acquired through a mobile laboratory. The pollution level changes were then analyzed. The suspended road dust concentration, based on the average sL of the entire A–C site section, exhibited a high correlation, as shown in Figure 5, with the suspended road dust concentration increasing in accordance with the amount of sL.
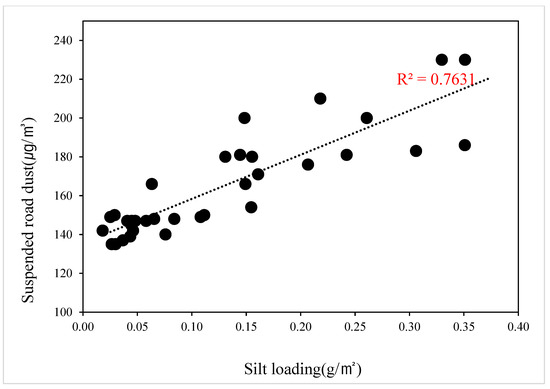
Figure 5.
Relationship between silt loading and dust in measurement sections.
The correlation coefficient calculated under these conditions for all sL data at sites A~C, including 3 m and 25 m, was 0.76, indicating a high correlation. However, it should be noted that the characteristics of the test road (road surface condition), the silt characteristics of the section (particle diameter distribution), and the characteristics of the measuring device of the mobile laboratory can all influence the results. Additionally, uncertainties in the experimental method, such as differences in dust particle size when measuring the sL of the conventional and mobile laboratory by sL, are also considered. Nonetheless, sL can effectively represent the range of suspended road dust, making it a valuable evaluation method.
When the sections collected at 3 m and 25 m were separately analyzed, as shown in Figure 6, both the 3 m and 25 m dust collections indicated that sL influenced suspended road dust. Therefore, sL is considered to be the most influential factor in suspended road dust levels. However, it appears that an increase in sL correlates with an increase in suspended road dust, suggesting that if the levels of sL and suspended road dust are similar, the two sample collection sections are expected to be similar.
However, it was observed that the change in the concentration of suspended road dust was minimal based on the deviation in the dust load presented earlier in the section where dust was collected over 3 m. This is judged to be the result of errors caused by human factors, such as the cleaning direction, because dust in a wide section is collected at once when it is collected over 25 m. The maximum sL value for each site was different, within 100 mg/m2. Upon analyzing the concentration of suspended road dust according to sL, the concentration of suspended road dust increased by up to 5 µg/m3 based on 50 km/h for every 100 mg/m2 increase [15]. Additionally, according to the U.S. Desert Research Institute (DRI), which developed TRAKER, there is a difference of 10 µg/m3 [15,18].
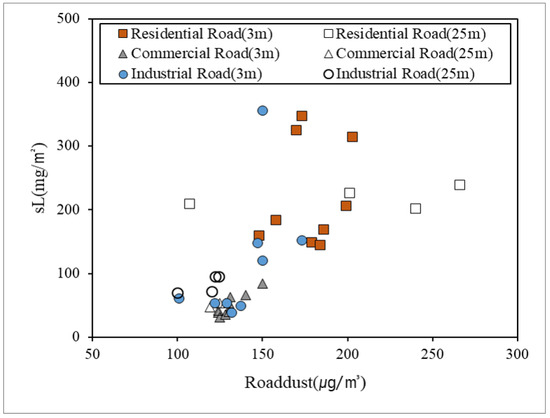
Figure 6.
Comparison between 3 m and 25 m sampling methods in measurement sections.
For an accurate comparison, the average value of the concentration of suspended road dust was calculated for each sL collection section measured within the 100 m section by converting the travel distance from the starting point using GPS coordinates acquired through a mobile laboratory to analyze the pollution level changes. The suspended road dust concentration according to the average sL of the entire A~C site section measured showed a high correlation, as shown in Figure 7 and Figure 8, and the suspended road dust concentration increased according to the amount of sL. The correlation coefficients are 0.51 and 0.56, respectively.
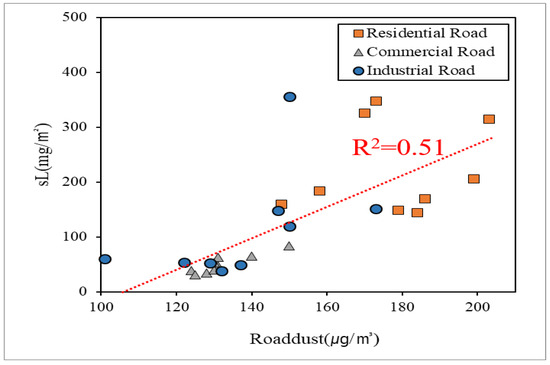
Figure 7.
Relationship between silt loading and dust in 3 m sampling method.
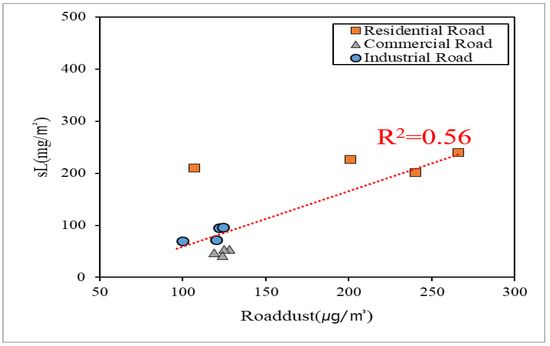
Figure 8.
Relationship between silt loading and dust in 25 m sampling method.
3.2. Effective Distance in terms of Exhaust Gas Based on Distance Interval
Table 6 shows the silt loading on the residential road (Site C) to examine the effects of exhaust gas. In this case, a sampling method of 25 m with 400 m suspended road dust was used based on the previous results. Subsequently, when driving starts at the beginning point, the concentration of PM10 increases in accordance with the concentration of sL until returning to the starting point. The distribution by weight concentration was examined based on the particle size of the collected sL to assess the size distribution of suspended road dust emanating from the rear tire during driving.

Table 6.
Coefficient of suspended road dust based on driving patterns.
The highest sL value in the experimental section was 0.011 g/m2, which was lower than the average dust load of 0.05 g/m2 in the urban city [15]. Since there was no significant difference between continuous sections, it is found that there will be no significant variation in the concentration of suspended road dust due to the dust load. This is attributed to the fact that the silt on the road was washed away by more than 1 mm of rain the day before each measurement, and it is judged to be the result of more than 0.025 mm of rainfall, as suggested by the EPA [16].
As shown in Figure 9, the measurement results indicate that the concentration of suspended road dust was higher when the vehicle was maintained at a 10 m distance in comparison to when only one measuring vehicle passed (mobile laboratory), with an average increase of about 50%. Additionally, when driving at a 20 m distance from the front car, the concentration of suspended road dust was most similar to when only one measuring vehicle passed, and at 50 m, it was found to be lower than the distance of 20 m. All suspended road dust concentrations were higher than the background dust concentration, indicating no errors in the measurement equipment used to measure suspended road dust.
The longer the separation distance of the vehicle, the lower the concentration of suspended road dust, suggesting a lower level of influence of exhaust gas at separation distances of 20 m or more. At a separation distance of 10 m, the concentration was about five times higher than the background concentration generated when the measuring vehicle was driven, indicating the effectiveness of exhaust gas.
Although the background dust concentration increased at a separation distance of 20 m, it was judged that there was no significant difference because the increase was within 5 µg/m³. Since there was no significant effect on the background concentration at a separation distance of 50 m, this study aimed to determine the effect of the suspended road dust concentration at a separation distance of 20 m.
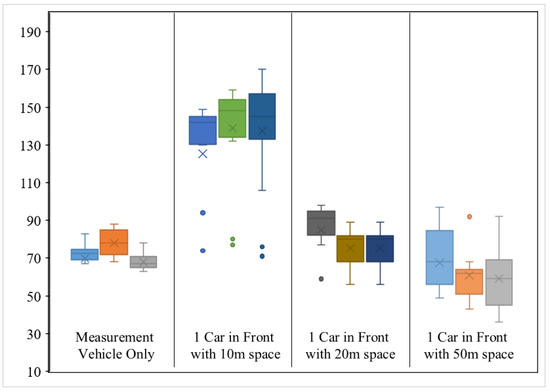
Figure 9.
Results of suspended road dust measurements with different distances of intervals.
When driving through a 10 m separation distance, the dust concentrations measured at the front inlets of the vehicles were compared and analyzed together, as shown in Figure 10, to determine the impact of exhaust gas with the short-distance separation.
Upon analyzing the deviation in the suspended road dust concentration over time when driving at 10 m, it was observed that the suspended road dust concentration was approximately two or up to three times higher when driving at a separation distance of 10 m in all cases. At this time, the sL was very low, indicating that the effects of sL did not occur in these results. The difference between the 10 m driving result and the dust concentration when only one measuring vehicle passed is the result of the combination with the suspended road dust concentration due to exhaust gas generated during driving. It is judged that no data error occurs because it was driven in a certain section at a constant speed. Therefore, the separation distance between the front and the rear of the vehicle is considered an important factor. When measuring the dust concentration by driving around the urban area, the section where the dust concentration increases is found to have a high sL on the road. Therefore, it is judged that these factors need to be considered through a measurement vehicle managed by the local government.
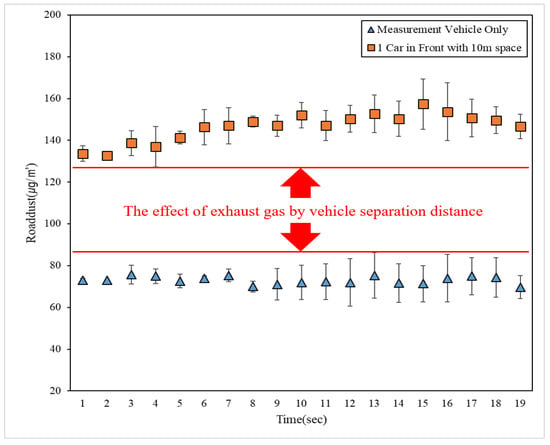
Figure 10.
Effects of exhaust gas with 10 m space based on suspended road dust from measurement vehicles.
Table 7 shows the results obtained when the change in the concentration of suspended road dust according to the separation distance is converted to a correction coefficient. The longer the distance based on the amount of dust passing through one measuring vehicle, the lower the concentration of suspended road dust. At a distance of 10 m, it is judged that the emission value is high due to dust suspended from the road surface and exhaust gas emissions generated by the vehicle in front of it.

Table 7.
Coefficient of suspended road dust based on driving patterns.
In addition, in the case of 20 m, the separation distance of 20 m presented above is judged to be a distance that can minimize the effect on the exhaust gas concentration because the mobile laboratory has the most similar characteristics to the dust concentration passing through one. It can be interpreted that some dust suspended on the road when vehicles are 50 m apart will not accumulate again and will undergo some loss if it is suspended or if the concentration of suspended road dust is measured by leaving the lane.
3.3. Suspended Road Dust Based on Number of Vehicle Patterns
The result of measuring the concentration of suspended road dust according to vehicle driving behavior is shown in Figure 11, and it was found that the concentration of suspended road dust increases when two cars are in parallel with another method (two cars in front, three cars in front). It is judged that dust suspended from the vehicle immediately in front of the measuring vehicle spreads into the air once more by the vehicle next to it, increasing the concentration of dust inhaled by the measuring vehicle.
Currently, the measurement of a mobile laboratory proposed by the Ministry of Environment in South Korea measures suspended road dust at the end of the road for stability of the operation. However, in the case of the suspended road dust concentration derived from this study, it was up to four times higher than when only the measurement vehicle was driven, so it is believed that more damage could occur in pedestrians walking on the side of the road. In addition, if two cars are in the front, suspended road dust in the air by the first vehicle continues to be suspended by the vehicle behind it, but it is believed to be gradually lower than the dust predicted in the dust load because it can spread into the air during the diffusion process.
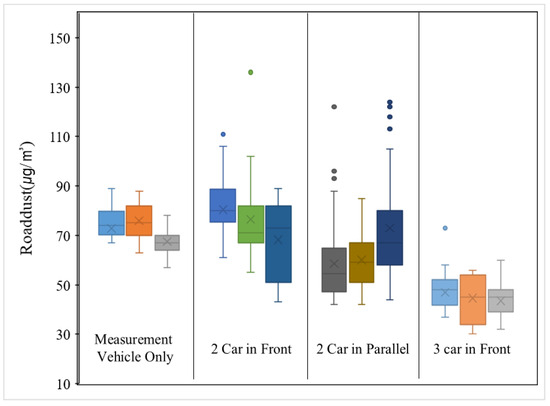
Figure 11.
Results of suspended road dust with different distances of intervals.
In summarizing the results of vehicle behavior at the same separation distance, it is observed that when two cars are parallel with the car in front, suspended road dust diffuses, resulting in a high concentration of dust. This is translated into a correction coefficient based on the concentration of suspended road dust generated by the vehicle’s driving behavior, as presented in Table 8. A higher coefficient in front of the vehicle corresponds to a lower concentration of suspended road dust. It is inferred that driving in front of the vehicle causes dust to be suspended in the air, and this dust continues to remain airborne as the following vehicle further disperses it, reducing the concentration of tire-derived dust. Additionally, when two vehicles drive in parallel, the dust suspended from the front vehicle is relatively high, as it is further dispersed by the adjacent vehicle. Consequently, it is noted that the current mobile laboratory measurement, although taken at the end of the road, may underestimate the dust concentration measured by the vehicle.

Table 8.
Coefficient of suspended road dust based on driving patterns.
3.4. Suspended road dust According to PM10 Content
The characteristics of tire-surface suspended road dust and dust emissions were measured for the three types of asphalt pavement applied in Yongin City, and Table 9 is a summary of the measured suspended road dust data. First, the suspended road dust tends to increase as the vehicle’s driving speed increases. In the case of the starting point, since the vehicle is not driving, it is the same as the background dust concentration of the current measurement section, which is similar to the dust concentration suggested by the Observatory of Meteorological Administration of South Korea [20].

Table 9.
Results of suspended road dust based on speed and road type.
In general, since PM10 concentration is used when measuring suspended road dust through a mobile laboratory, it is necessary to distinguish the total PM10 concentration from the dust load to examine the hypothesis in this study established between the amount of sL and the suspended road dust. Additionally, as described in Table 10, in the case of sL and PM10 content related to dust emission, the residential road showed the lowest at 47.8 mg/m2, and PM10 content was also low, indicating the lowest value for the suspended road dust concentration according to speed. In the case of commercial roads, the sL value was the highest at 229.1 mg/m2, and in the case of industrial roads, the average PM10 content was 6.81%, which was high according to the section.

Table 10.
Results of road silt loading and its average PM10 content of silt.
So, it was considered that there was an impact on the difference in PM10 content for each measurement road in analyzing the characteristics of the sL. Therefore, by analyzing the results of suspended road dust on residential roads, industrial roads, and commercial roads in Yongin, it is confirmed how the change in PM10 content (%) affects the suspended road dust, and the measurement shows that the suspended road dust concentration changes according to the ratio of PM10 content (%). The suspended road dust measured on the residential road in Yongin City shows a low sL value from 0.04 g/m2 to 0.07 g/m2, but it is shown that suspended road dust is higher than that on the industrial road, which increases when driving with high levels of PM10 content.
The concentration of suspended road dust, based on travel distance, exhibited variations in pollution depending on the driving direction, even on the same sample road across all three sections (A~C) on which we collected sL. Moreover, there is a positive correlation between sL and the concentration of suspended road dust, with higher sL values corresponding to elevated dust concentrations.
For the measured industrial road in Yongin, as described in Figure 12, the sL value was about twice as high as for the Site A (residential) section; it was found that suspended road dust increased after about 2 to 3 s when PM10 content showed a high level. When a higher value of PM10 content appears in a spot, there is an increased value of suspended road dust, and the effects of PM10 on silt can lead to a high level of suspended road dust. Therefore, PM10 content (%) in sL is judged to be a major factor in determining the concentration of suspended road dust.
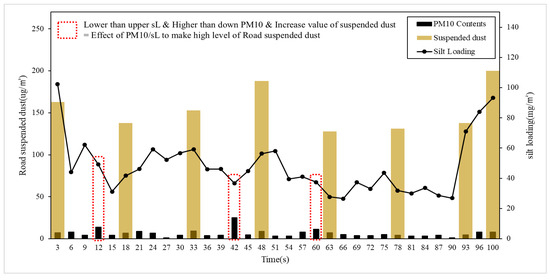
Figure 12.
Effects of exhaust gas with 10 m space based on suspended road dust from measurement vehicles.
Based on these results, Figure 13 shows the relationship between suspended road dust and PM10 content in silt within the entire measured section. The PM10 content and suspended road dust concentration in the silt were found to increase similarly, but the deviation was large on the commercial road where the silt content was high.
However, if the PM10 content in sL is too high with a value of 0.1 g/m2, there is no significant difference in the suspended road dust concentration that affects the change in the sL value. This is because the effect of sL in creating suspended road dust is higher than that of PM10 content. The sL value of 0.1 g/m2 is the highest average value in South Korea in urban areas [15].
At this time, if the sL value is low, the concentration of suspended road dust that can occur may be small, but if the PM10 content is high, the amount of suspended road dust increases because the tire contains a lot of PM10 particles in the silt. However, if the amount of dust is large, additional consideration should be taken because there is an error in the amount of dust actually collected through the inlet and the amount of dust inhaled during driving when the measuring vehicle drives on the road. It is believed that this study can be used to present a correction factor without the need for 1:1 matching of the suspended road dust concentration over the time that dust is collected when estimating the suspended road dust concentration according to sL.
The criteria for separating sL and PM10 content in this study were chosen based on the mechanism of suspended dust for sL on asphalt pavement. In the case of hot mix asphalt (HMA), deposited dust stays on the surface as an impermeable pavement and can be promptly suspended by a moving vehicle or wind. Consequently, even with the same dust load, the concentration of suspended road dust can vary depending on the PM10 content level present in the silt.
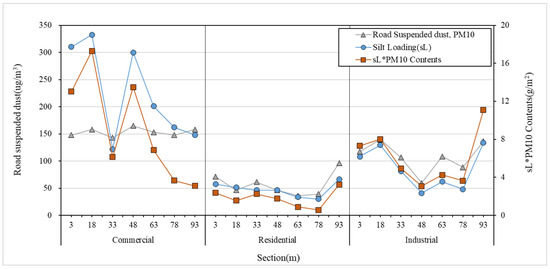
Figure 13.
Suspended road dust based on sL* PM10 content on different types of road.
4. Discussion
This study focuses on suspended road dust, defined as particles created due to vehicle-induced turbulence and shear stress on road surfaces. NEE has become increasingly significant in recent years. However, the results of suspended road dust analyses are based on experiments with one mobile laboratory that cannot reflect the driving patterns that occur in urban areas. Therefore, this study aims to find coefficients based on the effects of exhaust gas with interval distance and the number of vehicles. Moreover, since sL reflects particles under 75 µm, this study attempts to identify factors for calculating PM10 content.
- (1)
- SL is a primary determinant of suspended road dust concentration; higher sL values correspond to increased dust levels, with an average correlation of 0.76. Moreover, suspended road dust increases by up to 5 µg/m3 based on a 50 km/h driving speed for every 0.01 g/m2 increase in sL, highlighting the dominance of sL in determining dust concentration.
- (2)
- Regarding the effective distance in terms of exhaust gas, maintaining a separation distance of 20 m proved effective in minimizing the impact of exhaust gas emissions on suspended concentrations. At a 10 m distance, the concentration was five times higher than the observatory background and two times higher (75 µg/m3 -> 150 µg/m3) with one measurement vehicle pass. This emphasizes the importance of a safe driving distance in relation to exhaust gas.
- (3)
- As the number of vehicles in front increases, influenced by vehicle patterns, dust accumulated on the road is dispersed in the air by the movement of vehicles. The measured concentration of scattered dust decreases because it is unable to reaccumulate due to subsequent passing vehicles. When driving in front of a vehicle, dust is suspended in the air, and this suspension continues as the following vehicle disperses it, consequently lowering the concentration of dust from the tire. Additionally, when two vehicles drive in parallel, the dust suspended from the front vehicle is relatively high as it is once again dispersed by the adjacent vehicle.
- (4)
- PM10 content levels were measured across different road types, with the industrial road exhibiting the highest average at 6.81%. The concentration of suspended road dust on residential roads, characterized by low sL, was notably influenced by the PM10 content (%).
However, if the PM10 content in sL is too high, there is no significant difference in the suspended road dust concentration that affects the change in the sL value. This is because the effects of sL are higher than those of PM10 content in making suspended road dust. The characteristics of PM10 concentration differences were measured in urban areas to expand upon existing studies of the suspended road dust model. This experiment aims to achieve a comprehensive understanding of road dust and coefficients for many driving patterns and exhaust gases in urban areas. Through this, we understand the long-term trends of NEE in monitoring and predicting how road dust may occur in urban areas. In addition, by including the PM10 content analysis, the effect of particle composition on suspended road dust was revealed to provide a new perspective, enhancing our understanding of the approach methodology and the precision of the measurement methodology. In this study, we demonstrate the necessity of refining the measurement protocol for road dust emission and present an innovative methodology for assessing PM10 and suspended road dust in silt.
Author Contributions
Conceptualization, I.K. and H.Y.; methodology, H.Y. and S.H.; investigation, J.C. and S.H.; original draft preparation, H.Y. and J.C.; writing—review and editing, I.K. and H.Y. All authors have read and agreed to the published version of the manuscript.
Funding
This work was supported by a Korea Agency for Infrastructure Technology Advancement (KAIA) grant funded by the Ministry of Land, Infrastructure and Transport (grant number 21POQWB152342-03).
Institutional Review Board Statement
Not applicable.
Informed Consent Statement
Not applicable.
Data Availability Statement
The urban weather observation data from the Automated Synoptic Observing System (ASOS) were provided by Korea Meteorological Administration (KMA) and are available online: https://data.kma.go.kr, accessed on 25 November 2023.
Acknowledgments
The authors would like to thank the members of the research team, KAIA, and MOLIT for their guidance and support throughout this project.
Conflicts of Interest
The authors declare no conflict of interest.
References
- Hwang, I.; Kim, C.; Son, W. Benefits of Management Policy of Seoul on Airborne Particulate Matter: The Seoul Institute Policy Research; The Seoul Institute: Seoul, Republic of Korea, 2018; pp. 88–150. [Google Scholar]
- Choi, Y.; Kim, Y.; Lee, H. A Study on Road Cleaning to Reduce Resuspension of Road Dust; The Seoul Institute Policy Research: Seoul, Republic of Korea, 2018; pp. 1–135. [Google Scholar]
- Kristensson, A.; Johansson, C.; Westerholm, R.; Swietlicki, E.; Gidhagen, L.; Wideqvist, U. Real-world traffic emission factors of gases and particles measured in a road tunnel in Stockholm, Sweden. Atmos. Environ. 2004, 38, 657–673. [Google Scholar] [CrossRef]
- Amato, F.; Pandolfi, M.; Escrig, A.; Querol, X.; Alastuey, A.; Pey, J. Quantifying road dust resuspension in urban environment by multilinear engine: A comparison with PMF2. Atmos. Environ. 2009, 43, 2770–2780. [Google Scholar] [CrossRef]
- Penkała, M.; Ogrodnik, P.; Rogula-Kozłowska, W. Particulate matter from the road surface abrasion as a problem of non-exhaust emission control. Environments 2018, 5, 9. [Google Scholar] [CrossRef]
- Amato, F.; Alastuey, A.; De La Rosa, J.; Gonzalez Castanedo, Y.; Sánchez de la Campa, A.M.; Pandolfi, M.; Querol, X. Trends of road dust emissions contributions on ambient air particulate levels at rural, urban and industrial sites in southern Spain. Atmos. Chem. Phys. 2014, 14, 3533–3544. [Google Scholar] [CrossRef]
- European Environment Agency. EMEP/EEA Air Pollutant Emission Inventory Guidebook 2016; Technical Guidance to Prepare National Emission Inventories: Geneva, Switzerland, 2016; pp. 123–126.
- Van der Gon, D. The Policy Relevance of Wear Emissions from Road Transport. Now and in the Future an International Workshop Report and Consensus Statement. J. Air Waste Manag. 2013, 63, 136–149. [Google Scholar]
- Signh, V.; Biswal, A.; Kesarkar, A.; Mor, S.; Ravindra, K. High resolution vehicular PM10 emissions over megacity Delhi: Relative contributions of exhaust and non-exhaust sources. J. Total Environ. 2020, 699, 4–7. [Google Scholar]
- Amato, F.; Cassee, F.R.; van der Gon, H.A.D.; Gehrig, R.; Gustafsson, M.; Hafner, W.; Querol, X. Urban air quality: The challenge of traffic non-exhaust emissions. J. Hazard. 2014, 275, 31–36. [Google Scholar] [CrossRef] [PubMed]
- Hakkarainen, H.; Aakko-Saksa, P.; Sainio, M.; Ihantola, T.; Rönkkö, T.J.; Koponen, P.; Rönkkö, T.; Jalava, P.I. Toxicological evaluation of exhaust emissions from light-duty vehicles using different fuel alternatives in sub-freezing conditions. Part. Fibre Toxicol. 2020, 17, 17. [Google Scholar] [CrossRef] [PubMed]
- Mei, H.; Wang, L.; Wang, M.; Zhu, R.; Wang, Y.; Li, Y.; Zhang, R.; Wang, B.; Bao, X. Characterization of Exhaust CO, HC and NOx Emissions from Light-Duty Vehicles under Real Driving Conditions. J. Atmos. 2021, 12, 1125. [Google Scholar] [CrossRef]
- Šarkan, B.; Loman, M.; Synák, F.; Skrúcaný, T.; Hanzl, J. Emissions Production by Exhaust Gases of a Road Vehicle’s Starting Depending on a Road Gradient. J. Sens. 2022, 22, 9896. [Google Scholar] [CrossRef] [PubMed]
- Kuppili, S.K.; Alshetty, V.D.; Diya, M.; Nagendra, S.S.; Ramadurai, G.; Ramesh, A.; Gulia, S.; Namdeo, A.; Maji, K.; Bell, M.; et al. Characteristics of real-world gaseous exhaust emissions from cars in heterogeneous traffic conditions. J. Transp. Part D Environ. 2021, 95, 43–47. [Google Scholar] [CrossRef]
- Han, S. A Study on the Emissions and Chemical Characteristics of Resuspended Dust from Paved Roads in Urban Areas. Ph.D. Thesis, Inha University, Incheon, Republic of Korea, 2012; pp. 100–150. Available online: https://m.riss.kr/search/detail/ssoSkipDetailView.do?p_mat_type=be54d9b8bc7cdb09&control_no=d41e3a8b0cd6ef18ffe0bdc3ef48d419 (accessed on 7 November 2023).
- USA Environmental Protection Agency. Emission Factor Documentation for AP-42, Section 13.2.1 Paved Roads; EPA: Washington, DC, USA, 1993; Appendixs C1 and C2.
- Askariyeh, M.H.; Zietsman, J.; Autenrieth, R. Traffic contribution to PM2.5 increment in the near-road environment. J. Atmos. 2020, 224, 117113. [Google Scholar] [CrossRef]
- Jung, Y.W.; Han, S.H.; Won, K.H.; Jang, K.W.; Hong, J.H. Present status of emission estimation methods of resuspended dusts from paved roads. J. Korean Environ. 2006, 28, 1126–1132. [Google Scholar]
- Inoka, P.E.; Litton, C.D. Quantification of Optical and Physical Properties of Combustion-Generated Carbonaceous Aerosols (<pm2.5) Using Analytical and Microscopic Techniques. J. Fire Technol. 2015, 51, 247–269. [Google Scholar]
- Hong, S.; Yoo, H.; Cho, J.; Yeon, G.; Kim, I. Characteristics of Resuspended Road Dust with Traffic and Atmospheric Environment in South Korea. Atmosphere 2022, 13, 1215. [Google Scholar] [CrossRef]
- Lee, H.; Jung, H. A study on the improvement plan of speed limit and road service quality according to the implementation of safety speed 5030 policy. KSCE J. Civ. Environ. Eng. Res. 2021, 41, 405–416. [Google Scholar]
- Lee, Y.; Cho, H.; Park, J.; Jung, Y. A Study on the Automobile Emission Calculation Methodology Considering the Individual Driving Behavior of Vehicles; The Seoul Institute: Seoul, Republic of Korea, 2004; pp. 43–59. [Google Scholar]
- Breault, R.F.; Smith, K.P.; Sorenson, J.R. Residential Street-Dirt Accumulation Rates and Chemical Composition, and Removal Efficiencies by Mechanical- and Vacuum-Type Sweepers; New Bedford, Massachusetts, 2003–2004; US Department of the Interior, US Geological Survey: Reston, VA, USA, 2005; pp. 10–15. [Google Scholar]
Disclaimer/Publisher’s Note: The statements, opinions and data contained in all publications are solely those of the individual author(s) and contributor(s) and not of MDPI and/or the editor(s). MDPI and/or the editor(s) disclaim responsibility for any injury to people or property resulting from any ideas, methods, instructions or products referred to in the content. |
© 2023 by the authors. Licensee MDPI, Basel, Switzerland. This article is an open access article distributed under the terms and conditions of the Creative Commons Attribution (CC BY) license (https://creativecommons.org/licenses/by/4.0/).
