Article

Evaluating the Impact of COVID-19 on the Carbon Footprint of Two Research Projects: A Comparative Analysis

1
Laboratory of Atmospheric Physics, School of Physics, Aristotle University of Thessaloniki, 54124 Thessaloniki, Greece
2
Research Centre for Atmospheric Physics and Climatology, Academy of Athens, 10680 Athens, Greece
3
School of Chemical Engineering, National Technical University of Athens, 15780 Athens, Greece
4
AXON Enviro-Group Ltd., 11257 Athens, Greece
*
Author to whom correspondence should be addressed.
Atmosphere 2023, 14(9), 1365; https://doi.org/10.3390/atmos14091365
Submission received: 3 July 2023 / Revised: 17 August 2023 / Accepted: 29 August 2023 / Published: 30 August 2023

Abstract

:
The objective of this study is to investigate the impact of the COVID-19 pandemic on the carbon footprint (CF) of two research projects. These projects were initiated prior to the onset of the pandemic and subsequently concluded afterward, serving as the Base Case (BC) for analysis. Furthermore, the study seeks to explore the potential applicability of measures implemented during the period of lockdown for future mitigation of CF. The applied methodology, which adheres to the guidelines provided by the GHG Protocol and the Department for Environment Food & Rural Affairs (DEFRA) emission factors, is utilized to examine the CF of the projects under two different scenarios. The first scenario assumes that the projects were implemented without the pandemic, while the second scenario considers that the projects were conducted entirely during the pandemic. Among the two projects under review, one emphasizes innovation and entails a collaboration between academia and business. This project is supported by a limited number of employees, exclusively from domestic partners. The other project is more oriented toward policy-making and involves a larger group of partners from Greece and Italy. Its main priority is dissemination. Carbon dioxide (CO2) emissions associated with project activities mainly stem from electricity use, material consumption, project-hosted events, project participation in events, employees commuting, and equipment. Results show that in the first scenario, the projects exhibit a more than 40% increase in CO2 emissions compared to the BC, while in the second scenario, the implementation of measures such as teleworking, virtual participation in events, and digitization of bureaucratic processes lead to a reduction in emissions by at least 20%. The study suggests that adopting such measures after the COVID-19 pandemic could significantly decrease greenhouse gas emissions.

1. Introduction

The carbon footprint (CF), which represents the greenhouse gas (GHG) emissions resulting from individual, organizational, or community activities, assumes a crucial role in contributing to climate change. Metric tons of Carbon Dioxide Equivalent (tCO2eq) is the standard unit of CF. The European Union (EU) has made commendable progress in achieving its 2020 climate and energy targets, including a 20% reduction in GHG emissions, an increase in renewable energy utilization, and enhanced energy efficiency [1]. However, it is important to note that only 21 EU Member States have successfully attained their respective national target [1,2,3]. Urgent and decisive action is imperative to mitigate the severe risks associated with global warming, stemming from anthropogenic GHG emissions driven by economic and population growth [4,5,6]. While the COVID-19 pandemic inadvertently led to a temporary reduction in GHG emissions [7,8,9,10], the Intergovernmental Panel on Climate Change (IPCC) emphasizes the necessity for a 45% decline in global carbon dioxide (CO2) emissions by 2030, ultimately reaching a net-zero emissions state by 2050 [11]. In this context, the academic community undertakes a significant responsibility in generating knowledge and contributing to the ongoing discourse surrounding climate change [12]. Furthermore, there is a significant difference between the carbon footprints of scientists and the targeted emission levels. These levels range from 1.4 to 37 tCO2eq per scientist or employee [13,14]. This discrepancy emphasizes the urgent need for substantial reductions in GHG emissions. These reductions are necessary to align with the objectives stated in the Paris Agreement, which aims to limit the average global temperature increase to 1.5 °C [11].
The COVID-19 pandemic, declared by the World Health Organization on 11 March 2020, has had a profound impact on global health, resulting in numerous infections and fatalities. In response, governments around the world implemented strict measures to control the spread of the virus, including the implementation of the first lockdown in Europe on 21 February 2020. These unprecedented circumstances have caused significant disruptions in work commuting [15,16] and education systems [15,16,17,18,19], prompting remote work [20,21,22], virtual learning and social distancing guidelines. This shift has resulted in reduced daily commuting to workplaces [8], alleviating traffic congestion and associated carbon emissions [23]. Additionally, research projects have faced disruptions, including limitations on fieldwork, international collaborations, and resource accessibility [23,24]. Scientific conferences and seminars have shifted to virtual formats, affecting networking and idea exchange [25,26].
Significant research efforts have been undertaken to quantify the CF in various domains. Notably, substantial attention has been directed towards examining the carbon emissions attributable to air travel, acknowledging its considerable influence on the overall CF [17,27,28,29,30,31,32]. In the realm of academia, while the number of research studies on the subject is still relatively limited, universities have become a central focus of investigation. As a result, there is a growing need for comprehensive assessments to quantify the carbon emissions generated by various activities within these institutions [4,12,13,33,34,35,36,37]. Likewise, conferences and events have been subjected to meticulous examination to explore the CF generated by these gatherings and to identify strategies for mitigating their environmental impact [26,29,38,39,40,41]. Nonetheless, given the ongoing COVID-19 pandemic and its global ramifications, there is an urgency to delve into the distinctive CF implications arising from the widespread adoption of remote work practices.
Scientific studies on the CF in the context of the COVID-19 pandemic are limited and primarily focused on the adoption of teleworking as a strategy to reduce daily commuting to and from workplaces, both before and during lockdown periods [23,31,42]. Additionally, there are studies that discuss post-pandemic scenarios aimed at reducing CF in universities and educational institutions [9,43]. Furthermore, some studies focus on comparing the virtual and physical formats of conferences and events [26,38]. Consequently, there is a lack of comprehensive studies at the European level that compare scientific projects conducted before and after the COVID-19 period. This highlights the imperative need for further investigation in this domain to bridge the existing research gap.
The main objective of this study is to examine the influence of the COVID-19 pandemic on the CF of two research projects, namely KASTOM (Innovative Air Quality Monitoring and Prediction System) and LIFE ASTI (Implementation of a Prediction System for the Urban Heat Island Effect). The methodology employed in this study builds upon previous research conducted by Liora et al. [44], which presented and evaluated a comprehensive approach for estimating the CF of research project activities. This approach incorporates well-known and established methodologies, emission factors, and statistical data. The research projects commenced prior to the onset of the COVID-19 pandemic, lasting from 2018 to 2022, and were effectively concluded subsequent to the cessation of the pandemic, thereby serving as the Base Case (BC) for analysis. Moreover, the study aims to assess the CF of these projects under two specific scenarios: one assuming their execution without the influence of the pandemic and the other considering their complete implementation during the pandemic period. Through meticulous examination, this research will encompass a thorough analysis of various contributing factors, such as heating, electricity consumption, material utilization, project-hosted events, participation in external events, employee commuting, and equipment usage. By undertaking this comprehensive investigation, the study endeavors to provide a rigorous assessment of the environmental impact of these research projects within different scenarios, ultimately enhancing our understanding of their CF implications.

2. Materials and Methods

An integrated methodology was employed to estimate the emissions originating from various sources associated with project activities. These sources encompassed fuels for heating, electricity consumption, usage of freshwater bodies, transportation for work commuting (two-way travels), material utilization, printable deliverables, equipment, project-hosted events, and participation in external events. The methodology and equations used in this study drew upon the research conducted by Liora et al. [44], which provides a comprehensive framework for calculating CF by considering activity data, statistics, and emissions factors for each source. The methodology can be easily applied to scientific projects by using the WECAREMED online tool [45], which was developed as part of the Interreg-MED project [46]. The adopted methodology was guided by the principles outlined in the GHG Protocol Guidance [47] and relied on the emissions factors provided by the UK Department for Environmental, Food and Rural Affairs (DEFRA), which incorporated the most up-to-date greenhouse gas conversion factors for the year 2021 [48]. Notably, the current methodology aimed to ensure that all activities associated with each emissions source were accounted for in the CF estimations, aligning with the procedures of Life Cycle Assessment (LCA).

2.1. Methodological Implementation and Scenarios

The methodology was consistently applied across the research projects, ensuring a standardized and meticulous approach to the collection and analysis of data. Within the framework of the BC, the operational conditions were categorized into two distinct sets, reflecting different periods and contextual circumstances. In the first set of conditions, which pertains to the period preceding the emergence of the COVID-19 pandemic, specific practices prevailed:
  • All employees adhered to regular commuting routines, traveling to their designated workplaces;
  • Bureaucratic procedures mandated the physical printing of essential documents, encompassing deliverables and evaluation reports;
  • Participation in conferences and events necessitated physical presence, requiring in-person attendance.
In the second set of conditions, corresponding to the period during the pandemic and subsequent easing of lockdown measures, adaptations were implemented to accommodate the evolving circumstances:
  • Mandatory teleworking measures were introduced, ensuring that 50% of the project partner’s employees worked remotely in compliance with public health guidelines. The assessment of the impact of telecommuting on electricity consumption considered the usage of personal computers or laptops equipped with internet connectivity by the employees;
  • Bureaucratic processes were transitioned to electronic formats, eliminating the need for physical paperwork and facilitating digital workflows;
  • Conferences and events underwent a transformative shift, transitioning to virtual or hybrid formats, thereby facilitating virtual participation and engagement.
Furthermore, the methodology was applied to two scenarios for the purpose of analysis and estimation, supplementing the BC. In the first scenario, the projects were considered to have been implemented throughout their duration as if the COVID-19 pandemic had not occurred, thereby reflecting the prevailing conditions of the pre-pandemic period. This scenario allows for a comprehensive evaluation of the projects’ environmental impact under normal operating circumstances. In the second scenario, the projects operated under post-COVID-19 conditions, encompassing the adaptations and changes necessitated by the pandemic situation. This scenario facilitates an assessment of the projects’ environmental performance and resilience in response to the challenges and adjustments imposed by the pandemic.

2.2. Scientific Project Descriptions: KASTOM and LIFE ASTI

The initial project under consideration, denoted as KASTOM [49], constitutes a research-centric initiative primarily dedicated to the facilitation of partnerships with businesses. These businesses specialize in delivering superior and dependable solutions in the realms of information technology, communications, and geoinformatics. These solutions are grounded in principles of open standards, open-source software, and open data. Furthermore, these entities actively contribute to societal enhancement and the dissemination of knowledge. They hold in high regard their involvement in the computation of CF for projects, deeming it a significant undertaking. The project commenced in July 2018 and reached its completion at the end of 2022. The consortium involved in this project comprises solely four partners from Greece, and the project’s workforce comprises 37 part-time employees, with nine of them being external experts, as indicated in Table 1. Notably, the number of two-way work commutes associated with this project is considerable. In terms of events, as shown in Table 2, the project has organized a total of three, one of which was held in a hybrid format, combining in-person and virtual elements. Furthermore, the project has actively participated in external events, with only two instances of virtual participation. The equipment procurement for this project primarily involved the acquisition of computers, laptops, and a printer. The energy profile of the project is characterized by fuel and electricity consumption, reflecting the significant demand for heating systems. Additionally, the number of deliverables, the use of freshwater bodies and materials correlate with the scale of the project, reflecting the involvement of employees and project partners.
In contradistinction, the LIFE ASTI project [50] places notable emphasis on external outreach and endeavors pertaining to policy formulation. As a result, public entities, vested stakeholders, and pertinent services promptly implement the scientific findings and methodologies investigated within this context. This proactive integration serves to enhance the daily existence of residents while concurrently elevating their consciousness regarding matters concerning the environment and health. Its duration spanned from August 2018 to August 2022, and it boasts a more extensive team consisting of four Greek and two Italian partners, comprising 71 part-time employees, doubling the workforce of the KASTOM project. This increase is also evident in the person and months allocated to the project. Within the LIFE ASTI project, numerous events were organized, including five events that were conducted in hybrid or virtual formats. The substantial participation in external events, totaling 20 instances (6 virtual), highlights the project’s strong commitment to engaging with external stakeholders. The number of trips associated with this project is notably high, in line with the larger workforce and broader scope of activities involved. Likewise, there exists a direct correlation between the consumption of fuels, electricity, freshwater resources, materials, and the number of deliverables generated by the project, all of which exhibit a commensurate elevation in consonance with the expanded magnitude of the project. The equipment procured for the LIFE ASTI project includes PCs, laptops, and various hardware components supporting its research and policy-making objectives.

3. Results

Table 3 presents a comprehensive analysis of the carbon footprints, measured in tCO2e, for the KASTOM and LIFE ASTI projects throughout the entire duration of the projects in the BC. The largest contributor to these footprints is electricity consumption, accounting for approximately 41.9% for KASTOM and 43.1% for LIFE ASTI. Materials and transportation significantly influence both projects in shaping their carbon footprints. Materials contribute around 22% to KASTOM’s CF and approximately 22.3% to LIFE ASTI’s. Similarly, transportation was 5.4% and 7.2%, respectively. Further analysis of the individual emission sources highlights the substantial contribution of project-hosted events, ranging from 12.2% to 13.9% for the two projects. This is followed by the impact of fuels and participation in external events. Finally, LIFE ASTI has a significantly higher total CF, reaching 121.79 tCO2e, compared to KASTOM’s total CF of 63.77 tCO2e.
Nevertheless, notwithstanding the higher CF presented by the LIFE ASTI project in comparison to KASTOM, after considering the conversion of part-time employees to full-time, the respective emissions amount to 4.20 and 4.69 tCO2e per full-time employee. Therefore, these magnitudes can be deemed comparable. However, the annual CF per full-time employee is 14.17 tCO2e for KASTOM and 30.45 tCO2e for LIFE ASTI. Numerous factors contribute to this observed disparity, with the variation in the number of employees in each project standing out as a prominent aspect. Given that KASTOM maintains a smaller workforce compared to LIFE ASTI, it is reasonable to anticipate a correspondingly lower total CF for KASTOM. Moreover, the allocation of emissions across different sources assumes significance. Specifically, LIFE ASTI may manifest higher emissions in specific categories such as electricity consumption, transportation, materials, and equipment. The distinctive nature and scope of the projects further contribute to the emission disparities, as LIFE ASTI prioritizes external outreach and policy-making, potentially involving activities that entail higher emissions. Although project design, operational practices, and technological choices also contribute to carbon emissions, the variation in the number of employees emerges as a significant determinant in explaining the discrepancy in tCO2e per full-time employee between the two projects.
Using the carbon footprints expressed in tCO2e per full-time employee as a reference, an analysis of the KASTOM and LIFE ASTI projects reveals values averaging 4.44 tCO2e per full-time employee. These findings can be compared to existing literature, where similar calculations have been conducted. For instance, in the REMEDIO research project, the CF was estimated at 6.7 tCO2e per employee [44]. In the context of university departments, studies have shown that laboratory members in France have an average carbon footprint of 3.6 tCO2e [12], while at the universities of Bologna [13] and Castilla [35], the respective values are 1.4 and 0.74 tCO2e per student per year. Similarly, within a research group at the University of Lille, the carbon footprint per employee was found to be 0.5 tCO2e per year [23].
Considering events, the literature suggests that online events have a CF ranging from 0.58 to 0.78 tCO2e [26,38], consistent with the average calculated value of 0.83 tCO2e. In terms of in situ events per participant, the values reported range from 0.036 to 0.071 tCO2e for the KASTOM and LIFE ASTI projects, and the respective surveys yielded figures of 0.042 and 0.035 tCO2e [51,52]. Moreover, virtual events have been associated with a CF of 0.02 tCO2e per participant in a previous study [53], which closely aligns with the calculated value of 0.016 tCO2e in the present analysis.

4. Discussion

Table 4 presents an analysis of the impact of two distinct scenarios on the CF of both the KASTOM and LIFE ASTI projects. The initial scenario encompasses pre-COVID-19 conditions, while the subsequent scenario characterizes the post-COVID-19 era. Alterations in CF attributed to each emission source are prominently elucidated, delineating the emissions that conspicuously contribute to the overall fluctuations. For both projects, the before COVID-19 scenario is marked by a noteworthy escalation in CF across all emission sources in contrast to the BC, in contradistinction to the second scenario that distinctly illustrates a substantial abatement in CF.
With greater precision, Figure 1 portrays the before COVID-19 scenario by delineating the presentation of percentage increments in CF values relative to the BC. In the after COVID-19 context, conversely, the illustration encompasses the display of percentage decrements in values for the KASTOM project.
In the before COVID-19 scenario, there is a significant increase in the CF for all emission sources compared to the BC. Fuels, electricity, freshwater bodies, and materials show a notable increase of 53%, which is proportional to the number of personnel working on the project. The second-largest increase is observed in transportation, with a doubling of commuting emissions. The largest increase of 177.8% occurs in deliverables, primarily due to the continued use of printouts for documents and reports. Overall, the total CF in the before COVID-19 scenario increases by 44.06%, resulting in a CF of 6.76 tCO2e per full-time employee, compared to the 4.69 tCO2e per full-time employee in the BC.
On the contrary, the after COVID-19 scenario illustrates a substantial reduction in CF across various emission categories. The presence of half the number of employees, coupled with the digitization of bureaucratic processes and the utilization of virtual conferences and meetings, contribute to reductions in emission sources ranging from 10.5% to 78.1%. However, emissions from transportation and project-hosted events do not exhibit significant reductions due to their relatively smaller contribution to the overall CF and the limited impact of the proposed practices on these specific sources, which is amplified by the project’s infrequent occurrence of events. Overall, the after COVID-19 scenario yields a noteworthy 22.12% reduction in CF, resulting in a CF of 3.66 tCO2e per full-time employee.
Figure 2 illustrates the percentage differences in CF in the two scenarios for Project LIFE ASTI. The before COVID-19 scenario reveals a significant increase in CF across all emission sources, similar to the findings of the KASTOM project. Particularly noteworthy are the increases observed in transportation (70.25%), deliverables (252.15%), and the project’s participation in external events (145.5%). These increases can be attributed to various factors, including workforce size, the heightened generation of project evaluation reports and circulating documents, and frequent engagement in conferences, particularly those conducted on an international scale. In total, the before COVID-19 scenario yields a significant 42.40% augmentation in the collective CF, culminating in a carbon emission magnitude of 5.98 tCO2e per full-time employee, in contrast to the BC measurement of 4.20 tCO2e per full-time employee.
In contrast, the after COVID-19 scenario demonstrates significant reductions in CF, primarily driven by the project’s hosted events (33.8%) and deliverables (72.9%). Given the extroverted nature of LIFE ASTI as a prominent project, the type of events organized and the active participation of employees play pivotal roles in these reductions. Similar to the KASTOM project, the after COVID-19 scenario highlights a remarkable 24.79% reduction in CF, resulting in a CF of 3.16 tCO2e per full-time employee. These findings underscore the effectiveness of sustainable practices in event organization and the management of deliverables.
In summary, the findings obtained from projects KASTOM and LIFE ASTI highlight the impact of different scenarios on their respective carbon footprints. The before COVID-19 scenario shows significant increases in CF across various emission sources due to factors such as workforce size, increased generation of project evaluation reports and documents, and frequent participation in conferences. In contrast, the after COVID-19 scenario demonstrates substantial reductions in CF. These reductions are attributed to the adoption of sustainable practices such as digitization and virtual meetings. The findings emphasize the effectiveness of sustainable measures in mitigating CF, particularly in the organization of events and management of deliverables.
To further enhance the carbon footprints of the two projects beyond the improved conditions presented in the after COVID-19 scenario, it is crucial to focus on reducing the contributions of electricity and materials. An effective approach to conserving electricity in the office entails the replacement of conventional electric lamps with more advanced technologies such as LED lamps, which offer higher energy efficiency. Exploring the benefits of individual manual lighting controls and implementing individual switches for light controls can further optimize energy consumption [54]. Additionally, maximizing the use of natural daylight can significantly reduce the need for artificial lighting, potentially saving up to 78% of lighting energy [55]. It is also essential to gather data on electricity usage for different electrical devices through power management systems, enabling informed decision-making and identifying areas for improvement [56]. Implementing best practices in universities, such as technology-based interventions, including energy-efficient equipment and systems, and promoting the use of renewable resources (solar, geothermal) for energy generation can yield substantial energy savings [57,58,59]. Encouraging individual energy-saving behavior, such as turning off unused equipment and adopting energy-conscious practices, is another effective strategy [57]. In terms of materials, fostering a culture of reuse and recycling is crucial, as approximately 70% of an office’s materials are recyclable. Prioritizing prompt reuse of materials within the workspace and implementing comprehensive recycling programs can significantly minimize waste generation and reduce the environmental impact associated with producing new materials [59,60,61]. By diligently implementing these strategies, the carbon footprints of the projects can be further reduced, contributing to a more sustainable workplace environment.

5. Conclusions

This study undertook a comprehensive analysis of the influence exerted by the COVID-19 pandemic on the CF of two distinct research projects, namely KASTOM and LIFE ASTI, across divergent temporal paradigms—pre- and post-pandemic. The ensuing summation encapsulates the principal findings gleaned from this meticulous inquiry:
  • Comparative CF Analysis of KASTOM and LIFE ASTI: The evaluation evinced a conspicuous divergence in CF manifestation between the LIFE ASTI and KASTOM projects during the BC. The LIFE ASTI project, indicative of an elevated CF in comparison to KASTOM, demonstrated a notable dependency on electricity consumption, which emerged as a predominant factor contributing to the CF of both projects. This divergence, attributed to the magnitude of personnel engagement and the pronounced proclivity of the LIFE ASTI project towards external outreach and policy-oriented objectives, underscores the multidimensional determinants shaping CF dynamics;
  • Assessment of CF per full-time employee: An aspect under investigation concerns the examination of CF per full-time employee, revealing the emergence of a distinct trajectory. The LIFE ASTI assumed a diminished CF in relation to KASTOM, emblematic of collective moderation in emissions per employee within the former. This manifestation underscores the requisite consideration of nuanced contextual variables whilst delineating CF metrics amidst varying project configurations;
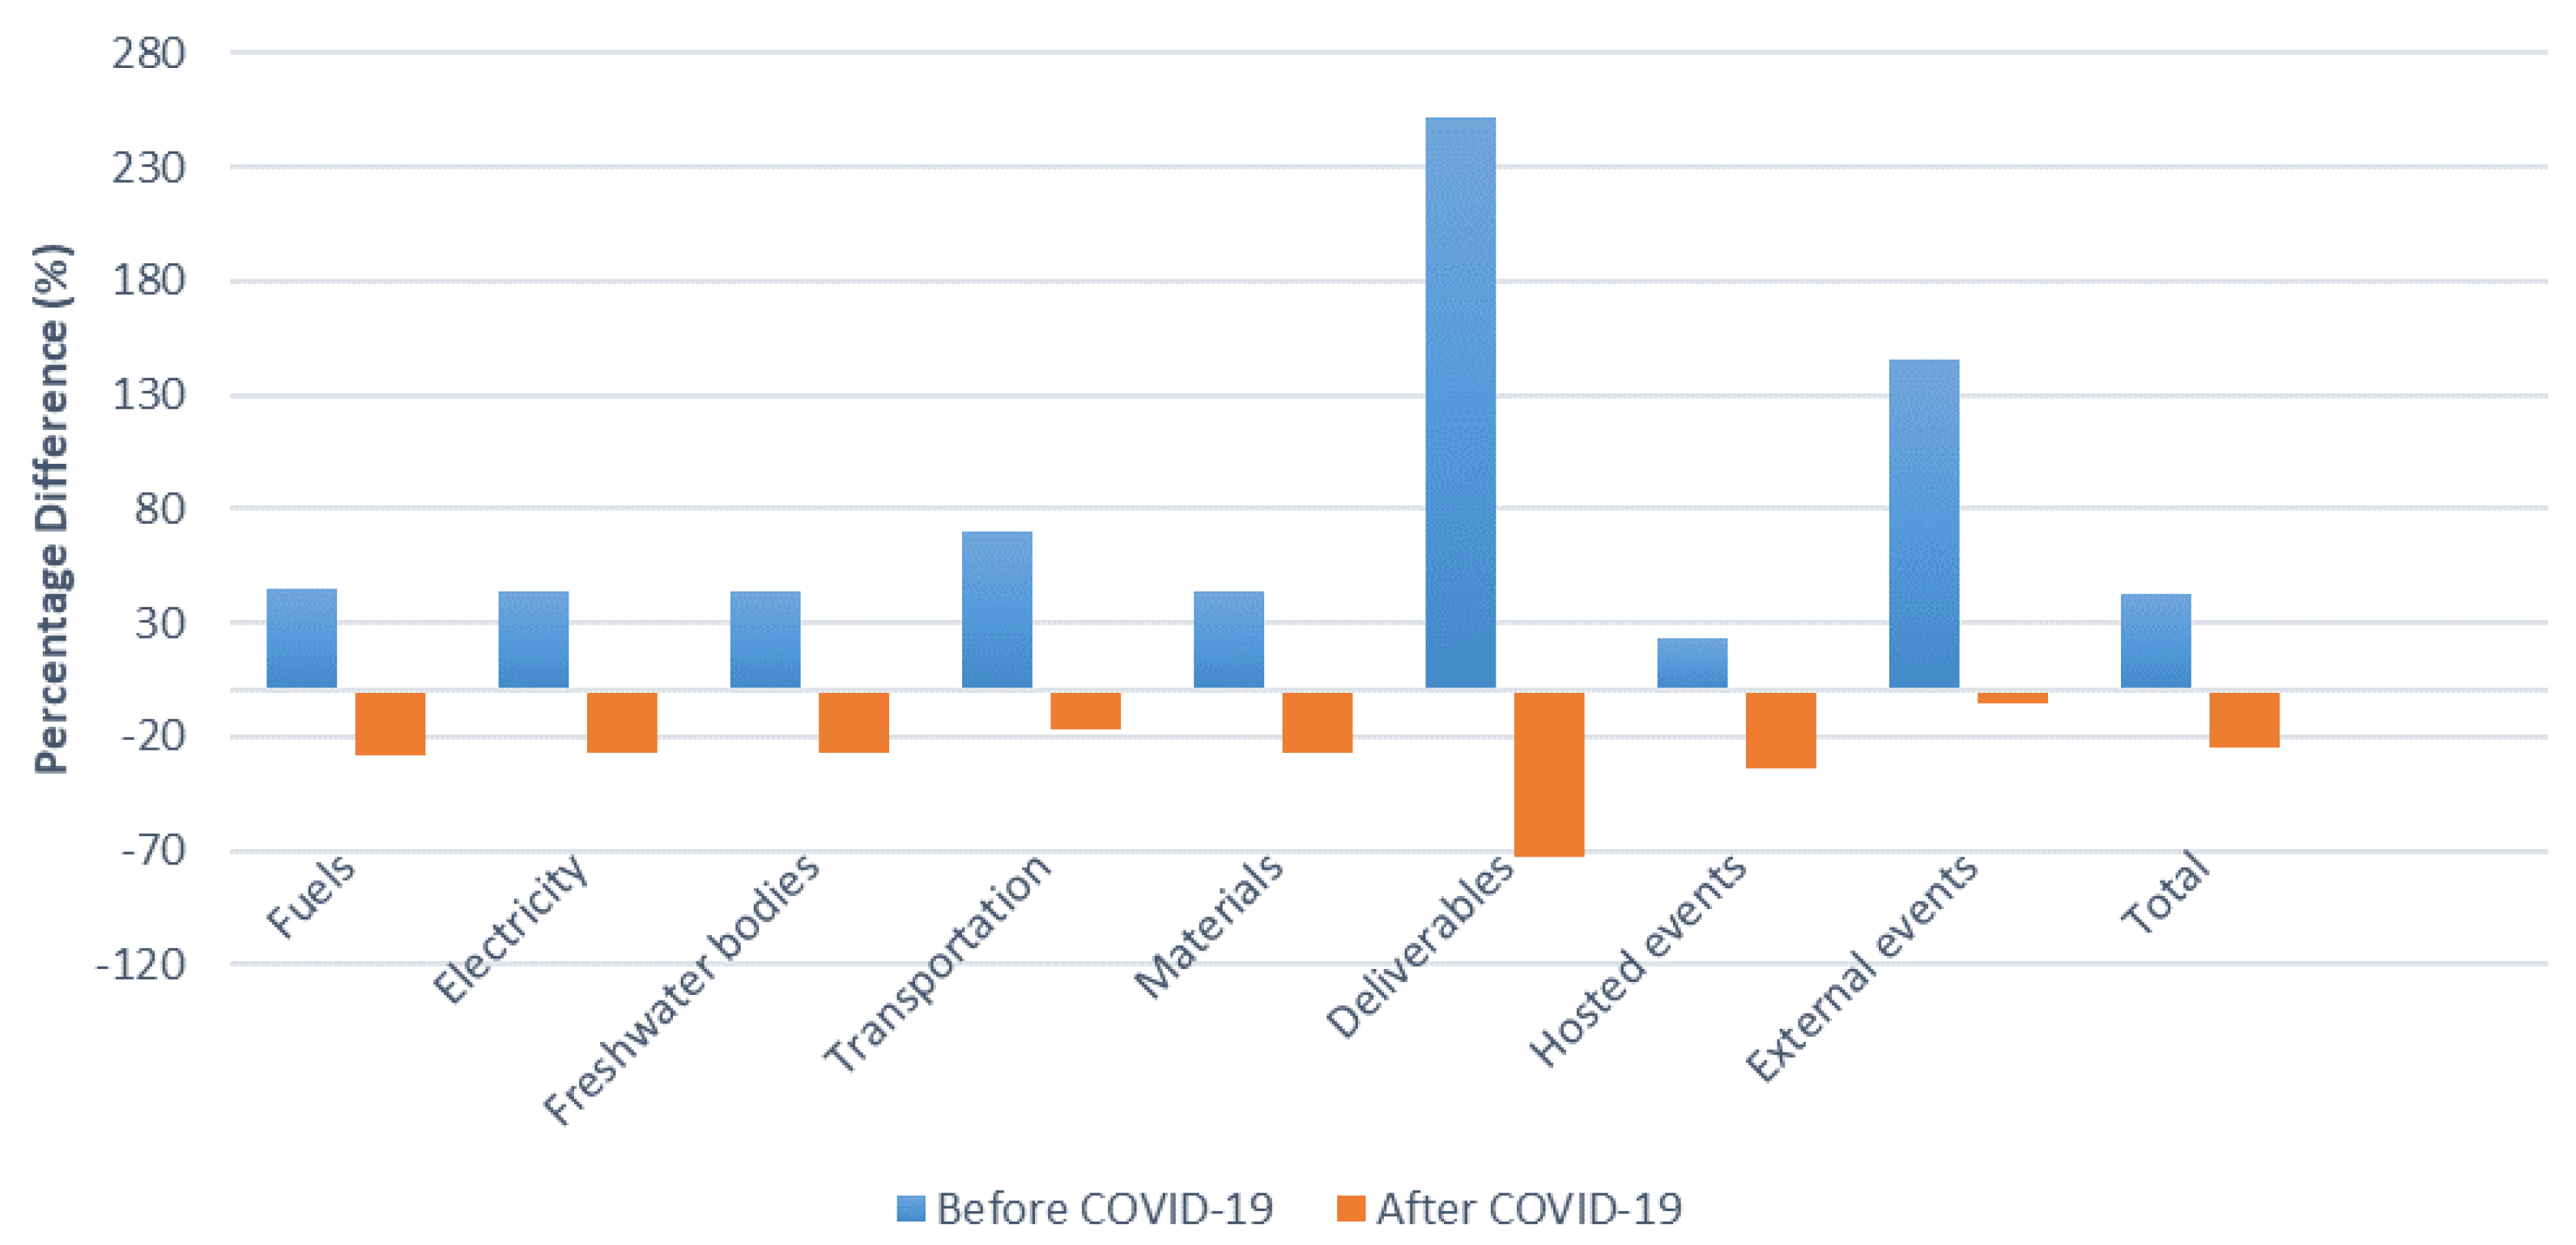
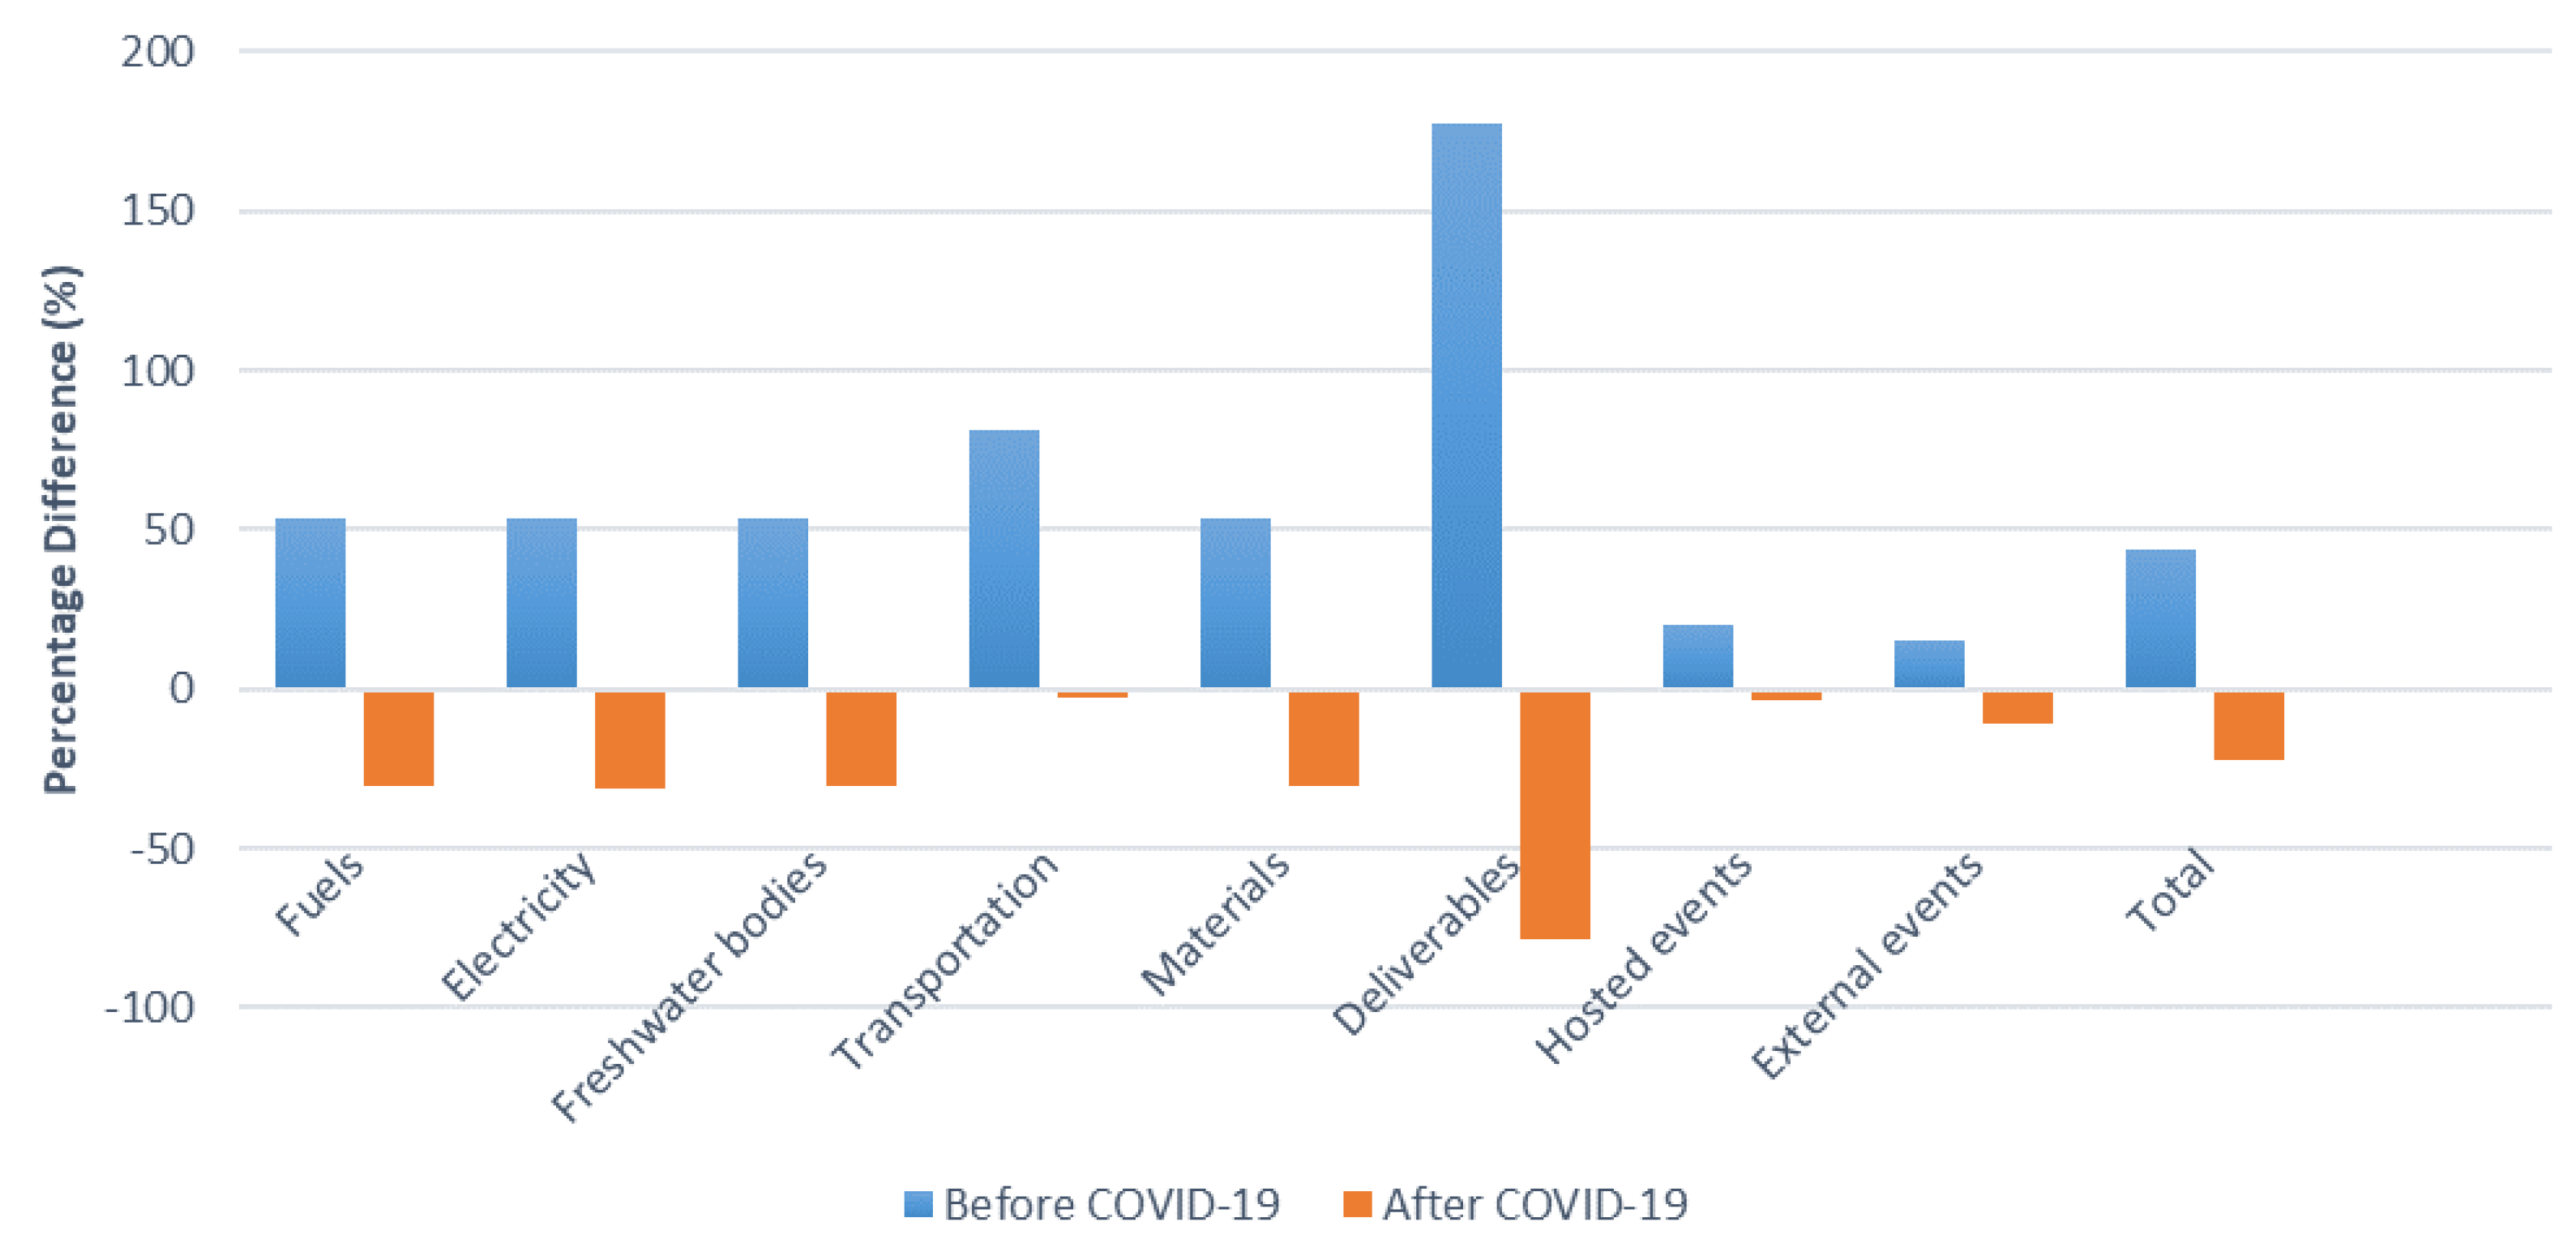
  • Differential Impact scenarios on CF: The study further probed discrete scenarios precipitating CF variations. Before the pandemic, the exigencies of commuting, physical documentation, and in-person participation in events manifested as prominent CF instigators across both projects. Conversely, the after pandemic period experienced a profound and fundamental shift in paradigm, characterized by telecommuting, digitization of administrative processes, and the emergence of virtual/hybrid event modalities. The confluence of these sustainable modalities, underpinned by streamlined operational paradigms and virtual conferencing modalities, yielded substantial CF reductions.
In a collective synthesis, the amalgamation of these empirical insights underscores a compelling proposition: that post-pandemic adaptations, encompassing teleworking and digitization, wield the potential to effect substantial reductions in greenhouse gas emissions. Positioned within a broader framework, this study emphasizes the essential imperative of incorporating CF assessments across business endeavors. Furthermore, it delineates a promising trajectory by advocating the integration of sustainable practices to effectively mitigate the ecological footprints inherent to such undertakings.

Author Contributions

Conceptualization, S.P., N.L. and A.P. (Anastasia Poupkou); methodology, S.P. and N.L.; investigation, S.P. and N.L.; resources, S.P., D.P. and S.C.; writing—original draft preparation, S.P.; writing—review and editing, S.P., N.L., D.P., S.C., A.P. (Anastasia Poupkou), I.S., A.P. (Athena Progiou) and D.M.; supervision, A.P. (Anastasia Poupkou) and D.M.; project administration, D.M. All authors have read and agreed to the published version of the manuscript.

Funding

This research received no external funding.

Institutional Review Board Statement

Not applicable.

Informed Consent Statement

Not applicable.

Data Availability Statement

Not applicable.

Acknowledgments

This research has been performed in the framework of the Interreg-Med project “ToWards thE CARbon offsEtting in MED” (WECAREMED). Daphne Parliari acknowledges the support provided by Greece and the European Union (European Social Fund-ESF) through the Operational Programme «Human Resources Development, Education and Lifelong Learning» in the context of the Act “Enhancing Human Resources Research Potential by undertaking a Doctoral Research” Sub-action 2: «IKY Scholarship Programme for PhD candidates in the Greek Universities».

Conflicts of Interest

The authors declare no conflict of interest.

References

  1. EEA Report ‘Trends and Projections in Europe 2021’ with Input from EnergyVille/VITO|EnergyVille. Available online: https://www.energyville.be/en/news-events/eea-report-trends-and-projections-europe-2021-input-energyvillevito (accessed on 7 June 2023).
  2. Liobikienė, G.; Butkus, M. The European Union Possibilities to Achieve Targets of Europe 2020 and Paris Agreement Climate Policy. Renew. Energy 2017, 106, 298–309. [Google Scholar] [CrossRef]
  3. Graichen, J.; Gores, S.; Schmid, C.; Mandl, N. Trends and Projections under the Effort Sharing Legislation Overview on Developments and Drivers; Climate Change Mitigation and Energy (ETC/CME): Boeretang, Belgium, 2021. [Google Scholar]
  4. Aujoux, C.; Kotera, K.; Blanchard, O. Estimating the Carbon Footprint of the GRAND Project, a Multi-Decade Astrophysics Experiment. Astropart. Phys. 2021, 131, 102587. [Google Scholar] [CrossRef]
  5. Wennersten, R.; Sun, Q.; Li, H. The Future Potential for Carbon Capture and Storage in Climate Change Mitigation–an Overview from Perspectives of Technology, Economy and Risk. J. Clean. Prod. 2015, 103, 724–736. [Google Scholar] [CrossRef]
  6. Kyriakopoulos, G.L.; Sebos, I. Enhancing Climate Neutrality and Resilience through Coordinated Climate Action: Review of the Synergies between Mitigation and Adaptation Actions. Climate 2023, 11, 105. [Google Scholar] [CrossRef]
  7. Malik, A.; Sinha, S.; Goel, S. The “Screen”ing of You and Me: Effects of COVID-19 on Counterproductive Work Behaviors. IEEE Eng. Manag. Rev. 2020, 48, 37–43. [Google Scholar] [CrossRef]
  8. Nikolaeva, A.; Lin, Y.T.; Nello-Deakin, S.; Rubin, O.; von Schönfeld, K.C. Living without Commuting: Experiences of a Less Mobile Life under COVID-19. Mobilities 2022, 18, 1–20. [Google Scholar] [CrossRef]
  9. Filimonau, V.; Archer, D.; Bellamy, L.; Smith, N.; Wintrip, R. The Carbon Footprint of a UK University during the COVID-19 Lockdown. Sci. Total Environ. 2021, 756, 143964. [Google Scholar] [CrossRef]
  10. Progiou, A.G.; Sebos, I.; Zarogianni, A.-M.; Tsilibari, E.M.; Adamopoulos, A.D.; Varelidis, P. Impact of Covid-19 Pandemic on Air Pollution: The Case of Athens, Greece. Environ. Eng. Manag. J. 2022, 21, 879–889. [Google Scholar] [CrossRef]
  11. Masson-Delmotte, V.; Zhai, P.; Pörtner, H.O. Summary for Policymakers. In Global Warming of 1.5 °C IPCC Special Report on Impacts of Global Warming of 1.5 °C above Pre-industrial Levels in Context of Strengthening Response to Climate Change, Sustainable Development, and Efforts to Eradicate Poverty; Cambridge University Press: Cambridge, UK, 2018; pp. 1–24. [Google Scholar] [CrossRef]
  12. Mariette, J.; Blanchard, O.; Berné, O.; Aumont, O.; Carrey, J.; Ligozat, A.; Lellouch, E.; Roche, P.-E.; Guennebaud, G.; Thanwerdas, J.; et al. An Open-Source Tool to Assess the Carbon Footprint of Research. Environ. Res. Infrastruct. Sustain. 2022, 2, 035008. [Google Scholar] [CrossRef]
  13. Battistini, R.; Passarini, F.; Marrollo, R.; Lantieri, C.; Simone, A.; Vignali, V. How to Assess the Carbon Footprint of a Large University? The Case Study of University of Bologna’s Multicampus Organization. Energies 2022, 16, 166. [Google Scholar] [CrossRef]
  14. Stevens, A.R.H.; Bellstedt, S.; Elahi, P.J.; Murphy, M.T. The Imperative to Reduce Carbon Emissions in Astronomy. Nat. Astron. 2020, 4, 843–851. [Google Scholar] [CrossRef]
  15. Kharvari, F.; Azimi, S.; Hook, A.; Court, V.; Sovacool, B.K.; Sorrell, S. A Systematic Review of the Energy and Climate Impacts of Teleworking You May Also like A Preliminary Scenario Analysis of the Impacts of Teleworking on Energy Consumption and Greenhouse Gas (GHG) Emissions Environmental Research Letters a Systematic Review of the Energy and Climate Impacts of Teleworking. Environ. Res. Lett 2020, 15, 93003. [Google Scholar] [CrossRef]
  16. Brömmelhaus, A.; Feldhaus, M.; Schlegel, M. Family, Work, and Spatial Mobility: The Influence of Commuting on the Subjective Well-Being of Couples. Appl. Res. Qual. Life 2020, 15, 865–891. [Google Scholar] [CrossRef]
  17. Wynes, S.; Donner, S.D.; Tannason, S.; Nabors, N. Academic Air Travel Has a Limited Influence on Professional Success. J. Clean. Prod. 2019, 226, 959–967. [Google Scholar] [CrossRef]
  18. Klöwer, M.; Hopkins, D.; Allen, M.; Higham, J. An Analysis of Ways to Decarbonize Conference Travel after COVID-19. Nature 2020, 583, 356–359. [Google Scholar] [CrossRef] [PubMed]
  19. Murphy, M.P.A. COVID-19 and Emergency ELearning: Consequences of the Securitization of Higher Education for Post-Pandemic Pedagogy. Contemp. Secur. Policy 2020, 41, 492–505. [Google Scholar] [CrossRef]
  20. Beck, M.J.; Hensher, D.A.; Wei, E. Slowly Coming out of COVID-19 Restrictions in Australia: Implications for Working from Home and Commuting Trips by Car and Public Transport. J. Transp. Geogr. 2020, 88, 102846. [Google Scholar] [CrossRef] [PubMed]
  21. Borkowski, P.; Jażdżewska-Gutta, M.; Szmelter-Jarosz, A. Lockdowned: Everyday Mobility Changes in Response to COVID-19. J. Transp. Geogr. 2021, 90, 102906. [Google Scholar] [CrossRef]
  22. Fatmi, M.R. COVID-19 Impact on Urban Mobility. J. Urban Manag. 2020, 9, 270–275. [Google Scholar] [CrossRef]
  23. Bouscayrol, A.; Lepoutre, A.; Castex, E. Comparisons of GHG Emissions of On-Site Working and Teleworking: Case Study of a Research Group. In Proceedings of the 2021 IEEE Vehicle Power and Propulsion Conference (VPPC), Gijon, Spain, 25–28 October 2021. [Google Scholar] [CrossRef]
  24. Lannelongue, L.; Inouye, M. Carbon Footprint Estimation for Computational Research. Nat. Rev. Methods Prim. 2023, 3, 9. [Google Scholar] [CrossRef]
  25. Obringer, R.; Rachunok, B.; Maia-Silva, D.; Arbabzadeh, M.; Nateghi, R.; Madani, K. The Overlooked Environmental Footprint of Increasing Internet Use. Resour. Conserv. Recycl. 2021, 167, 105389. [Google Scholar] [CrossRef]
  26. Jäckle, S. Reducing the Carbon Footprint of Academic Conferences by Online Participation: The Case of the 2020 Virtual European Consortium for Political Research General Conference; Cambridge University Press: Cambridge, UK, 2021. [Google Scholar] [CrossRef]
  27. Ciers, J.; Mandic, A.; Toth, L.D.; Veld, G.O. Carbon Footprint of Academic Air Travel: A Case Study in Switzerland. Sustainability 2018, 11, 80. [Google Scholar] [CrossRef]
  28. Achten, W.M.J.; Almeida, J.; Muys, B. Carbon Footprint of Science: More than Flying. Ecol. Indic. 2013, 34, 352–355. [Google Scholar] [CrossRef]
  29. Passalacqua, A. The Carbon Footprint of a Scientific Community: A Survey of the Historians of Mobility and Their Normalized yet Abundant Reliance on Air Travel. J. Transp. Hist. 2021, 42, 121–141. [Google Scholar] [CrossRef]
  30. Yakar, D.; Kwee, T.C. Carbon Footprint of the RSNA Annual Meeting. Eur. J. Radiol. 2020, 125, 108869. [Google Scholar] [CrossRef] [PubMed]
  31. Rojas, C.; Muñiz, I.; Quintana, M.; Simon, F.; Castillo, B.; de la Fuente, H.; Rivera, J.; Widener, M. Short Run “Rebound Effect” of COVID on the Transport Carbon Footprint. Cities 2022, 131, 104039. [Google Scholar] [CrossRef] [PubMed]
  32. Donahue, L.M.; Morgan, H.K.; Peterson, W.J.; Williams, J.A. The Carbon Footprint of Residency Interview Travel. J. Grad. Med. Educ. 2021, 13, 89–94. [Google Scholar] [CrossRef]
  33. Reyes-García, V.; Graf, L.; Junqueira, A.B.; Madrid, C. Decarbonizing the Academic Sector: Lessons from an International Research Project. J. Clean. Prod. 2022, 368, 133174. [Google Scholar] [CrossRef]
  34. Knödlseder, J.; Brau-Nogué, S.; Coriat, M.; Garnier, P.; Hughes, A.; Martin, P.; Tibaldo, L. Estimate of the Carbon Footprint of Astronomical Research Infrastructures. Nat. Astron. 2022, 6, 503–513. [Google Scholar] [CrossRef]
  35. Gomez, N.; Cadarso, M.-A.; Monsalve, F. Carbon Footprint of a University in a Multiregional Model: The Case of the University of Castilla-La Mancha. J. Clean. Prod. 2016, 138, 119–130. [Google Scholar] [CrossRef]
  36. Sweke, R.; Boes, P.; Ng, N.; Sparaciari, C.; Eisert, J.; Goihl, M. Transparent Reporting of Research-Related Greenhouse Gas Emissions through the Scientific CO2nduct Initiative. Commun. Phys. 2022, 5, 150. [Google Scholar] [CrossRef]
  37. Larsen, H.N.; Pettersen, J.; Solli, C.; Hertwich, E.G. Investigating the Carbon Footprint of a University-The Case of NTNU. J. Clean. Prod. 2013, 48, 39–47. [Google Scholar] [CrossRef]
  38. Burtscher, L.; Barret, D.; Borkar, A.P.; Grinberg, V.; Jahnke, K.; Kendrew, S.; Maffey, G.; Mccaughrean, M.J. The Carbon Footprint of Large Astronomy Meetings. Nat. Astron. 2020, 4, 823–825. [Google Scholar] [CrossRef]
  39. Spinellis, D.; Louridas, P. The Carbon Footprint of Conference Papers. PLoS ONE 2013, 8, e66508. [Google Scholar] [CrossRef]
  40. Desiere, S. The Carbon Footprint of Academic Conferences: Evidence from the 14th EAAE Congress in Slovenia. EuroChoices 2016, 15, 56–61. [Google Scholar] [CrossRef]
  41. Stroud, J.T.; Feeley, K.J. Responsible Academia: Optimizing Conference Locations to Minimize Greenhouse Gas Emissions. Ecography 2015, 38, 402–404. [Google Scholar] [CrossRef]
  42. Beno, M. Face-to-Display Working: Decarbonisation Potential of Not Commuting to Work before Covid-19 and during and after Lockdowns. Acad. J. Interdiscip. Stud. 2021, 10, 17–24. [Google Scholar] [CrossRef]
  43. El Geneidy, S.; Baumeister, S.; Govigli, V.M.; Orfanidou, T.; Wallius, V. The Carbon Footprint of a Knowledge Organization and Emission Scenarios for a Post-COVID-19 World. Environ. Impact Assess. Rev. 2021, 91, 106645. [Google Scholar] [CrossRef]
  44. Liora, N.; Poupkou, A.; Papadogiannaki, S.; Parliari, D.; Giama, E.; Pieretti, G.A.; Da Rugna, L.C.; Susanetti, L.; Bressan, M.; Villanueva, J.A.B.; et al. A Methodology for Carbon Footprint Estimations of Research Project Activities—A Scenarios Analysis for Reducing Carbon Footprint. Atmosphere 2023, 14, 6. [Google Scholar] [CrossRef]
  45. Wecaremedapp. Available online: https://wecaremed.netlify.app/login?redirect=/ (accessed on 12 June 2023).
  46. WECAREMED. Available online: https://wecaremed.interreg-med.eu/ (accessed on 12 June 2023).
  47. World Business Council for Sustainable Development; World Resources Institute. The Greenhouse Gas Protocol: A Corporate Accounting and Reporting Standard; World Business Council for Sustainable Development: Geneva, Switzerland; World Resources Institute: Washington, DC, USA, 2004; ISBN 978-1-56973-568-8. [Google Scholar]
  48. DEFRA—UK Department for Environmental, Food and Rural Affairs. Greenhouse Gas Reporting: Conversion Factors 2021. Available online: https://www.gov.uk/government/publications/greenhouse-gas-reporting-conversion-factors-2021 (accessed on 12 June 2023).
  49. Liora, N.; Kontos, S.; Parliari, D.; Akritidis, D.; Poupkou, A.; Papanastasiou, D.; Melas, D. “On-Line” Heating Emissions Based on WRF Meteorology— Application and Evaluation of a Modeling System over Greece. Atmosphere 2022, 13, 568. [Google Scholar] [CrossRef]
  50. Keppas, S.C.; Papadogiannaki, S.; Parliari, D.; Kontos, S.; Poupkou, A.; Tzoumaka, P.; Kelessis, A.; Zanis, P.; Casasanta, G.; De’donato, F.; et al. Future Climate Change Impact on Urban Heat Island in Two Mediterranean Cities Based on High-Resolution Regional Climate Simulations. Atmosphere 2021, 12, 884. [Google Scholar] [CrossRef]
  51. Bousema, T.; Selvaraj, P.; Djimde, A.A.; Yakar, D.; Hagedorn, B.; Pratt, A.; Barret, D.; Whitfield, K.; Cohen, J.M. Reducing the Carbon Footprint of Academic Conferences: The Example of the American Society of Tropical Medicine and Hygiene. Am. J. Trop. Med. Hyg. 2020, 103, 1758. [Google Scholar] [CrossRef] [PubMed]
  52. Barret, D. Estimating, Monitoring and Minimizing the Travel Footprint Associated with the Development of the Athena X-Ray Integral Field Unit: An on-Line Travel Footprint Calculator Released to the Science Community. Exp. Astron. 2020, 49, 183–216. [Google Scholar] [CrossRef] [PubMed]
  53. Duane, B.; Lyne, A.; Faulkner, T.; Windram, J.D.; Redington, A.N.; Saget, S.; Tretter, J.T.; McMahon, C.J. Webinars Reduce the Environmental Footprint of Pediatric Cardiology Conferences. Cardiol. Young 2021, 31, 1625–1632. [Google Scholar] [CrossRef]
  54. Luewarasirikul, N. A Study of Electrical Energy Saving in Office. Procedia Soc. Behav. Sci. 2015, 197, 1203–1208. [Google Scholar] [CrossRef]
  55. Lim, G.H.; Keumala, N.; Ghafar, N.A. Energy Saving Potential and Visual Comfort of Task Light Usage for Offices in Malaysia. Energy Build. 2017, 147, 166–175. [Google Scholar] [CrossRef]
  56. Kawamoto, K.; Shimoda, Y.; Mizuno, M. Energy Saving Potential of Office Equipment Power Management. Energy Build. 2004, 36, 915–923. [Google Scholar] [CrossRef]
  57. Allen, S.; Marquart-Pyatt, S.T. Workplace Energy Conservation at Michigan State University. Int. J. Sustain. High. Educ. 2018, 19, 114–129. [Google Scholar] [CrossRef]
  58. Di Stefano, J. Energy Efficiency and the Environment: The Potential for Energy Efficient Lighting to Save Energy and Reduce Carbon Dioxide Emissions at Melbourne University, Australia. Energy 2000, 25, 823–839. [Google Scholar] [CrossRef]
  59. Berawi, M.A.; Kim, A.A.; Naomi, F.; Basten, V.; Miraj, P.; Medal, L.A.; Sari, M. Designing a Smart Integrated Workspace to Improve Building Energy Efficiency: An Indonesian Case Study. Int. J. Constr. Manag. 2021, 23, 410–422. [Google Scholar] [CrossRef]
  60. Waste & Resources the Old Academy Action Programme (WRAP) Green Office: A Guide to a More Cost-Effective and Environmentally Sustainable Office. Available online: https://greenbusiness.ie/wp-content/uploads/2016/06/WRAP_Green_Office_Guide.pdf (accessed on 7 June 2023).
  61. Kumar, A.; Mishra, S.; Pandey, R.; Yu, Z.G.; Kumar, M.; Khoo, K.S.; Thakur, T.K.; Show, P.L. Microplastics in Terrestrial Ecosystems: Un-Ignorable Impacts on Soil Characterises, Nutrient Storage and Its Cycling. TrAC Trends Anal. Chem. 2023, 158, 116869. [Google Scholar] [CrossRef]
Figure 1. Percentage differences between the Base Case and the scenarios for Project KASTOM.
Atmosphere 14 01365 g001
Figure 2. Percentage differences between the Base Case and the scenarios for project LIFE ASTI.
Atmosphere 14 01365 g002
Table 1. Projects overview.
ProjectNo. of PartnersDuration (Years)EmployeesPerson MonthsTwo-Way Travels
KASTOM44.5371638264
LIFE ASTI647134818,582
Table 2. Key metrics of the scientific projects.
ProjectFuels (kWh)Electricity (kWh)Freshwater Bodies (m3)Materials (t)Project-Hosted EventsParticipation in External EventsEquipmentDeliverables (pg)
KASTOM756158,1882432931341806
LIFE ASTI17,378114,187471531320105060
Table 3. Carbon footprint (tCO2e) Analysis for projects KASTOM and LIFE ASTI during the projects’ duration in the Base Case.
Project: KASTOMProject: LIFE ASTI
CF
Emission SourcetCO2etCO2e/yeartCO2etCO2e/year
Fuels (Heating)1.660.373.810.95
Electricity26.775.9552.5513.14
Freshwater bodies0.050.010.100.03
Transportation3.410.768.782.19
Materials14.023.1227.196.80
Deliverables0.010.010.040.01
Equipment3.950.888.972.24
tCO2e/event tCO2e/event
Project-hosted events7.772.5916.861.31
Participation in external events6.130.473.510.18
TotaltCO2etCO2e/yeartCO2etCO2e/year
63.7714.17121.7930.45
Table 4. Carbon footprint (tCO2e) variation in scenarios for projects KASTOM and LIFE ASTI.
CF (tCO2e)
Before COVID-19 ScenarioAfter COVID-19 Scenario
Emission SourceKASTOMLIFE ASTIKASTOMLIFE ASTI
Fuels (Heating)2.555.541.152.73
Electricity41.0975.3318.5238.24
Freshwater bodies0.080.140.040.07
Transportation6.1814.933.337.29
Materials21.5839.079.7219.79
Deliverables0.030.150.0020.01
Equipment3.958.973.958.97
Project-hosted events9.3320.697.4811.16
Participation in external events7.078.625.483.34
tCO2etCO2e
Total91.9173.449.791.6
Disclaimer/Publisher’s Note: The statements, opinions and data contained in all publications are solely those of the individual author(s) and contributor(s) and not of MDPI and/or the editor(s). MDPI and/or the editor(s) disclaim responsibility for any injury to people or property resulting from any ideas, methods, instructions or products referred to in the content.

