Abstract
During the second half of August 2022, a dust intrusion event occurred when dust that originated in the dry regions of the Kalmyk steppe (located in Russia, northeast of the Black Sea, north of Georgia, and northwest of the Caspian Sea) and the Precaspian plain was transported over the eastern region of Romania. The arid soil found in these areas can be attributed to an extended period of intense drought, with notable instances occurring in 2002, 2003, 2015, and 2018. This situation was further intensified by heatwaves experienced in May and June of 2022. The dust event was captured in MODIS images. In addition, smoke trains originating from fires in the north of the Azov were detected, but these did not reach Romania. Optical parameters from AERONET were used to confirm the dust event. To determine the trajectory of the particles, the Hybrid Single-Particle Lagrangian Integrated Trajectory (HYSPLIT) model was used in this paper. The ensemble median model was used to highlight the presence and concentration of dust in the eastern part of Romania. Aerosols were detected between 0 and 4 km, according to radar and ceilometer data from the REXDAN cloud remote sensing facility in Galați, Romania. This dust intrusion event was the result of the dominant easterly circulation caused by the extension of the East European High to the northeast of the continent, which transported the dust towards the eastern part of Romania for more than 2 days. Moreover, the torrential rains between 22 and 24 August did not clear the atmosphere of dust, since the intense easterly circulation kept carrying the dust into the Moldavian area.
1. Introduction
The drought of 2022 in Europe was considered the most severe in recent years by the European Commission Joint Research Center (https://www.euronews.com/my-europe/2022/08/10/europes-drought-could-be-the-worst-in-500-years-warns-researcher, accessed on 29 March 2023). Additionally, the European Drought Observatory (EDO) of the Copernicus Emergency Management Service (CEMS) indicated that the drought intensified in August [1].
In areas with dry and scattered vegetation, wind erosion can easily occur, leading to the transportation of dust over long distances (up to 1500 km). The Kalmyk steppe is located in the arid belt of the Russian Federation (Figure 1), where desertification is fully manifested (up to 80%) [2]. Depending on the synoptic conditions, dust particles can be transported over long distances and can accumulate at ground level and at high altitudes. Moreover, dust particles can remain in the lower troposphere for several days. Studies related to the transport of Saharan dust to Europe are numerous [3,4,5,6], but only a few have considered dust particles of Asian origin [7]. Saharan dust is the main research subject in terms of mineral dust transport events. In this context, this paper details the synoptic circumstances that determined the transport of mineral dust in August 2022, having the arid regions of western Asia as its source. For Romania, the first studies related to synoptic and circulation types concluded that westerly circulation is the most frequent during a year [8]. Nita I. A. et al. [8] in 2022 grouped 27 synoptic types in 11 classes. In this sense, in their study they showed that during the warm season, the highest percentage (25% of the data series) was represented by the undefined synoptic type, followed by the cyclonic type (2.6% of the data series) in second place, and the east anticyclone type (5.1% of the data set) in the third position. In places five and six, the most frequent synoptic types are north anticyclonic/north cyclonic and northeast anticyclonic/northeast cyclonic [8]. The event analyzed in this paper took place in a synoptic context of easterly circulation, which is the third-most frequent circulation during the summer at the latitude of Romania. To this non-negligible frequency was added a very important factor: the drought that covered Europe and western Asia in 2022 [1]. This drought further exacerbated the aridity of the Caspian region. In such conditions of intensified easterly airflow, mineral dust was carried towards Romania. According to the climatology of August determined by the National Meteorological Administration (NMA) [9], in Romania, it is the hottest month of the year as a result of the activity of the ridge of the Azores High, which exists over Eastern Europe. This phenomenon facilitates the influx of tropical air masses from North Africa. In the analyzed event, at the end of August in 2022, the eastern part of Romania was not under the influence of the ridge of the Azores High but rather of easterly circulation.
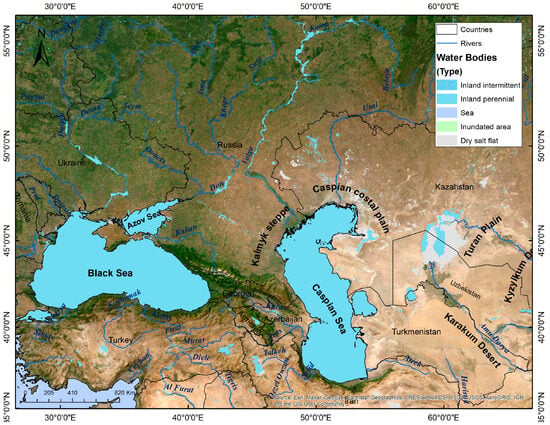
Figure 1.
Transported dust origin regions; data source: Esri, Maxer, GeoEye, Earthstar Geographics, CNES/Airbus DS, USDA, USGS, AeroGrid, ING, GIS User Community.
Most studies are done on Saharan dust events, due to the greater frequency of these penetrations at the latitude of Europe, however a study focusing on similar events was done by Tositti et al in 2021 [7]. They describe that mineral dust originating from the Caspian region was detected in Europe, more precisely in Italy, in March 2020, in the same synoptic conditions of intense easterly circulation ensured by the presence of a strong anticyclone in northeastern Europe. This arid region, subject to desertification, began to attract the attention of researchers. Also, the eastern origin of the mineral dust was confirmed in this case with backward trajectory analysis. As in the present paper, at 500 hPa the height of the geopotential was high in the region of the Mediterranean Sea, while at ground level, a vast anticyclonic extended across most Eastern Europe, up to the region of Romania [9]. Between the two dust events, the most notable divergent aspect is the production period. The dust event analyzed in this paper occurred in the warm season, in August, the month characterized by a greater stability of the masses [9], and the one described by Tossiti et al. [7] in 2021 took place in a transition season.
In Europe, the highest dust concentrations are in summer, and in the Middle East in late spring, according to a study by Joseph M. Prospero et al. in 2002 [10].
While the peak dust activity occurs in the cold semester at low latitudes, the highest dust concentrations are transported in summer and spring at medium and high latitudes [11]. Thus, for the latitude of Romania, the lowest dust activities are in autumn and winter. Prospero’s study from 2002 identified the sector between the Caspian Sea and the Aral Lake as one of the most important global sources of dust, with persistent dust activity. Although dust can be transported from this region throughout the year, the most intense periods are from May to August.
The thermodynamics and dynamical characteristics of the atmosphere and various meteorological events can influence pollution events. The weather conditions can facilitate or reduce the transport, dispersion, diffusion, preservation, modification, and transformation of pollutants [12]. For example, continental anticyclones are associated with pollution, while cyclones are associated with dispersion [10]. Dust particles have a direct impact on health, the environment, and the climate. Dust particles can absorb and reflect radiation, influencing the air temperature and altering cloud properties [13]. The African continent is the main global source of dust observed in Romania [14].
We show here that the dust detected in the lower atmosphere of Romania at the end of August in 2022 originated from another source. Weather and meteorological data, together with remote sensing observations, will be analyzed to identify the role played in the dust event observed in the eastern part of Romania on 22 and 23 August 2022, especially since eastern circulation events are atypical for this region during summer. We will identify weather conditions that may have favored both the transportation and the persistence of dust in the eastern region of Romania at the end of August.
2. Materials and Methods
2.1. Satellite Data
The area where the dust event was observed on 22–23 August is Moldavia, in the eastern part of Romania (Figure 2). We used synoptic maps of the middle troposphere and ground level from the ECMWF (European Center for Medium-Range Weather Forecasts—https://eumetrain.org/index.php/eport, accessed on 30 March 2023) [15] and GFS (Global Forecast System https://www.wetter3.de/, accessed on 29 March 2023) [16] models to help us describe the mesosynoptic conditions during the 2 days of the dust event. Modern-Era Retrospective analysis for Research and Applications (MERA—https://gmao.gsfc.nasa.gov/reanalysis/MERRA/, accessed on 30 March 2023) is a reanalysis system that applies assimilation schemes and numerical models to mix observations from several sources [17]. The dust event was also captured in the MODIS (Moderate Resolution Imaging Spectroradiometer—https://worldview.earthdata.nasa.gov/, accessed on 30 March 2023) images, which provide data with good spatial resolution in 36 spectral bands ranging in wavelength from 0.4 µm to 14.4 µm [18]. MODIS products have a spatial resolution of 250 m, 500 m, or 1 km. The channels with wavelengths between 0.4 µm and 2.1 µm are used to characterize aerosols. The spatial resolution for producing daily-level aerosol optical thickness is 10 km × 10 km [19].
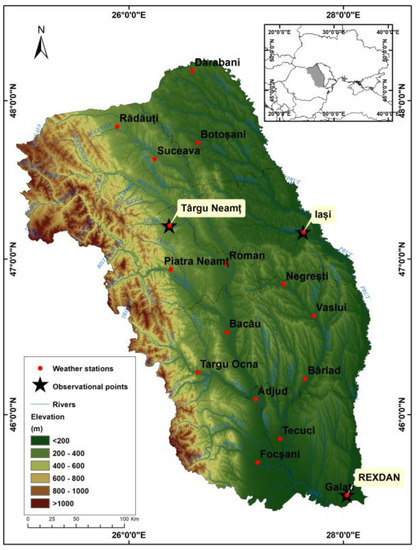
Figure 2.
Map of the studied area. Elevation model data source: Shuttle Radar Topography Mission geospatial.org.
2.2. Radar, Ceilometer, and AERONET Data
Radar and ceilometer data provided by the REXDAN cloud remote sensing facility in Galați, Romania (SE of Moldavia, 45°26′07.1″ N, 28°02′13.8″ E) confirmed the presence of aerosols between 0 and 4 km [20]. This data can be accessed and viewed by accessing the monitoring point in Galați from the CloudNet data portal [20].
AERONET observations are complementary to these types of analyses (both qualitative and quantitative analyses). The Kishinev (about 100 km from Iași), Republic of Moldova monitoring point (47.00° N; 28.82° E) was chosen due to the availability of substantial data, enabling statistical correlations to determine the dominant aerosol type for the specified period.
Inversion products based on the level 1.5 inversion data (version 3) with AOD values (at 440 nm) greater than 0.2 were used. According to the commonly accepted clustering method in the literature [21,22,23,24,25,26,27], the absorption Ångström exponent (AAE) and scattering Ångström exponent (SAE) were calculated using the 440 nm and 675 nm wavelengths. These optical parameter values were used to determine the type of aerosols [19,20,21,22,23,24,25].
2.3. Models
The origin of the dust event was initially considered to be Saharan [28]. However, using the HYSPLIT model and the GDAS—U.S. NOAA database [29], in this paper we show that the dust event between 22 and 24 August 2022 observed in the Moldavian troposphere originated in the arid regions of the Kalmyk steppe (the Caspian region), most likely because of an intense circulation from the east. A preliminary analysis of the dust event of 23/24 August 2022 has already been reported by Apetroaie et al. [30].
We used the European ensemble dust model to analyze the dust event, which brings together the performance of each individual model based on the nine air quality forecast models [31]. The European ensemble model uses the median value of each model, thus minimizing the uncertainty. It collects a series of pollutants regulated by the EU, such as PM10 and PM2.5 fine particle matter, sulfur dioxide, ozone, and nitrogen dioxide, which are regularly validated with in situ observations [32].
3. Mesoscale Context
3.1. Ground Level
The Eastern European High was present in NE Europe in the analyzed period. Its ridge gradually extended over the northeast of Romania, which ensured a continuous flow of air from the east. For Romania, August is considered the warmest and sunniest month of the year (the average temperature in August for the analyzed region being between 18 and 20 °C), characterized by a greater stability of masses [9]. This is due to the change in baric centers, namely, the extension of the Azores High’s ridge over Eastern Europe. The stability of this region in August is generally ensured by the formation of a high-pressure belt, resulting from the union of the Azores High’s ridge and the Eastern European High’s ridge and tropical air from the north of Africa is added [9].
However, the atmosphere was configured differently at the end of August 2022. The activity of the Azores ridge in this part of Europe was reduced and a low-pressure field in the Mediterranean Sea basin and the Middle East region was added (Figure 3). Thus, pollutants transported from the east were trapped in the eastern part of Romania, where the air was warm and humid, due to the flow of moisture brought from the Mediterranean basin. This ultimately represented a reservoir of atmospheric instability on the night of 23/24 August [30].
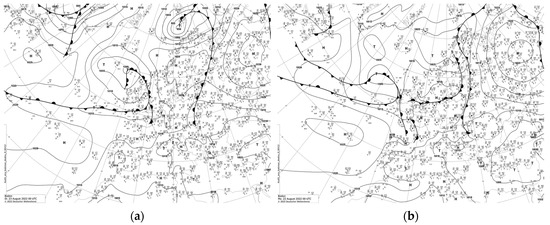
Figure 3.
Synoptic maps at ground level. Black lines represent isobars (hPa) for 23 (a) and 22 (b) of August 2022 [14] (closed contour lines: isobars (i.e., lines of equal pressure); curved line with triangles: cold atmospheric front; curved line with black semicircles: warm atmospheric front; curved line with semicircles and triangles: occluded atmospheric front; letter H: symbol for the atmospheric high pressure field, letter D: symbol for the atmospheric low pressure field; values below 1015 mb: cyclonic field (low pressure); values above 1015 mb: anticyclonic field (high pressure); values and small symbols scattered on the map in the background: Bjerknes scheme).
3.2. Middle Troposphere and 850 Hpa Level
Starting with 20th of August, a well-individualized geopotential nucleus was present in the middle troposphere of the northern part of the continent (Figure 3a). Gradually, a middle troposphere trough extended from this nucleus, which deepened over time. On 23 August, it reached the eastern basin of the Mediterranean Sea, west of the Balkan Peninsula (Figure 4).
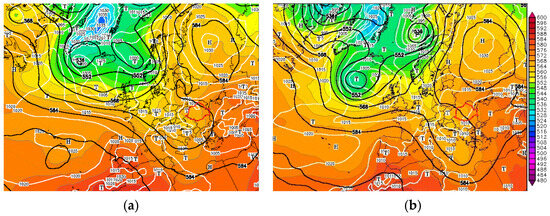
Figure 4.
Synoptic maps at 500 hPa level for 22 August (a) and 23 August (b) 2022. Black lines represent isohypses (gpdam) and white lines represent isobars (hPa) at ground level; Romania’s borders are outlined in red [14]. (thick black lines: surfaces with equal geopotential values; thin white lines: isobars (i.e., lines of equal pressure); letter H: symbol for the atmospheric high pressure field; letter D: symbol for the atmospheric low pressure field; color palette: interpolated geopotential values).
The eastern part of Romania was on the ascending side of this trough, which maintained a flow of moisture and heat from the Mediterranean Sea. As the trough deepened, atmospheric instability began to manifest. Dust particles offered a large reservoir for new condensation nuclei, which led to consistent amounts of precipitation and, in the end, contributed to the atmospheric instability [33].
3.3. Streamlines and Wind Direction
At 500 hPa, the atmospheric circulation was southerly due to the positioning of an altitude nucleus west of the Balkan Peninsula for both 22 and 23 August 2022 (Figure 5). The eastern part of Romania is located on the extending side of the geopotential trough and was fed with moisture and heat from the Mediterranean Sea basin. This altitude nucleus fluctuated and slightly changed its position. Subsequently, the altitude nucleus deepened its valley on 23 August. The circulation was thus the result of the presence of this nucleus formed over the Mediterranean Sea.
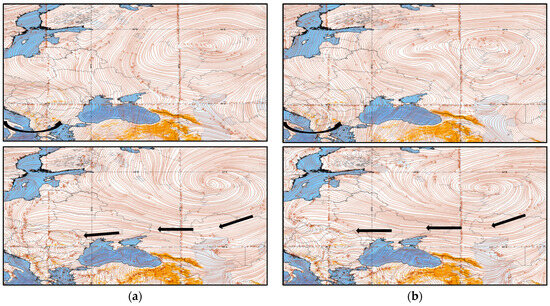
Figure 5.
Streamlines for (a) 22 August 2022 (500 hPa level—above, ground level—below) and (b) 23 August 2022 (500 hPa level—above, ground level—below). (more intensely colored areas: landforms area; curved lines: streamlines (these vectors describes the flow of air masses); thick black arrows: movement direction of the currents).
At the ground level, the atmospheric circulation in the analyzed region was exclusively easterly as a result of the activity of the Eastern European High in this part of Europe, whose ridge extended only to the extra-Carpathian region. The streamlines in Figure 4 describe the intense easterly circulation from the ground surface that ensured the continuous transport of air masses from the east. As a result of the stability given by the downward movements, in the eastern half of the analyzed region, atmospheric instability did not manifest itself. Instead, in the western area, orographic instability dictated the weather aspect.
The wind speed and wind shear were small (Figure 6) at low altitudes/ground level due to the Eastern European High extending over the area of interest. At higher altitudes, the wind direction was better defined. The easterly circulation was maintained up to 750 hPa. At higher altitudes, between 750 and 200 hPa, the wind speed increased and gradually changed its direction, dictated by the geopotential nucleus above the Mediterranean Sea. Between 750 and 100 hPa, the wind blowed predominantly from the southern sector. Up to 925 hPa, the direction of the wind was rapidly changing.
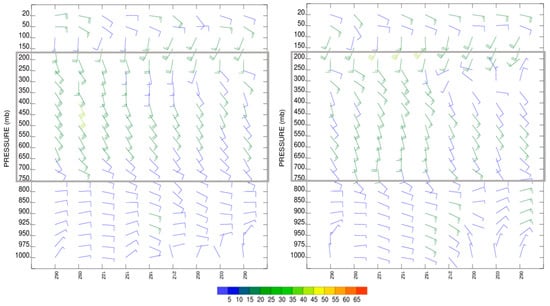
Figure 6.
Vertical wind profile (wind bars—speed in m/s and direction, Y axis—pressure (mb), X axis—time—every 3 h) for 22 August (left) and 23 August (right) 2022. (the gray boxes: group the heights between which the wind has a southerly direction).
4. Dust Event Analysis
4.1. Analysis of MODIS Satellite Images
On 21 August, satellite images show a high concentration of dust particles in the atmosphere, originating from the arid region around the Caspian Sea affected by drought. Here, the wind erosion was able to dislodge dust particles from the land depleted of water and vegetation. On 22 August, the dust traveled further westward and was supplemented by particles from the north of the Black Sea, resulting in a cloud of dust detected north of the Sea of Azov on this date. The images show that fine particles continue to be displaced from the source locality.
The Eastern European High (Figure 5) was the primary factor responsible for the presence of dust particles detected in the low atmosphere of Moldavia in this interval and it facilitated a continuous flow of air masses from the east.
On 23 August, these particles were further transported to the west, invading eastern Romania. The dust continued to be transported on 24 August, but at lower concentrations. The dust arrived in a region of humid and warm air supplied by the middle troposphere trough, generating a milky atmosphere that persisted in the east of Moldavia for over two days. This phenomenon would not have occurred at this particular time of the year without an intense movement of air masses from east to west, which also lasted for several days. Thus, dust of eastern origin was transported towards the region of Moldavia.
The downward movement specific to anticyclones allowed the preservation of these particles in the lower troposphere during the analyzed interval. In this case, the air masses remained above the earth for several days and were heated by it [34], which offered a favorable stable environment for locking the dust particles in this region.
Satellite images (Figure 7) show trains of smoke in the Eastern European Plain to the north and east of the Dnieper River. These were moving towards the west, driven by the atmospheric circulation imposed by the Eastern European High. The fires that affected this area during the analyzed period resulted in a combination of smoke and dust being transported over long distances. In addition to anthropogenic causes, the large-scale fires were also facilitated by dry conditions, with a lack of water in the soil and dry vegetation, all caused by the drought that affected Europe in 2022 [35].
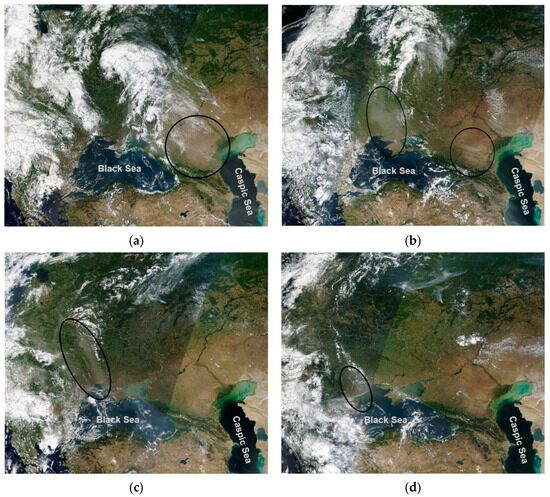
Figure 7.
MODIS satellite images for 21 August (a), 22 August (b), 23 August (c), and 24 August (d) 2022 (dust from the Russian steppes is highlighted inside the circles).
4.2. Analysis of Forecast Models and Reanalysis Data
4.2.1. MERRA Data
MERRA-2 reanalysis data (Figure 8) show that high concentrations of dust particles were located north and west of the Black Sea, originating in these dry steppes [17]. These particles were transported over long distances, reaching the atmosphere of Romania mainly on 23 August, when the particles flooded the atmosphere of the eastern part of Europe, reaching as far as Germany and Poland, as well as the Baltic countries. The highest concentrations, over 180 μg/m3, were detected in the east of Romania, without crossing the Carpathian arc to the west. The flow of particles was continuous during the analyzed period. On 22 August the dust had the highest concentrations (over 300 μg/m3) and was concentrated in Ukraine, in the Dnieper basin, and in the East European Plain. Later, on 23 August, the dust moved over the eastern part of Romania, the Republic of Moldova, and the northern countries of Eastern Europe, with slightly lower concentrations.
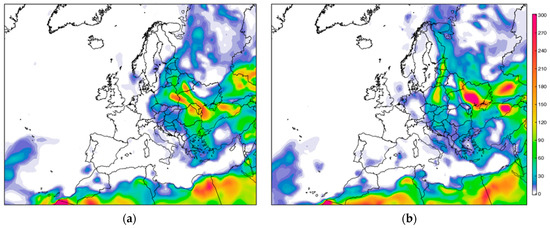
Figure 8.
Dust surface mass (μg/m3) for 22 August (a) and 23 August (b) 2022 (Modern-Era Retrospective Analysis for Research and Application, Version 2).
The dust transportation continued throughout 23 August and was slightly reduced on 24 August, when the dust was slowly transported towards the north. The orographic barrier represented by the Carpathian chain prevented the dust particles from circulating further to the west. Therefore, eastern Romania was the most affected by this natural episode of dust transport.
The atmosphere of the Mediterranean Sea remained free of dust particles, which, together with the atmospheric circulation that prevailed over Eastern Europe and the European part of Asia at that time, supports the idea that the dust event in Romania is of Asian and not Saharan origin.
4.2.2. European Ensemble Model
The models accurately predicted the August 2022 dust event. The ensemble model, which incorporates several forecast models [36], signaled the presence of dust in the eastern half of Europe, with the highest concentrations in the Black Sea basin, eastern Romania and the Republic of Moldova, western Ukraine, Poland, the Baltic States, and Belarus. However, for 22 August (Figure 9), lower concentrations of dust were forecasted for the eastern region of Romania. The Eastern European High ensured the transport of dust that reached higher concentrations the following day. According to the model, the average dust concentration for 22 August was below 50 μg/m3.
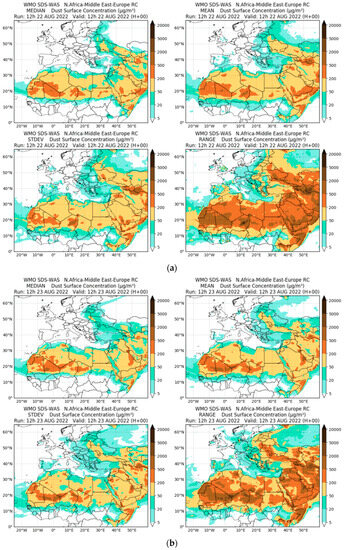
Figure 9.
European ensemble model—dust surface concentration (μg/m3) for 22 August (a) and 23 August (b) 2022 (Run 12h)—median (upper left), mean (upper right), stdev (bottom left), range (bottom right).
The model accurately captured the distribution of the dust cloud in the eastern part of the Carpathians. For 23 August, the model predicted average concentrations of over 200 μg/m3 in the eastern region of Romania. Based on the model, it was estimated that the dust from the lower levels might have originated from Asia.
4.3. Backward Trajectories Analysis
In order to identify the origin of the dust present in the atmosphere of Moldova on 23 August, we analyzed the back trajectories of the particles (Figure 9, Figure 10 and Figure 11) for two observation points: Târgu Neamț (47°12′9″ N 26°21′31″ E) and Iași (47°9′6.2″ N, 27°35′16″ E), shown in Figure 1. Elevations of 500 and 1500 m were chosen as the reference altitudes in the analysis to highlight the relief characteristics of the region. In order to analyze the situation in the free atmosphere, and also to have a clear vertical image, the altitude of 5000 m was also selected. The backward trajectories for 72 h show that the particles originated from the Asian continent.
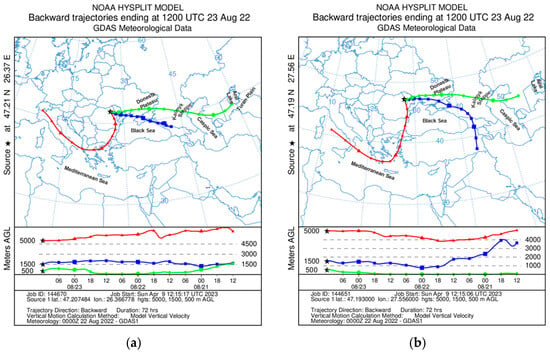
Figure 10.
Backward trajectories ending at 12:00 UTC for 23 August 2022 (duration: 72 h) ((a)—for Târgu Neamț observation point, (b)—for Iași observation point).
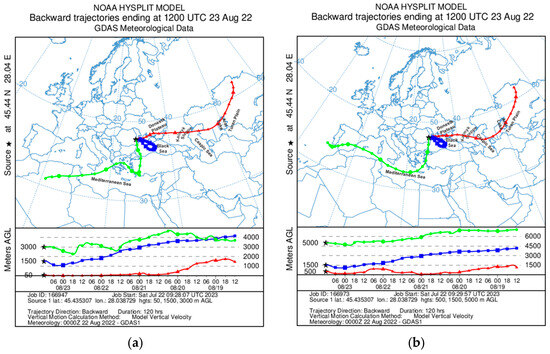
Figure 11.
Backward trajectories ending at 12:00 UTC for 23 August 2022 (duration: 120 h) for the REXDAN-Galați observation point ((a)—altitudes: 500, 1500, 3000 m, (b)—altitudes: 500, 1500, 5000 m).
HYSPLIT shows that particles arriving at the Târgu Neamț station were detected on 21 August at 12 UTC at an altitude of 1500 m, originating from the region beyond the Caspian Sea, specifically, from the dry region of the Turan Plain. On 22 August, at 12 UTC, the particles moved north of the Azov Sea, passing through the region of the Donesk Plateau, and on 23 August the particles reached the point of interest at an altitude of approximately 500 m. Thus, the particles in the lower troposphere originated from the Asian continent.
At the same altitude of 1500 m, in the eastern region of Romania, the dust had a clear trajectory from the east as well but started in the Kalmyk steppe. For the Iași observation point, the HYSPLIT results are similar.
Precisely to demonstrate the stratification of different types of dust (Saharan dust and dust from the Russian steppes), we chose to investigate the layers at 50m, 1500 m, and 3000 m (Figure 11). It can be easily observed that dust of eastern origin reached above the observation point at low altitudes. Dust from the Sahara does not mix and is maintained at high altitudes (over 3000 m). Moreover, the stratification is not perfect in Moldavia, because of the complex movements in the atmosphere, as we said above; instead, the influence of each type of dust can be observed, depending on its origin, at various levels.
The situation is different at higher altitudes: at 5000 m (Figure 11), the particles are of European origin. On 21 August at 12 UTC, the particles traveled from the Swiss Alps area at an altitude of over 4000 m. On 22 August, the particles were in the region of the Aegean Sea, catching dust particles from the Mediterranean Sea in their path, which are probably of Saharan origin.
On 23 August, the particles reached the atmosphere of Moldavia at an altitude of 5000 m. It should be mentioned that these particles were well-defined in altitude. The dust particles in the low atmosphere in eastern Romania had their origin in the arid regions of Asia, while above 4000 m, the particles had a southern origin, from the Sahara. These layers were very well-defined and did not mix.
The situation seemed to change slightly when extending the travel time of particles to 120 h (Figure 12). The dust at low altitudes originated in the south of the Western Siberian Plain at an altitude of over 3000 m on August 19th at 12 UTC. On August 20th, the particles were entrained at an altitude below 3000 m beyond the Caspian Sea, from the Turan Plain region. However, it is difficult to say, based only on HYSPLIT, from where the dust was picked up. Thus, one can only infer that the dust event had an Asian origin.
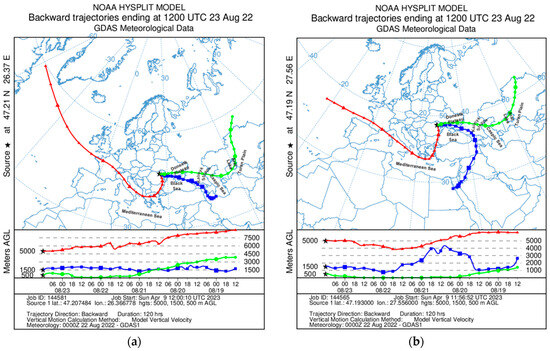
Figure 12.
Backward trajectories ending at 12:00 UTC for 23 August 2022 (duration: 120 h) ((a)—for Târgu Neamț observation point, (b)—for Iași observation point).
On 22 August, the particles traveled north of the Black Sea, in the eastern part of Ukraine, where the particles were drawn from an altitude of 500 m. On 23 August, the particles reached the eastern region of Romania at an altitude of 500 m. On 23 August, the particles could be seen mixing at an altitude of about 2000 m north of the Sea of Azov.
According to HYSPLIT, the dust particles from high altitudes, if existing, were carried from Western Europe on 22 August, probably picking up some particles when sweeping the region of the Dalmatian coast of the Adriatic Sea, at an altitude of approximately 5000 m.
This was also the moment when, possibly, the dust was mixed with that of the Sahara. In the region of eastern Romania, the dust thus traveled from the south, arriving here on 23 August. And this time, it could be observed that the dust that flooded the low atmosphere of the eastern region of Romania was of Asian origin and not of Saharan origin. Although there were easy concentrations of Saharan dust at an altitude of over 5000 m, it was not transported to the lower layers of the atmosphere.
For the observation point from Iasi, a difference is noted. It seems that the origin of the dust from the altitude of 1500 was a southern one, from the African continent in the Eastern Desert of Egypt. These particles traveled through the Middle East. However, it can be observed that on 21 August, this dust of Saharan origin was located at an altitude of over 4000 m and did not mix with the dust from low altitudes that arrived in the eastern region of Romania on 23 August.
Overall, the dust event can be attributed to the easterly circulation from Asia. At higher altitudes, over 5000 m, the dust may have originated from the Dalmatian coast. However, the two major layers, at low and high altitudes, did not mix. The atmosphere in eastern Romania was, therefore, loaded with particles of Asian origin and there was no mixing with the particles from other origins at different altitudes.
4.4. Air Quality Analysis
By analyzing the air quality bulletins from different points in eastern Romania, made available by the National Environmental Protection Agency [37], it can be stated that the dust episode analyzed was not a polluted one, considering that no fine particles of PM2.5 were detected and those of PM10 did not exceed the harmful threshold for human health [38].
According to the Air Quality LAW no. 104 of 15 June 2011, the daily limit value of PM10 particles for the protection of human health is 50 μg/m3, with 35 days above this value allowed per year [39], and the annual limit value for the protection of human health is 40 μg/m3. In the case of PM2.5 particles, the annual limit value is 20 µg [40].
The analyzed examples show that for Neamț county (Figure 13), on 23 August 2022, the air quality was “good” for NT2 and NT3 stations and “acceptable” for NT1. For Bacau county (Figure 14), for all observation points (BC1, BC2, BC3), the air quality was “acceptable”. The same situation occurred in Botoșani and Vaslui counties (Figure 15 and Figure 16).
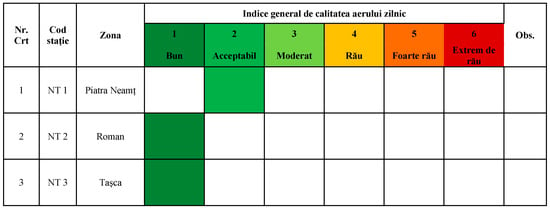
Figure 13.
Bulletin of air quality in Neamț county—general air quality index for 23 August 2022 (1—good, 2—acceptable, 3—moderate, 4—bad, 5—very bad, 6—extremely bad).
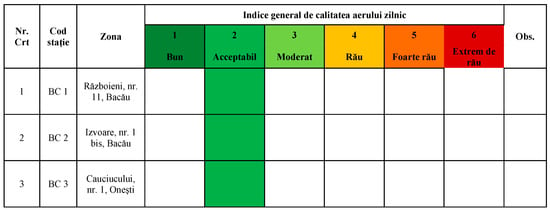
Figure 14.
Bulletin of air quality in Bacău county—general air quality index for 23 August 2022 (1—good, 2—acceptable, 3—moderate, 4—bad, 5—very bad, 6—extremely bad).

Figure 15.
Bulletin of air quality in Botoșani county—general air quality index for 23 August 2022 (1—good, 2—acceptable, 3—moderate, 4—bad, 5—very bad, 6—extremely bad).

Figure 16.
Bulletin of air quality in Vaslui county—general air quality index for 23 August 2022 (1—good, 2—acceptable, 3—moderate, 4—bad, 5—very bad, 6—extremely bad).
4.5. Dust Event from AERONET—Observations
The aerosol population measured by AERONET over Moldova for August 2022, in general, was dominated by the occurrence of an elemental carbon (EC) and organic carbon (OC) mixture (fine mode particles), at 34% (see EC/OC mixture in Figure 17a).
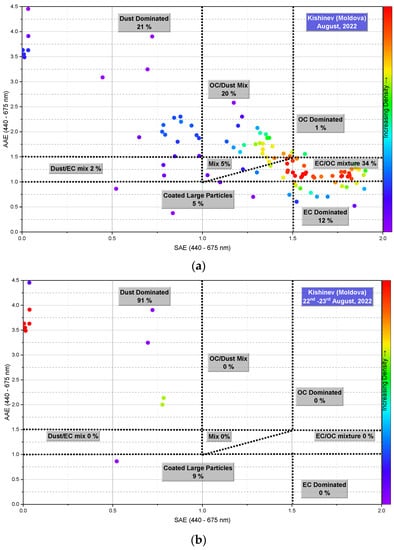
Figure 17.
Absorption Ångström exponent [AAE at 440–675 nm] vs. scattering Ångström exponent [SAE at 440–675 nm] in the number density plot from Republic of Moldova (Kishinev) monitoring site: (a) August of 2022 (b) 22–23 August 2022.
Cazacu et al. [26] investigated the aerosol data from the Iasi_LOASL AERONET site (47.19° N, 27.55° E) compared with the data from the Moldova site (Kishinev: 47.00° N; 28.82° E) for one year (May 2012–May 2013). Similar trends in the optical parameters were observed; thus, data from the Moldova site can be considered representative for the dust event. Additionally, Sfîca et al. [27] and Timpu at al. [41] already reported that the EC/OC mixture type dominated for the Iasi site, as can also be seen in the figure below for the Moldova site.
The fine mode particles, categorized as “EC dominated” in Figure 17a, indicate that 12% of the aerosol came from biomass burning or soot particle types. The aerosol types “OC dominated”, “Mix”, “Coated large particles”, and “Dust/EC mix” were not important for our study, since they were present in fairly small percentages of less than 5%. The other two remaining categories that may describe the dust were “OC/Dust Mix” and “Dust Dominated”, in a percentage of approximately 20%.
The “OC/Dust” mixture indicates that part of the aerosols was of combustion/biomass burning origin, although their source is not straightforward, since no fires were indicated during that period. However, during the dust event period, i.e., 22–23 August, the “Dust Dominated” type made up more than 90% of the aerosol (Figure 17b). Due to clouds and precipitation, inversion products cannot be generated to be included in the level 1.5 inversion data (version 3) at the Moldova site on 24 August 2022.
4.6. Radar and Ceilometer Data
Cloud radar and ceilometer data provided by the REXDAN cloud remote sensing facility in Galati, SE Romania, revealed a consistent layer of dust between 0 and 4000 m altitude [20,30]. Figure 18 shows that on 22 August some showers occurred between 10.00 and 12.00 LT and around 21.00 LT [30]. However, the combined radar and lidar data show that dust particles (i.e., aerosols, shown with light brown in Figure 18) persisted in the atmosphere even after these short showers.
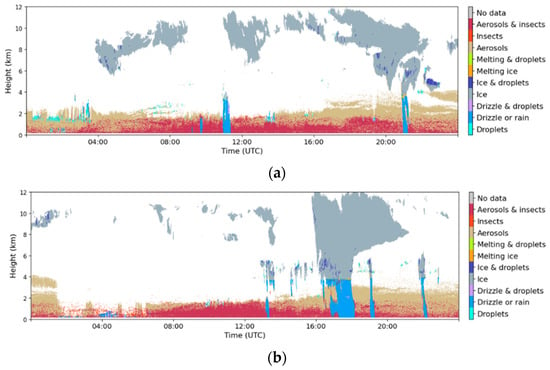
Figure 18.
Combined results of radar and lidar data for 22 August (a) and 23 August (b) (Cloudnet image from UGAL–REXDAN).
On 23 August, when the atmospheric instability increased, a significant torrential rain was observed in the afternoon between approximately 17.00 UTC and 18.00 UTC, probably as a result of the deepening of the high-altitude trough. However, large quantities of aerosol continued to be detected in the atmosphere, confirming the continuous flow of dust from the East facilitated by the presence of the Eastern European High, which directed the dust towards the eastern region of Romania.
5. Conclusions
A dust event observed during the third week of August 2022 in the eastern part of Romania was investigated using both models and observational data. Usually, transportation of dust from the Sahara is the main source of dust events in Europe, occurring in southerly circulation conditions resulting from the deepening of cyclones in the Mediterranean Sea.
However, this particular case observed on 22–24 August was linked to another important source of dust, i.e., the arid regions of Asia. Due to favorable synoptic conditions of easterly circulation resulting from the persistence of the Eastern European High in the Russian Plain, dust was present in the atmosphere for more than two days in the eastern region of Romania. On the night of 23/24 August 2022, the atmosphere became unstable due to the advancement of a high-altitude trough whose ascending part reached the eastern part of Romania. Torrential rains potentiated by the presence of a low pressure field area in the Mediterranean basin correlated with a deep altitude trough did not clean the atmosphere of dust. Satellite images captured smoke trains, but smoke was not detected in the Romanian atmosphere.
Based on the HYSPLIT-generated backward trajectories, the dust in the lower troposphere was of Asian origin, up to at least 1500 m. The AERONET data showed that the presence of dust and other types of pollutants, such as various types of combustion/biomass burning and urban and industrial pollution, contributed to the optical parameter values as a characteristic of mixing between the intrusion events of both Saharan dust from higher altitudes and dust from eastern origin dispersed in the low troposphere. However, on the analyzed days, the optical parameters presented specific values for a dust event intense enough to allow us to neglect the influence of the other mentioned categories of pollutants on the optical parameters.
Author Contributions
Conceptualization, D.-C.B., A.T. and M.-M.C.; methodology, D.-C.B., I.-M.M., C.A., M.V., A.T. and M.-M.C.; software, I.-M.M., C.A., A.T. and M.-M.C.; validation, D.-C.B., M.V., A.T. and M.-M.C.; formal analysis, D.-C.B., I.-M.M., C.A., M.V., A.T. and M.-M.C.; investigation, D.-C.B., I.-M.M., C.A., M.V., A.T. and M.-M.C.; resources, D.-C.B., I.-M.M., C.A., M.V., A.T. and M.-M.C.; data curation, D.-C.B., I.-M.M., C.A., M.V., A.T. and M.-M.C.; writing—original draft preparation, C.A., A.T. and M.-M.C.; writing—review and editing, D.-C.B., M.V., A.T. and M.-M.C.; visualization, D.-C.B., I.-M.M., C.A., M.V., A.T. and M.-M.C.; supervision, D.-C.B., A.T. and M.-M.C.; project administration, D.-C.B., A.T. and M.-M.C. All authors have read and agreed to the published version of the manuscript.
Funding
This research received no external funding.
Institutional Review Board Statement
Not applicable.
Informed Consent Statement
Not applicable.
Data Availability Statement
The raw data supporting the conclusions of this article will be made available by the authors without undue reservation.
Acknowledgments
The authors acknowledge the UGAL–REXDAN cloud remote sensing facility (www.rexdan.ugal.ro) and the Barcelona Dust Forecast Model for the free data available for this study. The authors would like also to thank the PIs (Alexander_Aculinin, Pawan_Gupta, Elena_Lind) and Co-Is for their effort in establishing and maintaining the Moldova AERONET site.
Conflicts of Interest
The authors declare no conflict of interest.
References
- Euronews. Available online: https://www.euronews.com/my-europe/2022/08/10/europes-drought-could-be-the-worst-in-500-years-warns-researcher (accessed on 29 March 2023).
- Dedova, E.B.; Goldvarg, B.A.; Tsagan-Mandzhiev, N.L. Land Degradation of the Republic of Kalmykia:Problems and Reclamation Methods. Arid. Ecosyst. 2020, 10, 140–147. [Google Scholar] [CrossRef]
- Di Mauro, B.; Garzonio, R.; Rossini, M.; Filippa, G.; Pogliotti, P.; Galvagno, M.; Morra di Cella, U.; Migliavacca, M.; Baccolo, G.; Clemenza, M.; et al. Saharan dust events in the European Alps: Role in snowmelt and geochemical characterization. Cryosphere 2019, 13, 1147–1165. [Google Scholar] [CrossRef]
- Weger, M.; Heinold, B.; Engler, C.; Schumann, U.; Seifert, A.; Fößig, R.; Voigt, C.; Baars, H.; Blahak, U.; Borrmann, S.; et al. The impact of mineral dust on cloud formation during the Saharan dust event in April 2014 over Europe. Atmos. Chem. Phys. 2018, 18, 17545–17572. [Google Scholar] [CrossRef]
- Pérez, C.; Nickovic, S.; Baldasano, J.M.; Sicard, M.; Rocadenbosch, F.; Cachorro, V.E. A long Saharan dust event over the western Mediterranean: Lidar, Sun photometer observations, and regional dust modeling. J. Geophys. Res. Atmos. 2006, 111, D15. [Google Scholar] [CrossRef]
- Israelevich, P.; Ganor, E.; Alpert, P.; Kishcha PStupp, A. Predominant transport paths of Saharan dust over the Mediterranean Sea to Europe. J. Geophys. Res. 2012, 117, D2. [Google Scholar] [CrossRef]
- Tositti, L.; Brattich, E.; Cassardo, C.; Morozzi, P.; Bracci, A.; Marinoni, A.; Di Sabatino, S.; Porcù, F.; Zappi, A. Development and evolution of an anomalous Asian dust event across Europe in March 2020. Atmos. Chem. Phys. 2022, 22, 4047–4073. [Google Scholar] [CrossRef]
- Nita, I.A.; Apostol l Patriche, C.L.; Sfîcă, L.; Bojariu, R.; Birsan, M.V. Rrequency of atmospheric circulation types over Romania according to Jenkinson-Collison method based on two long-term reanalysis datasets. Rom. J. Phys. 2022, 67, 812. [Google Scholar]
- Meteo Romania. Available online: https://www.meteoromania.ro/clim/caracterizare-multianuala/index.html (accessed on 29 March 2023).
- Prospero, J.M.; Ginoux, P.; Torres, O.; Nicholson, S.E.; Gill, T.E. Environmental characterization of global sources of atmospheric soil dust identified with the nimbus 7 total ozone mapping spectrometer (toms) absorbing aerosol product. Rev. Geophys. 2002, 40, 1002. [Google Scholar] [CrossRef]
- Hakki, B. Meteorological characteristics of dust storm events in Turkey. Aeolian Res. 2021, 50, 100673. [Google Scholar] [CrossRef]
- Ashrafi, K.; Shafiepour-Motlagh, M.; Aslemand, A.; Ghader, S. Dust storm simulation over Iran using HYSPLIT. J. Environ. Health Sci. Eng. 2014, 12, 9. [Google Scholar] [CrossRef]
- McGregor, G.R.; Bamzelis, D. Synoptic typing and its application to the investigation of weather air pollution relationships, Birmingham, United Kingdom. Theor. Appl. Clim. 1995, 51, 223–236. [Google Scholar] [CrossRef]
- Barkan, J.; Alpert, P.; Kutiel, H.; Kishcha, P. Synoptics of dust transportation days from Africa toward Italy and central Europe. J. Geophys. Res. 2005, 110, D7. [Google Scholar] [CrossRef]
- EUMeTrain, ePort Pro. Available online: https://eumetrain.org/index.php/eport (accessed on 30 March 2023).
- Wetter3.de. Available online: https://www.wetter3.de/index_dt.html (accessed on 29 March 2023).
- National Aeronautics and Space Administration. Available online: https://gmao.gsfc.nasa.gov/reanalysis/MERRA/ (accessed on 30 March 2023).
- NASA Worl View. Available online: https://worldview.earthdata.nasa.gov/ (accessed on 30 March 2023).
- MODIS Moderste Resolution Imaging Spectroradiometer. Available online: https://modis.gsfc.nasa.gov/about/design.php (accessed on 30 March 2023).
- Rosu, A.; Constantin, D.; O’Connor, E.; Voiculescu, M. Categorize Data from Galați on 23 July 2022, ACTRIS Cloud Remote Sensing Data Centre Unit (CLU). 2022. Available online: https://cloudnet.fmi.fi/file/1e668f92-68de-48e9-ba6b-6eabe9b698db (accessed on 16 April 2023).
- Zheng, C. Chapter 9—Assessment Methods for Air Pollution Exposure; Li, L., Zhou, X., Tong, W., Eds.; Spatiotemporal Analysis of Air Pollution and Its Application in Public Health; Elsevier: Amsterdam, The Netherlands, 2020; pp. 197–206. [Google Scholar] [CrossRef]
- Cazorla, A.; Bahadur, R.; Suski, K.J.; Cahill, J.F.; Chand, D.; Schmid, B.; Ramanathan, V.; Prather, K.A. Relating aerosol absorption due to soot, organic carbon, and dust to emission sources determined from in-situ chemical measurements. Atmos. Chem. Phys. 2013, 13, 9337–9350. [Google Scholar] [CrossRef]
- Dubovik, O.; Holben, B.; Eck, T.F.; Smirnov, A.; Kaufman, Y.J.; King, M.D.; Tanré, D.; Slutsker, I. Variability of Absorption and Optical Properties of Key Aerosol Types Observed inWorldwide Locations. J. Atmos. Sci. 2002, 59, 590–608. [Google Scholar] [CrossRef]
- Giles, D.M.; Sinyuk, A.; Sorokin, M.G.; Schafer, J.S.; Smirnov, A.; Slutsker, I.; Eck, T.F.; Holben, B.N.; Lewis, J.R.; Campbell, J.R.; et al. Advancements in the Aerosol Robotic Network (AERONET) Version 3 database—Automated near-real-time quality control algorithm with improved cloud screening for Sun photometer aerosol optical depth (AOD) measurements. Atmos. Meas. Tech. 2019, 12, 169–209. [Google Scholar] [CrossRef]
- Russell, P.B.; Bergstrom, R.W.; Shinozuka, Y.; Clarke, A.D.; DeCarlo, P.F.; Jimenez, J.L.; Livingston, J.M.; Redemann, J.; Holben, B.; Dubovik, O.; et al. Absorption Angstrom Exponent in AERONET and related data as an indicator of aerosol composition. Atmos. Chem. Phys. 2010, 10, 1155–1169. [Google Scholar] [CrossRef]
- Cazacu, M.M.; Timofte, A.; Unga, F.; Albina, B.; Gurlui, S. AERONET data investigation of the aerosol mixtures over Iasi area, One-year time scale overview. J. Quant. Spectrosc. Radiat. Transf. 2015, 153, 57–64. [Google Scholar] [CrossRef]
- Sfîca, L.; Iordache, L.; Ichim, P.; Leahu, A.; Cazacu, M.-M.; Gurlui, S.; Trif, C.-T. The influence of weather conditions and local climate on particulate matter (PM10) concentration in metropolitan area of Iasi, Romania. Pres. Environ. Sustain. Develop. 2018, 11, 109–117. [Google Scholar] [CrossRef]
- Digi24. Available online: https://www.digi24.ro/stiri/actualitate/social/anm-anunta-mase-de-aer-cu-particule-de-praf-saharian-in-mai-multe-zone-din-romania-2059553 (accessed on 5 April 2023).
- NOAA Air Resources Laboratory. Available online: https://www.ready.noaa.gov/HYSPLIT.php (accessed on 5 April 2023).
- Apetroaie, C.; Bostan, D.C.; Timofte, A.; Cazacu, M.M.; Bostan, S. Usage of Atmospheric Sounding to Characterize the Meteorological Events on the Night of 23/24 August 2022, Bulletin of the Polytechnic Institute of Iași, Mathematics. Theoretical Mechanics. Phys. Sect. 2022, 68, 33–62. [Google Scholar] [CrossRef]
- Copernicus. Available online: https://atmosphere.copernicus.eu/cams-european-air-quality-ensemble-forecasts-welcomes-two-new-state-art-models (accessed on 10 April 2023).
- ECMWF Forecasting Dust Storm. Available online: https://stories.ecmwf.int/forecasting-dust-storms/index.html (accessed on 10 April 2023).
- Karydis, V.A.; Kumar, P.; Barahona, D.; Sokolik, I.N.; Nenes, A. On the effect of dust particles on global cloud condensation nuclei and cloud droplet number. J. Geophys. Res. 2011, 116, D23. [Google Scholar] [CrossRef]
- Britannica. Available online: https://www.britannica.com/science/climate-meteorology/Scale-classes (accessed on 18 April 2023).
- European Drought Observatory. Available online: https://edo.jrc.ec.europa.eu/documents/news/GDO-EDODroughtNews202208_Europe.pdf (accessed on 30 March 2023).
- Northern Africa-Middle East-Europe (NA-ME-E) Regional Center. Available online: https://sds-was.aemet.es/forecast-products/dust-forecasts/ensemble-forecast (accessed on 18 April 2023).
- National Environmental Protection Agency. Available online: http://www.anpm.ro/ (accessed on 19 April 2023).
- Air Quality. Available online: https://www.calitateaer.ro/public/assessment-page/pollutants-page/?__locale=ro (accessed on 19 April 2023).
- Ministry on the Environment, Forest and Water. Available online: http://www.mmediu.ro/app/webroot/uloads/files/Ghid%20G1.pdf (accessed on 19 April 2023).
- Tian, X.; Cui, K.; Sheu, H.L.; Hsieh, Y.K.; Yu, F. Effects of Rain and Snow on the Air Quality Index, PM2.5 Levels, and Dry Deposition Flux of PCDD/Fs. Aerosol Air Qual. Res. 2021, 21, 210158. [Google Scholar] [CrossRef]
- Tîmpu, S.; Sfîca, L.; Dobri, R.V.; Cazacu, M.M.; Nita, A.I.; Birsan, M.V. Tropospheric Dust and Associated Atmospheric Circulations over the Mediterranean Region with Focus on Romania’s Territory. Atmosphere 2020, 11, 349. [Google Scholar] [CrossRef]
Disclaimer/Publisher’s Note: The statements, opinions and data contained in all publications are solely those of the individual author(s) and contributor(s) and not of MDPI and/or the editor(s). MDPI and/or the editor(s) disclaim responsibility for any injury to people or property resulting from any ideas, methods, instructions or products referred to in the content. |
© 2023 by the authors. Licensee MDPI, Basel, Switzerland. This article is an open access article distributed under the terms and conditions of the Creative Commons Attribution (CC BY) license (https://creativecommons.org/licenses/by/4.0/).