Abstract
This study investigates the main climatological features of extreme precipitation (TCER) induced by tropical cyclones (TCs) affecting Guangxi (GX), South China using multiple datasets and a 99th percentile threshold during 1981–2020, with an emphasis on the rainfall diversities of different high-impact TC groups and their associated mechanisms. Results show that there are large regional differences and a seasonal imbalance in the climatological features of TCER in GX. In summer (fall), TCs with TCER events primarily move northward or eastward (northwestward or westward), namely, S-NWTCs and S-ETCs (F-WTCs and F-NWTCs). The rainfall centers exhibit asymmetrical features with S-NWTCs and F-NWTCs located in the northeast quadrant, but S-ETCs and F-WTCs in the southwest and northeast quadrants, respectively. Comparisons of atmospheric circulations and environmental factors indicate that the intense rainfall of F-WTCs is mainly attributed to the trough–TC interaction, which is accompanied by stronger upper-level westerly jet and cold air intrusion, thus increasing baroclinic energy and uplifting for the strongest rainfall among these four groups. This interaction is absent for other groups due to a greater South Asian high and western North Pacific subtropical high. Instead, the increased rainfall in S-NWTCs and F-NWTCs can mainly be attributed to the stronger low-level southwesterly jet, which, in combination with low-level warm advection and convergence induced by land–sea friction, promotes the release of latent heat through moisture condensation. S-ETCs differ from S-NWTCs and F-NWTCs in that moisture convergence is weaker due to the much-weakened TC circulation.
1. Introduction
Landfalling tropical cyclones (TCs) tend to generate extreme rainfall, which usually leads to widespread floods and other secondary disasters such as landslides, causing enormous economic loss, including damage to properties and loss of lives in coastal areas [1,2]. For example, Typhoon Nina (1975) generated a record-breaking daily rainfall of 1062 mm in Henan province, China, which resulted in over 26,000 casualties and economic losses exceeding 10 billion Chinese yuan [3,4]. Similarly, Hurricane Harvey (2017) produced over 1000 mm of 5-day accumulated rainfall in a vast region of Texas, United States, resulting in 70 deaths and economic losses of 125 billion dollars [5,6]. More recently, Super Typhoon Lekima (2019) triggered a seven-day-long torrential rain in southeast China, causing 56 fatalities and economic losses of approximately 52 billion Chinese yuan [7]. Additionally, Khouakhi et al. [8] emphasized that TCs cause 35–50% of extreme rainfall in global regions. Therefore, knowledge of the extreme rainfall characteristics associated with landfalling TCs and their related mechanisms along coastal regions is crucial for both operational forecasting and disaster prevention.
TC-induced extreme rainfall (TCER) characteristics have been extensively studied in many regions, such as the southeastern United States [9,10], China and its specific regions [11,12,13,14,15], Australia [16], and the northern Philippines [17]. Among them, China is particularly vulnerable to TCs, and the changes in the spatial distributions and variabilities of TCER events over China have received considerable attention. Previous studies demonstrated that the TCER trend is obviously different in the Chinese mainland and Taiwan, with TCs accounting for 75–77% of the extreme hourly rainfall in Taiwan [11]. Likewise, in the coastal areas of southeastern China, TCER accounts for 40–50% of the total extreme precipitation, and the high-frequency and large TCER events (daily rainfall ≥ 100 mm) are concentrated in the coastline regions and decrease inland [12,15]. Li and Zhao (2022) [13] further revealed that TCER is distinct from the TC precipitation, with a concentrated distribution on the northeastern side of the TC center. H. Liu et al. (2022) [18] recently analyzed the characteristics of TC-induced extreme hourly precipitation over China and found that TCs with high extreme hourly precipitation make greater contributions to the total TC-induced extreme hourly precipitation over eastern and northeastern China, while TCs with low extreme hourly precipitation make a greater contribution over southern and southwestern China. These previous studies have provided a comprehensive understanding of TCER climatological characteristics in China overall and in specific regions (such as southeastern China). However, the specific spatiotemporal patterns of TCER events in South China remain unclear and require further investigation.
Many studies have shown that TC-induced rainfall is a result of the complex effects of TC intensity, TC motion, ambient vertical wind shear (VWS) and the underlying surface, and the complex interactions between TC and multi-scale atmospheric circulations [1,19,20]. Several studies have revealed that TC intensity and motion greatly influence the distributions and variabilities of TC-induced rainfall [21,22]. Slow-moving TCs are more conducive to producing TCER occurrences by prolonging their impact period [20,23,24,25,26,27]. Meanwhile, an average maximum of TC-induced rainfall is in the front quadrant but varies with TC intensity [22]. While stronger TCs often have larger axisymmetric total rain and a larger rain area than weaker TCs, stronger TCs occasionally have greater maximum rain rates for TCER [28]. Numerous studies have recently highlighted the importance of VWS in TC-related rainfall asymmetry [3,21,28,29,30,31,32,33,34]. S. S. Chen (2006) [29] identified that considerable VWS (>5 m s−1 in their study) dominates rainfall asymmetry. A further study by Wen et al. (2019) [35] also found that VWS is the key factor governing the TC rainfall asymmetry at landfall in Guangdong Province (GD), South China.
In addition to the VWS, some research stressed the importance of the underlying surface in TC-induced rainfall enhancement [12,18,19,36]. Coastal rainfall caused by TCs is primarily a result of the weakening wind over land that has a larger drag coefficient than the sea surface, which enhances lower-level convergence on the inland side at landfall [37]. Rainfall is thus enhanced on the windward side of mountains due to the enhanced convergence and topographic lifting [38,39]. Recent studies have discovered that TCER is mainly due to the combined uplifting and blocking effects of the topography and TCs tracks [12,36].
Moreover, the TC-induced precipitation patterns are also influenced by their interactions with environmental systems, such as the summer monsoon, water vapor transport, strong upper-level divergence, and the injection of cold air [1,40,41]. Among them, strong summer monsoons feed TC with sufficient moisture and unstable energy, substantially strengthening the convergence towards the TC center and triggering continuous rainfall [1,41,42]. Recently, Cai et al. (2023) [20] emphasized the key role played by a pronouncedly enhanced low-level jet before and during landfall, which leads to continuous precipitation. Additionally, in a study of rainfall reinforcement related to landfalling TCs in China, Dong et al. (2010) [1] noted that the interaction between a TC and a westerly trough or monsoon surge could result in the TC gaining baroclinic potential energy or latent heat, which in turn reinforces rainfall. However, fewer studies particularly address the causes of TCER events at different seasons, especially those occurring in South China, and this deserves further research.
Guangxi (GX) province, which is situated in the western region of southern China, with a coastline of 1628 km, and a population of over 50 million [43], frequently experiences TC damage, which is a substantial obstacle to economic and social growth. GX also is one of the three provinces in China with the highest average yearly economic loss as a result of TCs, which represent a significant threat to the inhabitants and economy of the area [43,44]. For instance, Super Typhoon Rammasun (2014) created severe disasters that at least 3.4 million people were affected by and resulted in an economic loss of more than 1.7 billion yuan in GX, with a maximum daily rainfall of 303.6 mm [43,45]. Fewer studies have examined the typical features of TCER occurrences in GX, despite earlier studies looking into TC-induced rainfall asymmetry in South China [20,28,32,33,35]. Research on TCER episodes in the fall, which can also result in catastrophic disasters, is particularly lacking [20,46,47]. Therefore, this study aims to fill this gap by analyzing long-term climatology and potential influencing factors linked to TCER events that affect GX, with different tracks in different seasons. The results of this study can help predictions of such disasters and serve as an outline for in-depth planning and risk mitigation in the area.
The rest of this paper is organized as follows. The data and methods are described in Section 2; the rainfall characteristics of TCER events and the rainfall differences for different high-impact TC groups by different tracks and seasons as well as different related fac-tors will be illustrated and discussed in Section 3; Section 4 further examines possible physical mechanisms modulating the TCER events in the summer and the fall, respectively; Section 5 presents a summary and some further discussions, including a conceptual framework.
2. Data and Methods
2.1. Data
The study uses gauge-based daily precipitation data provided by the China Meteorological Data Service Center with a total of 197 Chinese observational stations (the stations in South China, including Guangxi and Guangdong provinces and Hainan Island, are included in this research for getting better knowledge about the spatial distributions of TCER events, the locations of which are indicated in Figure 1) during 1981–2020. Daily precipitation is defined as the total amount of rainfall that falls between 1200 UTC on the day before and 1200 UTC on the current day. The best-track data for the same period is extracted from the Shanghai Typhoon Institute of the China Meteorological Administration (STI/CMA) [44,48], including the location of the TC center and the 2-min mean maximum sustained wind (MSW) at 10-m height near the TC center with an interval of 6 h. The 6-hourly atmospheric reanalysis data, including the geopotential height, zonal wind, meridional wind, vertical velocity, temperature, and specific humidity, are obtained from the fifth version of the European Centre for Medium-Range Weather Forecasts (ECMWF) reanalysis model (ERA5) [49] with a 1° × 1° interpolated grid spacing.

Figure 1.
(a) Topography (shaded, units: m) and locations of Chinese weather stations (black dots). The names of related provinces have been labeled in red. The tracks of TCs affecting Guangxi (GX) are shown in (b) for the summer and (c) for autumn during 1981–2020, with blue, black, and red lines representing the TCs moving northwestward (NWTCs), westward (WTCs), and eastward (ETCs), respectively. The solid lines denote the tropical cyclone (TC) with extreme rainfall (TCER).
2.2. Methods
This study includes both side-swiping TCs and landfalling TCs during 1981–2020 as affecting TCs in GX due to their potential to cause intense rainfall in the region. This classification is based on an official local standard for defining TCs affecting and landfalling in GX, which can be seen on the Guangxi Standards Information in Operation Service website (https://dbba.sacinfo.org.cn/stdDetail/4d8d346db9311499f4c3dd7758ca6c042655f5daf0a493140a1f4a48482c17ca, accessed on 8 July 2023). Only TCs named by meteorological agencies are considered, and a total of 149 TCs affecting GX, which mainly occurred in the summer (98 TCs, tracks shown in Figure 1b) and autumn (54 TCs, Figure 1c) over the period from 1981 to 2020 are recorded. These TCs move at high frequency in three main directions, including northwestward, westward, and eastward (shown in blue, black, and red in Figure 1b and 1c, respectively), and their definitions are based on the operational forecast guideline in South China. Westward tracks refer to the landing/affecting locations west or south of Zhanjiang City; northwestward tracks relate to the landfall positions from Zhanjiang City to west of the Pearl River Estuary; and southwestward tracks denote the landing locations east of the Pearl River Estuary [50]. These TCs with different tracks can lead to various rainfall distributions in GX [20]. The numbers and intensities of TCs affecting GX in summer and autumn with different tracks are shown in Table 1, which indicates that NWTCs occur most frequently in the summer with TCER events, while in autumn, WTCs appear most frequently with a stronger average TC intensity.

Table 1.
The basis characteristics of TCs affecting GX in summer and autumn during 1981–2020.
Due to the complex and varied topography in GX, precipitation exhibits a wide range of distributions across regions. To obtain a statistically significant number of TCER samples, this study utilizes the percentile-threshold method [13,18,27], which involves ranking the daily precipitation (≥0.1 mm) by precipitation intensity over a 30-year period (1991–2020) and selecting the precipitation intensity at the 99th percentile as the extreme threshold for each station (Figure 2a). To characterize TC-induced rainfall, this study uses a similar approach to that of Cai et al. (2023) [20]. Specifically, daily precipitation at a given station within a 500-km radius of the TC center on that day is used to detect a TCER event, which is identified when the daily rainfall caused by a TC exceeds a threshold at a single rain gauge station on that day. The maximum TCER day (TCMDR day) for each TC is defined as the day on which it produces its most significant TCER event. It is possible for TCER events to occur at multiple stations or on multiple days.
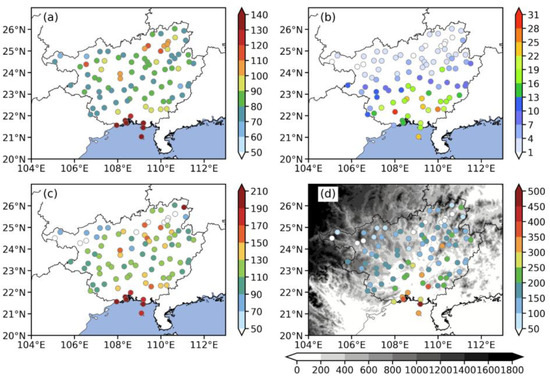
Figure 2.
Spatial distributions of the (a) 99th percentile threshold values of rainfall (mm d−1) from 1991 to 2020, (b) frequency (days), (c) average intensity (mm d−1), and (d) historical maximum (mm d−1) of TCER events affecting GX from 1981 to 2020. Gray shading in (d) represents topography.
The dynamic composite analysis mentioned by Li et al. (2004) [51] is also applied in this study by tracing the centers of selected TCs to investigate the main features of the atmospheric variables between the unfixed moving TCs. Because the rainfall data is at a daily scale, this study adapts the modified dynamic composite analysis employed in Cai et al. (2023) [20] and relocates the composite precipitation field or large-scale circulations using the average position of the centers of the composited TCs on the same day when discussing their daily patterns. The TC motion direction and moving speed at a given time are defined as the location vector and the spherical distance between 6 h before and at this moment. Additionally, the VWS is calculated by subtracting the averaged 850-hPa horizontal wind from the mean 200-hPa wind over a 5° × 5° square area centered on the LFSTY center [20,52].
3. Characteristics of TCER Events in GX
3.1. Climatological Characteristics of TCER Events in GX
Threshold values used to identify the TCER events (Figure 2a) vary significantly across the study area, with coastal regions and northeastern regions having higher values exceeding the heavy rainstorm threshold of 100 mm d−1, while most other regions only reach the rainstorm threshold of 50 mm d−1. The Dongxing station in coastal regions records the maximum TCER threshold of 166.9 mm, while the Longlin station in northwest GX records the lowest at 67.52 mm. With these thresholds, the frequency (Figure 2b) of TCER events exceeds 17 days in the southern regions and generally declines inland. The Shangsi Station (the red point in Figure 2b) has the highest frequency (i.e., 34 days) of TCER events, which is located near the coastline and mountains (terrains seen in Figure 2d). However, the absence of TCER events is found in some parts of northern GX, which is partly related to the high extreme precipitation threshold in this area.
The average rainfall intensity and the historical maximum of TCER events (Figure 2c,d) exhibit a similar geographic pattern to that of 99th-percentile threshold (Figure 2a), while the highest intensities (238.26 mm d−1) occur along the coastline of GX and rapidly decrease to about 80–90 mm d−1 over the northwestern inland regions, except for some scattered high-value stations in the northern part of GX. In addition, the maximum daily precipitation (TCMDR) greater than 250 mm d−1 is mainly distributed in the southern coastal stations of GX, with the maximum TCMDR occurring on 24 July 1981 at Beihai station (509.2 mm d−1), which was influenced by TC Maury (No. 198108).
This study also addresses the frequency of TCER events in each TC (Figure 3a). Statistically, there are 734 single-station TCER records from 1981 to 2020 triggered by a total of 77 TCs affecting GX, accounting for 51.7% of the total affecting TCs, with TC Haiyan (No. 201334) having the highest number of TCER events. On average, there are 9.5 TCER events per TC, and 31 TCs caused more than 10 TCER events over land during their lifecycle, while only 24 TCs resulted in more than 10 TCER events on their TCMDR days (listed in Table 2). Two TCs caused more than 30 extreme rainfall events, which accounts for more than 33.0% of total stations in GX, whereas only one TC caused more than 30 extreme rainfall events on its TCMDR day. Figure 3b further shows the frequency distribution of TCER events at different daily rainfall intensities. The frequency of TCER events reaches its highest value at the daily rainfall intensities of 80–90 mm and drops markedly as the daily rainfall increases. Additionally, 499 (68.0%) TCER events generate the daily rainfall exceeding the heavy rainstorm threshold, with 31 events reaching the extreme rainstorm threshold (250 mm d−1), which could cause severe disasters and require further study.
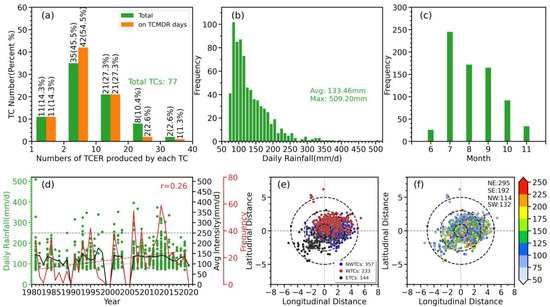
Figure 3.
(a) Frequency and percentage of stations exceeding extreme thresholds for the life cycle (green bars) and on the maximum TCER day (TCMDR; orange bars) in a single TC. (b) Histograms of the frequency distribution of TCER events. (c) Monthly variations of TCER frequency. (d) The time-intensity distribution (green dots), its interannual variation of the average intensity (black line) and frequency (red solid line), and its linear trend (red dashed line) of TCER events. (e) Locations of TCER for each type of track relative to the TC centers in GX, with the numbers of each type of track showing in the southeast corner. (f) The same as (e) but showing the rainfall intensity of TCER instead of tracks classifications, with the numbers of each quadrant showing in the northeast corner. The coordinate origin in (e,f) represents the average location of the TC center. The dashed circles denote the 1°, 3°, and 5° radial distance from the TC center (no more repeats in other Figures).

Table 2.
The top 24 TCs associated with the largest number of extreme rainfall (TCER) stations on the maximum rainfall day (TCMDR) in GX from 1981 to 2019. The word “F-WTC” means the TC occurs in the fall with a westward track, and “S-NWTC” means the TC occurs in the summer with a northwestward track, and so on. Chosen cases are marked in bold.
The annual TCER events, as depicted in Figure 3d, are intensely distributed since 1995 with an increasing trend during 1981–2020, which only passes the 90% confidence level with a mean frequency of about 18 events per year. The average TCER intensity is 113.6 mm d−1, with the highest intensity (176.9 mm d−1) occurring in 1997. However, the trend of TCER intensity is not significant. The monthly variation of TCER frequency presents a unimodal structure, with the highest number of events occurring in July and August, followed by September (Figure 3c). The seasonal distribution of TCER events is imbalanced, with 60.3% and 39.6% of events occurring in the summer and autumn, respectively. Additionally, the occurring seasons in the first 24 TCs (Table 2) also indicates that GX is vulnerable to TCER events in both summer and autumn. Statistics on the number and locations of TCER events with different tracks reveal that TCs with a northward track generate 48.6% of TCER events, and 76.1% among them are in the east side of TC center, whereas only 19.6% of TCER events are induced by TCs with a westward track, which are primarily located in the southeast quadrant (Figure 3e). Furthermore, statistics showed that 40.2% and 26.2% of TCER events occur in the northeast and southeast quadrants, respectively (Figure 3f). This is in line with the findings stated by Li and Zhao (2022) [13] and indicates that TCER events are more likely to occur in the northeast quadrant of the TC center. Nevertheless, the intense TCER events (i.e., >200 mm d−1) show a dispersed distribution in terms of location and distance from the TC center, which deserve further study by different categories. Based on these results, the study selects TCER samples from different categories for further analysis in the next section.
3.2. Rainfall Distributions of Four TCER Types in GX and Their Locations Relative to the Main Influencing Factors
As described in Section 3.1, the TCER events in the top 24 TCs (Table 2) can be classified into four types based on the seasons and TC tracks, including S-NWTCs, S-ETCs, F-WTCs, and F-NWTCs, which refer to summer TCs with northwestward and eastward tracks and fall TCs with westward and northwestward tracks, respectively. Additionally, considering the balance of the cases, each type of TC is selected only for the top five TCs (marked in bold in Table 2), except for F-NWTCs, which only includes four cases in the top 24 individual cases. The spatial distribution of mean accumulated precipitation for S-NWTCs and F-WTCs over their lifetimes are somewhat similar, with the magnitude of precipitation decreasing gradually from the coastal area toward the inland. S-ETCs and F-NWTCs have heavy precipitation centers situated near the coastal areas with a smaller magnitude, especially S-ETCs, whose maximum rainfall is less than 180 mm (Figure 4a–d). Similar distributions appear in the composite results of TC groups on TCMDR days, only with lower values. The dynamic composite precipitation distribution (Figure 4e–h) shows that the intense rainfall of all four types is mainly concentrated within 3° from the center with great asymmetries. The heaviest precipitation center is produced by F-WTCs, and it occurs in the northeast quadrant of the TC center, while S-ETCs produce the lowest maximum rainfall in the southwestern quadrant of the TC center. Both S-NWTCs and F-NWTCs generate rainfall centers in the southeastern quadrant. These differences are more clearly shown in their composite results on the TCMDR day (Figure 4m–p). Additionally, noticeable cyclonical or anticyclonically rotations of rainfall centers can be seen for these four groups with weaker rainfall intensities on the day before TCMDR day (Figure 4i–l) to stronger rainfall intensities on the TCMDR day (Figure 4m–o).
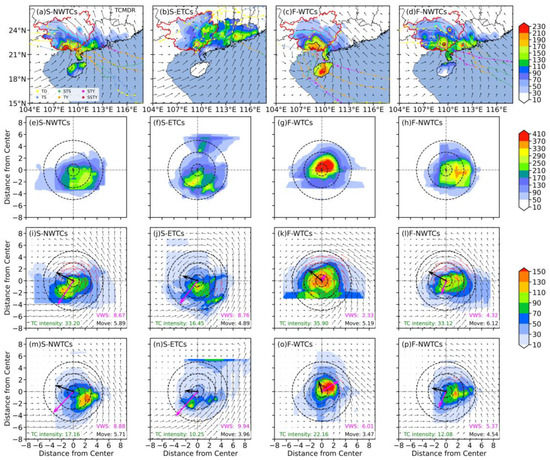
Figure 4.
(a–d) Spatial distribution of the mean accumulated precipitation (shaded; units: mm), the average rainfall on the TCMDR day (contours in cyan, magenta, and black representing 50, 100, and 150 mm, respectively), and the average 850 hPa wind field of (a) S-NWTCs, (b) S-ETCs, (c) F-WTCs, and (d) F-NWTCs; (e–h) the dynamic composite accumulated precipitation distribution (shaded; units: mm) relative to the average TC center; (i–l) and (m–p) are the same as (e–h), but for the average precipitation distribution on the day before the TCMDR day and on the TCMDR day, respectively, overlying the averaged 850 hPa wind field on the same day; black and magenta bold arrows represent TC motion and mean VWS, respectively. The mean values of VWS and motion speed are marked in the lower right corner. The tracks of each kind of TCs are shown in (a–d). Vectors with speeds greater than 12 m s−1 are depicted in red.
Furthermore, studies have shown that storm motion and a considerable VWS play important roles in the rainfall asymmetry as the rainfall maximum is placed on the front side relative to the track and the down-shear left or down-shear side relative to VWS [22,29,31,53]. A further study of the locations of rainfall centers relative to VWS and storm motion are also depicted in Figure 4. On the TCMDR day, the heaviest rainfall center for F-WTCs (Figure 4o) is in the front-right side of the motion vector with the weakest moving speed and the down-shear side of a considerable northeastward VWS (≥5 m s−1), while it is to the front-left side with a relatively stronger moving speed and to the down-shear left of the highest VWS for S-ETCs (Figure 4n). The moving speeds of F-WTCs and S-ETCs decrease remarkably on the TCMDR day (Figure 5b) with an average of 3.47 and 3.96 m s−1, respectively, which is conductive to the occurrence of TC-induced heavy rainfall, corresponding to previous studies [1,29]. This indicates that since S-ETCs and F-WTCs have movement speeds less than 4 m s−1, and the associated boundary friction relative to TC movement is less likely to be the main cause of the rainfall, the VWS of both groups may have a greater impact on rainfall enhancement than storm motion [19,21,29,31]. Nevertheless, in both groups with northwestward tracks, the most prominent rainfall is observed in the rear of the motion vector and in the upper-shear left of VWS (Figure 4m,p). As a result, the effects of storm motion and VWS for S-NWTCs and F-NWTCs are not evident in this study.

Figure 5.
Temporal evolutions of (a) the 2-min mean maximum wind speed (units: m s−1), (b) the speed of movement (blue; units: m s−1), and (c) VWS for the four TC groups. Grey vertical dash lines indicate the start and end time of the TCMDR day. Grey horizontal dash lines indicate the level of TD intensity (17.2 m s−1) and TY intensity (32.7 m s−1). The abscissa represents time relative to the beginning moment of the TCMDR day, and negative (positive) values denote the time before (after) that.
Apart from track factors and VWS, TCs’ intensity also plays an important role in the development of TCER. As illustrated in Figure 4m–p, F-WTCs that produce the heaviest rainfall happen at the stage of a severe tropical storm (STS, 24.5 ≤ maximum wind speed < 32.6 m s−1), and both groups with northwestward tracks are at the stage of a tropical storm (TS, with 17.2 ≤ maximum wind speed < 24.5 m s−1), while the S-ETCs group with the weakest rainfall is at the stage of tropical depression (TD, with maximum wind speed <17.2 m s−1). Besides, the temporal variations of the S-ETCs are significantly different from that in the other three types during the day before TCMDR to the TCMDR day, and the differences from S-NWTCs and F-WTCs, respectively, are statistically significant at a significant level of 0.01 based on the student’s t-test, implying that heavier TC rainfall in GX is associated with TCs with higher intensity. This positive relationship between TC-induced rainfall and TC intensity has been proven by many studies [28,54]. However, the fact that the gradual dissipation of S-ETCs cluster is also capable of producing strong rainfall demonstrates that there are other factors favorable for the formation of meso-convective systems. Figure 6 further shows the relationship between the positions of heavy rainfall and the terrain, as well as the average horizontal winds at a level of 850 hPa. On the TCER day, the average horizontal wind at 850 hPa for the S-ETCs is southwesterly (Figure 6f) with the weakest wind speed, which transports sufficient moisture at the windward side of mountains and interacts with the slow-moving TCs due to the blocking effect of high terrains, contributing to heavier TCER. On the contrary, the average low-level inner-core circulation of F-WTCs is located along the coastline with the strongest southeasterly winds in the northeastern quadrant of the TC center, where frequent TCER events are generated (Figure 6k), suggesting F-WTCs are also triggered by the surface frictional convergence due to the land–sea contrast and storm motion. But for S-NWTCs and F-NWTCs, an evident increase in rainfall center in more inland areas is more likely caused by the joint effects of the surface frictional convergence and the orographic lifting through southwesterly flows, as TCs move faster with almost 1.5 times the moving speed of F-WTCs.
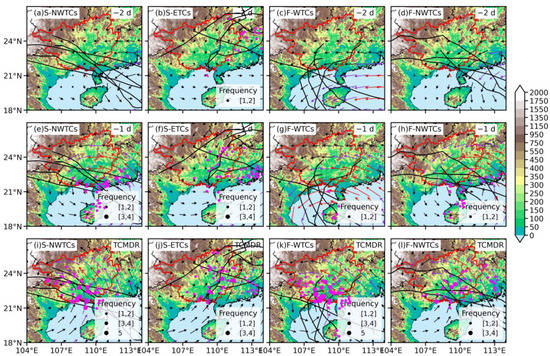
Figure 6.
Geographical distribution of topography (shaded, units: m), the frequency of TCER events (magenta dots, units: times), and wind fields (vectors, units: m s−1) at 850 hPa as well as the tracks (black lines) of (a) S-NWTCs, (b) S-ETCs, (c) F-WTCs, and (d) F-NWTCs (a–d) two days before TCMDR, (e–h) on the day before TCMDR, and (i–l) the TCMDR day, respectively. Vectors with speeds greater than 12 and 16 m s−1 are depicted in blue violet and red, respectively.
The results above show that there are great differences in the rainfall location, intensity, and evolutions of maximum precipitation associated with the four clusters in Guangxi. Therefore, it is important to determine why there are such dramatic discrepancies between these four groups. The preliminary analysis demonstrates that the rainfall distribution of F-WTCs is primarily caused by the conjunction effects of VWS, storm motion, and land–sea contrast. In contrast, the rainfall asymmetry in S-ETCs is mainly attributed to the effect of VWS with the weakest TC intensity owing to the blocking effect of mountains in the northeastern GX, and the rainfall asymmetry of S-NWTCs and F-NWTCs are a result of the combined effects of the atmospheric circulations, topography, and land–sea friction. Additionally, the magnitudes of S-NWTCs and F-NWTCs are different and require further investigation.
4. Analysis of the Related Large-Scale Environmental Conditions
4.1. Comparisons of Associated Atmospheric Circulations and Dynamic Conditions
To explore the possible mechanisms responsible for the different TCER characteristics between different groups, we further analyze the evolution of the low-, mid-, and upper-level atmospheric circulations of different groups in GX (Figure 7) with a focused period from two days before the TCMDR to the TCMDR day (referring to the focused period in the following text). In general, a good contrast is found among the environmental circulations of four TC groups at different levels.
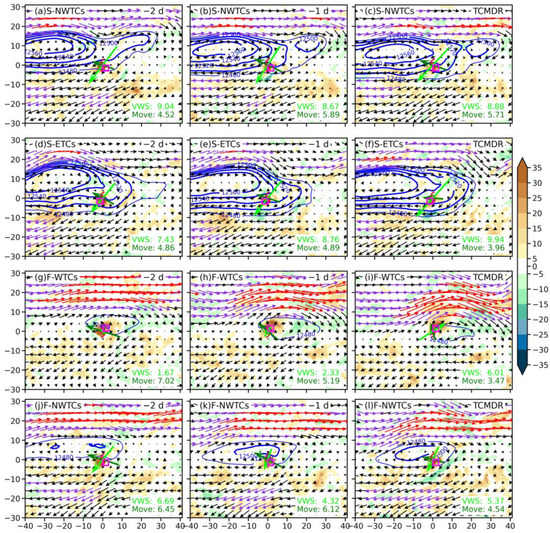
Figure 7.
Geopotential height (contours; units: gpm; values greater than 12,480 gpm are shown with an interval of 20 gpm), wind filed (vectors; units: m/s), and corresponding divergence (shaded; units: s−1) at 200-hPa for (a–c) S-NWTCs, (d–f) S-ETCs, (g–i) F-WTCs, and (j–l) F-NWTCs, respectively, on (a) two days before TCMDR, (b) the day before TCMDR, and (c) the TCMDR day. The magenta boxes indicate the rainfall center on the TCMDR day for each group in Figure 4m–p, respectively. Vectors with speeds greater than 30 and 48 m s−1 are depicted in blue violet and red, respectively. Black and magenta bold arrows represent TC motion and mean VWS, respectively.
At the 200-hPa pressure level (Figure 7), both summer groups, including S-NWTCs and S-ETCs, are under an extremely strong South Asian high (SAH), with its central geopotential height reaching 12,560 gpm. In contrast, the two fall groups, including F-WTCs and F-NWTCs, are under a remarkably weaker SAH, with the central geopotential height differences reaching 60 gpm compared with those in the summer types. Meanwhile, a noticeable divergence associated with the SAH belt mainly dominates the south of the TC center during the focused period, except for F-WTCs, whose divergence is located to the north. This strong divergence favors the maintenance of TC circulation as well as the growth of the lower-level convective systems below [55], and the location of strong divergence is consistent with the location of intense rainfall for each group (Figure 4). A further comparison is therefore conducted on the vertical structures of the divergence on the zonal vertical cross-section averaged over the rainfall centers (magenta boxes in Figure 7) for these four groups (Figure 8). A decrease of divergence occurs in the upper layers among these three days, which results in the weakening of upward motion accompanied by the decrease of convergence in the lower layers (Figure 8), except for the F-WTCs with an apparent updraft enhancement.
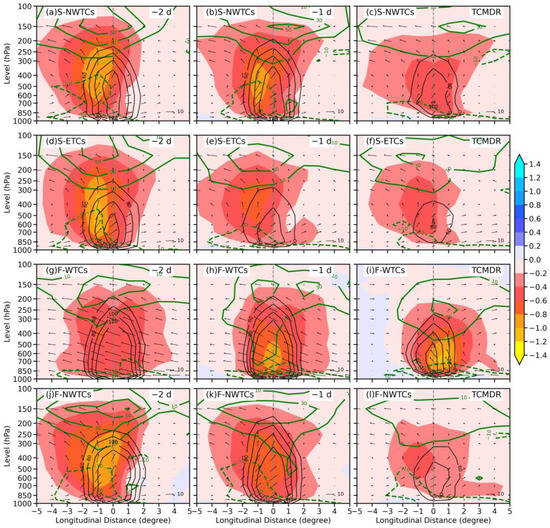
Figure 8.
Longitude–pressure cross-section of vertical velocity (shading; units: Pa s−1), vertical circulation (vectors; units: m s−1 for horizontal velocity and −10−1 Pa s−1 for omega), vorticity (black contours at 60, 80, 100, 120∙10−6 s−1), and divergence (green contours at every 20∙10−6 s−1; units: 10−6 s−1) averaged over magenta boxes in Figure 7 for (a–c) S-NWTCs, (d–f) S-ETCs, (g–i) F-WTCs, and (j–l) F-NWTCs, respectively, on (a) two days before TCMDR, (b) the day before TCMDR, and (c) the TCMDR day, respectively.
On the other hand, the F-WTCs group gradually approaches the south of the southwest jet axis in the upper layers, and its divergence zone is located in the northeast quadrant and to the right of the entrance region of the southwesterly jet in the upper atmospheric layers, which is a favorable area for ageostrophic-induced updrafts [1,56,57] accompanied by strong vorticity in the middle and lower troposphere, as illustrated in Figure 8g–i, contributing to the rainfall enhancement there (Figure 4o). Moreover, the direction of VWS (shown by the lime arrows in Figure 7) shifts from pointing northwest to pointing northeast, and the shear increases considerably from about 2 m s−1 to 6 m s−1. Therefore, the enhanced upper-level westerly jet for F-WTCs not only increases greatly the ambient VWS but also provides anomalous strengthened updrafts (Figure 8i), which together not only cause heavy rainfall but also tilt largely to the down-shear side under the influence of strong easterly VWS, contributing to the asymmetric distribution of heavy rainfall over the down-shear sector (Figure 4o).
On the contrary, the high-level westerly (easterly) jet stream for the other three groups is far north (south) of the TC, making it impossible for these groups to superimpose with the high-latitude westerly stream (low-latitude easterly stream), and thus the VWS still points toward the southwest. Meanwhile, the VWS of the S-ETCs increases to 9.94 m s−1 as this much-weakened TC circulation moves westward toward GX and gradually becomes looser and weaker under the influence of the mountains (Figure 6j). This strengthened VWS tilts the updrafts to the down-shear side and places the intense rainfall in the outer rainbands on the down-shear left. This result is consistent with previous studies [21,55,58] and further demonstrates that for a loosely organized cyclone, even under weakened dynamic conditions, the configuration of a strong VWS and a slow movement can be able to tile the largely weakened updrafts to the overlapping area of the down-shear-left side and the front side (i.e., east of the TC center), and this results in an asymmetrically intense rainfall on this region.
However, for the S-NWTCs and F-NWTCs, although their TC intensities are also reduced and accompanied by weakened dynamical conditions on the TCMDR day, their weakened dynamical conditions are less skewed on the down-shear side. Moreover, strong wind shears that are in the opposite direction of the storm movement disrupt convection around the center of the TC, which further prohibit the asymmetrical distribution of heavy rainfall on the down-shear left [59]. Thus, S-NWTCs tend to develop a dynamical condition that concentrates on the east side, causing stronger precipitation on the southeast side of the TC center (Figure 4m). This suggests that the landfalling weakened storm with a northwestward track does not collocate well with the environmental systems when there is a lack of upper-level jet and strong updrafts, and thus VWS has a relatively small effect on precipitation distribution.
Atmospheric fields at the 500-hPa level also showed clear differences among these four categories (Figure 9). The four categories of TCs are mainly controlled by the western North Pacific subtropical high (WNPSH), and they move westward and northwestward under the easterly steering airflows (vectors not shown in Figure 9) in the southern periphery of WNPSH during the focused period. The strength of the WNPSH varies among the four TC categories, with the S-NWTCs and F-NWTCs having stronger WNPSH than S-ETCs and F-WTCs (Figure 9). Moreover, F-WTCs are superimposed with a midlatitude trough (Figure 9i) with a larger frontal zone to the right of the TC center in the lower levels (Figure 10i), creating a favorable dynamical environment for asymmetric extreme rainfall over the down-shear left sector because the interaction between the TC and a westerly trough could increase the baroclinic potential energy of TC. This is consistent with the findings of Dong et al. (2010) [1]. Besides, the approaching of a frontal zone further promotes an intrusion of cold air in the lower and middle layers (Figure 10h,i), which is also favorable for lifting the warm air and enhancing the atmospheric instability and release of potential energy (Dong et al., 2010) [1], thereby increasing upward motion near the front, leading to an enhancement of precipitation there. Therefore, one of the key characteristics of F-WTCs is the superimposition of the TC and westerly trough, which combine with the enhanced upper-level jet, providing favorable dynamic conditions for rainfall intensification. However, the other three groups do not show similar signals for the TC-trough interaction as F-WTCs, but they have a stronger low-level jet channel (Figure 9), which provides sufficient low-level moisture transport (Figure 11), thus contributing to the rainfall enhancement. On the other hand, F-WTCs almost lose their low-level jet due to the withdrawal of the summer monsoon when these TCs landfall and the weakened WNPSH, leading to a substantial difference in moisture transport in the lower troposphere (Figure 11i).
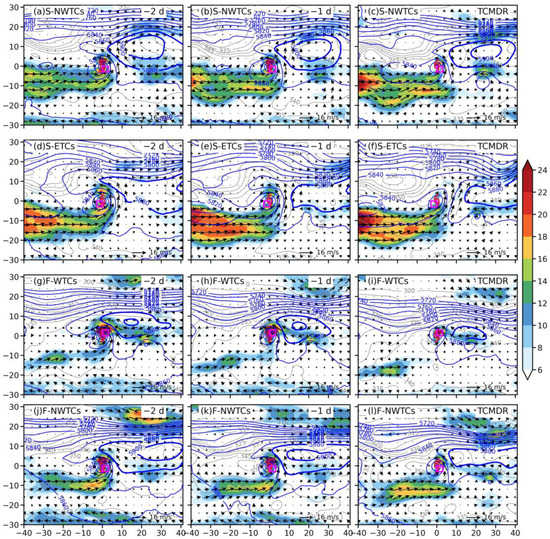
Figure 9.
The 500-hPa geopotential height (blue contours; units: gpm; values greater than 5720 gpm are shown with an interval of 20 gpm), the 850-hPa equivalent potential temperature (gray contours at every 5 kelvins; units: kelvin), and 850-hPa horizontal wind (shaded and vectors; units: m s−1) for (a–c) S-NWTCs, (d–f) S-ETCs, (g–i) F-WTCs, and (j–l) F-NWTCs, respectively, on (a) two days before TCMDR, (b) the day before TCMDR, and (c) the TCMDR day.
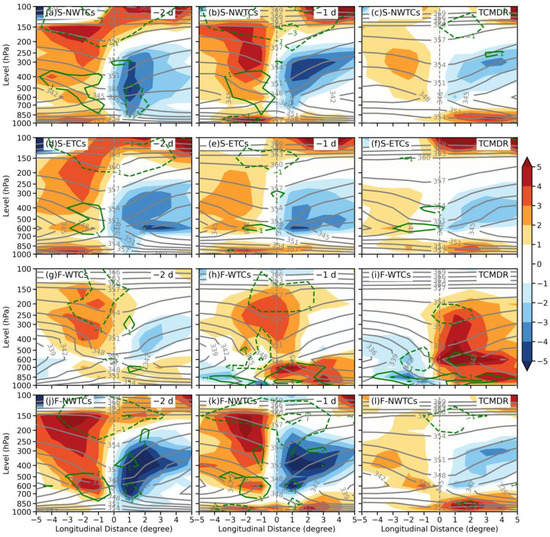
Figure 10.
Longitude–pressure cross-section of the temperature advection (shading; units: K d−1), the 850-hPa equivalent potential temperature (gray contours at every 5 kelvins; units: kelvin), and frontogenesis (green contours; units: k d−1 100 km−1) averaged over magenta boxes in Figure 7 for (a–c) S-NWTCs, (d–f) S-ETCs, (g–i) F-WTCs, and (j–l) F-NWTCs, respectively, on (a) two days before TCMDR, (b) the day before TCMDR, and (c) the TCMDR day, respectively.
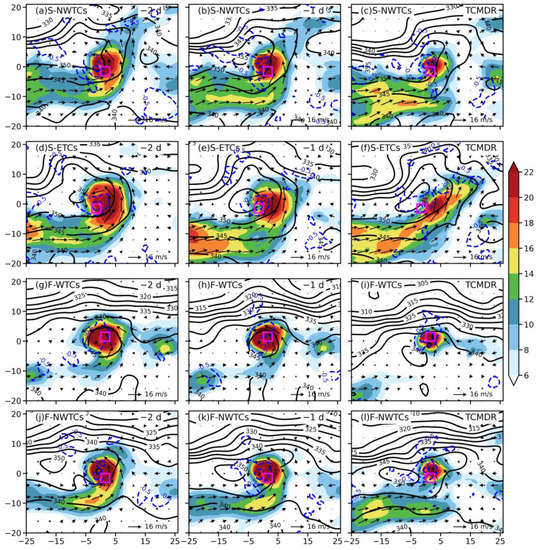
Figure 11.
The water vapor flux (shading and vectors; units: g cm−1 s−1 hPa−1) and its corresponding divergence (blue contours; units: 10−7 g cm−2 s−1 hPa−1; only those values less than −0.5∙10−7 g cm−2 s−1 hPa−1 are plotted with an interval of 2∙10−7 g cm−2 s−1 hPa−1), as well as 850-hPa equivalent potential temperature (black contours; units: Kelvin) for (a–c) S-NWTCs, (d–f) S-ETCs, (g–i) F-WTCs, and (j–l) F-NWTCs, respectively, on (a) two days before TCMDR, (b) the day before TCMDR, and (c) the TCMDR day.
4.2. Comparisons of Associated Thermodynamic Conditions
TCs would typically dissipate rapidly after landfall because of the cut-off of energy supply from ocean-surface evaporation and the effects of land surface friction. Correspondingly, the TC-related precipitation will certainly attenuate as a result of the cut off moisture supply from the ocean, unless TC can continuously obtain moisture to intensify rainfall. Therefore, a further comparison about moisture conditions is demonstrated here.
From the day before TCMDR to the TCMDR day, there exist great moisture fluxes and a long channel of moisture transport (defined as the region where moist flux exceeds 12 g hPa−1 cm−1 s−1) from the Bay of Bengal for S-ETCs and S-NWTCs (Figure 11a–f), which are conducive to the sustained moisture influx of the TC, resulting in an increase in the 700-hPa relative humidity (Figure 12a–f) during these three days, especially for S-NWTCs with an average enhancement of more than 10% (Figure 12a–c). In contrast, F-NWTCs and F-WTCs experience a breakdown in the moisture transport channel originating in the Bay of Bengal and the western North Pacific (WNP), especially for F-WTCs (Figure 11h,i) with the smallest moisture transport fluxes, but still have moisture fluxes around the TC center (Figure 11g–l). The mid-troposphere relative humidity for these two groups (Figure 12g–l) increases dramatically around and to the north of the TC center, where strong water vapor convergence occurs, contributing to the occurrence of heavy rainfall. Besides, the moisture convergence in F-WTCs extends up to 700 hPa on the TCMDR day compared to the previous two days (Figure 13c). Consequently, the rainfall center of F-WTCs is situated exactly at the maximum centers of daily mean moisture fluxes and water vapor convergence, as well as the strengthened mid-troposphere relative humidity (Figure 11g–i and Figure 12g–i), which together create a favorable environmental background and rich moisture supply for the occurrence of the strongest rainfall among these four groups (Figure 4m–p).
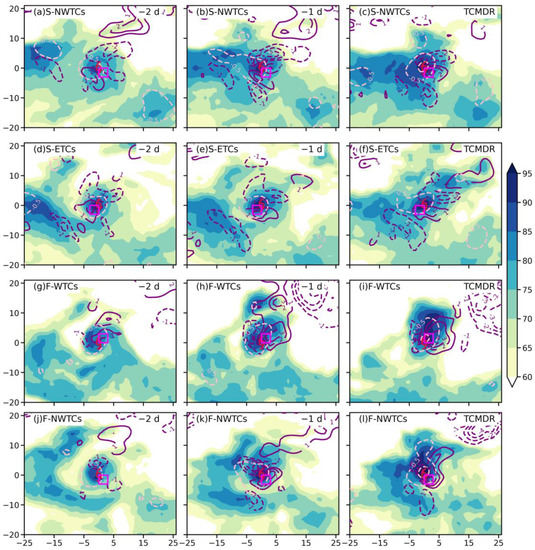
Figure 12.
The relative humidity (shading; units: %) and water vapor divergence (pink contours; units: 10−7 g cm−2 s−1 hPa−1; only those values less than −0.5·10−7 g cm−2 s−1 hPa−1 are plotted with an interval of 2∙10−7 g cm−2 s−1 hPa−1), as well as 850-hPa temperature advection (purple contours; units: K d−1) for (a–c) S-NWTCs, (d–f) S-ETCs, (g–i) F-WTCs, and (j–l) F-NWTCs, respectively, on (a) two days before TCMDR, (b) the day before TCMDR, and (c) the TCMDR day.
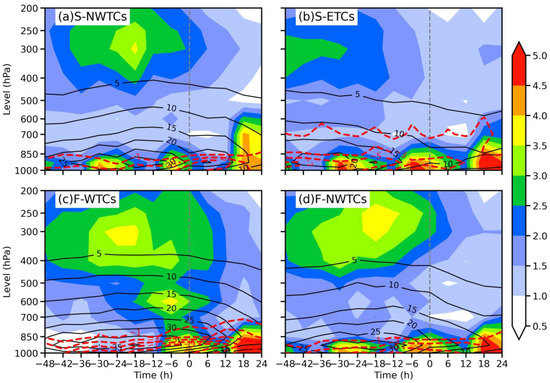
Figure 13.
Vertical-time diagrams of the maximum temperature anomalies (shaded; units: K) and the water vapor flux (black contours; units: g cm−1 s−1 hPa−1) and its corresponding divergence (red contours; units: 10−7 g cm−2 s−1 hPa−1; only those values less than −0.5∙10−7 g cm−2 s−1 hPa−1 are plotted with an interval of 2∙10−7 g cm−2 s−1 hPa−1) averaged over magenta boxes in Figure 7 for (a) S-NWTCs, (b) S-NWTCs, (c) F-WTCs, and (d) F-NWTCs. Grey dash lines indicate the start time of the TCMDR day.
Although S-NWTCs and F-NWTCs also have remarkable moisture fluxes and moisture convergence, the maximum moisture supply and convergence primarily occur to the west and north of the intense rainfall center, resulting in weaker precipitation compared to F-WTCs (Figure 12a–c,j–l). Furthermore, compared to F-NWTCs, the moisture supply in S-NWTCs is maintained for longer periods, the moisture convergence extends upward to a higher level, and the relative humidity is more enhanced (Figure 12a–f), leading to a distinctly heavier rainfall (Figure 4m).
On the contrary, S-ETCs have limited moisture fluxes and channels of moisture transport, resulting in a relatively small increase in relative humidity value (Figure 12d–f) over its intense rainfall center. Accordingly, the release of latent heat is much weaker, which is barely enough to maintain the high-level warm core (Figure 13b, defined as the difference between the temperature of each grid on a given layer and the average temperature over the typhoon range on the same layer) that is a result of latent heat release and subsidence heating in the eye area. This weakens TC intensity and further reduces the intensity and area of TC-induced rainfall considerably compared to the other three groups. Note that the moisture convergence on the TCMDR day is stronger for these four groups than the other two days, which may partly explain why the rainfall on the TCMDR day is heaviest among these three days.
In addition to the large-scale circulations and moisture conditions, ambient temperature and equivalent potential temperature () also contribute to intensifying TC-induced precipitation [19,59]. The distributions of horizontal temperature advection at 850-hPa for four groups shows that the two summer groups have similar patterns of horizontal thermal advection, with the S-NWTCs group has a stronger warm advection located farther east than the S-ETCs group, resulting in noticeably stronger rainfall in its southeastern quadrant (Figure 4m). Notably, heavy precipitation appears to correspond well where the warm advection overlaps with the strong convergence center. Stronger rain shifts from the southwestern quadrant to the southeastern quadrant for S-NWTCs and S-ETCs (Figure 4i,j). In contrast, for the autumn groups, cold advection and warm advection develop over the western and eastern sides, respectively, with the F-WTCs group experiencing a stronger temperature advection dipole due to the combined effect of dry, cold air intrusion and strong frontogenesis. This enhances the thermal effect on vertical velocity distribution (Figure 9h,i) and can be seen from the vertical profile of both ambient temperature and in the F-WTCs group (Figure 10g–i). After a cold air intrusion, the increases with heights, indicating somewhat convectively stable conditions in the troposphere, which may be caused by the active convection that neutralizes moist instability (Ninomiya 1980) [60].
For groups without dry, cold air intrusion, the vertical gradient of —an index for conditional instability—is stronger on the left side than the right side on the day before TCMDR, and this remains almost unchanged for S-ETCs on the TCMDR day due to weaker warm advection and the offset of adiabatic cooling by latent heat release through water vapor condensation. Additionally, the overlapping area between decreasing with height and lifting aligns well with the location of heavy rainfall, suggesting a strong conditional instability remains for the occurrence of deep moist convection on that day.
However, for S-NWTCs and F-NWTCs, the strong negative gradient of is located on the right side, resulting from favorable convective instability and adiabatic updrafts created by the low-level warm advection with an amplitude of 4 K d−1, along with weak cold advections in the middle layers. These factors provide favorable latent heat release from water vapor condensation, which in return increases the convective instability and shifts stronger rain to the southeastern quadrant for S-NWTCs and F-NWTCs, but no such signals are seen in the S-ETCs cases.
From the above analyses, we can thus conclude that the intensity and distribution of rainfall associated with TCs are controlled by a combination of different factors. For westward-moving cases, rainfall centers tend to situate in the southwest quadrant of the TC due to the combined effects of favorable warm and moist southeasterly flow and topographical lifting. For westward-moving TCs in the fall, the rainfall centers tend to situate in the southeast quadrant of the TC as a result of the TC–trough interaction, which provides favorable dynamic and thermal conditions for extreme rainfall. However, for eastward-moving TCs in the summer, rainfall centers tend to situate in the northeast quadrant of the TC, especially when the TC is dissipated. This is attributed by the combined effective coupling of much-weakened TC circulation, VWS, and favorable warm and moist southeasterly flow, as well as topography.
5. Conclusions
This study makes use of the TC best-track dataset, the daily rain gauge data from the China Meteorological Administration, and the ERA5 reanalysis data set to explore the primary climatological features of TCER affecting GX, South China during 1981–2020. The TCER threshold for each single station is defined as the 99th percentile of daily precipitation. This study focuses on the rainfall evolutions of different high-impact TC groups by seasons and tracks, as well as the influence of relevant large-scale factors on the diversities of their rainfall evolutions. The following results are summarized in this study.
The results show that TCER events have a significant group occurrence and exhibit great regional heterogeneities in terms of frequency, intensity, and historical maximum. On average, there are 9.5 TCER events per TC, but only 24 TCs resulted in more than 10 TCER events on their maximum TCER day (namely, TCMDR day). There is also an imbalance in the seasonal distribution of TCER, with 60.3% and 39.6% of the events affecting the summer (whose tracks are to the northwest or east) and autumn (whose tracks are to the northwest or west), respectively. The strong TCER events (i.e., >200 mm d−1) show a dispersed distribution both in terms of location and distance to the TC center and deserve further study in separate categories.
High-impact TCs are grouped into four types (S-NWTCs, S-ETCs, F-WTCs, and F-NWTCs) based on their tracks and occurring seasons, exhibiting great differences in rainfall location, intensity, and evolutions. Generally, the mean accumulated precipitation of S-NWTCs and F-WTCs and the rainfall on the TCMDR day decrease gradually from the coastal area to inland areas, while the intense precipitation centers of S-ETCs and F-NWTCs are located near coastal areas with less precipitation, especially the S-ETCs with the smallest maximum rainfall. Besides, the precipitation patterns show clear asymmetry with a noticeable rotation of the rainfall center for these four groups, with weaker intensities on the day before the TCMDR day to stronger intensities on the TCMDR day. However, the precipitation centers of the westward-moving F-WTCs are mainly located in the northeast quadrant with a range of 0–3° from the TC center, whereas the most prominent rainfall center of S-NWTCs and F-NWTCs is in the southeast quadrant at 1–3° from the center, but the heavy rainfall center produced by S-ETCs is mainly confined in the southwestern quadrant of the cyclone on the TCMDR day.
This study further illustrates a conceptual framework for understanding the major differences in dominant mechanisms for rainfall asymmetry concerning these four groups. As shown in Figure 14c, F-WTCs have the strongest rainfall among these four groups due to their interaction with a midlatitude trough, which leads to an enhanced upper-level westerly jet, a dry, cold air intrusion in the lower and middle layers, and strong frontogenesis, together with the land–sea contrast and local orography, creating favorable dynamical and thermodynamic conditions for upward transportation of water vapor and the longest maintenance of the prevailing high-level warm core, which is in favor of slowing down the declining rate of TC after landfall [61], thus maintaining the TC intensity for a longer period after landfall. The longer duration of F-WTCs allows for a continuous and sufficient supply of water vapor, leading to the occurrence of asymmetric rainfall distribution over the down-shear-left sector with the strongest rainfall among these four groups.
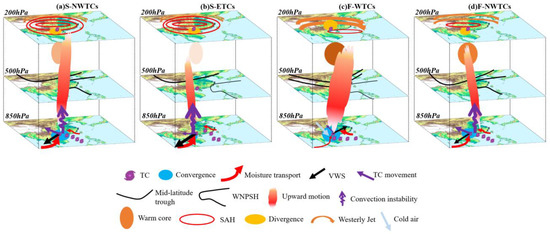
Figure 14.
Schematic diagram showing the influencing factors on the rainfall diversities associated with (a) S-NWTCs, (b) S-NWTCs, (c) F-WTCs, and (d) F-NWTCs over GX.
However, the other three groups fail to interact with the mid-latitude westerly trough, cold air intrusion, or the upper-level jet stream due to the stronger SAH and relatively strong WNPSH (Figure 14a,b,d). This leads to a weakening of TC circulation with time and an enhanced VWS, resulting in a rapidly weakening warm core structure, especially the S-ETCs, which prohibits the maintenance of TC intensity. S-ETCs have a larger channel of moisture fluxes in the lower layers in conjunction with a slower movement due to the blocking effect of mountains, thus resulting in a highly moist and unstable environment. This favorable thermodynamic condition together with the favorable topographic lifting and the strongest VWS associated with the much-weakened TC may lead to the rainfall enhancement of S-ETCs over the down-shear-left region.
S-NWTCs and F-NWTCs (Figure 14a,d) differ from S-ETCs in that the upward transportation of moisture and moisture convergence is stronger due to the stronger TC circulation in conjunction with convergence induced by land–sea friction and topographical lifting, which together are favorable for the release of latent heat through moisture condensation, increasing the convective instability and promoting the long-term maintenance of the warm core structure. Accompanied by a strong VWS and fast-moving track, the rainfall occurs in the overlapping area of horizontal warm advection and strong convergence as well as updrafts. S-NWTCs (Figure 14a) generate heavier rainfall due to a stronger low-level southwesterly jet and more sufficient water vapor supply compared with F-NWTCs (Figure 14d).
According to these analyses, there are different forecasting considerations for TCER events with different tracks over different seasons. For the westward type in the autumn, forecasters should carefully examine whether the TC will interact with the westerly trough, cold air intrusion, and upper-level jets, and consider the maintenance of the moisture supply and the underlining terrain. For the eastward type in the summer, they should pay more attention to the effects of TC circulation, VWS, and a monsoon surge, as well as the topographic impact. For the northwestward type, they should pay more attention to a monsoon surge as well as the topographic impact. Nevertheless, further analysis should be performed to quantify the relative contributions of these factors and to build a forecast model by using machine learning methods to forecast TCER events.
Author Contributions
Conceptualization, C.Y. and F.Z.; methodology, Y.C.; software, Q.L.; validation, H.H., C.H., W.Q. and C.Y.; formal analysis, Y.C.; investigation, Y.C.; resources, F.Z.; data curation, Q.L.; writing—original draft preparation, Y.C.; writing—review and editing, all authors; visualization, H.H., C.H., W.Q. and C.Y.; supervision, F.Z. and C.Y.; project administration, Q.L.; funding acquisition, Y.C., H.H., C.H., and W.Q.; All authors have read and agreed to the published version of the manuscript.
Funding
This study is funded by the Natural Science Foundation of Guangxi (Grant No. 2023GXNSFBA026346), the Science and Technology Program of Guangxi (Grants No. GuikeAB21075005, GuikeAB21075008), the Innovation Group of Southern Marine Science and Engineering Guangdong Laboratory (Zhuhai) (Grant 311021001), and Laboratory of Beihai National Climate Observatory (Grants No. BNCO-N202301 and BNCO-S202301).
Institutional Review Board Statement
Not applicable.
Informed Consent Statement
Not applicable.
Data Availability Statement
The STI/CMA best-track dataset is available at (https://tcdata.typhoon.org.cn/en/index.html, accessed on 8 July 2023). The precipitation data are obtained from China Meteorological Data Service Center (http://data.cma.cn/en, accessed on 8 July 2023). The ERA5 reanalysis data are available from (https://cds.climate.copernicus.eu/cdsapp#!/home, accessed on 8 July 2023).
Conflicts of Interest
The authors declare no conflict of interest.
References
- Dong, M.; Chen, L.; Li, Y.; Lu, C. Rainfall Reinforcement Associated with Landfalling Tropical Cyclones. J. Atmos. Sci. 2010, 67, 3541–3558. [Google Scholar] [CrossRef]
- Chen, L.; Ding, Y. An Introduction to the Western Pacific Typhoons; Science Press: Beijing, China, 1979. (In Chinese) [Google Scholar]
- Chen, Q.; Fang, J. Effects of Vertical Wind Shear on Intensity and Structure of Tropical Cyclone. J. Trop. Meteorol. 2012, 18, 172–186. [Google Scholar]
- Yang, L.; Liu, M.; Smith, J.A.; Tian, F. Typhoon Nina and the August 1975 Flood over Central China. J. Hydrometeorol. 2017, 18, 451–472. [Google Scholar] [CrossRef]
- Galarneau, T.J.; Zeng, X. The Hurricane Harvey (2017) Texas Rainstorm: Synoptic Analysis and Sensitivity to Soil Moisture. Mon. Weather Rev. 2020, 148, 2479–2502. [Google Scholar] [CrossRef]
- Klotzbach, P.J.; Schreck, C.J.; Collins, J.M.; Bell, M.M.; Blake, E.S.; Roache, D. The Extremely Active 2017 North Atlantic Hurricane Season. Mon. Weather Rev. 2018, 146, 3425–3443. [Google Scholar] [CrossRef]
- Wu, Z.; Huang, Y.; Zhang, Y.; Zhang, L.; Lei, H.; Zheng, H. Precipitation Characteristics of Typhoon Lekima (2019) at Landfall Revealed by Joint Observations from GPM Satellite and S-Band Radar. Atmos. Res. 2021, 260, 105714. [Google Scholar] [CrossRef]
- Khouakhi, A.; Villarini, G.; Vecchi, G.A. Contribution of Tropical Cyclones to Rainfall at the Global Scale. J. Clim. 2017, 30, 359–372. [Google Scholar] [CrossRef]
- Shepherd, J.M.; Grundstein, A.; Mote, T.L. Quantifying the Contribution of Tropical Cyclones to Extreme Rainfall along the Coastal Southeastern United States. Geophys. Res. Lett. 2007, 34, 1–5. [Google Scholar] [CrossRef]
- Knight, D.B.; Davis, R.E. Contribution of Tropical Cyclones to Extreme Rainfall Events in the Southeastern United States. J. Geophys. Res. Atmos. 2009, 114, 1–17. [Google Scholar] [CrossRef]
- Chang, C.P.; Lei, Y.; Sui, C.H.; Lin, X.; Ren, F. Tropical Cyclone and Extreme Rainfall Trends in East Asian Summer Monsoon since Mid-20th Century. Geophys. Res. Lett. 2012, 39, 1–6. [Google Scholar] [CrossRef]
- Qiu, W.; Ren, F.; Wu, L.; Chen, L.; Ding, C. Characteristics of Tropical Cyclone Extreme Precipitation and Its Preliminary Causes in Southeast China. Meteorol. Atmos. Phys. 2019, 131, 613–626. [Google Scholar] [CrossRef]
- Li, Y.; Zhao, D. Climatology of Tropical Cyclone Extreme Rainfall over China from 1960 to 2019. Adv. Atmos. Sci. 2022, 39, 320–332. [Google Scholar] [CrossRef]
- Zhao, S.S.; Wang, X.L. Decadal Variations of Extreme Tropical Cyclones Influencing China during 1949–2009. Adv. Clim. Chang. Res. 2012, 3, 121–127. [Google Scholar] [CrossRef]
- Su, Z.; Ren, F.; Wei, J.; Lin, X.; Shi, S.; Zhou, X. Changes in Monsoon and Tropical Cyclone Extreme Precipitation in Southeast China from 1960 to 2012. Trop. Cyclone Res. Rev. 2015, 4, 12–17. [Google Scholar] [CrossRef]
- Villarini, G.; Denniston, R.F. Contribution of Tropical Cyclones to Extreme Rainfall in Australia. Int. J. Climatol. 2016, 36, 1019–1025. [Google Scholar] [CrossRef]
- Racoma, B.A.B.; Klingaman, N.P.; Holloway, C.E.; Schiemann, R.K.H.; Bagtasa, G. Tropical Cyclone Characteristics Associated with Extreme Precipitation in the Northern Philippines. Int. J. Climatol. 2022, 42, 3290–3307. [Google Scholar] [CrossRef]
- Liu, H.; Huang, X.; Fei, J.; Zhang, C.; Cheng, X. Characteristics and Preliminary Causes of Extremely Persistent Heavy Rainfall Generated by Landfalling Tropical Cyclones Over China. Earth Space Sci. 2022, 9, e2022EA002238. [Google Scholar] [CrossRef]
- Deng, D.; Ritchie, E.A. Rainfall Mechanisms for One of the Wettest Tropical Cyclones on Record in Australia-Oswald (2013). Mon. Weather Rev. 2020, 148, 2503–2525. [Google Scholar] [CrossRef]
- Cai, Y.; Yao, C.; Lu, X.; Zheng, F.; Qin, W. Dynamic Comparative Analysis of Different Types of Precipitation Caused by Landfalling Strong Typhoons over South China. Atmos. Res. 2023, 289, 106740. [Google Scholar] [CrossRef]
- Corbosiero, K.L.; Molinari, J. The Effects of Vertical Wind Shear on the Distribution of Convection in Tropical Cyclones. Mon. Weather Rev. 2002, 130, 2110–2123. [Google Scholar] [CrossRef]
- Lonfat, M.; Marks, F.D.; Chen, S.S. Precipitation Distribution in Tropical Cyclones Using the Tropical Rainfall Measuring Mission (TRMM) Microwave Imager: A Global Perspective. Mon. Weather Rev. 2004, 132, 1645–1660. [Google Scholar] [CrossRef]
- Su, S.-H.; Kuo, H.-C.; Hsu, L.-H.; Yang, Y.-T. Temporal and Spatial Characteristics of Typhoon Extreme Rainfall in Taiwan. J. Meteorol. Soc. Jpn. 2012, 90, 721–736. [Google Scholar] [CrossRef]
- Chien, F.-C.; Kuo, H.-C. On the Extreme Rainfall of Typhoon Morakot (2009). J. Geophys. Res. Atmos. 2011, 116, D05104. [Google Scholar] [CrossRef]
- Wu, D.; Zhao, K.; Jou, B.J.-D.; Lee, W.-C. Radar Observation of Precipitation Asymmetries in Tropical Cyclones Making Landfall on East China Coast. Trop. Cyclone Res. Rev. 2013, 2, 81–95. [Google Scholar] [CrossRef]
- Chen, L.; Xu, Y. Review of Typhoon Very Heavy Rainfall in China. Meteorol. Environ. Sci. 2017, 40, 3–10. (In Chinese) [Google Scholar] [CrossRef]
- Liu, L.; Wang, Y. Trends in Landfalling Tropical Cyclone-Induced Precipitation over China. J. Clim. 2020, 33, 2223–2235. [Google Scholar] [CrossRef]
- Yu, Z.; Wang, Y.; Xu, H.; Davidson, N.; Chen, Y.; Chen, Y.; Yu, H. On the Relationship between Intensity and Rainfall Distribution in Tropical Cyclones Making Landfall over China. J. Appl. Meteorol. Climatol. 2017, 56, 2883–2901. [Google Scholar] [CrossRef]
- Chen, S.S.; Knaff, J.A.; Marks, F.D., Jr. Effects of Vertical Wind Shear and Storm Motion on Tropical Cyclone Rainfall Asymmetries Deduced from TRMM. Mon. Weather Rev. 2006, 134, 3190–3208. [Google Scholar] [CrossRef]
- Yuan, J.; Zhou, W.; Huang, H.; Liao, F. Observational Analysis of Asymmetric Distribution of Convection Associated with Tropical Cyclones “Chanchu” and “Prapiroon” Making Landfall along the South China Coast. J. Trop. Meteorol. 2010, 16, 171–180. [Google Scholar] [CrossRef]
- Xu, W.; Jiang, H.; Kang, X. Rainfall Asymmetries of Tropical Cyclones Prior to, during, and after Making Landfall in South China and Southeast United States. Atmos. Res. 2014, 139, 18–26. [Google Scholar] [CrossRef]
- Wen, G.; Liu, C.; Bi, X.; Huijun, H. A Composite Study of Rainfall Asymmetry of Tropical Cyclones after Making Landfall in Guangdong Province. J. Trop. Meteorol. 2017, 23, 417–425. [Google Scholar] [CrossRef]
- Yu, Z.; Wang, Y.; Xu, H. Observed Rainfall Asymmetry in Tropical Cyclones Making Landfall over China. J. Appl. Meteorol. Climatol. 2015, 54, 117–136. [Google Scholar] [CrossRef]
- Chan, K.T.F.; Chan, J.C.L.; Wong, W.K. Rainfall Asymmetries of Landfalling Tropical Cyclones along the South China Coast. Meteorol. Appl. 2019, 26, 213–220. [Google Scholar] [CrossRef]
- Wen, G.; Huang, G.; Huang, H.; Liu, C.; Bi, X. Observed Rainfall Asymmetry of Tropical Cyclone in the Process of Making Landfall in Guangdong, South China. Int. J. Climatol. 2019, 39, 3379–3395. [Google Scholar] [CrossRef]
- Jiang, X.; Ren, F.; Li, Y.; Qiu, W.; Ma, Z.; Cai, Q. Characteristics and Preliminary Causes of Tropical Cyclone Extreme Rainfall Events over Hainan Island. Adv. Atmos. Sci. 2018, 35, 580–591. [Google Scholar] [CrossRef]
- Miller, B. Rainfall Rates in Florida Hurricanes. Mon. Weather Rev. 1958, 86, 258–264. [Google Scholar] [CrossRef]
- DeHart, J.C.; Houze, R.A. Orographic Modification of Precipitation Processes in Hurricane Karl (2010). Mon. Weather Rev. 2017, 145, 4171–4186. [Google Scholar] [CrossRef]
- Yu, C.K.; Cheng, L.W. Radar Observations of Intense Orographic Precipitation Associated with Typhoon Xangsane (2000). Mon. Weather Rev. 2008, 136, 497–521. [Google Scholar] [CrossRef]
- Chan, J.C.L.; Liu, K.S.; Ching, S.E.; Lai, E.S.T. Asymmetric Distribution of Convection Associated with Tropical Cyclones Making Landfall along the South China Coast. Mon. Weather Rev. 2004, 132, 2410–2420. [Google Scholar] [CrossRef]
- Yan, L.; Zhou, Y.; Liu, X.; Huang, Y.; Wang, Y. Comparative Analyses of the Heavy Rainfall Associated with Landfalling Tropical Cyclones SOULIK (1307) and MARIA (1808) with Similar Routes. Atmos. Res. 2022, 271, 106124. [Google Scholar] [CrossRef]
- Zhao, D.; Yu, Y.; Chen, L. Impact of the Monsoonal Surge on Extreme Rainfall of Landfalling Tropical Cyclones. Adv. Atmos. Sci. 2021, 38, 771–784. [Google Scholar] [CrossRef]
- Zhang, C.; Lai, S.; Zheng, F.; He, L.; Luo, X.; Huang, C.; Zhou, X.; He, H. Impact of Thermal Forcing over the Southeast of the Tibetan Plateau on Frequency of Tropical Cyclones Affecting Guangxi during Boreal Summer. Atmosphere 2023, 14, 18. [Google Scholar] [CrossRef]
- Lu, X.; Yu, H.; Ying, M.; Zhao, B.; Zhang, S.; Lin, L.; Bai, L.; Wan, R. Western North Pacific Tropical Cyclone Database Created by the China Meteorological Administration. Adv. Atmos. Sci. 2021, 38, 690–699. [Google Scholar] [CrossRef]
- Huang, Y.; Jin, L.; Zhao, H.S.; Huang, X.Y. Fuzzy Neural Network and LLE Algorithm for Forecasting Precipitation in Tropical Cyclones: Comparisons with Interpolation Method by ECMWF and Stepwise Regression Method. Nat. Hazards 2018, 91, 201–220. [Google Scholar] [CrossRef]
- Wang, B.; Wei, M.; Hua, W.; Zhang, Y.; Wen, X.; Zheng, J.; Li, N.; Li, H.; Wu, Y.; Zhu, J.; et al. Characteristics and Possible Formation Mechanisms of Severe Storms in the Outer Rainbands of Typhoon Mujiga (1522). J. Meteorol. Res. 2017, 31, 612–624. [Google Scholar] [CrossRef]
- Chen, X.; Xue, M.; Fang, J. Rapid Intensification of Typhoon Mujigae (2015) under Different Sea Surface Temperatures: Structural Changes Leading to Rapid Intensification. J. Atmos. Sci. 2018, 75, 4313–4335. [Google Scholar] [CrossRef]
- Ying, M.; Zhang, W.; Yu, H.; Lu, X.; Feng, J.; Fan, Y.; Zhu, Y.; Chen, D. An Overview of the China Meteorological Administration Tropical Cyclone Database. J. Atmos. Ocean. Technol. 2014, 31, 287–301. [Google Scholar] [CrossRef]
- Hersbach, H.; Bell, B.; Berrisford, P.; Hirahara, S.; Thépaut, J. The ERA5 Global Reanalysis. Q. J. R. Meteorol. Soc. 2020, 146, 1999–2049. [Google Scholar] [CrossRef]
- Luo, X.; Yao, C.; Tan, J. Analysis on Numbers and Intensity Characteristics of Typhoon Landed in the South China. Mar. Forecast. 2018, 35, 58–67. (In Chinese) [Google Scholar] [CrossRef]
- Li, Y.; Chen, L.; Wang, J. The Diagnostic Analysis on the Characteristics of Large Scale Circulation Corresponding to the Sustaining and Decaying of Tropical Cyclone after It’s Landfall. Acta Meteorol. Sin. 2004, 62, 167–179. (In Chinese) [Google Scholar] [CrossRef]
- Xiao, Z.; Yao, C.; Luo, X.; Sun, H. A Comparative Study on the Offshore Intensification of Supertyphoon Rammasun (2014) and Typhoon Rumbia (2013): The Role of Summer Monsoon. Asia-Pac. J. Atmos. Sci. 2021, 57, 405–420. [Google Scholar] [CrossRef]
- Chen, L.; Li, Y.; Cheng, Z. An Overview of Research and Forecasting on Rainfall Associated with Landfalling Tropical Cyclones. Adv. Atmos. Sci. 2010, 27, 967–976. [Google Scholar] [CrossRef]
- Liu, B.; Zhu, C. Boosting Effect of Tropical Cyclone “Fani” on the Onset of the South China Sea Summer Monsoon in 2019. J. Geophys. Res. Atmos. 2020, 125, e2019JD031891. [Google Scholar] [CrossRef]
- Feng, X.; Shu, S. How Do Weak Tropical Cyclones Produce Heavy Rainfall When Making Landfall over China. J. Geophys. Res. Atmos. 2018, 123, 11830–11848. [Google Scholar] [CrossRef]
- Rossby, C.G. On the Mutual Adjustment of Pressure and Velocity Distributions in Certain Simple Current Systems II. J. Mar. Res. 1938, 1, 239–263. [Google Scholar] [CrossRef]
- Sechrist, F.S.; Whittaker, T.M. Evidence of Jet Streak Vertical Circulations. Mon. Weather Rev. 1979, 107, 1014–1021. [Google Scholar] [CrossRef]
- Gao, S.; Meng, Z.; Zhang, F.; Bosart, L.F. Observational Analysis of Heavy Rainfall Mechanisms Associated with Severe Tropical Storm Bilis (2006) after Its Landfall. Mon. Weather Rev. 2009, 137, 1881–1897. [Google Scholar] [CrossRef]
- Shu, S.; Feng, X.; Wang, Y. Essential Role of Synoptic Environment on Rainfall Distribution of Landfalling Tropical Cyclones Over China. J. Geophys. Res. Atmos. 2018, 123, 11285–11306. [Google Scholar] [CrossRef]
- Ninomiya, K. Enhancement of Asian Subtropical Front Due to Thermodynamic Effect of Cumulus Convections. J. Meteorol. Soc. Jpn. 1980, 58, 1–15. [Google Scholar] [CrossRef]
- Braun, S.A. High-Resolution Simulation of Hurricane Bonnie (1998). Part II: Water Budget. J. Atmos. Sci. 2006, 63, 43–64. [Google Scholar] [CrossRef]
Disclaimer/Publisher’s Note: The statements, opinions and data contained in all publications are solely those of the individual author(s) and contributor(s) and not of MDPI and/or the editor(s). MDPI and/or the editor(s) disclaim responsibility for any injury to people or property resulting from any ideas, methods, instructions or products referred to in the content. |
© 2023 by the authors. Licensee MDPI, Basel, Switzerland. This article is an open access article distributed under the terms and conditions of the Creative Commons Attribution (CC BY) license (https://creativecommons.org/licenses/by/4.0/).