Article

An Analysis for the Applicability of Global Precipitation Measurement Mission (GPM) IMERG Precipitation Data in Typhoons

1
Fujian Provincial Key Laboratory of Hazardous Weather, Fuzhou 350028, China
2
Fujian Meteorological Observatory, Fuzhou 350028, China
3
Fujian Provincial Meteorological Bureau, Fuzhou 350007, China
*
Author to whom correspondence should be addressed.
Atmosphere 2023, 14(8), 1224; https://doi.org/10.3390/atmos14081224
Submission received: 10 May 2023 / Revised: 6 July 2023 / Accepted: 25 July 2023 / Published: 29 July 2023

Abstract

:
This study selected examples of 17 typhoons that landed in Fujian after passing through Taiwan. The study evaluated the precipitation in different time scales and the spatial distribution of daily precipitation of varying magnitudes in the southeastern coastal area by comparing satellite precipitation estimation products with meteorological observation station data. The evaluation used a correlation coefficient, mean relative error, relative bias, and graded assessment indexes (probability of detection, false alarm rate, and critical success index). Correlation coefficient analysis revealed that maximum daily precipitation performed best, followed by process total precipitation. The relative bias indicates that the precipitation estimated by the satellite is lower than the rainfall recorded by the automatic weather station. Mean relative error analysis showed that hourly precipitation had the highest error, followed by maximum daily precipitation. The GPM IMERG precipitation products’ retrieval of daily precipitation of varying magnitudes was assessed using three indicators. The assessment revealed that the satellite had a low under-reporting rate for light rain events but a high under-reporting rate for torrential rain events, especially extremely heavy rainstorm events, in terms of probability of detection. For the false alarm rate, the satellite had a small probability of false predictions for light rain events, while extremely heavy rainstorm events had the highest probability. For the critical success index, the satellite’s estimation of light rain events was basically consistent with reality; however, its ability to estimate precipitations above rainstorm levels was low. The results of the spatial assessment of heavy precipitation show that the satellite’s ability to detect heavy precipitation’s structure, intensity, and location is fair and has some reference value, especially for regions where conventional information is scarce.

1. Introduction

The availability of dependable and precise precipitation data at regional and global levels is essential for the utilization of meteorology. Two methods of detecting precipitation are direct observation with equipment such as ground-based rain gauges and raindrop spectrometers, and indirect estimation using satellite and weather radar data. Ground-based rain gauges provide the most accurate data but have the drawbacks of spatial discontinuity, uneven distribution, and lack of spatial representation [1,2,3,4,5,6]. Raindrop spectrometers can detect the average diameter of precipitation particles, raindrop number concentration, liquid water content, and precipitation intensity, but they also have spatial discontinuity characteristics. Both instruments need to be calibrated. A weather radar has a high temporal and spatial resolution but is limited in its observation range and can be easily blocked by mountains and tall buildings. In addition, strong winds and heavy rainfall can damage the above observation instruments in extreme weather conditions [7]. On the other hand, satellites detect from outside the earth and are not affected by bad weather, and have the advantages of a wide observation range and all-weather observation. Moreover, satellite observation’s temporal and spatial resolution has improved significantly in recent years, making it a popular choice [8,9].
Researchers commonly use satellite data products such as Tropical Rainfall Measurement Mission (TRMM), Climate Prediction Center morphing technique (CMORPH) precipitation, CloudSat data, and Cloud-Aerosol Lidar with Orthogonal Polarization (CALIOP) for their studies [10]. The TRMM satellite ceased its observation mission in April 2015. It was replaced by the Global Precipitation Measurement (GPM) satellite, a joint program sponsored by NASA and the Japan Aerospace Exploration Agency. The GPM program includes satellites from multiple countries to provide global precipitation and snowfall observations. The new generation of the satellite precipitation algorithm IMERG (Integrated Multi-satellite Retrievals for GPM) combines the advantages of Remotely Sensed Information Using Artificial Neural Networks Cloud Classification System, CMORPH, and TRMM Multi-satellite Precipitation Analysis. Meteorologists have increasingly used GPM satellite precipitation products for their studies in recent years. Caracciolo et al. (2018) [11] assessed the reliability of GPM precipitation products over the two largest Mediterranean islands. They found that GPM satellite data correlate well with measured data but could be less effective in coastal areas [11]. The satellite precipitation data effectively improve the detection of weak precipitation (less than 0.5 mm/h), solid rain, and microphysical processes of precipitation particles [10,12]. Recent researchers evaluated the performance of IMERG products in coastal regions, Qinghai-Tibet Plateau, the Tianshan region, and major watersheds in China. They found that GPM IMERG products made more significant progress with higher accuracy at low latitudes [7,10,13,14].
Observation of typhoons is essential due to their destructive nature, and satellite data have become an indispensable tool for analyzing them, given the scarcity of sea observation data. Meteorologists are increasingly using satellite data for typhoon-related research. However, its application in China is still in the exploratory and promotional stages, particularly for studying typhoon precipitation. Lu Meiqi and Wei Ming (2017) used GPM data to analyze the distribution and vertical structure of rainfall of Typhoon Rainbow, which is beneficial for monitoring and warning against typhoons from the perspective of remote sensing [15]. Fang Mian et al. (2020) analyzed the precipitation structure of Typhoon Maria based on GPM satellite data, despite the limitation of the satellite’s scan width only partially covering the typhoon range [16]. Yu et al. (2020) also used GPM data to analyze the microscopic characteristics of Typhoon 1909 “Lekima” [17].
Based on the studies mentioned above, since the successful launch of the GPM core observation platform and the availability of shared precipitation data, researchers both in China and internationally have conducted numerous evaluations of GPM precipitation products, primarily utilizing statistical analysis methods to evaluate the effectiveness of GPM satellite precipitation products [18,19,20,21]. The evaluation primarily focuses on the performance of satellite precipitation products through direct comparison with ground-based observations. In typhoon research, scholars typically evaluate satellite precipitation products using specific typhoon cases but rarely assess the GPM satellite-estimated precipitation products for a specific category of typhoons. The scarcity of offshore observations often leads to directly using satellite data for analysis. However, there is a lack of literature reviewing and summarizing the performance assessment of GPM typhoon precipitation products. In the interest of rigorous scientific research, understanding and mastering the data performance can enhance the reliability of precipitation products. The southeast coastal areas of China are the most severely affected regions by typhoons. According to statistics, over 70% of the typhoons that made landfall in the southeast coastal areas of China from 1949 to 2019 passed through Taiwan Island. Among these typhoons, 90% brought heavy rain to southeast coastal areas, with 80% caused by re-landing on the mainland. Therefore, this study evaluates the error of GPM precipitation data in southeast coastal areas (Fujian Province and surrounding provinces) by taking 17 typhoons that passed Taiwan Island and landed in Fujian as examples.

2. Data and Methods

2.1. Data

The study used GPM IMERG Final Run precipitation data obtained from NASA (https://pmm.nasa.gov/ (accessed on 15 October 2022)) with a spatial resolution of 0.1° × 0.1° and a coverage range from 60° N to 60° S in latitude. Compared with ground meteorological station hourly precipitation data, the half-hourly GPM IMERG products were combined to obtain hourly precipitation data.
National meteorological stations are responsible for exchanging regional and national weather information and serve as central entities in the national weather and climate station network. Observations from regional weather automatic stations primarily serve weather services within their respective provinces and local areas; they complement the national weather and climate station network observations. Since 2007, automatic stations have been constructed in Fujian Province. Over 3000 regional automatic stations and 126 national meteorological stations (Figure 1a) provided by the Fujian Meteorological Bureau are used to obtain hourly precipitation data in Fujian Province and its neighboring provinces. The measured rainfall at ground rain gauge sites was used as a reference value to evaluate the estimated rainfall from the GPM satellite.
The GPM IMERG products are grid data, while ground rain gauges are point data. These two types of data have distinct types and spatial scales. The ground meteorological station data was interpolated into grid points with a grid distance of 0.1° × 0.1° longitude and latitude using an inverse distance weighting interpolation method. This method obtains precipitation that is consistent with the satellite product’s grid points. Although interpolation may introduce some errors, this study did not consider this difference. The grid area for comparison between these two datasets consists of 1900 grid points, as illustrated in Figure 1b. Numerous mountain ranges characterize the study area, and Figure 1c illustrates the topographic height distribution of Fujian and its surrounding provinces.
The typhoon data used in this study were obtained from the Shanghai Typhoon Institute of the China Meteorological Administration, which provided a dataset of typhoon paths and intensities at 6 h intervals from 2007 to 2021. The term “typhoon” refers to the general term for tropical cyclones, including all levels of tropical cyclones. This study focuses on 17 typhoons that passed through Taiwan and landed in Fujian. Table 1 lists their beginning and ending times, durations, and landfall information. This paper examines the typhoons that traverse Taiwan Island and land in Fujian Province. Seventeen such typhoons occurred between 2007 and 2021 (Figure 2). These seventeen typhoons follow a northwest landfall trajectory, ranging in intensity from tropical storm (TS) to typhoon (TY), with an average intensity of 28.4 m/s. Among them, typhoon 1011 exhibited the highest landfall intensity at 35 m/s.
This study defines daily precipitation as the accumulation of hourly rainfall within 24 h at grid points. Maximum daily precipitation (MDP) is the accumulation of rainfall from 00:00 UTC on one day to 00:00 UTC on the next day or from 12:00 UTC on a day until 12:00 UTC on the following day during the typhoon influence period. In the case of a typhoon lasting for multiple days, the cumulative precipitation over 24 h was calculated using the method above. To calculate this, identify the day with the highest rainfall as the MDP for the typhoon. If the typhoon affects a single day or less, consider that day as the MDP for the typhoon.
The typhoon impact period is defined as the time when the typhoon results in rainfall exceeding 0.1 mm at more than one station within the study area. Due to the disparity in time length between the GPM IMERG precipitation data and the ground precipitation data, this paper considers the typhoon impact period as the overlapping period determined by the above-mentioned method. Process total precipitation (PTP) is the accumulation of hourly rainfall during the typhoon influence period at grid points. Seventeen typhoons landed in the study area, resulting in 39 days of precipitation. On average, each typhoon had an impact of 2.3 days. Typhoon 1111 had the longest impact, lasting five days, while Typhoons 1709 and 1710 had the shortest impact, lasting only one day.

2.2. Methods

A correlation analysis was performed on GPM IMERG precipitation data and ground rainfall data using three statistical indices: relative bias (RB), mean relative error (MRE), and correlation coefficient (R) to assess the accuracy of satellite precipitation. RB ranges from −1 to 1, where values closer to zero indicate greater proximity to actual precipitation, negative values indicate underestimation, and positive values indicate overestimation. Therefore, the accuracy of satellite precipitation increases as RB approaches zero [22,23]. The MRE is calculated as the average of the relative errors, and the mean relative error is expressed as an absolute value. A smaller MRE indicates higher accuracy in satellite-estimated precipitation [24]. R measures the consistency between satellite-estimated precipitation and rain gauge observations, with a range of −1 to 1. The closer the absolute value of R is to 1, the better the estimation effect. A better inversion effect is indicated by lower RB and MRE values and higher R values. The formulas for the three statistical indicators are as follows [25]:
R B = ( I M E R G g a u g e ) g a u g e
M R E = I M E R G g a u g e N g a u g e
R = C o v ( I M E R G , g a u g e ) σ I M E R G σ g a u g e
The gridded value of precipitation estimated by the GPM satellite is represented by IMERG, while the gridded value of ground rainfall is represented by gauge. N represents the number of grids, Cov (IMERG, gauge) represents the covariance, and σ represents the standard deviation.
The performance evaluation of satellite precipitation products across different rainfall levels involves the adoption of three classification indicators: probability of detection (POD), false alarm ratio (FAR), and critical success index (CSI). These indicators are applied based on the meteorological division of daily rainfall levels to assess the ability of satellite precipitation data in estimating daily rainfalls within five levels, namely, light rain (0.1 mm ≤ R24 < 10 mm), moderate rain (10 mm ≤ R24 < 25 mm), heavy rain (25 mm ≤ R24 < 50 mm), torrential rain (50 mm ≤ R24 < 100 mm), and extremely heavy rainstorm (R24 ≥ 100 mm). A high POD value indicates a lower likelihood of missed precipitation events [26], while a low FAR value indicates a lower probability of false precipitation predictions. A high CSI value indicates a higher skill score for accurately estimating precipitation events by the satellite precipitation product. The formula for calculating these indices is as follows [25]:
P O D = H H + M
F A R = F H + F
H represents the frequency of cases where both satellite precipitation and ground rain rate values are greater than 0, while F represents the frequency of cases where only the satellite precipitation value is greater than 0 and the ground rain rate value equals 0. M represents the frequency of cases where the satellite precipitation value equals 0 and the ground rain rate value is greater than 0. POD, FAR, and CSI values range from 0 to 1, with ideal values being POD = 1, FAR = 0, and CSI = 1.
The SAL method quantitatively examines precipitation’s structure, amplitude, and location. The study area’s precipitation field is analyzed for uniformity, average amplitude, and center-of-mass distribution properties. Deviation properties, including uniformity, average amplitude, and distance, are also examined. The SAL algorithm calculates the values of precipitation structure (S), amplitude (A), and location (L) based on the center of gravity of the precipitation fall area [27,28,29,30]. The calculation formula is as follows:
Structural deviation equation:
S = 2 V ( R I M E R G ) V ( R g u a g e ) D ( R I M E R G ) + D ( R g u a g e )
V ( R I M E R G ) is the weighted average of the satellite precipitation field, and V ( R g u a g e ) is the ground-based precipitation observation field average.
Amplitude deviation equation:
A = 2 D ( R I M E R G ) D ( R g u a g e ) D ( R I M E R G ) + D ( R g u a g e )
In the equation above, D ( R I M E R G ) represents the average value of the satellite precipitation field; D ( R g u a g e ) represents the average value of the ground-based live observation of precipitation.
Location deviation equation:
L = L 1 + L 2
L 1 = x ( R I M E R G ) x ( R g a u g e ) d m a x
L 2 = 2 r ( R I M E R G ) r ( R g a u g e ) d m a x
In the given equation, x ( R I M E R G ) represents the center of gravity location of the primary satellite precipitation field; x ( R g a u g e ) denotes the center of gravity location of the primary ground precipitation live observation field; d m a x represents the maximum distance among non-missing measurement grid points within the region; r is the weighted average of the total precipitation of m precipitation individuals.
The S value does not have a fixed interval; a positive S value indicates that the satellite precipitation range is larger than the actual situation, the rainfall value of the precipitation center is smaller than the actual situation, or both. Conversely, a negative S value indicates that the satellite precipitation range is smaller than the actual situation, the maximum precipitation is larger than the actual situation, or both. The L value ranges from 0 to 2; when the center of gravity of the main body of satellite precipitation coincides with the actual situation, the L value is 0. The closer the two positions are, the closer the L value is to 0. The closer the three values are to 0, the better the forecast effect.
This paper focuses on grid points with PTP and daily rainfall of strong rainstorms exceeding 50 mm for the SAL test.

3. Results and Discussion

3.1. Evaluation of the Satellite Precipitation Product on Different Time Scales

Seventeen typhoon cases were selected to verify the ability of satellite precipitation products to estimate typhoon precipitation. The test was divided into three parts: PTP, MDP, and hourly precipitation (HP). Figure 3a provides a box plot of the R. The average R for MDP has the best performance, reaching 0.66; PTP ranks second with a value of 0.61; and HP has the lowest value at 0.28. The median of the R for the PTP is 0.61, with a maximum of 0.89 (Typhoon 0716), followed by 0.81 (Typhoon 1011), and a minimum of 0.31 (Typhoons 1709 and 1111); the median R for MDP is 0.68, slightly higher than that for PTP; in contrast, the HP median R (0.25) is significantly lower than those for PTP and MDP, but its leading R reaches as high as 0.82 (Typhoon 1307). Thus, it can be concluded that satellite-based products performed best in terms of accuracy when estimating maximum daily rainfall from typhoons. Comprehensive assessment of typhoon precipitation estimation at different time scales, with the highest being Typhoon 1307, shows its different time scale precipitation and ground rainfall R reaches 0.74, 0.74, and 0.82, respectively; followed by 1410, where R is 0.61, 0.70, and 0.72, respectively.
Figure 3b presents precipitation’s RB at different time scales. Its mean and median are both below 0, indicating that satellite precipitation products underestimate actual precipitation, similar to the RMSE results; the RB of PTP is close to 0 in both its mean and median, suggesting minimal deviation between both datasets, and when the RB is closer to 0, it indicates higher accuracy of the precipitation data evaluated by satellite precipitation products. However, its RB for hourly precipitation deviates significantly from 0, indicating that satellite precipitation products underestimate it much more than process and maximum daily rainfall. Analysis of the relative bias (RB) of typhoons at different time scales reveals that the RB for 1307 and 1601 is closest to 0.
The box plot of mean relative error (MRE) (Figure 3c) indicates that process precipitation has the lowest mean value of MRE at 0.27, followed by maximum daily precipitation at 0.34, and the highest mean value of 0.70 is observed for hourly precipitation. The MRE for process precipitation reflects the smallest error between GPM IMERG satellite precipitation estimation and ground precipitation, indicating the highest accuracy in its estimation. The MRE indicates that satellite estimation of maximum daily precipitation has slightly lower accuracy than process precipitation. The combination of the three statistical indicators in Figure 3 demonstrates that satellite estimation of process precipitation generally has higher accuracy than maximum daily precipitation. However, the estimation ability of hourly precipitation is weak.
Analysis shows that the effect of GPM satellite estimation of HP is not good, so the hourly precipitation is accumulated hour by hour to obtain the evolution characteristics of two kinds of precipitation data, as shown in Figure 4. During the period affected by the typhoon, the R between the two kinds of precipitation data is high, with an average value of 0.92 (median value is 0.96), indicating that there is a high consistency between them and GPM IMERG satellite estimation has a good effect. Except for Typhoon 1111, which has a correct satellite estimation, three typhoons have positive RB values (1709, 1601, and 1209), which indicates that satellites overestimated precipitation, while for the rest of the typhoons, RB has negative values indicating that satellites underestimated precipitation, with 1513, 0908, and 0808 having the most severe underestimation.
The mean relative error (MRE) has a mean value of 0.72. Among the typhoons, 1307 has the lowest MRE of 0.15 (Figure 4i), indicating the highest accuracy in satellite precipitation estimation. Typhoon 0807 follows with an MRE of 0.38 (Figure 4o). Among the typhoons, 76% have an error level above 0.5. Typhoons 0908 and 0808 exhibit MRE values greater than 1, indicating weak satellite precipitation estimation.

3.2. Evaluation of the Satellite Precipitation Product on Different Rainfall Intensity

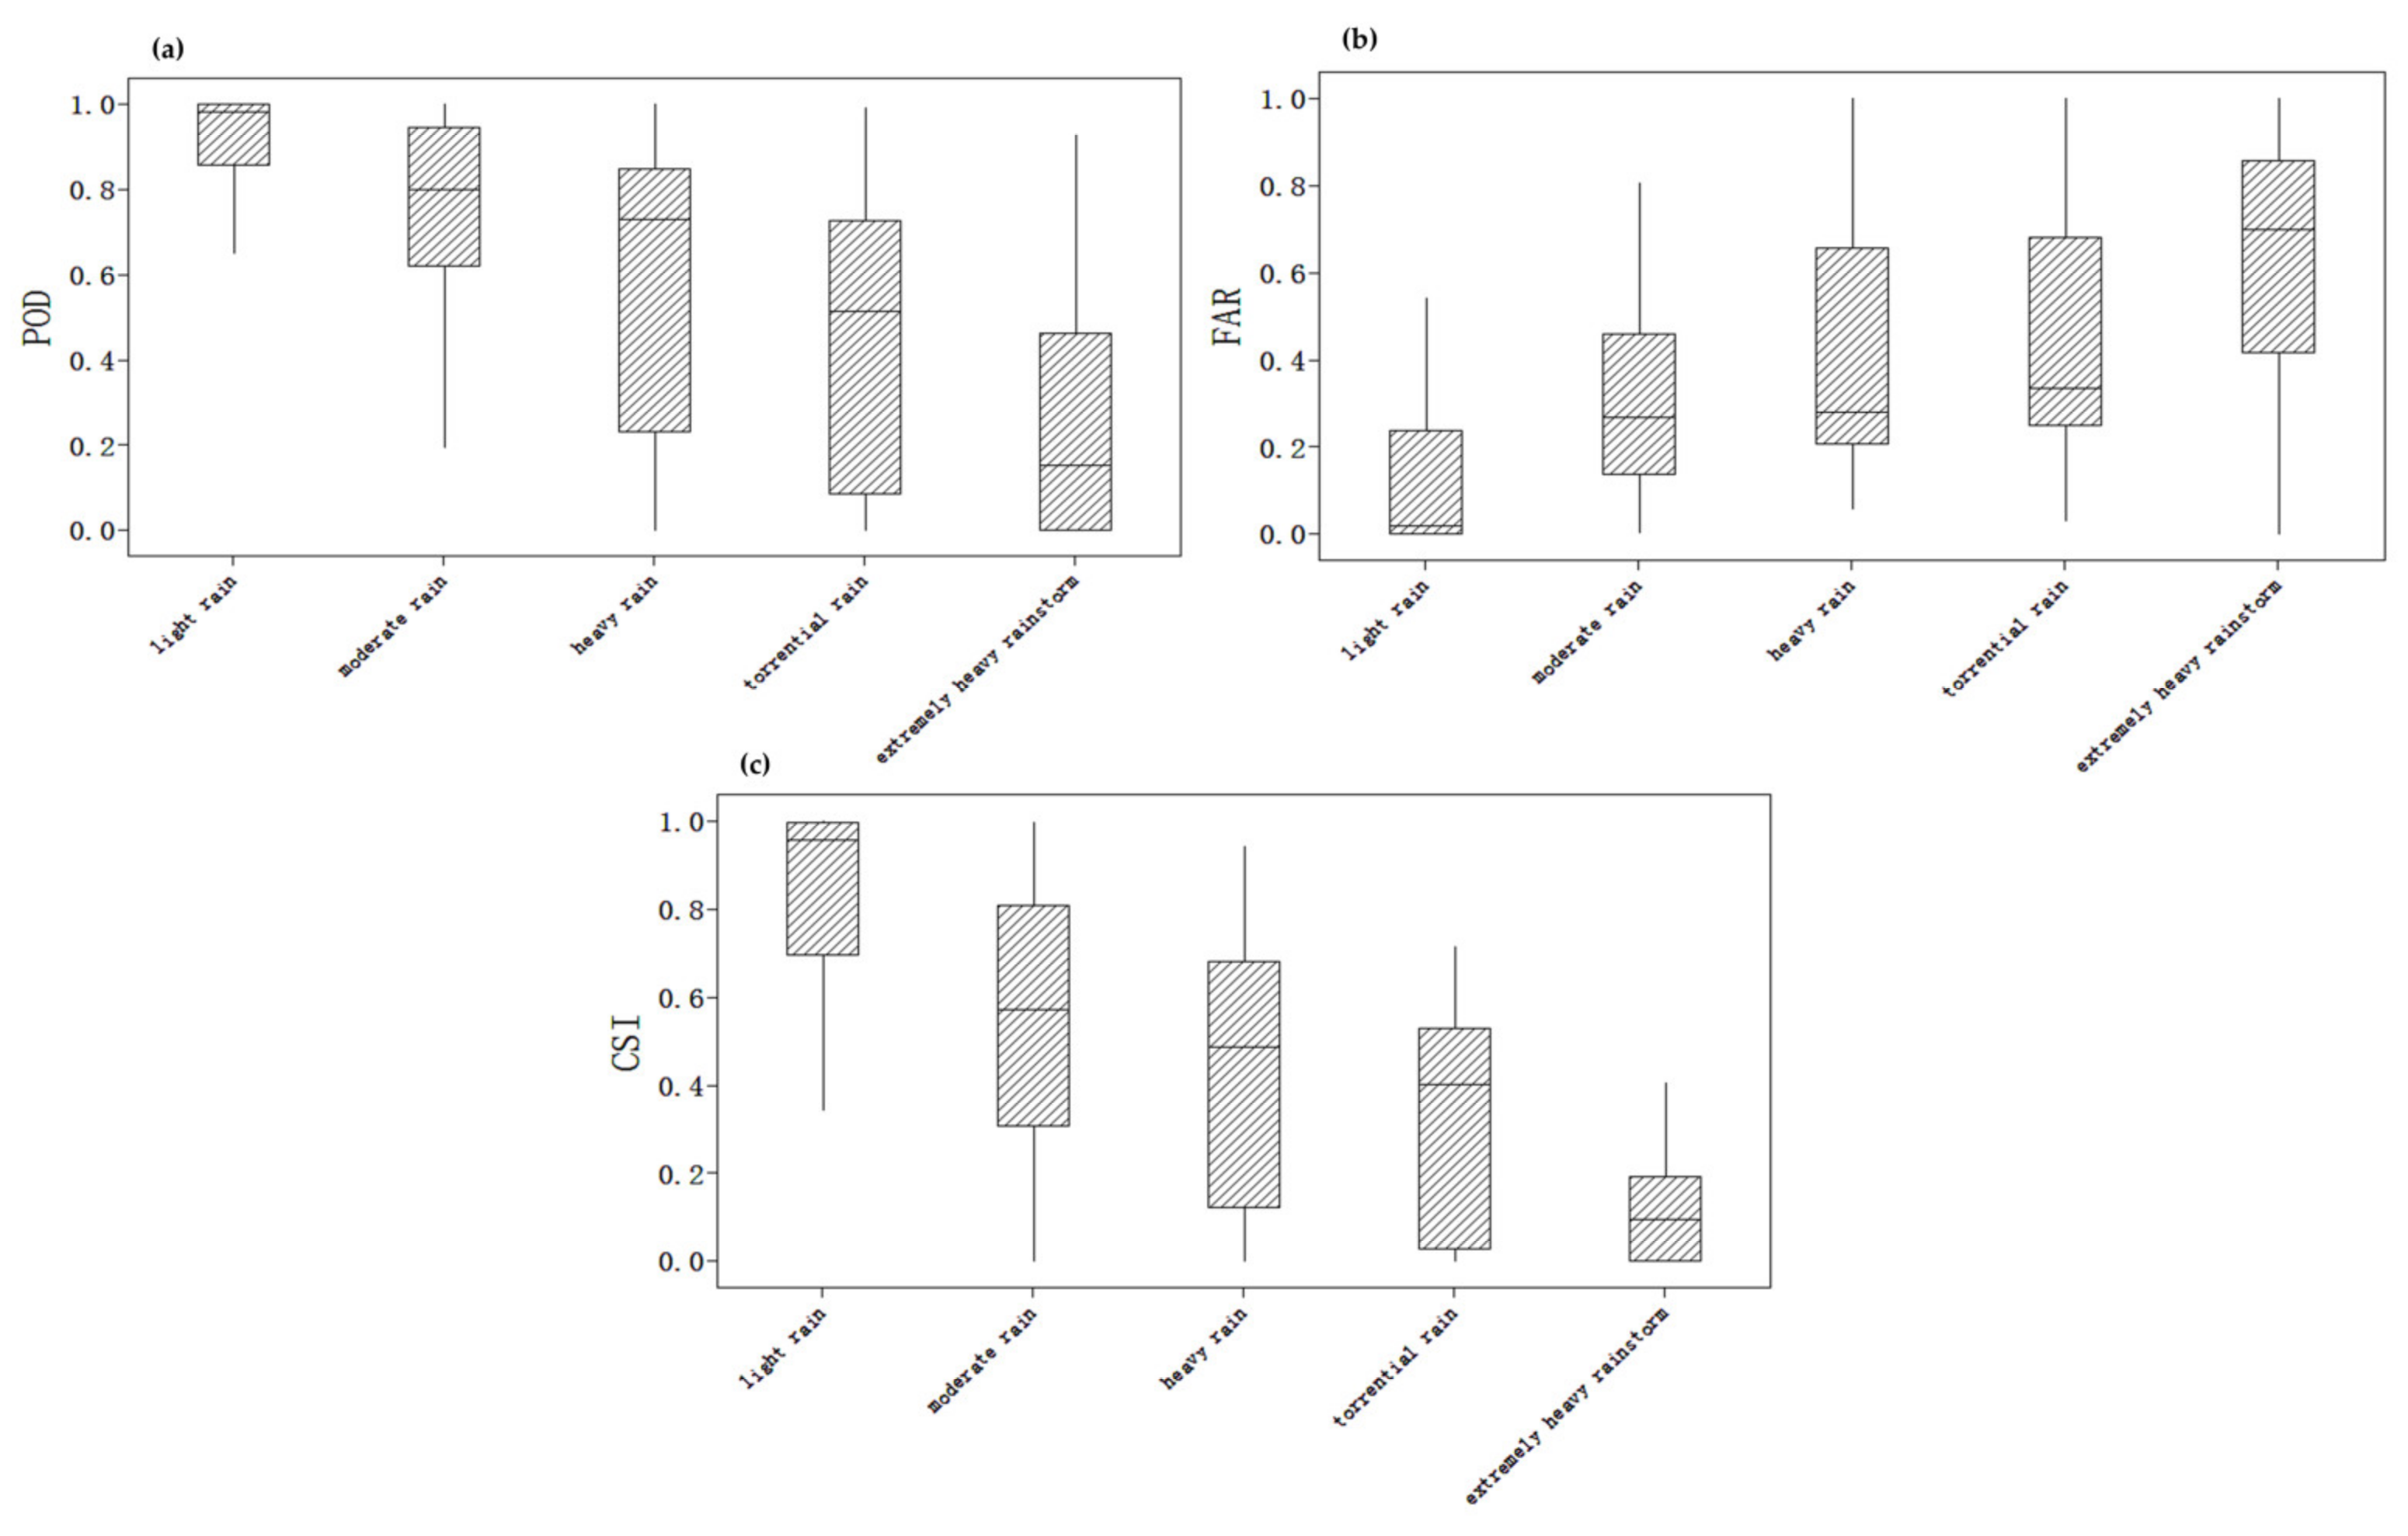
Figure 5 provides the evaluation results of the satellite for five precipitation intensity levels (i.e., light rain, moderate rain, heavy rain, torrential rain, and extremely heavy rainstorm). As shown in Figure 5a, the median probability of detection (POD) values of the five precipitation intensity levels are highest for light rain events (0.98), followed by moderate rain (0.8) and heavy rain (0.74). However, POD values are much lower for torrential rain and extremely heavy rainstorm events, with a median value of 0.5 and 0.15, respectively, indicating higher omission rates for these two types of precipitation events. As shown by the false alarm rate (FAR) index (Figure 5b), the median value of light rain is the smallest, at 0.02, while that of moderate and heavy rain are similar (median values around 0.27), and that of heavy rain is 0.33, and the largest is for extreme rainfall (0.7). This indicates that the satellite has a low false alarm rate for light rainfall events but a high false alarm rate for extreme rainfall events. From the critical success index (CSI) (Figure 5c), it can be seen that the median value of light rain is 0.96, indicating that satellite estimation of light rainfall events is basically consistent with reality; for moderate and heavy rains, the median values are around 0.5, indicating general estimation capability; while for heavy rains whose value is approaching 0.5, especially extreme rains whose value is only 0.1, this indicates low prediction capability of satellites for heavy rain events or above.

3.3. Spatial Assessment of Heavy Precipitation

3.3.1. Spatial Assessment of Process Heavy Precipitation

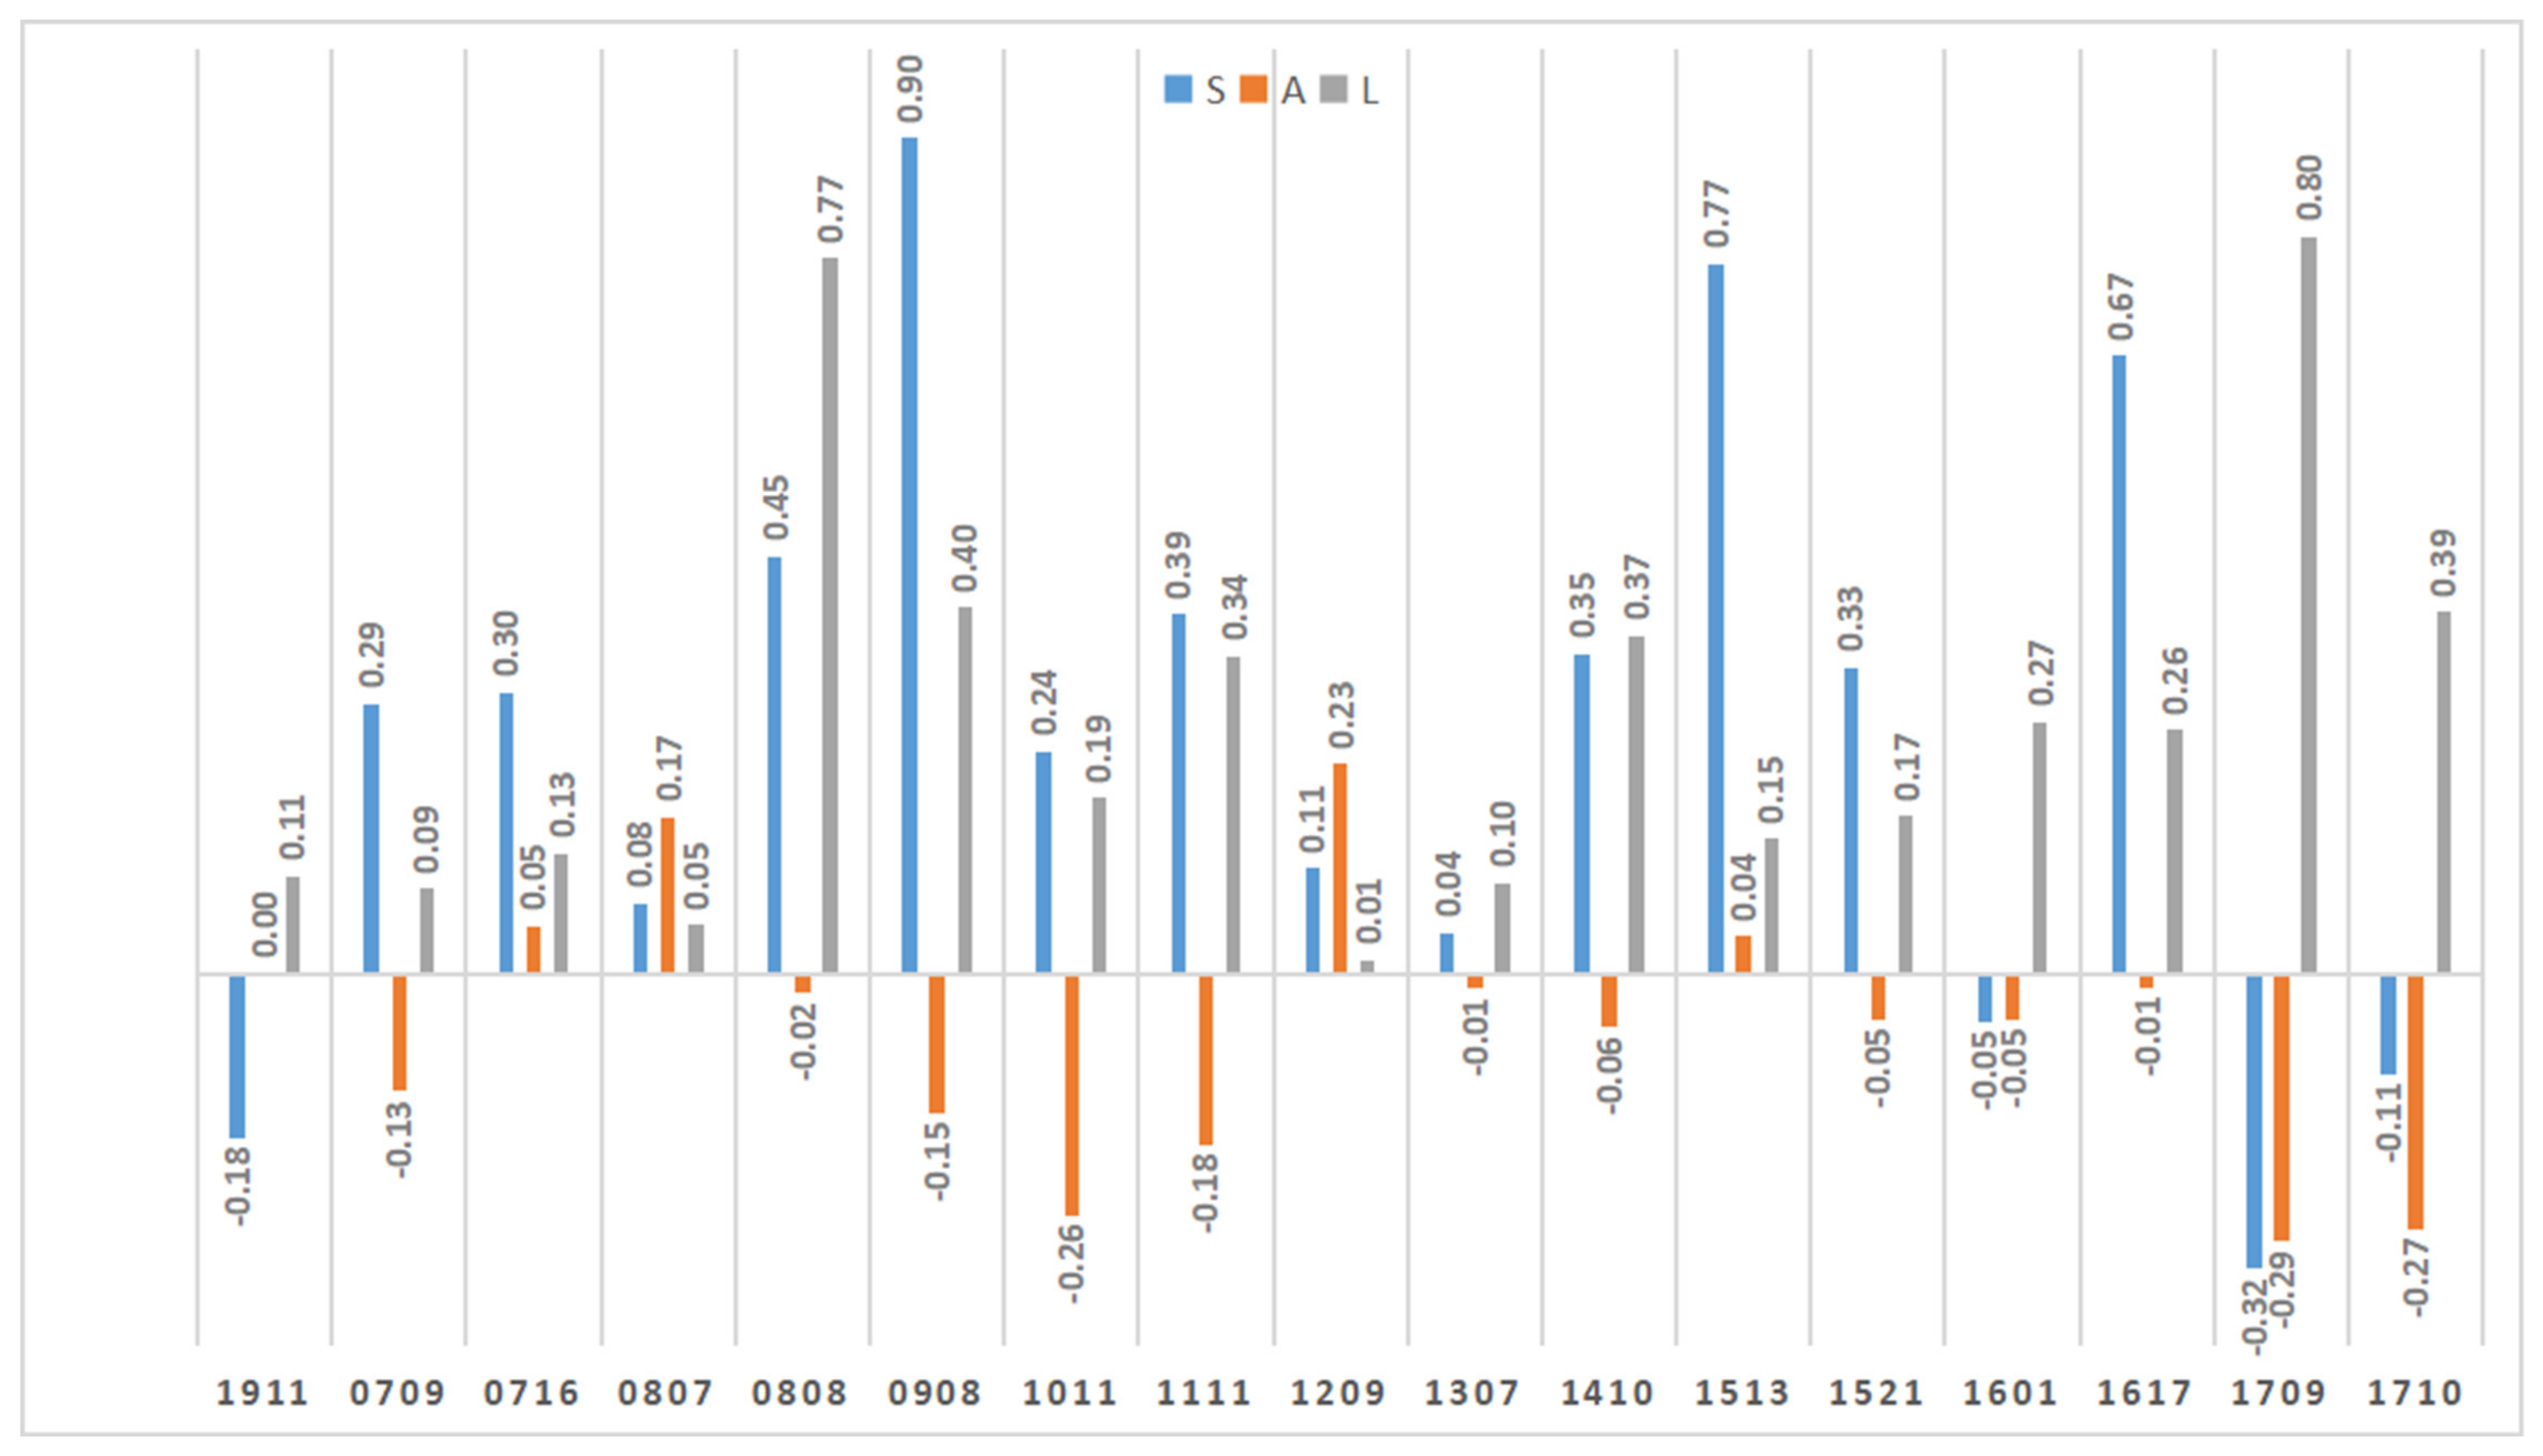
Figure 6 shows the SAL test results for heavy precipitation during the 17 typhoon impact processes, comparing the GPM IMERG satellite estimates with the ground truth data. Out of the 17 typhoons analyzed, only 4 (1911, 1601, 1709, and 1710) had S values less than 0, while the remaining 13 had S values greater than 0, indicating statistical significance. The mean S value of 0.25 suggests that GPM IMERG tends to estimate a broader range of heavy precipitation during typhoons than the ground truth, or the maximum precipitation is lower than that of the ground truth, or both conditions may co-occur. Among the typhoons considered, three have S values closest to 0: 0807 (S = 0.08), 1307 (S = 0.04), and 1601 (S = −0.05). The satellite estimates of intense precipitation during these typhoons exhibit greater consistency with actual conditions and demonstrate superior detection capabilities. The amplitude evaluation reveals 4 typhoons (0716, 0807, 1209, and 1513) exhibit A values greater than 0, whereas the remaining 13 display A values below 0. The average A value is −0.06, suggesting a general weakness in the amplitude of satellite estimates for heavy precipitation during typhoon impact. However, there are ten typhoons with A-values close to 0. It is evident that the satellite estimates of intense precipitation align closely with actual conditions for over half of the typhoon events. The mean value of L for location evaluation is 0.27, suggesting that the satellite-estimated heavy precipitation is closely aligned with the ground truth location.
Additionally, the L value for 12 typhoons is below the mean, indicating that the satellite accurately identifies the location of most typhoons. The L value is approximately 0 for only two typhoons, specifically 0807 (L = 0.05) and 1209 (L = 0.01). In summary, the absolute values of the three error metrics are all below 0.3, indicating the reliability of the structure, amplitude, and location of the satellite-estimated heavy precipitation during typhoon impact.

3.3.2. Spatial Assessment of Maximum Rainstorm Day

The results of the SAL test for the maximum daily precipitation of the 17 typhoon impact processes (Figure 7) indicate that, in terms of structure (S), all 13 typhoons, except for 4 (0716, 1011, 1709, and 1710), have S values greater than 0. The average S value is 0.15, suggesting that the estimated range of maximum daily precipitation by GPM IMERG for typhoons is generally wider than the actual range. It is indicated that the estimated range of maximum daily precipitation by GPM IMERG is generally overestimated compared to the actual values. It also indicates that the central value of maximum precipitation tends to be lower than the actual values, or both situations may occur.
The amplitude (A) test reveals that 5 typhoons have A values greater than 0, whereas the remaining 12 have A values below 0. The mean value of A is −0.14, indicating a generally weak intensity of the maximum daily precipitation estimated by GPM IMERG for typhoons. The location (L) test, with a mean value of 0.0027, demonstrates the close proximity of the maximum daily precipitation estimated by GPM IMERG to the ground truth location. The L values of 13 typhoons are below the mean value, indicating that GPM IMERG accurately determines the location of the maximum daily precipitation for the majority of typhoons.
The SAL test results for the maximum daily precipitation of the 17 typhoons were compared with the SAL results of the typhoon’s heavy precipitation process. The S-mean value of maximum daily precipitation is small, indicating that GPM IMERG provides a more accurate estimation of the range of maximum daily precipitation compared to the heavy precipitation process. Regarding A, the satellite provides a better estimation of the intensity of the heavy precipitation process. Additionally, the satellite accurately locates the heavy daily rainfall. Regarding A, the satellite’s estimation of the heavy precipitation process is superior to its estimation.
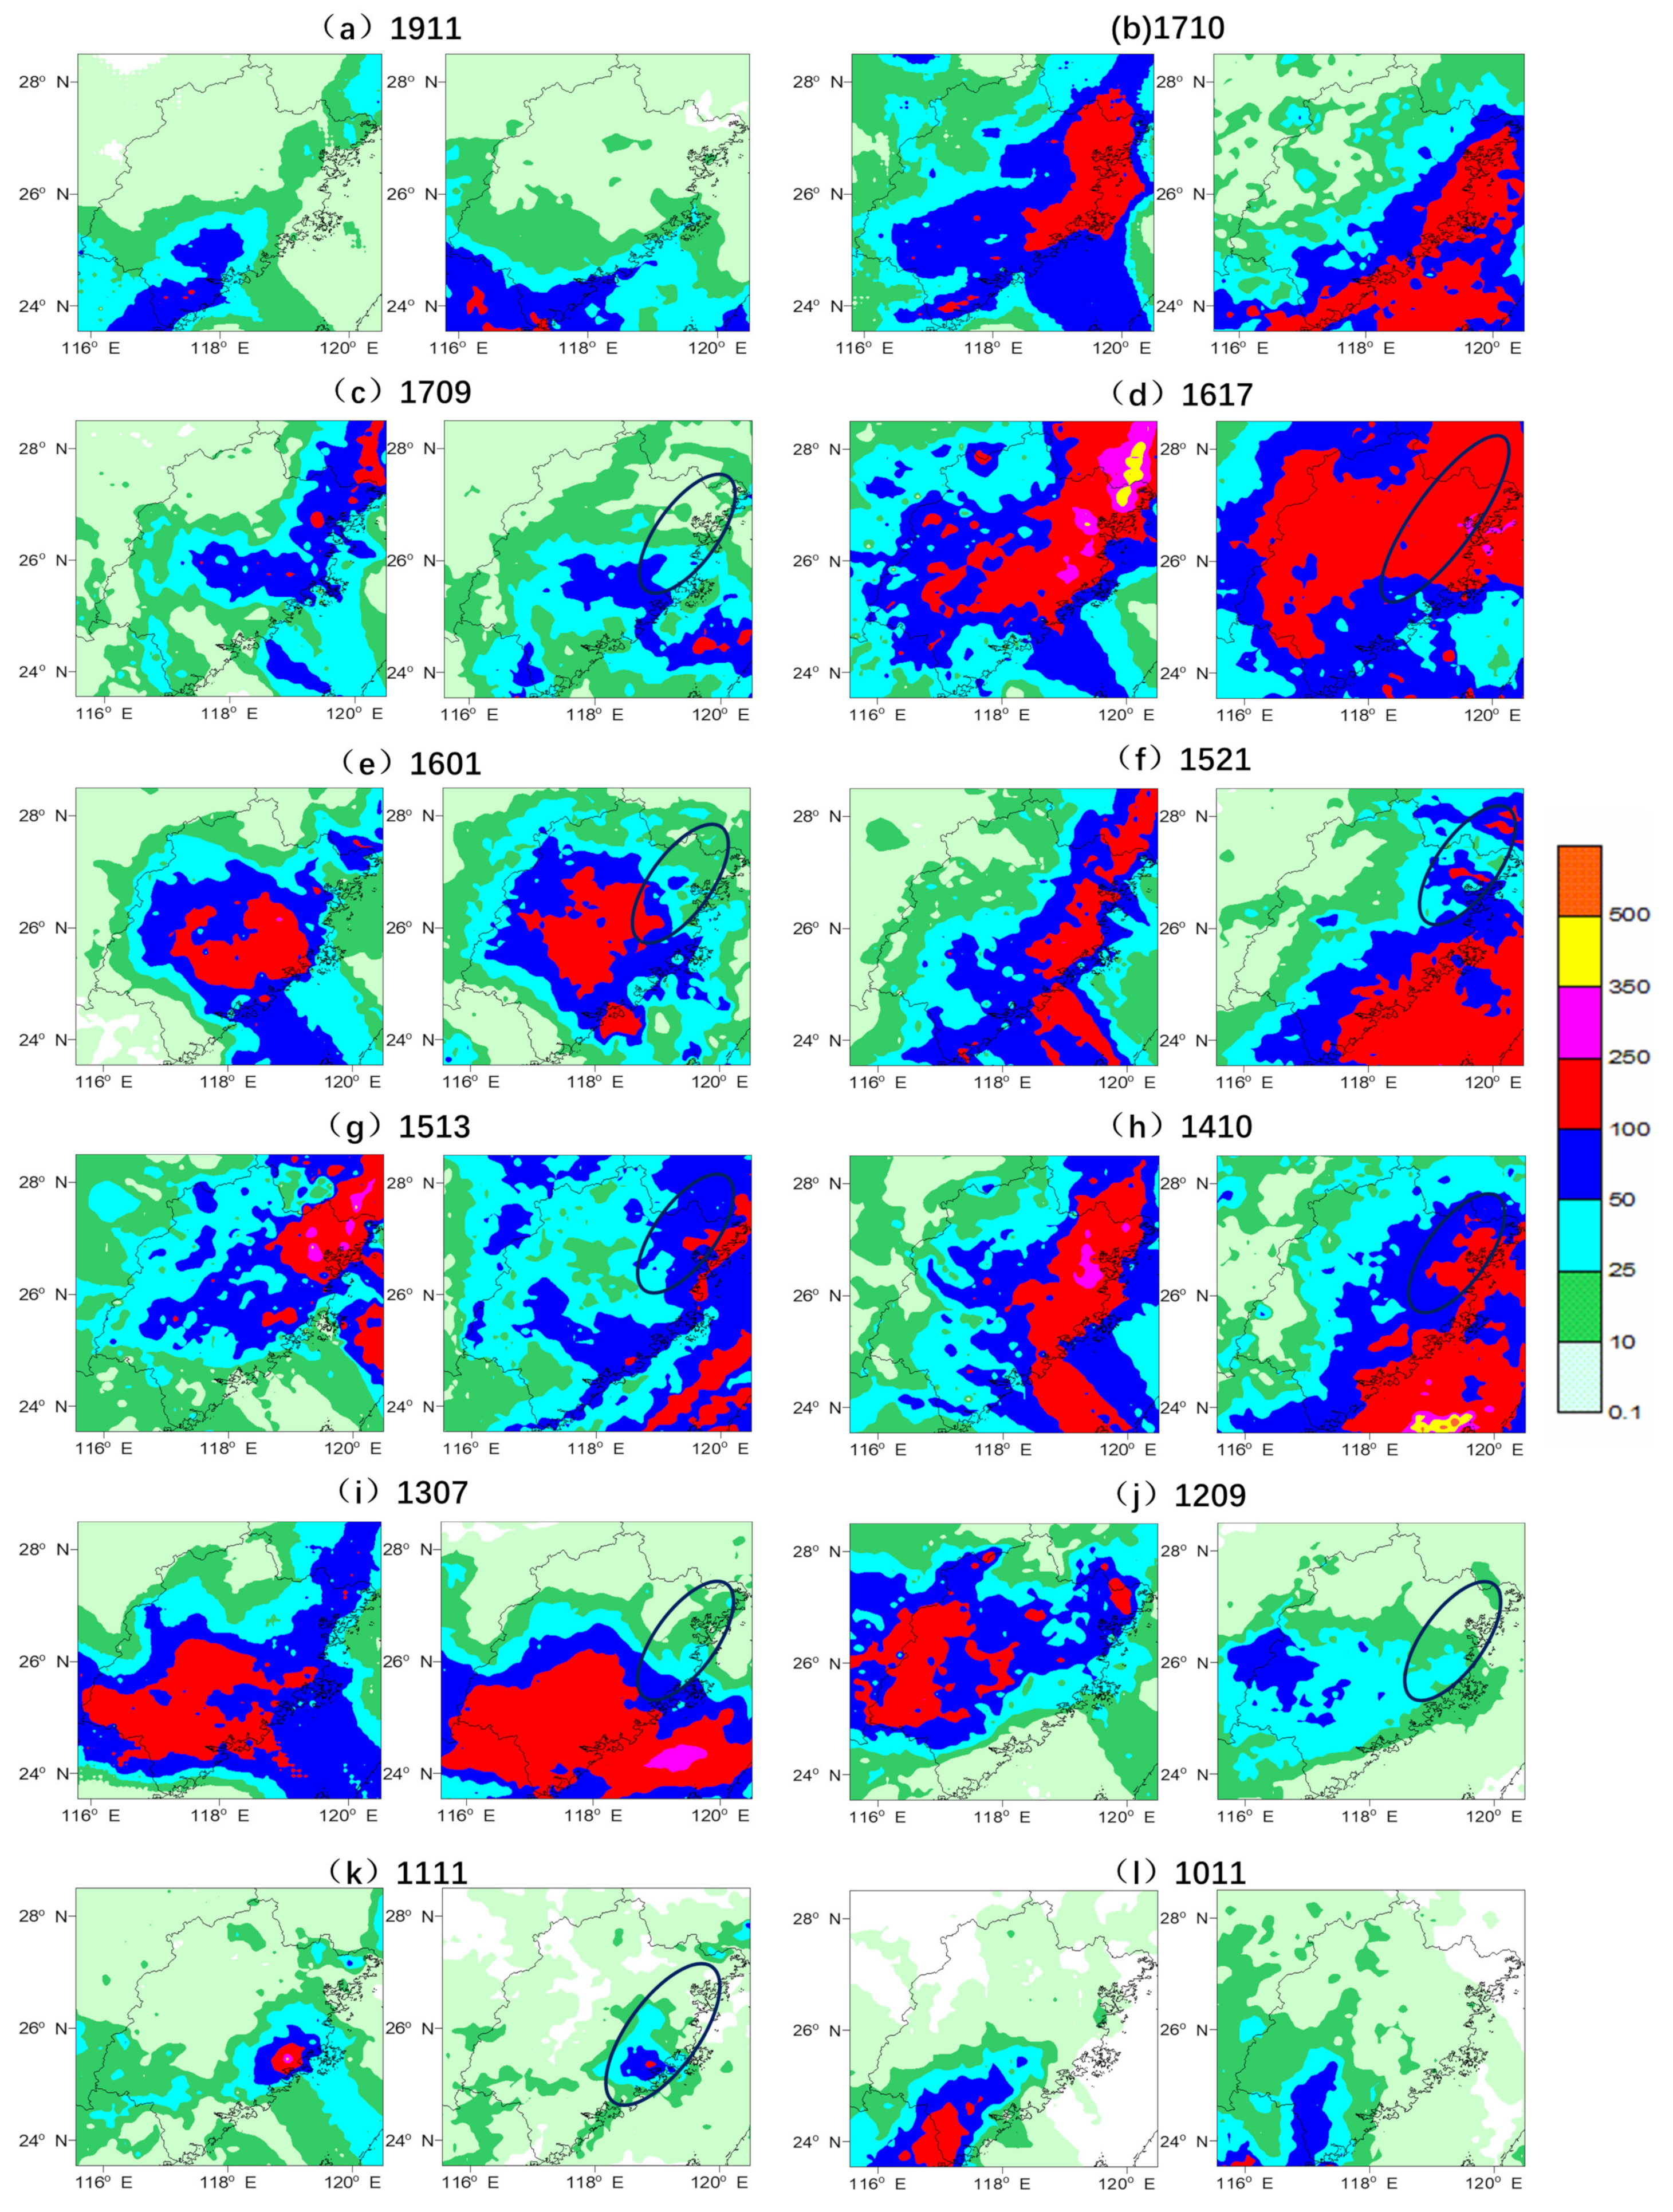
Further analysis of the spatial distribution of MDP for 17 typhoon cases shows that the GPM satellite-retrieved precipitation is generally good in terms of the range of torrential rain. The location and range of torrential rain for the other 15 typhoons are relatively consistent with actual conditions. However, the GPM satellite has poor performance for extremely heavy rainstorms compared to actual conditions. The study reveals that 14 of 17 typhoons led to significant rainfall in northeastern Fujian. However, the GPM satellite detection consistently underestimates the intensity of heavy rainfall in this region, particularly for extremely heavy rainfall where detection capability is almost non-existent, resulting in significantly weaker estimates compared to the actual situation (as indicated by the ellipse circle in Figure 8). The heavy precipitation in northeastern Fujian occurs in front of the windward slope of the southwest- to northeast-trending Vulture Peak Mountain Range (elevation 800–1300 m, Figure 2c). It means that the region’s topography influences the deviation in satellite data estimation.
Satellite estimates of moderate to heavy precipitation over the northeast region of Fujian are found to be spatially underestimated and significantly underestimated in intensity, which may be attributed to the fact that all 14 typhoons passed through Taiwan Island before landing in central and northern Fujian. Rainfall from typhoons on this path usually occurs on the right side of the path, with rainfall areas located in the northeast coastal area of Fujian. Analysis of the environmental conditions for this type of typhoon reveals that the enormous wind speed zone north of the typhoon center can lead to strong onshore winds; combined with the effect of the Fujian-Northeast Mountain Range, there will be stronger divergence and a deep rising motion in front of the mountain, which can transport low-level high energy and high humidity water vapor to the middle layer, eventually producing intense typhoon rainfall [31]. Typhoon-heavy precipitation is generated under favorable environmental factors, typhoon circulation, and terrain conditions. The possible reasons for the bias of intense typhoon precipitation estimated by satellites may be: (1) The underestimation of precipitation on the right side of the landfall point and more substantial precipitation falling more towards the coast, which may be related to the intensity and location of water vapor convergence under the influence of northward or southeastward coastal winds from the center of typhoon not being reflected by satellites. (2) The mountainous terrain in northeast Fujian is still a massive challenge for improving satellite precipitation estimation today, with mountain uplift helping to produce local extreme heavy rain [32]. (3) The precipitation enhancement caused by the abundant water vapor brought by the southwest monsoon is not well inverted by satellites. For example, in typhoons such as 1410 and double typhoons in 2017, after which the southwest monsoon water vapor was quickly transported, satellites failed to accurately grasp the changes in water vapor, resulting in deviations in precipitation intensity and range. This deviation indicates that there are still certain limitations in GPM satellite data inverse intense precipitation, but for areas with scarce conventional data, these data still have reference value.

4. Summary and Conclusions

This paper examines seventeen typhoons that affected Taiwan Island and made landfall in Fujian. It evaluates the accuracy of GPM IMERG precipitation estimation products in different temporal resolutions and various intensity levels and spatial distribution of strong precipitation in the southeast coastal area by comparing them with the rainfall data from automated weather stations. The primary outcomes of this paper can be summarized as follows:
(1) This study assesses the satellite’s estimation capability in the PTP, MDP, and HP. The R values indicate that the MDP performs the best, followed by the PTP, and the HP has the lowest performance. The comprehensive evaluation of rainfall estimation accuracy at different time scales for typhoons shows that Typhoon 1307 has the highest accuracy. The RB values indicate that the satellite precipitation is underestimated, and the underestimation is the highest for the HP, followed by the PTP and MDP. The PTP estimation exhibits the lowest MRE. The satellite estimation ability is weakest for HP, while MRE indicates a slightly lower ability for MDP than PTP. The combined analysis of the three statistical indicators reveals that satellite estimation accuracy is higher for PTP than MDP, with HP exhibiting the weakest estimation ability.
(2) The satellite precipitation product’s assessment results of daily precipitation for five levels—light rain, moderate rain, heavy rain, torrential rain, and extremely heavy rainstorm—indicate that the under-reporting rate is the lowest for light rain, followed by moderate and heavy rain, with torrential rain less than heavy rain. The most significant under-reporting occurs during extremely heavy rainstorms. The satellite precipitation products have the lowest FAR for light rain and the highest for extremely heavy rainstorms. The CSI indicator is consistent with actual situations for light rain, the CSI values for moderate, heavy, and torrential rainfall decreased gradually with a fair ability to estimate, but particularly low for extremely heavy rainstorms or above precipitation.
(3) The results of the SAL assessment indicate that satellite estimates for the structure, intensity, and location of heavy precipitation deviate less from the actual values. The estimates for the maximum rainstorm day are superior to those for heavy precipitation, indicating the reference significance of GPM IMERG data. The spatial assessment of typhoons shows that the estimation of the range of heavy rainfall is smaller than the actual one, especially with no detection capability for an extremely heavy rainstorm and weaker than the actual situation at the peak value of strong precipitation.
(4) The range and intensity of heavy precipitation in the Fujian-Northeastern region were underestimated, which may be attributed to several reasons. Firstly, the satellite failed to accurately reflect the intensity and location of water vapor convergence under northeast or southeast shore winds on the north side of the typhoon center. Secondly, the terrain is still a big challenge for satellite-based precipitation estimation, while the mountainous terrain uplift in the Fujian-Northeast region helps to enhance local convective rain. Thirdly, the satellite’s capability to capture changes in abundant water vapor brought by a southwestern monsoon needs to be improved, leading to discrepancies in precipitation intensity and scope.
This paper’s evaluation of the GPM IMERG precipitation products is based on a direct comparison with ground precipitation observation data. However, it cannot accurately reflect the source of the error. In the future, concerted efforts should be made to extend from the hardware level, such as sensors, to enhance the accuracy of satellite retrieval algorithms and furnish reliable precipitation products. Comparison and analysis show that the GPM satellite still has certain restrictions in strong rainfall estimation. GPM satellites’ products provide valuable information, as evidenced by the SAL assessment results. These data still hold reference value for regions with sparse conventional data.

Author Contributions

Conceptualization, X.L.; methodology, X.L. and N.F.; validation, H.G.; formal analysis, X.L. and N.F.; investigation, X.L. and N.F.; writing—original draft preparation, X.L. and N.F.; writing—review and editing, X.L. and N.F.; visualization, X.L. and N.F. All authors have read and agreed to the published version of the manuscript.

Funding

This research was funded by the Fujian Provincial Department of Science and Technology, grant number 2021J01456, East China Collaborative Innovation Fund for Meteorological Science and Technology, grant number QYHZ202111, Fujian Meteorological Bureau open fund, grant number 2021K01 and Major Scientific and Technological Special Project of Fujian Key Laboratory of Severe Weather, grant numbers 2020KX05 and 2020TF04.

Data Availability Statement

Not applicable.

Acknowledgments

The authors would like to thank all those who contributed to this research.

Conflicts of Interest

The authors declare no conflict of interest.

References

  1. Guo, H.; Chen, S.; Bao, A.; Hu, J.; Yang, B.; Stepanian, P. Comprehensive Evaluation of High-Resolution Satellite-Based Precipitation Products over China. Atmosphere 2016, 7, 6. [Google Scholar] [CrossRef] [Green Version]
  2. Wang, L.; Chen, R.; Song, Y. Research Review on Calculation Methods and Influential Factors on Areal Precipitation of Alpine Mountains. Plateau Meteorol. 2017, 36, 1546–1556. [Google Scholar]
  3. Groisman, P.Y.; Legates, D.R. Documenting and Detecting Long-Term Precipitation Trends: Where We Are and What Should Be Done. Clim. Change 1995, 31, 601–622. [Google Scholar] [CrossRef]
  4. Kidd, C.; Becker, A.; Huffman, G.J.; Muller, C.L.; Joe, P.; Skofronick-Jackson, G.; Kirschbaum, D.B. So, How Much of the Earth’s Surface Is Covered by Rain Gauges? Bull. Am. Meteorol. Soc. 2017, 98, 69–78. [Google Scholar] [CrossRef]
  5. Liu, Y.; Fu, Q.; Song, P.; Zhao, X.; Dou, C. Satellite retrieval of precipitation: An overview. Adv. Earth Sci. 2011, 26, 1162–1172. [Google Scholar]
  6. Liu, J.; Yin, Y.; Sun, X.; Ma, J.; Gao, Y. Multivariate statistical analysis of influence of underlying surface change on runoff. Water Resour. Prot. 2016, 32, 41–43. [Google Scholar]
  7. Guo, H.; Chen, S.; Bao, A.; Behrangi, A.; Hong, Y.; Ndayisaba, F.; Hu, J.; Stepanian, P.M. Early Assessment of Integrated Multi-Satellite Retrievals for Global Precipitation Measurement over China. Atmos. Res. 2016, 176, 121–133. [Google Scholar] [CrossRef]
  8. Guo, H.; Chen, S.; Bao, A.; Hu, J.; Gebregiorgis, A.; Xue, X.; Zhang, X. Inter-Comparison of High-Resolution Satellite Precipitation Products over Central Asia. Remote Sens. 2015, 7, 7181–7211. [Google Scholar] [CrossRef] [Green Version]
  9. Hou, A.Y.; Kakar, R.K.; Neeck, S.; Azarbarzin, A.A.; Kummerow, C.D.; Kojima, M.; Oki, R.; Nakamura, K.; Iguchi, T. The Global Precipitation Measurement Mission. Bull. Amer. Meteor. Soc. 2014, 95, 701–722. [Google Scholar] [CrossRef]
  10. Jin, X.; Shao, H.; Zhang, C.; Yan, Y. The Applicability Evaluation of Three Satellite Products in Tianshan Mountains. J. Nat. Resour. 2016, 31, 2074–2085. [Google Scholar]
  11. Caracciolo, D.; Francipane, A.; Viola, F.; Noto, L.V.; Deidda, R. Performances of GPM Satellite Precipitation over the Two Major Mediterranean Islands. Atmos. Res. 2018, 213, 309–322. [Google Scholar] [CrossRef] [Green Version]
  12. Tang, G.; Wan, W.; Zeng, Z.; Guo, X.; Li, N.; Long, D.; Hong, Y. An Overview of the Global Precipition Measurement (GPM) Mission and It’s Latest Development. Remote Sens. Technol. Appl. 2015, 30, 607–615. [Google Scholar]
  13. Chen, F.; Li, X. Evaluation of IMERG and TRMM 3B43 Monthly Precipitation Products over Mainland China. Remote Sens. 2016, 8, 472. [Google Scholar] [CrossRef] [Green Version]
  14. Li, N.; Tang, G.; Zhao, P.; Hong, Y.; Gou, Y.; Yang, K. Statistical Assessment and Hydrological Utility of the Latest Multi-Satellite Precipitation Analysis IMERG in Ganjiang River Basin. Atmos. Res. 2017, 183, 212–223. [Google Scholar] [CrossRef]
  15. Lu, M.; Wei, M. GPM Data Application Analysis of Vertical Structure of Typhoon ‘Mujigae’ Precipition. Remote Sens. Technol. Appl. 2017, 32, 904–912. [Google Scholar]
  16. Fang, M.; He, J.; Fu, Y.; Wang, D.; Zhu, M. Applicability Analysis of GPM Satellite Precipitation Data in Coastal Areas: A case in Sanya. Meteorlogical Sci. Technol. 2020, 48, 622–629. [Google Scholar]
  17. Yu, Z.; Ma, S.; Hu, X.; Yan, W. Analysis of Atmospheric Circulation, Cloud and Precipitation Characteristics of Typhoon ’Lekima’ based on Multi-source Data. J. Meteorol. Sci. 2020, 40, 41–52. [Google Scholar]
  18. Huffman, G.J.; Bolvin, D.T.; Nelkin, E.J.; Wolff, D.B.; Adler, R.F.; Gu, G.; Hong, Y.; Bowman, K.P.; Stocker, E.F. The TRMM Multisatellite Precipitation Analysis (TMPA): Quasi-Global, Multiyear, Combined-Sensor Precipitation Estimates at Fine Scales. J. Hydrometeorol. 2007, 8, 38–55. [Google Scholar] [CrossRef]
  19. Joyce, R.J.; Janowiak, J.E.; Arkin, P.A.; Xie, P. CMORPH: A Method That Produces Global Precipitation Estimates from Passive Microwave and Infrared Data at High Spatial and Temporal Resolution. J. Hydrometeor. 2004, 5, 487–503. [Google Scholar] [CrossRef]
  20. Li, J.; Hsu, K.-L.; AghaKouchak, A.; Sorooshian, S. Object-Based Assessment of Satellite Precipitation Products. Remote Sens. 2016, 8, 547. [Google Scholar] [CrossRef] [Green Version]
  21. Tan, J.; Petersen, W.A.; Tokay, A. A Novel Approach to Identify Sources of Errors in IMERG for GPM Ground Validation. J. Hydrometeorol. 2016, 17, 2477–2491. [Google Scholar] [CrossRef]
  22. Wang, Z.; Wang, X.; Zeng, S.; Chen, X.; Wu, Z. Analysis of Soil and Water Loss in Fujian Province. Bull. Soil Water Conserv. 2017, 37, 169–175. [Google Scholar]
  23. Xu, D.; Zhou, J.; Lu, Y.; Pan, F. Evaluation on Applicability of TRMM Satellite Precipitation Product in the NuJiang River Basin. Res. Soil Water Conserv. 2019, 26, 240–244+251. [Google Scholar]
  24. Stunder, J.B. An Assessment of the Quality of Forecast Trajectories. J. Appl. Meteorol. 1996, 35, 1319–1331. [Google Scholar] [CrossRef]
  25. Chen, S.; Hong, Y.; Cao, Q.; Kirstetter, P.-E.; Gourley, J.J.; Qi, Y.; Zhang, J.; Howard, K.; Hu, J.; Wang, J. Performance Evaluation of Radar and Satellite Rainfalls for Typhoon Morakot over Taiwan: Are Remote-Sensing Products Ready for Gauge Denial Scenario of Extreme Events? J. Hydrol. 2013, 506, 4–13. [Google Scholar] [CrossRef]
  26. Zhang, Z.; Chen, X.; Xu, C.-Y.; Yuan, L.; Yong, B.; Yan, S. Evaluating the Non-Stationary Relationship between Precipitation and Streamflow in Nine Major Basins of China during the Past 50 Years. J. Hydrol. 2011, 409, 81–93. [Google Scholar] [CrossRef]
  27. Wernli, H.; Paulat, M.; Hagen, M.; Frei, C. SAL—A Novel Quality Measure for the Verification of Quantitative Precipitation Forecasts. Mon. Weather Rev. 2008, 136, 4470–4487. [Google Scholar] [CrossRef] [Green Version]
  28. Davis, C.; Brown, B.; Bullock, R. Object-Based Verification of Precipitation Forecasts. Part I: Methodology and Application to Mesoscale Rain Areas. Mon. Weather Rev. 2006, 134, 1772–1784. [Google Scholar] [CrossRef] [Green Version]
  29. Yu, Y.; Bi, M.; Yan, Q.; Lin, H.; Feng, D.; Yu, F. Cause analysis and spatial test of milti-mode numerical prediction on regional rainstorms in Liaoning province. J. Meteorol. Envionment 2022, 38, 11–18. [Google Scholar]
  30. Yang, Y.; Tang, G.; Lei, X.; Hong, Y.; Yang, N. Verification and preliminary calibration on frontal rainstorm forecast of ECMWF model in Jiang Xi and near by areas. Meteorol. Disaster Reduct. Res. 2023, 46, 28–34. [Google Scholar]
  31. Yin, S.; Lin, X.; Yang, S. Characteristics of Rainstorm in Fujian Induced by Typhoon Passing through Taiwan Island. Trop. Cyclone Res. Rev. 2022, 11, 50–59. [Google Scholar] [CrossRef]
  32. Yang, Y.; Tang, G.; Lei, X.; Hong, Y.; Yang, N. Can Satellite Precipitation Products Estimate Probable Maximum Precipitation: A Comparative Investigation with Gauge Data in the Dadu River Basin. Remote Sens. 2017, 10, 41. [Google Scholar] [CrossRef] [Green Version]
Figure 1. (a) Distribution of ground-based meteorological stations (red dots). (b) Grid-cell of satellite precipitation and ground rainfall data (violet dots). (c) Topographic map of the mountainous regions in Fujian Province and its neighboring provinces (unit: m).
Atmosphere 14 01224 g001
Figure 2. The trajectory of 17 typhoons that traversed Taiwan and landed in Fujian Province between 2007 and 2021.
Atmosphere 14 01224 g002
Figure 3. Box plot of correlation coefficient R (a), relative error RB (b), and mean relative error MRE (c) between satellite precipitation and ground rainfall at different time scales (shadows, the box plot from top to bottom is the upper edge, upper quartile, median, lower quartile, and lower edge; small circles represent average; the solid black line is the connecting line of average at different time scales).
Atmosphere 14 01224 g003
Figure 4. The variation of hourly accumulated rainfall from satellite and ground measurements during the period of typhoon impact (red dashed line for satellite precipitation, solid black line for ground precipitation).
Atmosphere 14 01224 g004
Figure 5. Box plots of (a) probability of detection (POD), (b) false alarm ratio (FAR), and (c) critical success index (CSI) for five precipitation categories: light rain, moderate rain, heavy rain, torrential rain, and extremely heavy rainstorm assessed from satellite data (shadows, the box plot from top to bottom are the upper edge, the upper quartile, the median, the lower quartile, and the lower edge, respectively).
Atmosphere 14 01224 g005
Figure 6. Results of SAL assessment of process heavy precipitation.
Atmosphere 14 01224 g006
Figure 7. SAL evaluation results for the maximum rainstorm day (L-value magnified 100 times).
Atmosphere 14 01224 g007
Figure 8. The spatial distribution of maximum daily precipitation (MDP) of 17 typhoons (ground precipitation on the left, satellite-estimated precipitation on the right, the oval circle in the figure indicates the northeastern region of Fujian).
Atmosphere 14 01224 g008aAtmosphere 14 01224 g008b
Table 1. A list of 17 typhoons that traversed Taiwan and landed in Fujian Province from 2007 to 2021.
Typhoon (Year)Landfalling TimeDuration (h)Landfalling LocationLandfalling Intensity (m/s)
Bailu (2019)23:00 UTC 24 August48Dongshan23
Haitang (2017)19:00 UTC 30 July39Fuqing20
Nesat (2017)22:00 UTC 29 July41Fuqing33
Megi (2016)21:00 UTC 27 September80Quanzhou33
Nepartak (2016)05:00 UTC 9 July62Quanzhou20
Dujuan (2015)00:00 UTC 29 September55Putian28
Soudelor (2015)14:00 UTC 8 August71Putian30
Matmo (2014)07:00 UTC 23 July61Fuqing30
Soulik (2013)08:00 UTC 13 July54Lianjiang30
Saola (2012)23:00 UTC 2 August81Fuding25
Nanmadol (2011)01:00 UTC 31 August125Huian18
Fanapi (2010)23:00 UTC 19 September74Zhangpu35
Morakot (2009)09:00 UTC 9 August69Xiapu33
Fung-wong (2008)14:00 UTC 28 July81Fuqing33
Kalmaegi (2008)10:00 UTC 18 July50Xiapu25
Krosa (2007)07:00 UTC 7 October51Fuding33
Sepat (2007)18:00 UTC 18 August71Huian33
Disclaimer/Publisher’s Note: The statements, opinions and data contained in all publications are solely those of the individual author(s) and contributor(s) and not of MDPI and/or the editor(s). MDPI and/or the editor(s) disclaim responsibility for any injury to people or property resulting from any ideas, methods, instructions or products referred to in the content.