1. Introduction
Nowadays, the western population lives close to 90% indoors [
1,
2]. Furthermore, the indoor environment may often be more polluted than the air outside, depending on the pollutant released and potentially locked inside [
1,
2,
3]. Thus, studies about indoor environments and air quality to assess human health exposure to a number of pollutants deserve attention. Among the harmful pollutants present indoors, radon is a natural and radioactive noble gas, unperceivable by human senses, which is a major concern in Switzerland [
4,
5,
6,
7]. Radon gas is colorless and odorless, consequently undetectable by our senses, which makes it hazardous for inhabitants [
7,
8]. Moreover, public awareness about radon gas and its potential risks remains low: Federal Office for Public Health in Switzerland (FOPH) underlines a strong need for action in the National Action Plan during the period ranging from 2021 to 2030. The awareness of the existence of such a gas rose from 32% to 55% between 1995 and 2019 [
7,
9]. However, among these 55%, a quarter of them still thought that radon was not an issue for human health [
7].
In Switzerland, official radon monitoring consists of a yearlong passive measurement or at least a three-month passive measurement during the indoor heating period (October–March). Measurements must be carried out in at least two living spaces and, if possible, in the basement with approved passive sensors [
10].
If it is not possible to wait for an official measurement, which is often the case during real-estate handover or before a remediation, a radon short-term active methodology has been proposed by FOPH since 2020 [
11]. This methodology does not provide any official measurements. However, it aims to estimate the probability of exceeding the actual reference value of 300 Bq/m
in the building under normal living conditions. As for the official passive measurement method, at least two living spaces must be investigated, and an additional third unoccupied space is therefore recommended to be analyzed. Approved by METAS (Swiss Federal Office of Metrology) and calibrated, active sensors need to be used for at least 120 h, including a week-end when possible.
Given that this procedure can be carried out throughout the year, some specific conditions must be fulfilled during the whole measurement period. Environmental conditions (i.e., weather and geology) have to be combined in such a way that they enhance radon entry into the building. The building must be under-pressurized (artificially or not, depending on the season) for at least 80% of the measurement. For that purpose, a slight depression ranging from 0.5 Pa to 4 Pa is applied in order to prevent indoor radon dilution by enhancing air entry from the building envelope. This implies that occupants should keep doors and windows closed as much as possible. The aim is to reproduce indoors the impact of winter thermal conditions at any time of the year.
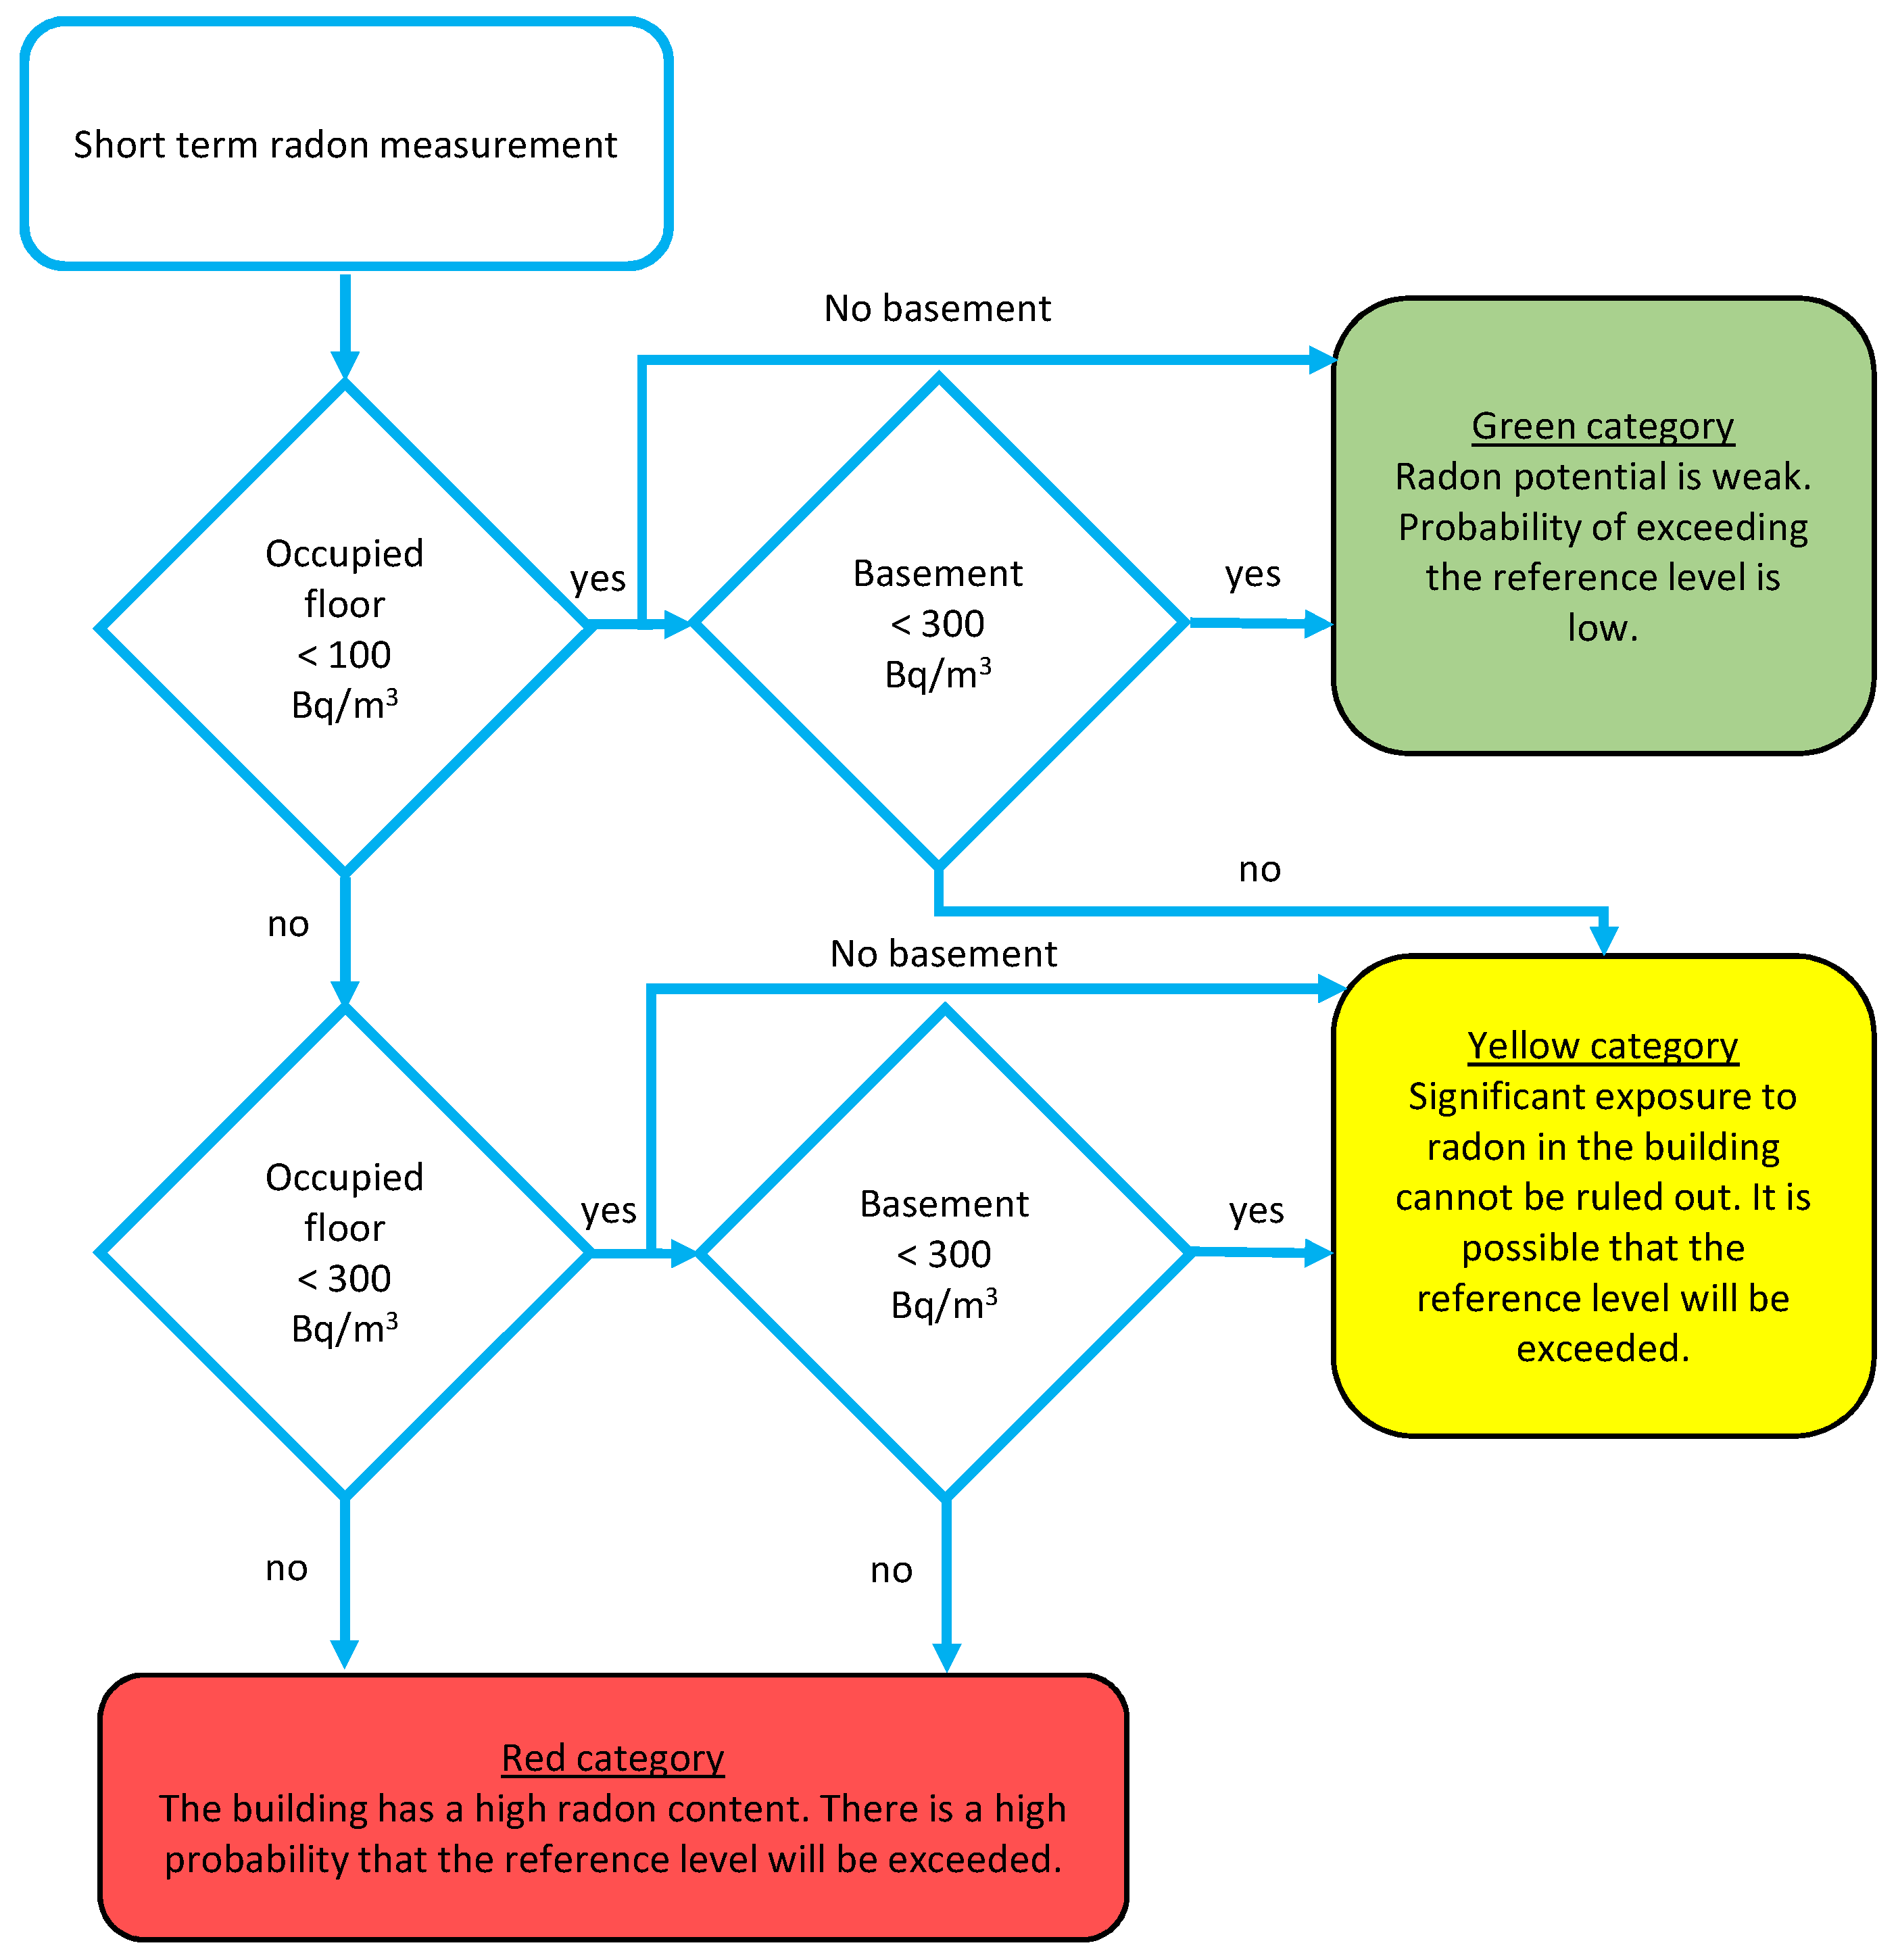
Radon levels time series monitored during at least 120 h are subsequently analyzed following the methodology shown schematically in
Figure 1. This results in a three-category classification.
Green: Building’s indoor radon concentration potential is low. The probability of exceeding the national reference threshold value (300 Bq/m) is deemed not significant.
Yellow: Building’s indoor radon concentration potential is at a medium level. The probability of exceeding the national reference threshold value (300 Bq/m) can no longer be excluded.
Red: Building’s radon indoor concentration potential is high. The probability of exceeding the national reference value of 300 Bq/m is therefore significant.
Indoor radon gas concentration is influenced by many factors, such as the local geology [
5,
12,
13], the weather conditions [
4,
5,
12,
14], the building characteristics, and the occupants behaviors [
3,
5,
15]. Although the influence of inhabitants’ behaviors might be neglected during short-term measurements due to the governing weather conditions that must be reached (e.g., depressurization), other household habits might not. Moreover, geogenic radon potential and building characteristics remain constant at the scale of the measurement duration. Consequently, only the weather may vary in the short term, thereby influencing movement of radon from the ground. Thus, individual meteorological parameters impacts on radon levels have been investigated to a certain extent by different authors for decades [
4,
5,
12,
14,
16,
17,
18,
19,
20,
21,
22,
23,
24,
25]. Weather conditions might strongly impact indoor radon levels (IRL) in Switzerland, particularly temperature, wind, and precipitation [
5]. Analyzing and quantifying this influence is a key-point to better characterizing the population’s exposure to radon gas.
Among the different objectives of this study, we aim to ensure the reliability of the radon short-term measurement methodology, which aims to assess the risk of overpassing the national reference value in normal occupation and using conditions within the building. Based on prior studies, we identified meteorological parameters as a crucial influencing factor in IRL. The purpose of the present paper is to explore the time scale on which meteorological parameters’ influences might be felt, thus disrupting the measurement. This would consequently help to improve the reliability of the sanitary evaluation of the real investigated estate. Ideally, radon short-term measurements should be compared with official passive measurements in order to validate the methodology.
In this paper, the impacts of the evolution of a number of meteorological variables on radon time series monitored during short-term periods are investigated. This study aims to answer these research questions: how do meteorological parameters influence indoor radon measurements monitored during a short-term radon measurement methodology? Do meteorological conditions prior to the radon measurement periods influence indoor radon concentrations in the short term? Does a lagged correlation exist between IRL and meteorological parameters? Which investigated indoor space is most influenced by actual and past meteorological conditions? Are there significant differences in terms of influence due to meteorological conditions among the different buildings? Finally, do building characteristics modulate or not the impacts of past or actual weather on IRL?
Based on a sample of twelve short-term measurements made in Switzerland, different statistical analyses were carried out in order to shed light on these research questions.
Figure 1.
Federal Office of Public Health’s scheme provided to analyse and classify the measurements obtained in a building. This Swiss official document is available in three national languages, i.e., German, French and Italian [
11], and translated in English by the authors.
Figure 1.
Federal Office of Public Health’s scheme provided to analyse and classify the measurements obtained in a building. This Swiss official document is available in three national languages, i.e., German, French and Italian [
11], and translated in English by the authors.
3. Results
3.1. Radon Time Series Autocorrelations
Autocorrelation is applied for each radon time series in order to identify if the series are correlated to themselves at a later time.
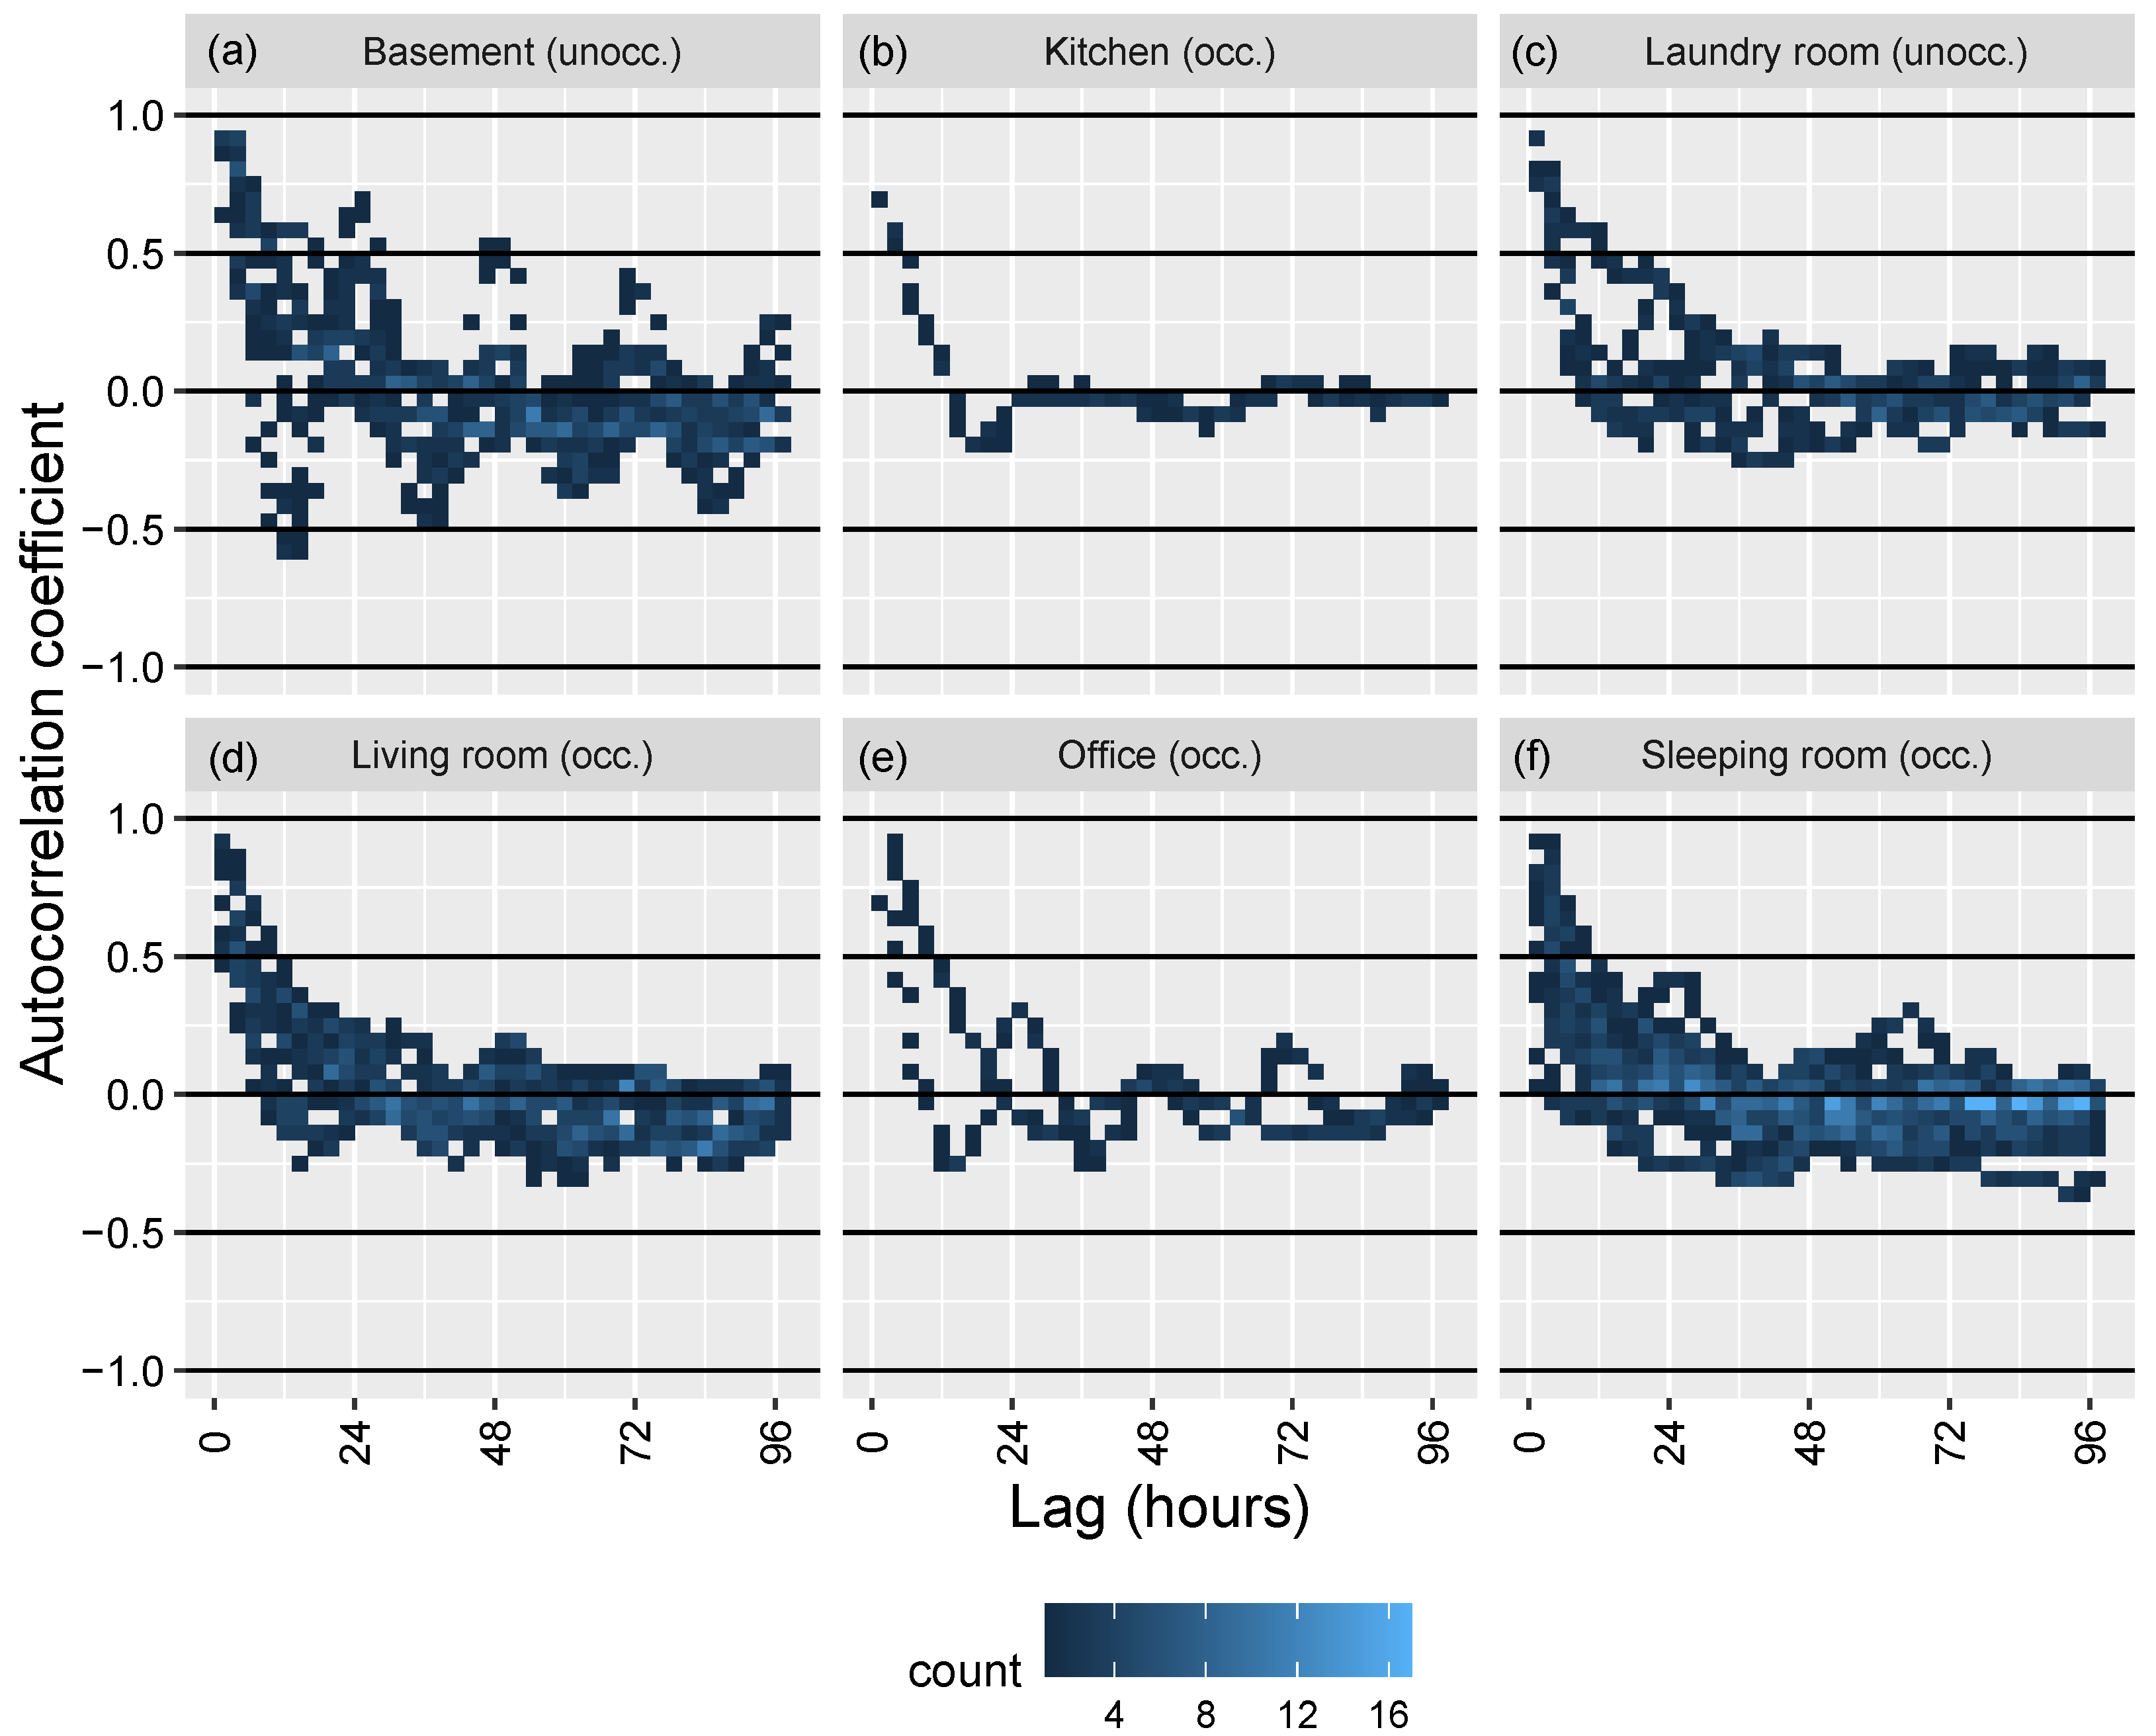
Figure 2 depicts the autocorrelation values for each radon time series with lags from 0 to 96 h. Density plots are shown in the main text, but further information regarding the time series regarding their location is presented in
Figure A1. On the one hand, one should note that the radon dynamics are different for occupied and unoccupied spaces and that there is no significant influence of the radon time series on themselves after a few hours in occupied spaces. On the other hand, the data reveals some significant differences for unoccupied spaces. Autocorrelation coefficients are higher and more cyclical in basements than in laundry rooms, the latter behaving similar to occupied spaces such as sleeping and living rooms.
3.2. Correlation Coefficients
Correlation coefficients between meteorological parameters and IRL were investigated in different spaces, both occupied and unoccupied.
Figure 3 reveals a higher influence of meteorological parameters in unoccupied spaces. Basements show a larger dispersion of correlation coefficients, which is a clue for a higher influence of meteorological parameters. However, correlation coefficients measured in occupied spaces are less widespread. Moreover, we also noticed that the investigated laundry rooms behaved similar to occupied spaces.
In unoccupied spaces, it seems that IRL has a tendency to be anti-correlated with outdoor air temperature. In addition to this observation, relative humidity seems to be positively correlated with IRL in both occupied and unoccupied spaces. Although correlation coefficients remain low for temperature, we might notice a tendency to anti-correlation in occupied spaces as well.
3.3. Cross-Correlation Coefficients
Cross-correlations analysis aims to highlight the influence of the evolution of meteorological conditions on IRL.
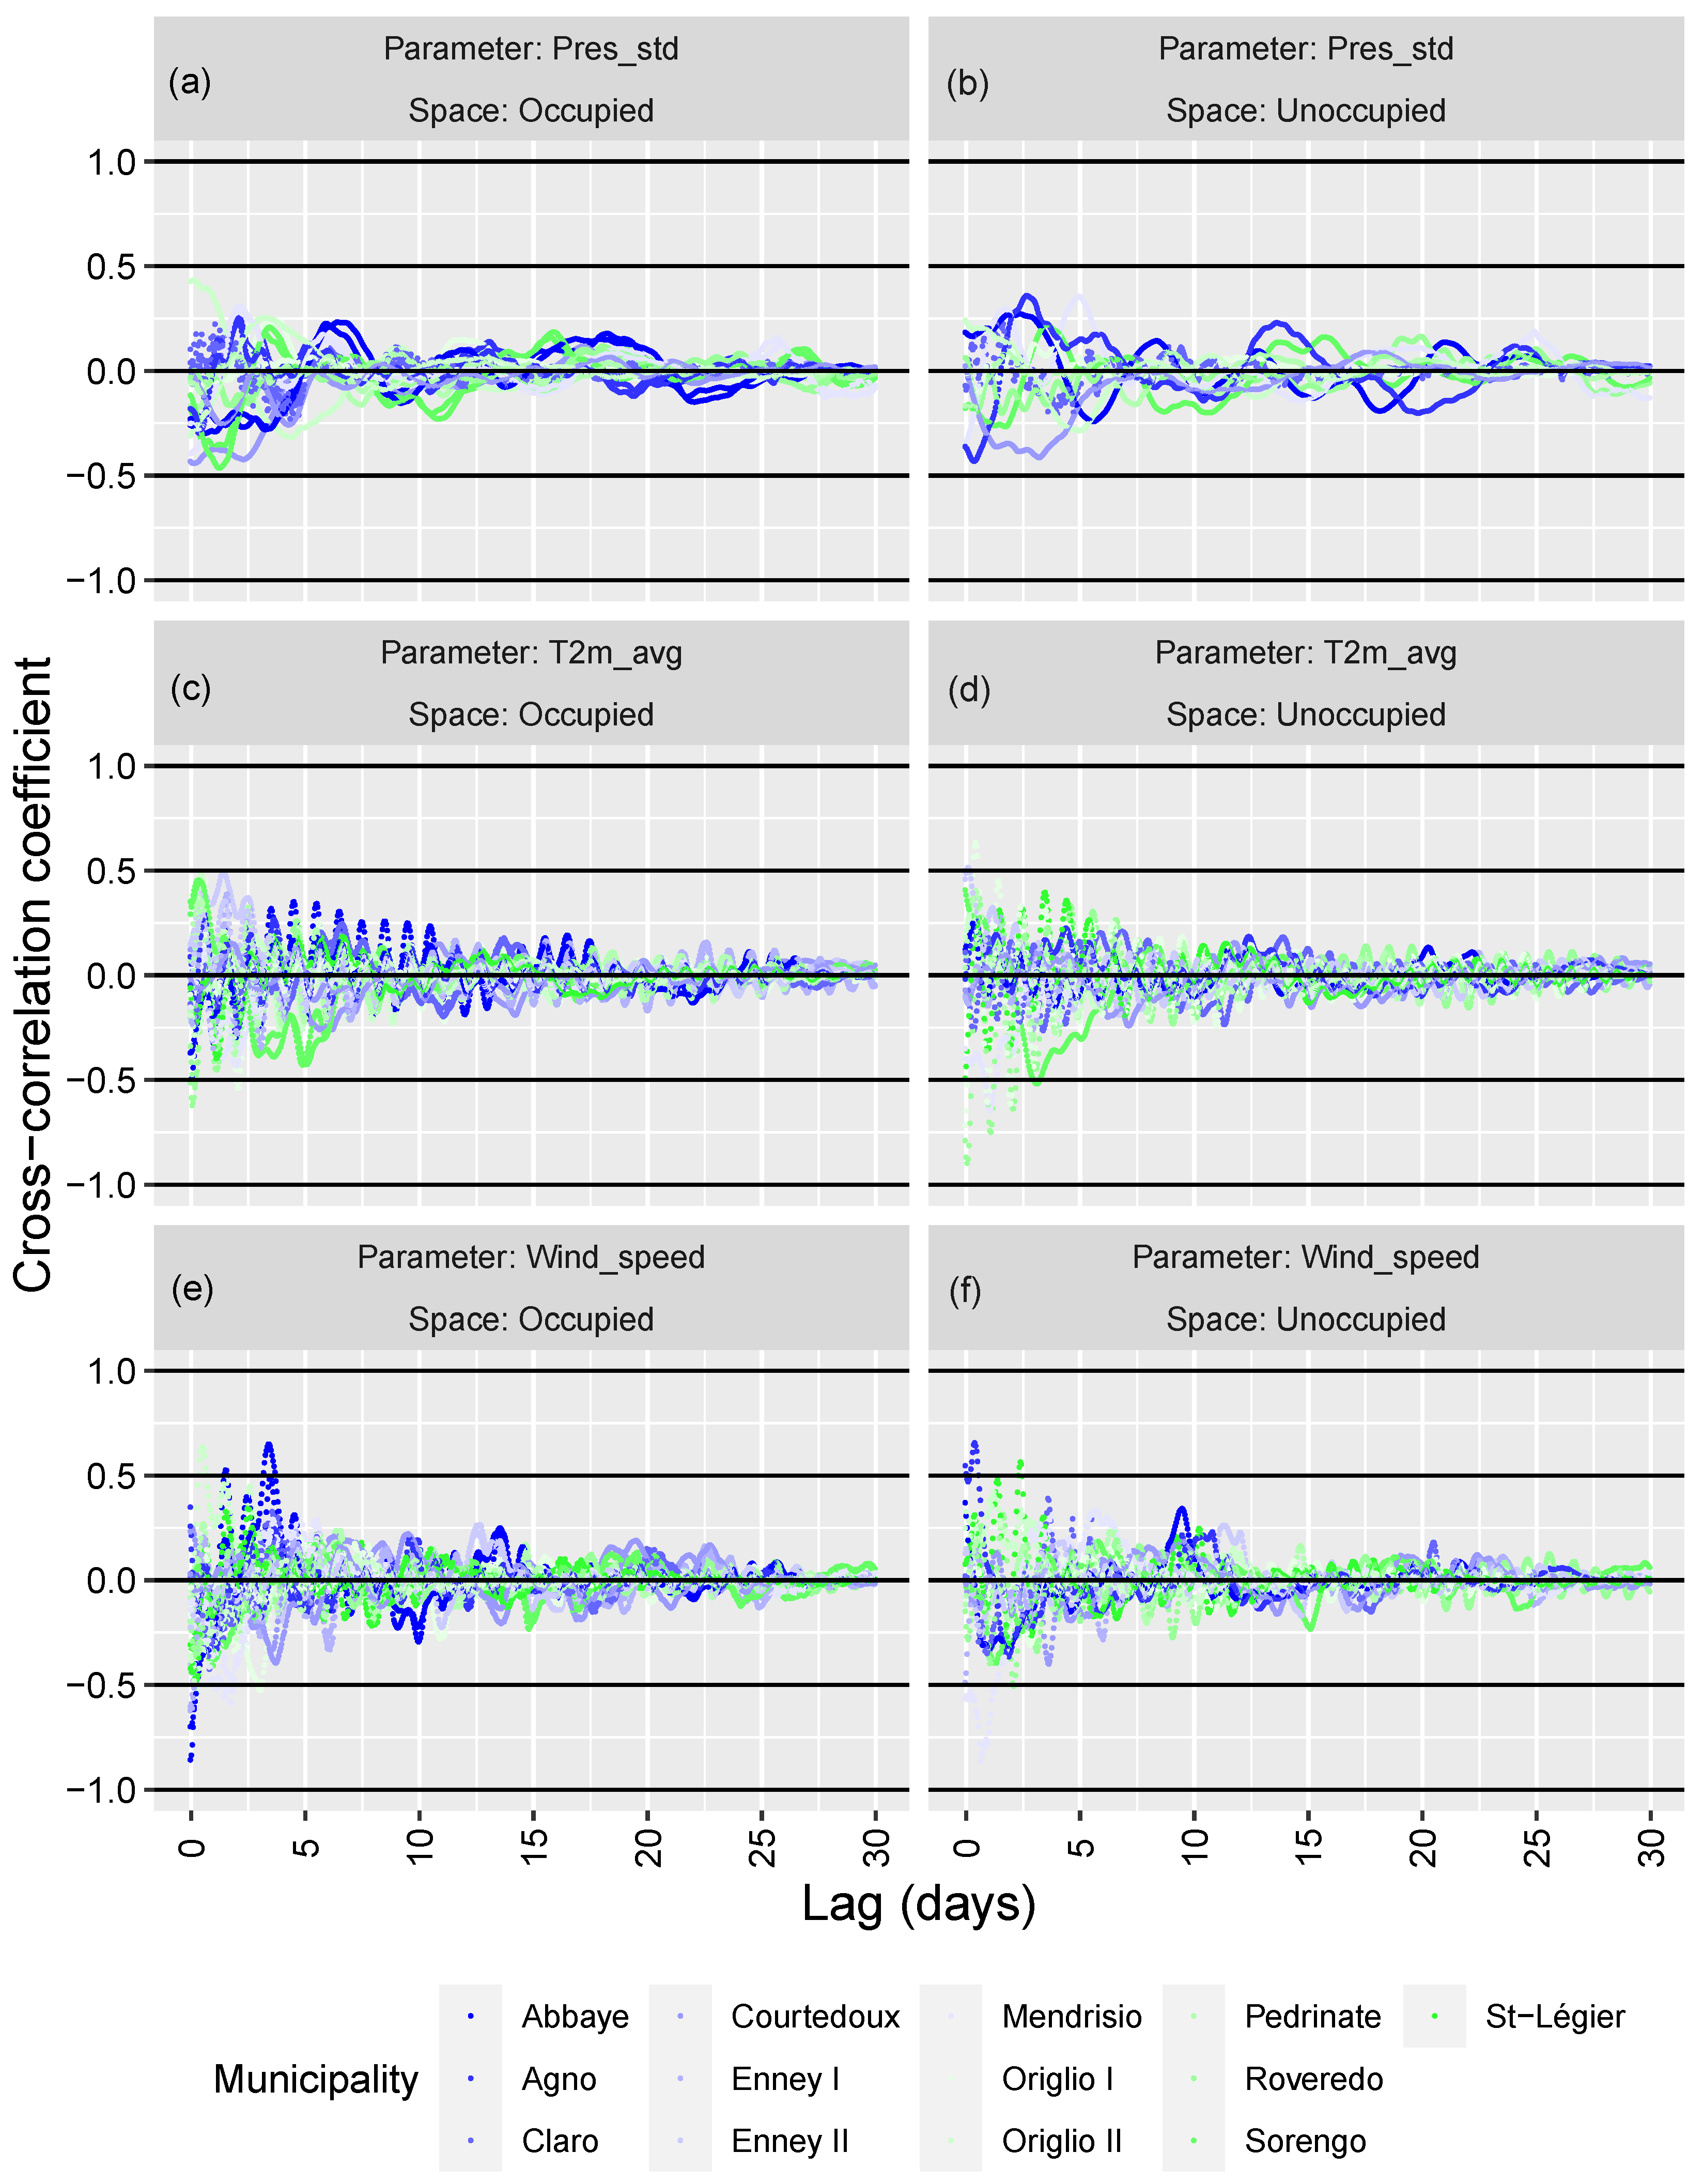
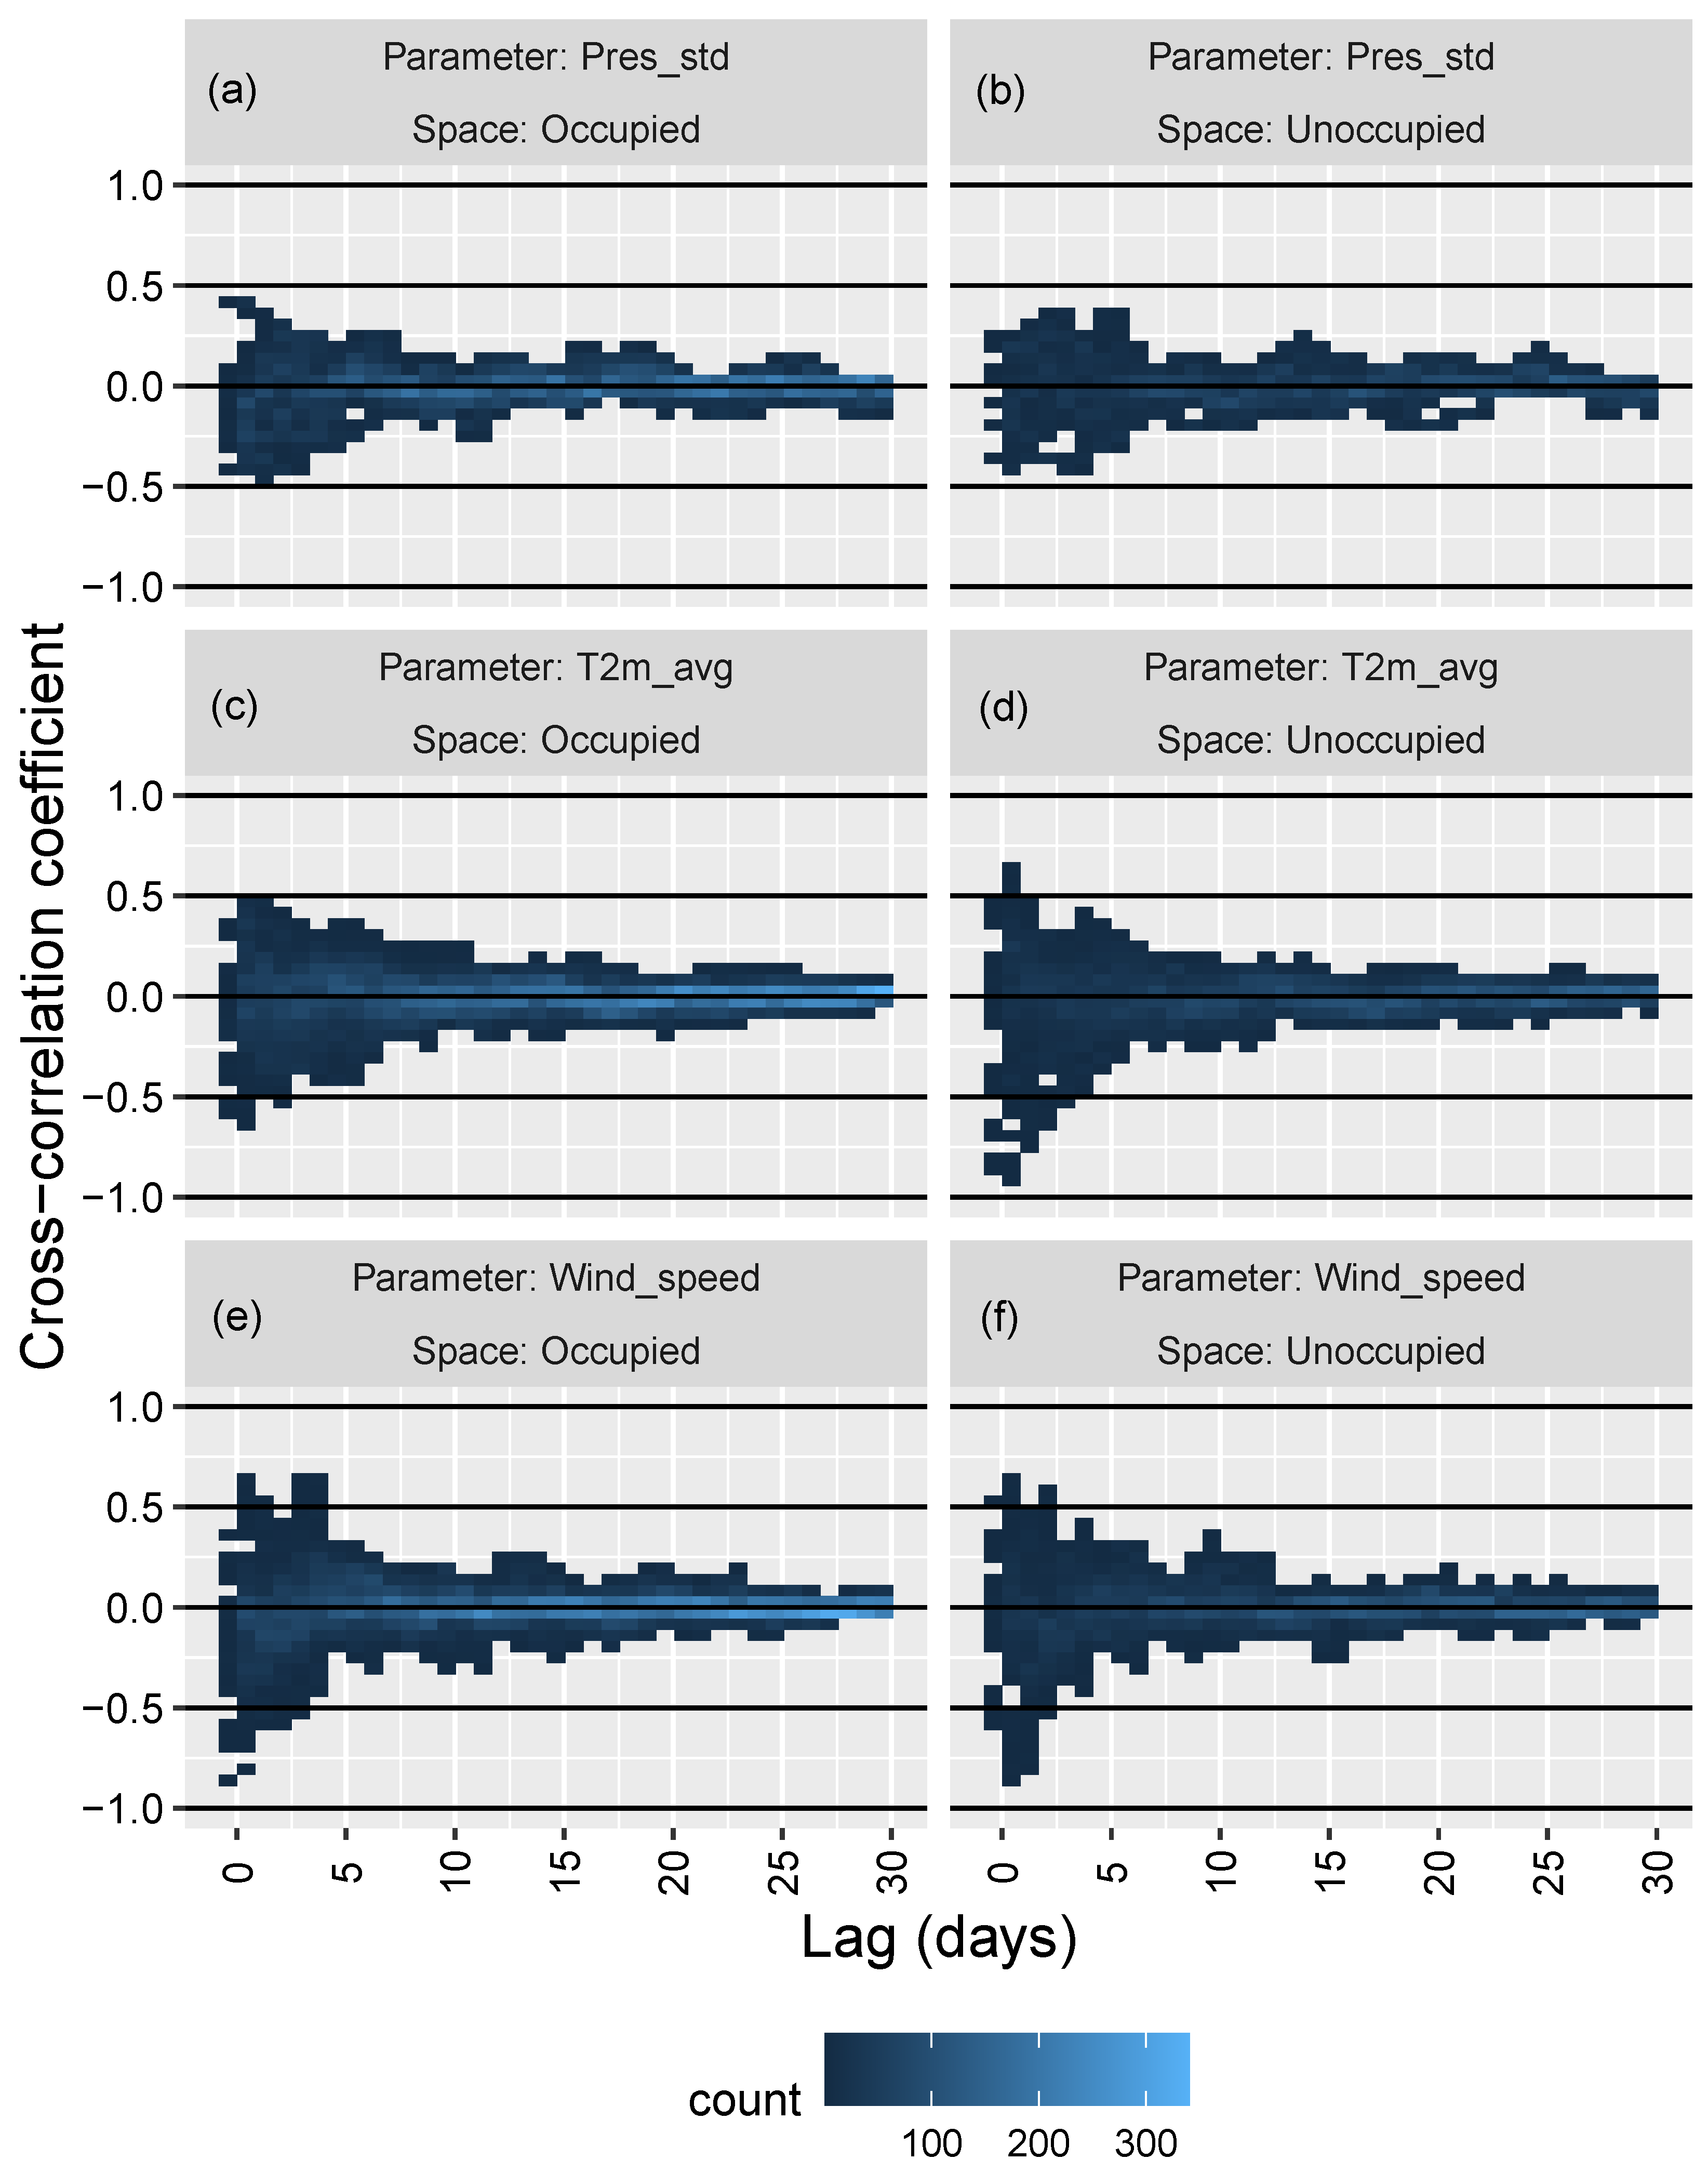
Figure 4 depicts the influence of standardized pressure, outdoor air temperature, and wind speed on IRL in both occupied and unoccupied spaces. Overall, the influence of the selected meteorological parameters seems to have been significant only over the previous five days. This underlines that meteorological conditions measured more than five days prior to the beginning of the short-term measurement do not significantly influence the IRL, both in occupied and unoccupied spaces.
Among the investigated meteorological parameters, prior outdoor air temperature influences the most IRL, and this, according to a 24-h cycle (cf.
Figure A2). Although cross-correlations coefficients vary on a very small scale (
), the influence of outdoor air temperature is consistent over the 30 prior days. Moreover, this influence is consistent among buildings. On the contrary, wind speed and atmospheric pressure’s influences are different in between the different buildings and not significant over a five-day lag.
3.4. Multiple Linear Regression
This section aims to determine the relative influence of each meteorological parameter on IRL. To that end, multiple regressions were used to forecast IRL according to the different meteorological parameters.
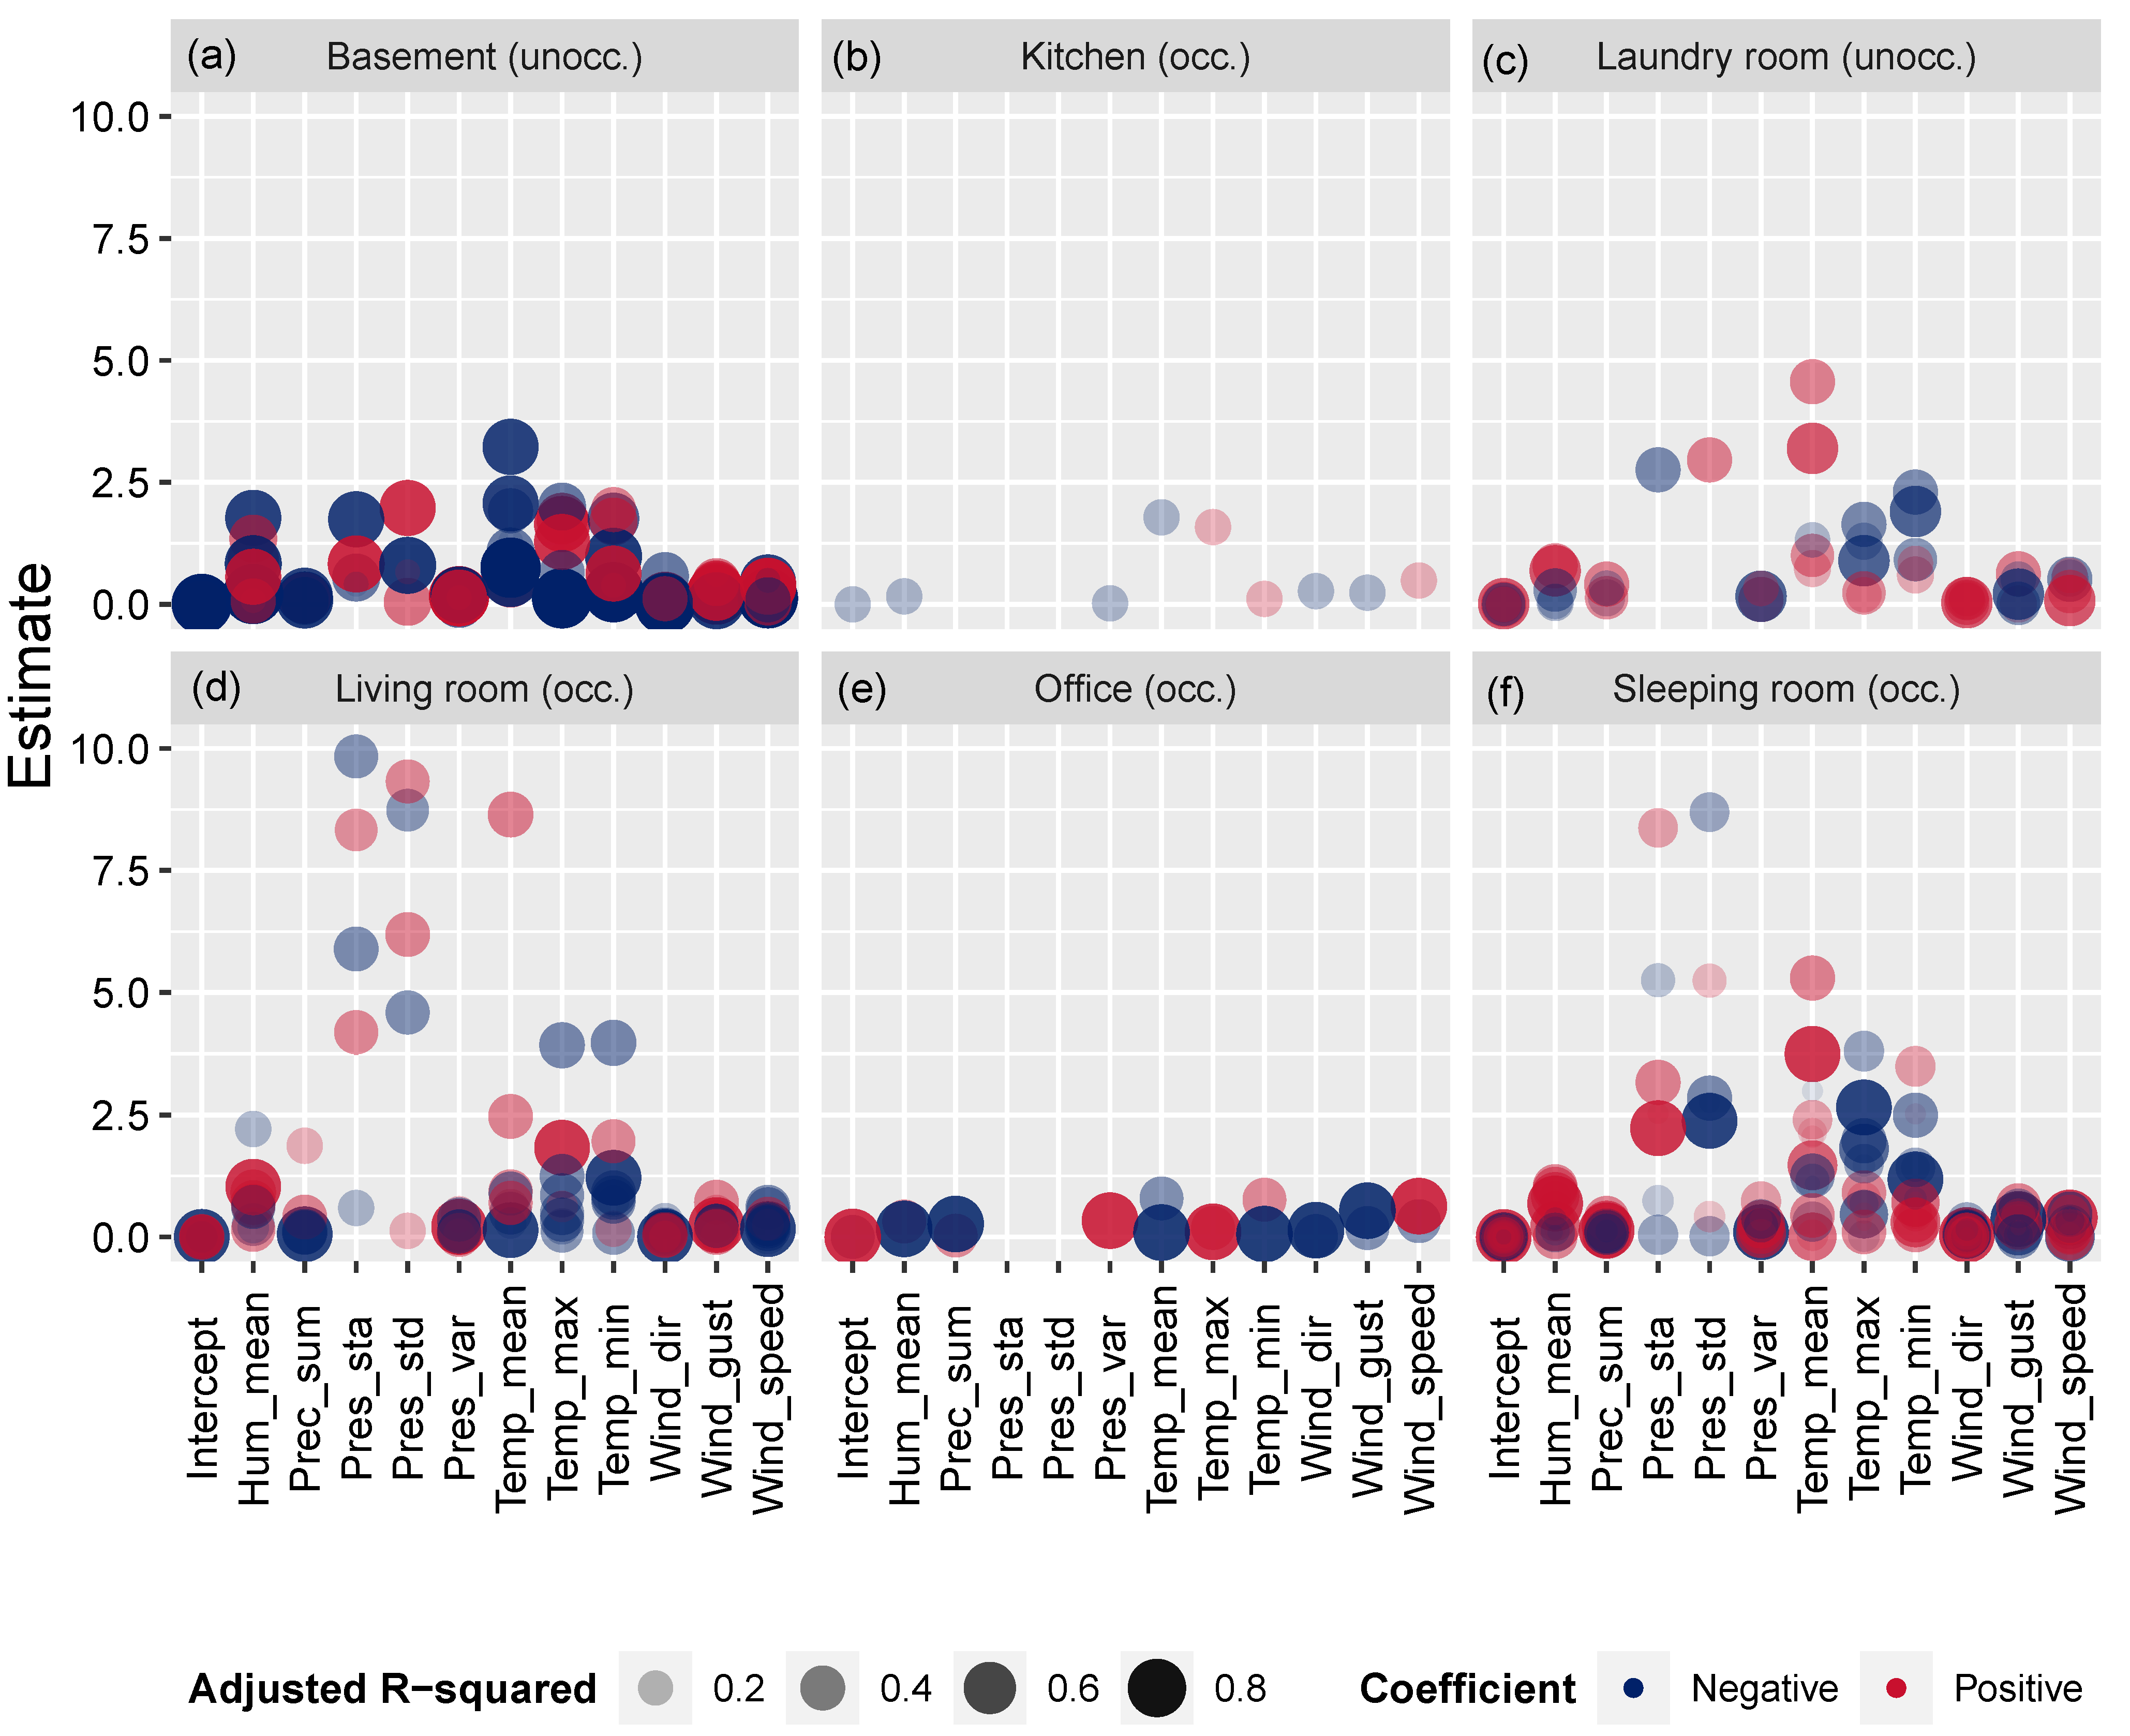
Figure 5 presents the estimates according to the value of the adjusted R-Squared (
).
represents the percentage of IRL’ variances that might be explained by the meteorological parameters. The closer is the
value to 1, the greater the influence of the meteorological parameters on IRL. In
Figure 5,
was illustrated as proportional to the dot size and opacity.
Since meteorological data were standardized, the resulting estimates for each meteorological parameter refers to their relative weight in the prediction. Higher is the estimate, higher is their influence on IRL. Moreover,
Figure 5 allows us to assess, through the colors, if meteorological parameters are positively (red) or negatively (blue) linked with IRL.
ranges from up to , which suggests that the investigated spaces presented huge variability. At first, we noticed a clear difference between occupied and unoccupied spaces, especially basements. in basements is higher than in laundry rooms and other occupied spaces. This underlines the higher influence of meteorological parameters on IRL in this type of space (i.e., basement). Even though variability is higher in occupied spaces, as depicted especially in living and sleeping rooms, high values of were assessed in these spaces. This underlines that, in some cases, the influence of meteorological parameters on IRL might also be high in occupied spaces.
Furthermore, estimates behaved differently between occupied and unoccupied spaces. In basements, hourly mean temperature, followed by maximum and minimum temperatures, mean humidity, and pressure, seem to be determinants to explain IRL. However, mean temperature is the only one that presents a similar and constant negative link with IRL. In occupied spaces, such as living and sleeping rooms, atmospheric pressure, both at site and standardized, presents the highest values of estimation. Even though estimates are high, remains lower. Moreover, it is relevant to note that atmospheric pressure on site and standardized pressure are almost systematically opposed in terms of mathematical sign but similar in absolute values. Furthermore, temperature parameters present globally the second-highest estimate values, while seems to be higher than for the one most explained by atmospheric pressure. Overall, these results suggest that the lower the for an occupied space, the higher the estimates for both atmospheric pressure and temperature. On the other hand, the higher the , the closer to zero are the estimates for all the parameters.
Figure 5 underlines the low influences of relative humidity, precipitation, atmospheric pressure variations, and wind on IRL measured in occupied spaces. Finally, the intercept (automatically generated by the regression tool) does not influence the explanation of IRL because of the preliminary standardization of the meteorological data.
4. Discussion
First, we noted a significant discrepancy between occupied and unoccupied spaces in terms of the impact of weather parameters on IRL. Both autocorrelations and correlation analyses suggested that unoccupied spaces are more influenced by the meteorological conditions. On the one hand, autocorrelations showed a daily cycle (peaks after 24 h, 48 h, and 72 h) among radon time series measured in unoccupied spaces. These cycles are depicted by a high density of significant correlation coefficients in
Figure 2a and, in a similar way, by dots in
Figure A1a after 24 h, 48 h, and 72 h. On the other hand, lower correlation coefficients were measured between IRL and weather conditions in occupied spaces. The 24-h cycle might be interpreted as follows: the daily variation of outdoor air temperature influences the temperature difference between indoor and outdoor environments and, therefore, the differential pressure between in- and outdoor environments. Different authors showed that radon diurnal variations are mainly linked with outdoor air temperature dynamics. Moreover, outdoor temperature variations shape how occupants live (i.e., ventilation during summer and heating in winter), which also influence radon dynamics (i.e., stack effect, ventilation) [
5,
21]. Consequently, unoccupied spaces are more impacted by weather conditions, while occupied spaces are influenced by both weather and occupant behavior. Moreover, unoccupied spaces, such as basements, are often in close contact with the ground (e.g., bare-ground, beaten earth, but also concrete slab) and less influenced by human activities (e.g., heating, ventilation). We can therefore infer that IRL in unoccupied spaces is more influenced by the weather (e.g., temperature) than in occupied spaces. This finding is supported by the cross-correlations analysis: globally, a larger influence was observed during the first five days for the three investigated parameters (cf.
Figure 4).
Ultimately, multiple linear regressions resulted in a larger part of the indoor radon variance being explained by the meteorological parameters (cf.
Figure 5). These results tie well with previous studies, which also demonstrated that unoccupied spaces, such as basements, are more influenced by external factors (i.e., meteorological and geological) [
15,
19,
25]. We obtained good and consistent results with these statistical methods, which consolidate and strengthen previous insights.
Considering the different types of occupied spaces, small differences were highlighted, especially across living and sleeping rooms, in terms of correlation coefficients between IRL and meteorological parameters. A slightly higher influence of weather conditions on IRL is depicted by correlation coefficients and multiple linear regression analyses (cf.
Figure 3 and
Figure 5). At this stage of understanding, we believe that occupants’ uses and habits in sleeping rooms are less diverse and dynamic than in living rooms. Indoor conditions may stay more stable in sleeping rooms, which results in a lower influence of occupants and a higher influence of meteorological parameters, similar to basements, but not to the same extent.
The relative influence of the different meteorological parameters on IRL has been highlighted by different statistical analyses. Although meteorological parameters seem to be more influential IRL in unoccupied spaces than occupied ones, we noticed some different influences between them. Our results show that outdoor temperature is the most significant parameter. Significant anti-correlations between IRL and air temperature were calculated in unoccupied spaces; in these, a tendency to anti-correlation has been found. Cross-correlation analyses corroborate previous results in both occupied and unoccupied spaces. Finally, multiple linear regressions highlighted the large influence of air temperature (mean, maximum, and minimum) in both unoccupied and occupied spaces. These results are consistent with previous observations and studies carried out in Switzerland [
4,
5,
12,
24]. Furthermore, multiple linear regressions highlighted the large influence of atmospheric pressure. It has been previously shown that atmospheric pressure does not influence much IRL over the long term [
5], although on the short term, pressure variations might [
4]. In this paper, we highlight the influence of atmospheric pressure in occupied spaces, which is consistent with previous literature. Finally, relative humidity seems to be a determinant in basements, while the influence varies between correlation and anti-correlation. Other meteorological (i.e., precipitation and wind) parameters investigated within our dataset do not present a link with IRL.
5. Conclusions
In this paper, we aim to assess the influence of meteorological parameters, such as air temperature, moisture, pressure, precipitation, and wind, on IRL monitored during short-term measurements, using a methodology developed in Switzerland. Based on hourly meteorological and radon measurements, we conducted different statistical analyses in order to answer a number of research questions that aimed to assess the reliability of the radon short-term measurement method.
Through different statistical analyses, we identified strong influences of meteorological parameters on indoor radon measurements monitored during the short-term radon measurement method. Outdoor temperature, atmospheric pressure, and relative humidity are, respectively, the most determinant parameters on one-week measurements. According to a cross-correlation analysis, meteorological conditions from five days prior to the beginning of radon measurement periods showed a statistical link with IRL. Among the investigated indoor spaces, unoccupied spaces were the most influenced. Indeed, the less important influence of occupants enhances the impact of meteorological parameters. In contrast, some of the occupied spaces might be more airtight, which results in a stronger reduction of the influence of meteorological parameters. Consequently, occupants’ behavior will become the determinant factor for IRL.
Although we noticed a strong trend, differences exist across the different buildings, which are illustrated throughout this paper. Ultimately, there are reasons to presume that building characteristics impact the magnitude of the influence of past and present weather conditions on IRL, even though it is difficult to address this point here. The most decisive aspects might be the building’s structural system, its age, its occupation, and especially the condition of built surfaces in contact with the ground.
Overall, the influence of some weather parameters on IRL measured during a short-term measurement is significant. The impact varies depending on whether the indoor space is unoccupied or occupied, how far it is from the ground, whether it is airtight or not, and whether it is a used space or not. It is of paramount importance to take these factors into account when analyzing the results of short-term measurements, and more specifically, to consider the evolution of the weather conditions five days prior to the measurement.
In light of these conclusions, different practical recommendations addressed to professionals might be emphasized. Firstly, unoccupied spaces are often more impacted by meteorological conditions. We recommend taking these parameters into account during the analysis of the measurements. Furthermore, the unoccupied space must be the least isolated space within the house. We highlighted that laundry rooms, often considered unoccupied spaces, showed results similar to those of occupied spaces such as living rooms. Finally, to analyze the influence of weather on IRL during a short-term measurement, it is relevant to consider weather parameters five days prior to the beginning of the radon measurements.
This paper brought up different conclusions that are consistent with those found in the literature. In order to improve the robustness of our findings, increasing the sample size of the selected buildings would be needed, as would the conditions in which these radon short-term measurements are carried out (i.e., season, artificial indoor depressurization). Therefore, future research should consider the potential effects of both meteorological conditions and building characteristics (i.e., floor, building type, and thermal insulation) more carefully, which would be practicable with a larger sample.
Despite these limitations, the outcomes highlighted above are very valuable for understanding the relationship between indoor radon levels and meteorological parameters. Our results being in-line with those found in the literature, practitioners and professionals who perform radon short-term measurement should be careful while analyzing their results. Moreover, our results show a strong influence of weather on radon levels measured locally in buildings, and this depends on whether or not the space is occupied or not. Occupied spaces, those most at risk of radon exposure to occupants, are less influenced by these conditions than unoccupied ones (e.g., basements). Nevertheless, this finding leads us to believe that the results of short measurements can be influenced by atmospheric conditions. The interpretation must therefore take this into account. At this stage, this study does not allow us to formulate precise recommendations as to the ideal meteorological conditions required during a short measurement. Currently, the method requires that an under-pressure between −4 to −0.5 Pa must be recorded for at least 80 % of the measurement time in the lowest occupied room of the dwelling in order to generate conditions close to those observed during the heating period, and that, independently of the current atmospheric conditions.
To further improve our assessment of the reliability of these measurements, the next step would be to compare the results of short measurements with official annual and winter measurements carried out in the same buildings, as well as with other short-term measurements that may or may not incorporate this artificial under-pressure during measurements. By considering all these factors, it will then be possible to estimate more precisely the probability of exceeding the national reference level and thus better anticipate the radon risks in buildings.
