Article

Comparison of Meteorological Drivers of Two Large Coastal Slope-Land Wildfire Events in Croatia and South-East Australia

by
Ivana Čavlina Tomašević
1,*,
Višnjica Vučetić
1,†,
Kevin K. W. Cheung
2,
Paul Fox-Hughes
3,
Paul J. Beggs
4,
Maja Telišman Prtenjak
5 and
Barbara Malečić
5
1
Croatian Meteorological and Hydrological Service, 10 000 Zagreb, Croatia
2
E3-Complexity Consulting, Eastwood, NSW 2122, Australia
3
Bureau of Meteorology, Hobart, TAS 7000, Australia
4
School of Natural Sciences, Faculty of Science and Engineering, Macquarie University, Sydney, NSW 2109, Australia
5
Department of Geophysics, Faculty of Science, University of Zagreb, 10 000 Zagreb, Croatia
*
Author to whom correspondence should be addressed.
Retired.
Atmosphere 2023, 14(7), 1076; https://doi.org/10.3390/atmos14071076
Submission received: 29 May 2023 / Revised: 18 June 2023 / Accepted: 22 June 2023 / Published: 26 June 2023

Abstract

:
Understanding the relationship between fire behavior and the driving weather conditions is critical for fire management and long-term fire risk assessment. In this study, we focus on two wildfire events: the Split wildfire in Croatia and the Forcett–Dunalley wildfire in Tasmania, Australia. The antecedent weather in both events included extremely dry conditions and higher-than-average air temperatures in the months prior to the events. The synoptic patterns in both events consisted of a large surface pressure gradient, which generated strong wind, driving the fire’s spread. The Weather Research and Forecasting (WRF) model was utilized to simulate fire weather conditions during the development of the two events. In the innermost domain of WRF, resolution is 500 m with explicit moisture calculation only, and there are 66 vertical levels, with about 20 of them to resolve the boundary layer. The WRF simulations are well verified by station observations, including upper-level wind speeds. The convergence line pattern in the Tasmanian event, which was conducive to intense plume development, has been well simulated. Only a slight discrepancy was identified in the simulation of the coastal change in wind direction in the Croatian event. It is identified that in the Split case, bura wind was highly coupled with an upper-level trough, which induced subsidence of the upper-level dry and cold air to the surface, causing rapid drying of the fuel. During the Forcett–Dunalley fire, the atmosphere was unstable, which enabled deep pyrocumulonimbus development. In general, the development from ignition to the timing of the most extreme fire intensity in both events was largely determined by the evolution of the surface to upper-level meteorological drivers. While these extreme meteorological conditions would impact fire-fighting strategies such as aircraft operations, a model-based estimate of the high-risk areas is critical. Our findings would also benefit an estimate of the climatology of fire events with similar behavior and thus a long-term fire risk assessment.

1. Introduction

Wildfires pose a significant environmental threat all over the world. Two of the most endangered regions are the Mediterranean basin and the Australian continent, and this research includes parts of these wildfire hot spots. Specifically, this comparison study considers the southern part of Croatia and the Southeastern part of the Australian island state of Tasmania. Although very distinct, both regions experience extreme fire weather such as heatwaves, drought, and episodes of strong wind in combination with complex topography, which includes mountains and hills backing a rugged coastline [1]. Moreover, recent studies detect an influence of climate change on the fire regime in both countries [2,3,4,5,6,7], such as higher fire danger, the extension of fire seasons, and an increase in the number of extreme events per season. As future projections show that such changes in fire regime will maintain this trend [8,9], new meteorological research on wildfires can help us better understand this complex phenomenon in order to improve fire weather forecasts as well as fire management in both regions.
This study builds on previous research [1,10,11], and is part of the research in the doctoral thesis [12]. A detailed overview of previous research on fire weather in the Mediterranean Basin, especially on the Adriatic coast and Croatia, and in southeast Australia is given in the review article [1]. It gives a detailed description of global fire regimes, describes how each meteorological property influences fire behavior, and presents an overview of European and Australian studies on fire weather with an emphasis on Croatia and southeast Australia. The study in detail listed synoptic patterns conducive to wildfires, presented research on wind- and heat-driven wildfires, and discussed the impact of climate change on fire regimes. A similar link between climate change and fire regimes has already been detected in both countries of interest [4,7,13,14,15,16,17]. Both countries have detected an increase in fire risk in recent decades, an increase in the number of fires and extreme events, and an extension of fire seasons, i.e., earlier onset and later ending. Future projections indicate a more hazardous fire regime in both regions, with more potential for extreme wildfire events [18,19,20,21,22,23]. The study also reviews how the different weather indices and numerical models have been applied in these two regions. On the Adriatic coast, high surface wind speeds, caused by the strong topographical effect, coincided with wildfire ignitions. Similar synoptic situations and the dynamic origin of the strong winds at meso-microscales associated with air dryness were observed in both regions during large wildfires.
In general, comparative fire weather analyses are lacking because, hitherto, severe fires have always been investigated in individual areas, and similarities and differences on synoptic and meso-scales, surface weather conditions, and the dynamic vertical structure of the atmosphere in different parts of the world during large fires have not been studied. Although separated in time and space, the chosen case studies must have similar meteorological drivers associated with the severity of fires. A comprehensive study of individual events can give us a unique opportunity for creating new knowledge and providing a model for interpreting factors that lead to severe wildfires. The systematic analysis of individual wildfire events contributes to an understanding of meteorological processes that impact fires, which is crucial for improving fire weather forecasts and warnings that save lives.
This is the first numerical weather prediction (NWP) analysis with high resolution of a significant Croatian fire/fire weather event and one of relatively few in the Mediterranean basin. The use of a high-resolution mesoscale model made a step forward in fire-weather research in Croatia. In the Tasmanian case, again, there have been relatively few high-resolution modeling studies of the weather associated with significant fire events. Mills and Pendlebury (2003 [24]) and Mills (2010 [25]) used operational high-resolution NWP models to investigate the passage of cold fronts across Tasmania, while Fox–Hughes (2012 [26]) again used operational NWP specifically to better understand the dangerous fire weather associated with cold frontal passages across Tasmania. Therefore, this is the first published NWP study detailing downscaled modeling at kilometer and sub-kilometer scales for these events and for Tasmania generally, and it extends understanding of the dynamic processes, including topographic effects, acting to generate the dangerous forestorms observed in both events.
Therefore, the aim of this research is to use a high-resolution numerical weather research model to analyze weather conditions accompanying ignitions and the most extreme fire behavior during two large wildfires, one from each region of interest—Croatia, Adriatic coast, and Southeast Australia, Tasmania. Two case studies with catastrophic impacts provided an opportunity to study some of the most extreme fire weather recorded to date in those regions. And although occurring in different hemispheres, the chosen cases share similarities in latitude, coastal setting, and topography. The Croatian case study is based on the Split wildfire in July 2017—the most severe wildfire in Croatia’s history given the size and unexpected fire behavior, which produced downslope fire runs into densely populated areas. The Australian case study is based on the Dunalley wildfire in January 2013, which caused vast destruction, rapid fire spread, and generated a firestorm in the form of a pyrocumulonimbus—the first on record in Tasmania.

2. Description of the Study Area and Extreme Fires

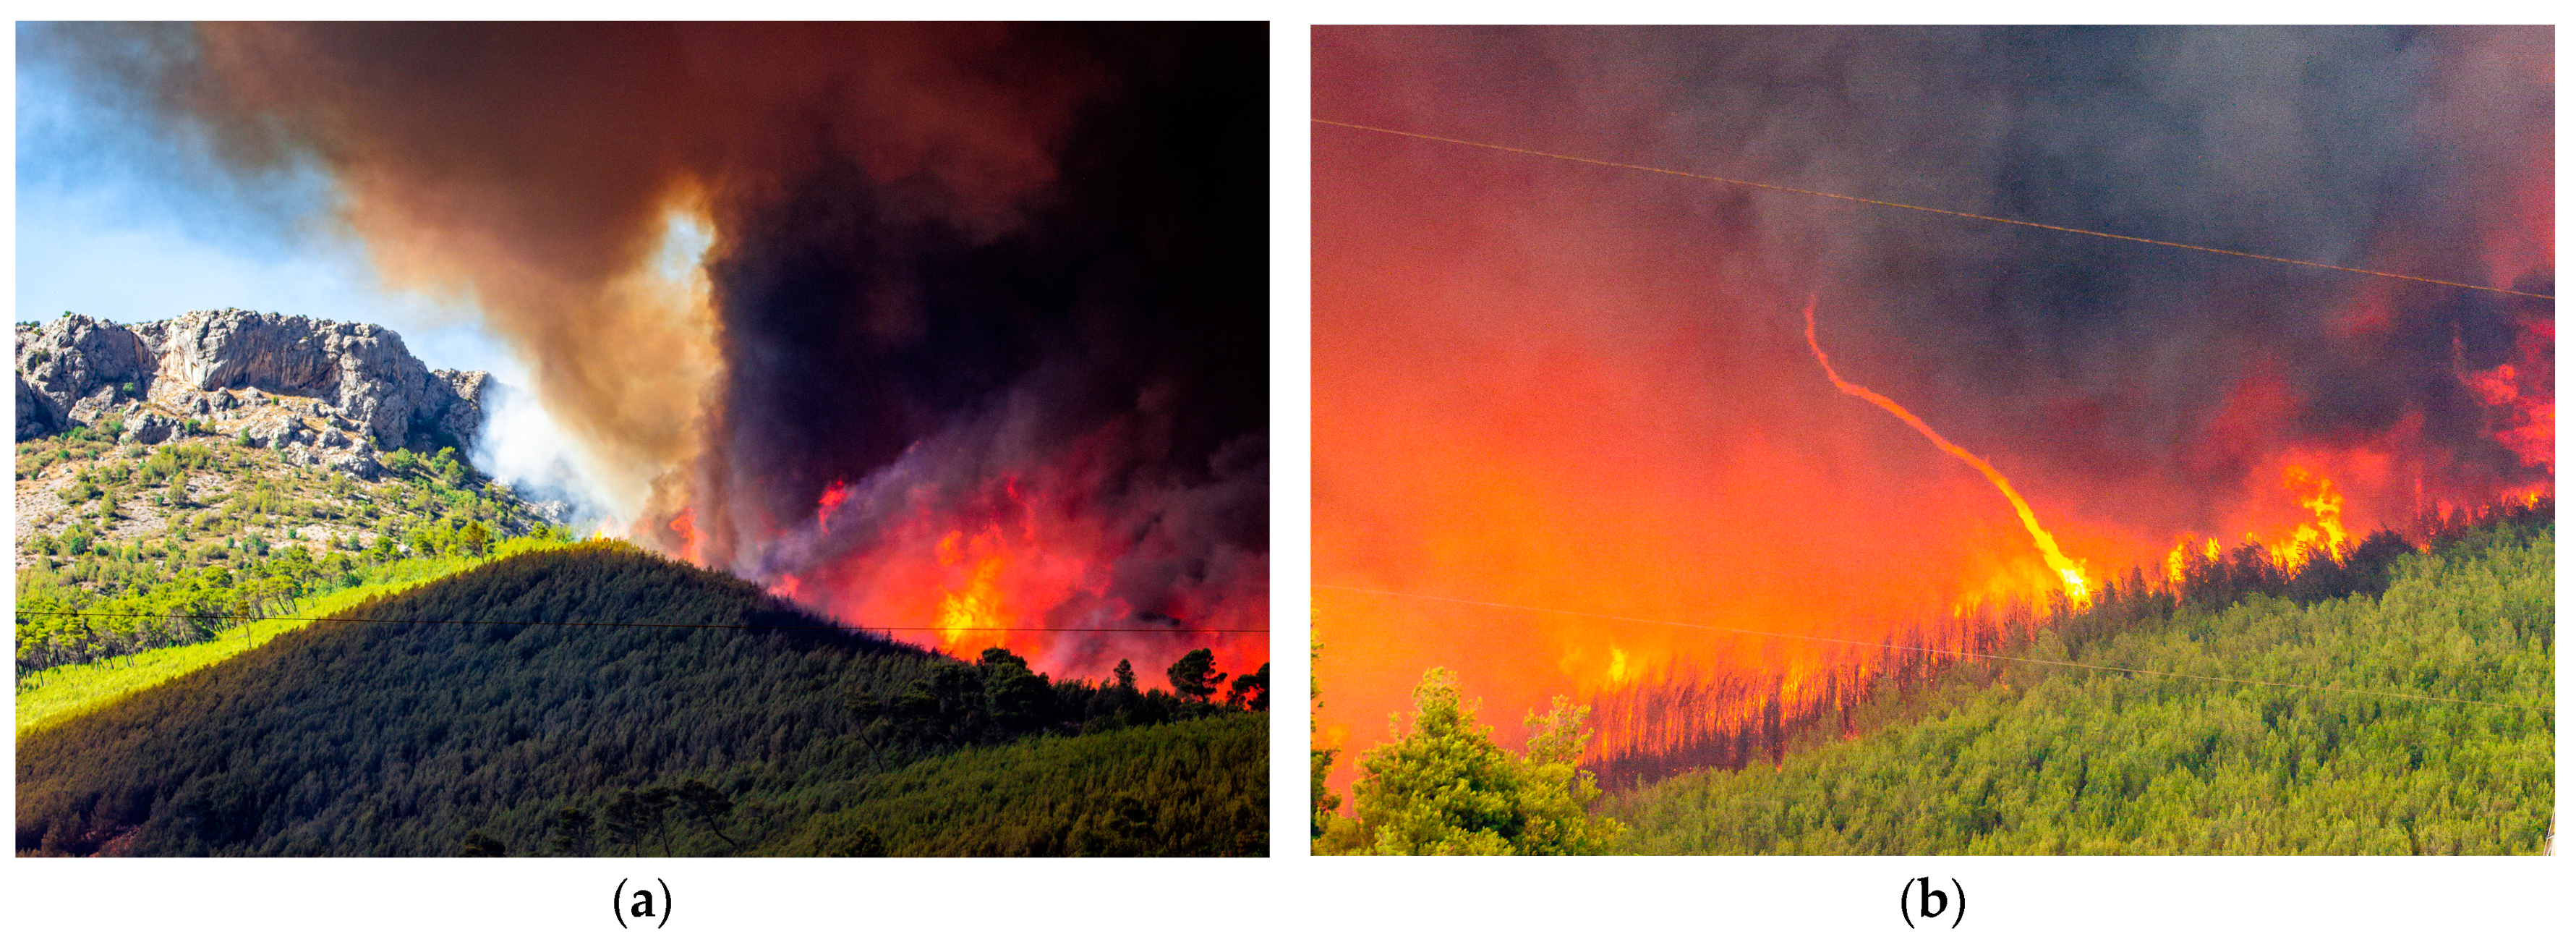
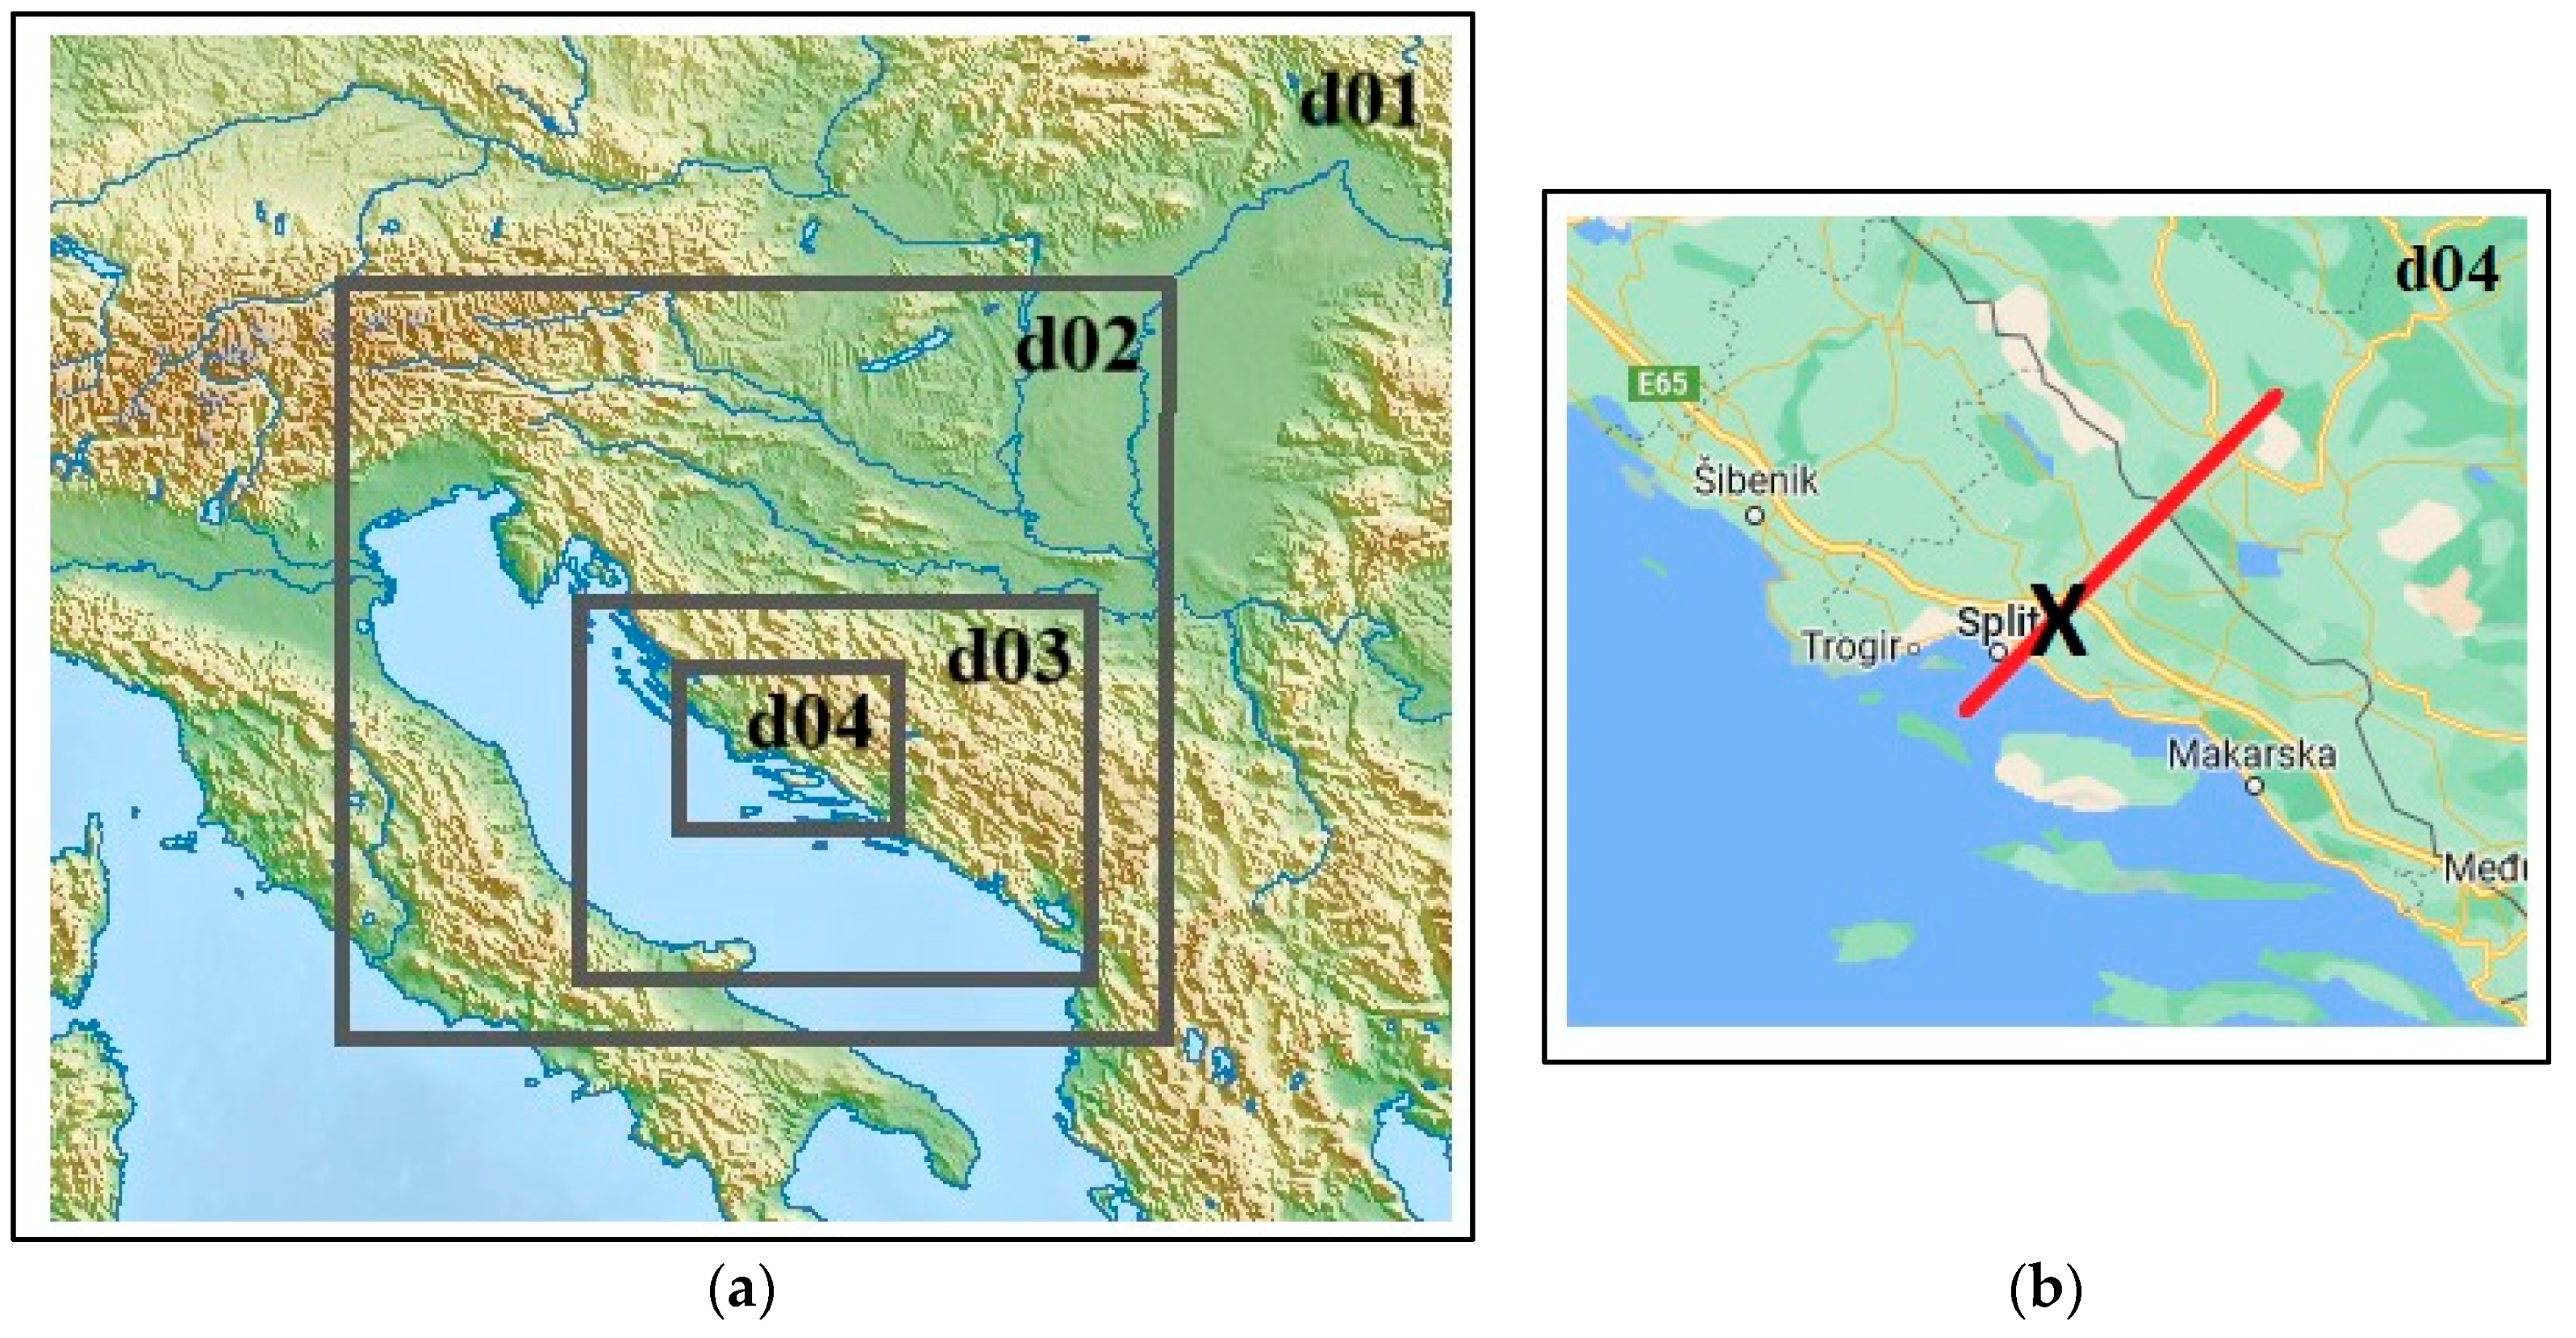
2.1. The Split Wildfire in Croatia

The catastrophic Split wildfire from July 2017 is referred to as “The Mother of all Wildfires”. It produced multiple runs into densely populated areas and stopped only 4 km from the historical city center at the peak of the tourist season. It burned 5122 ha in nine days (from 16 to 25 July 2017, [27]) and caused damage of US$ 20.6 million.
The Split wildfire was characterized by intense fire activity, which was caused by fire burning abundant dry fuels during favorable fire weather conditions. The fire burned within complex topography consistent with the steep mountains backing the coastline of the Adriatic Sea, which caused complex fire-atmosphere interactions and dynamics in the area, resulting in extreme fire behavior. The Split wildfire was reconstructed and analyzed in detail in Čavlina Tomašević et al. [10].
This research focuses on modeling fire weather conditions during two important periods related to the Split wildfire. The first is the late-night ignition at 22:38 UTC on 16 July 2017 which occurred under very strong and gusty Northeastern bura winds that quickly spread the ignited fire. The second important period of the wildfire will include an escalation in fire activity across all zones in the late afternoon of 17 July 2017. This period was characterized by extreme fire behavior, which included the most significant rapid downhill fire spreading into the city of Split with an approximate speed of 35 m min−1. Furthermore, the fire front during this period included crown fire, long-range spotting, and the generation of multiple fire whirls (Figure 1).

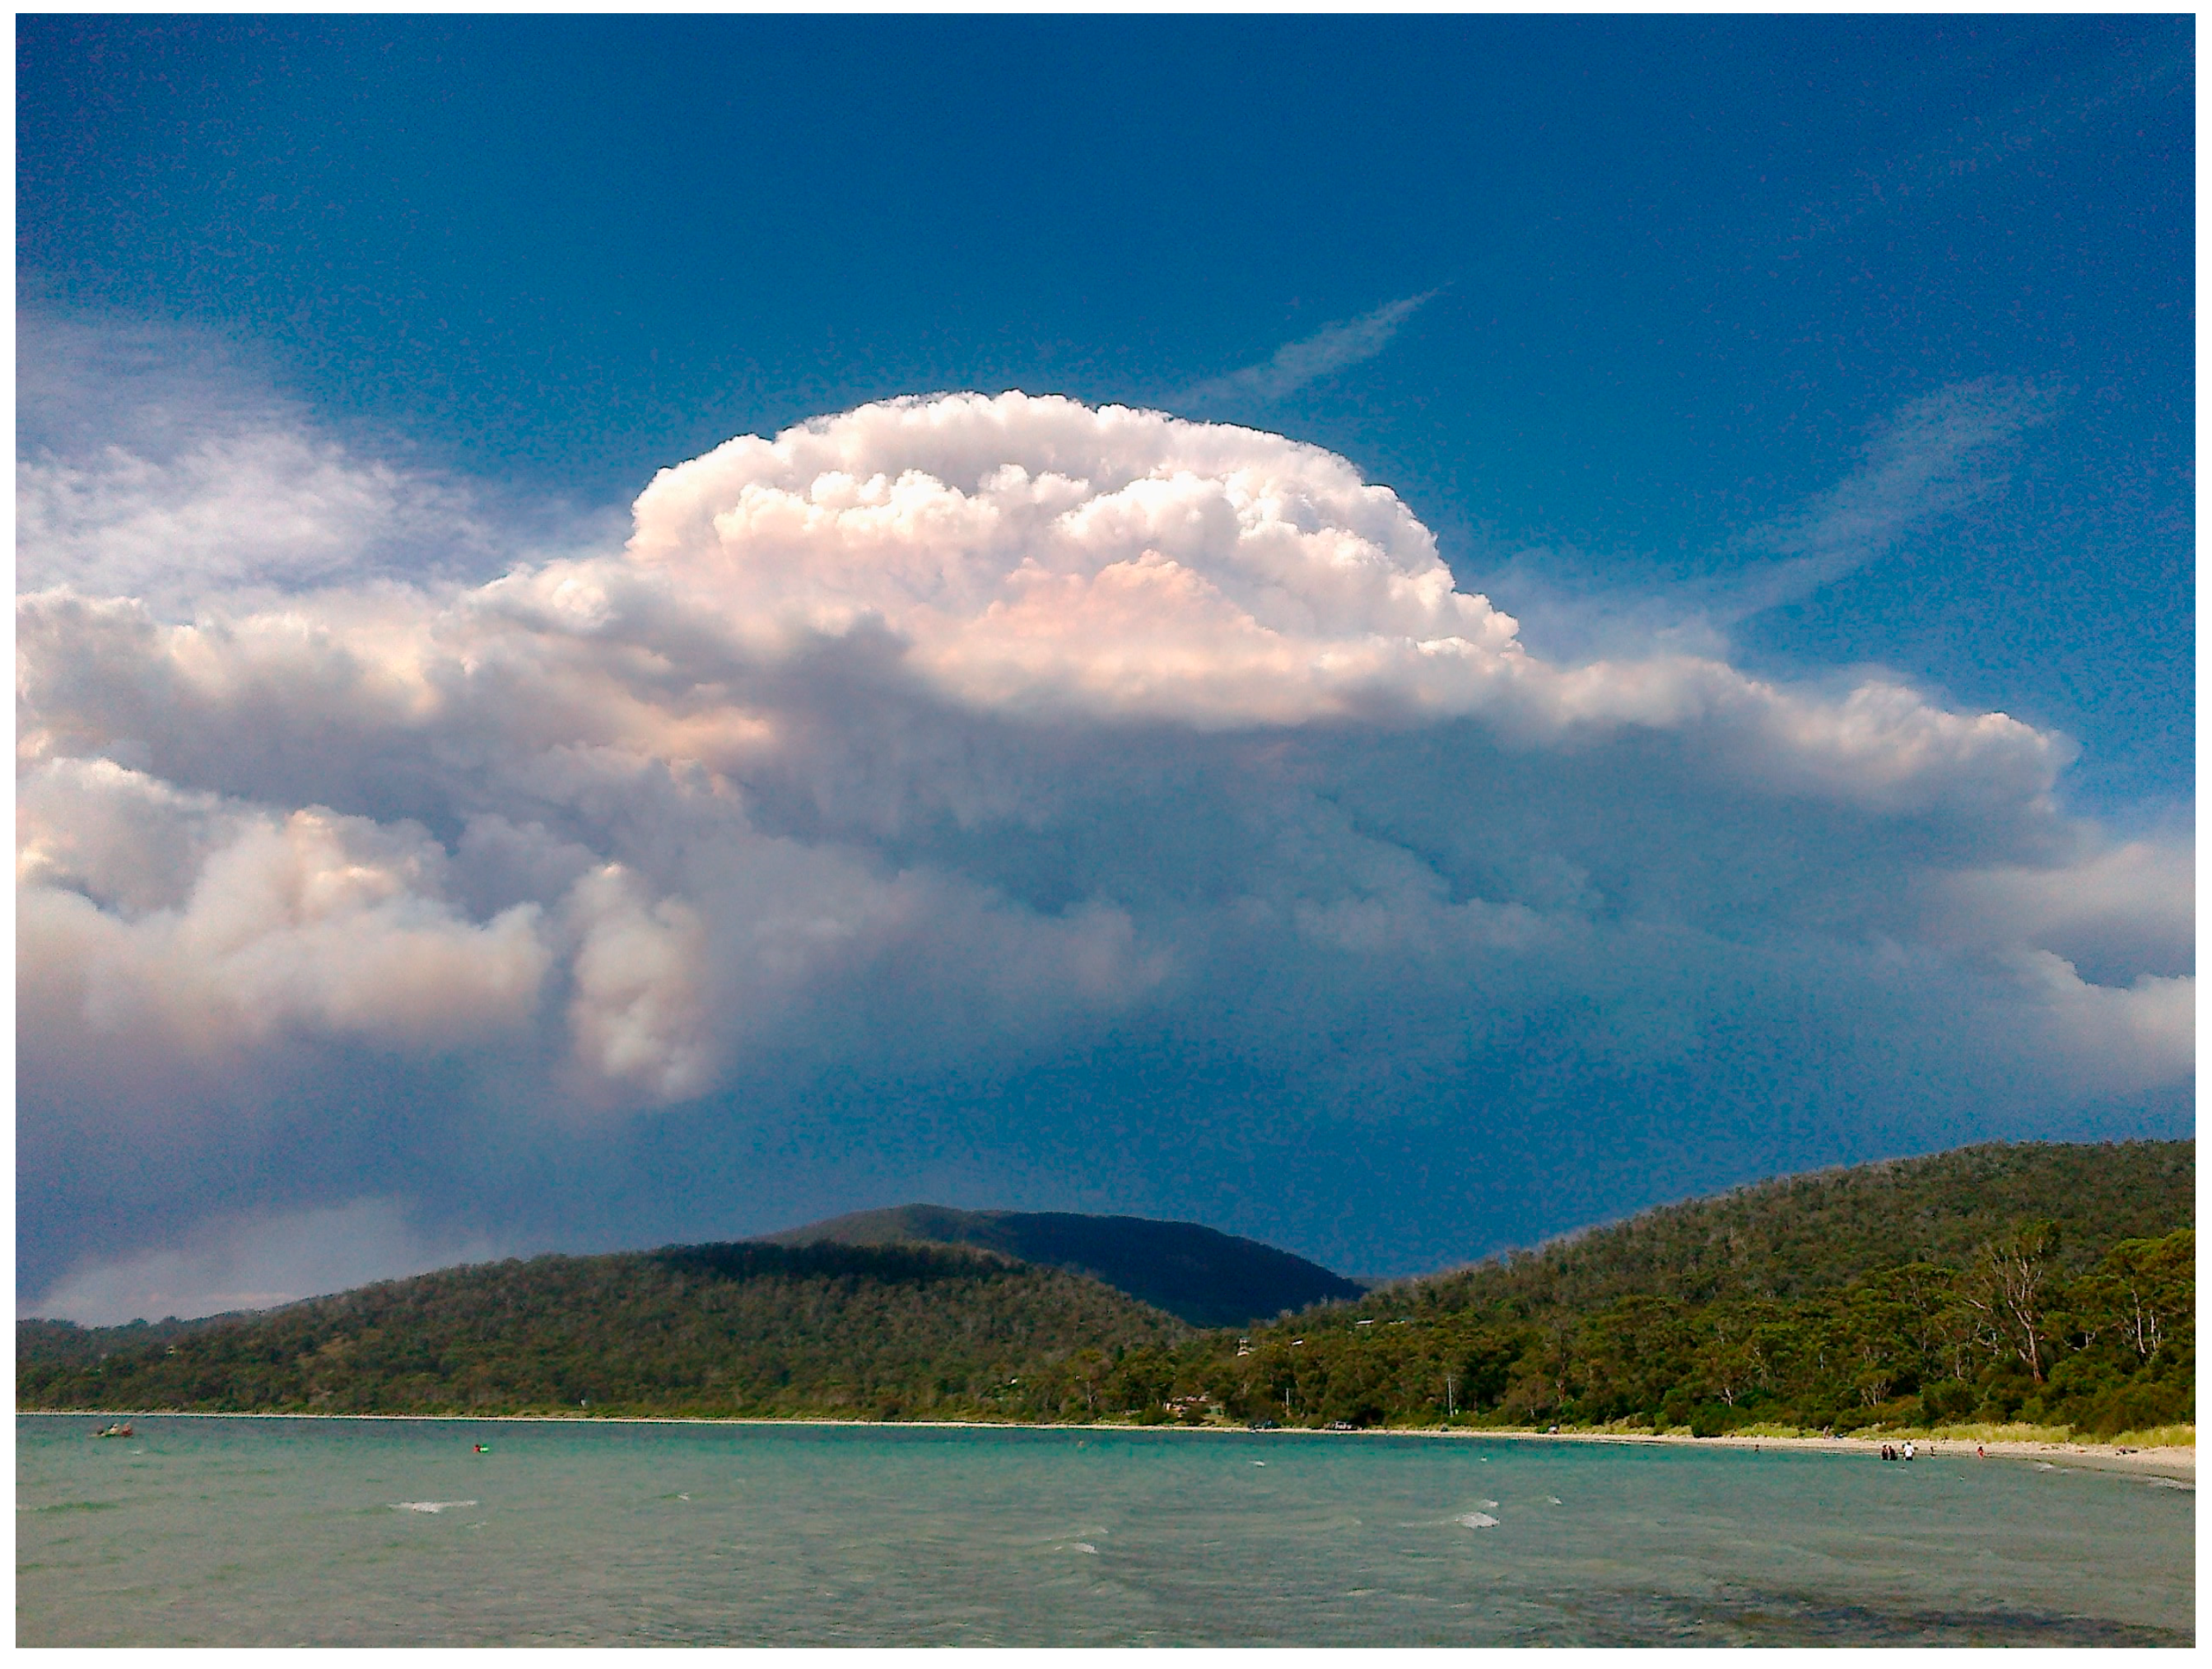
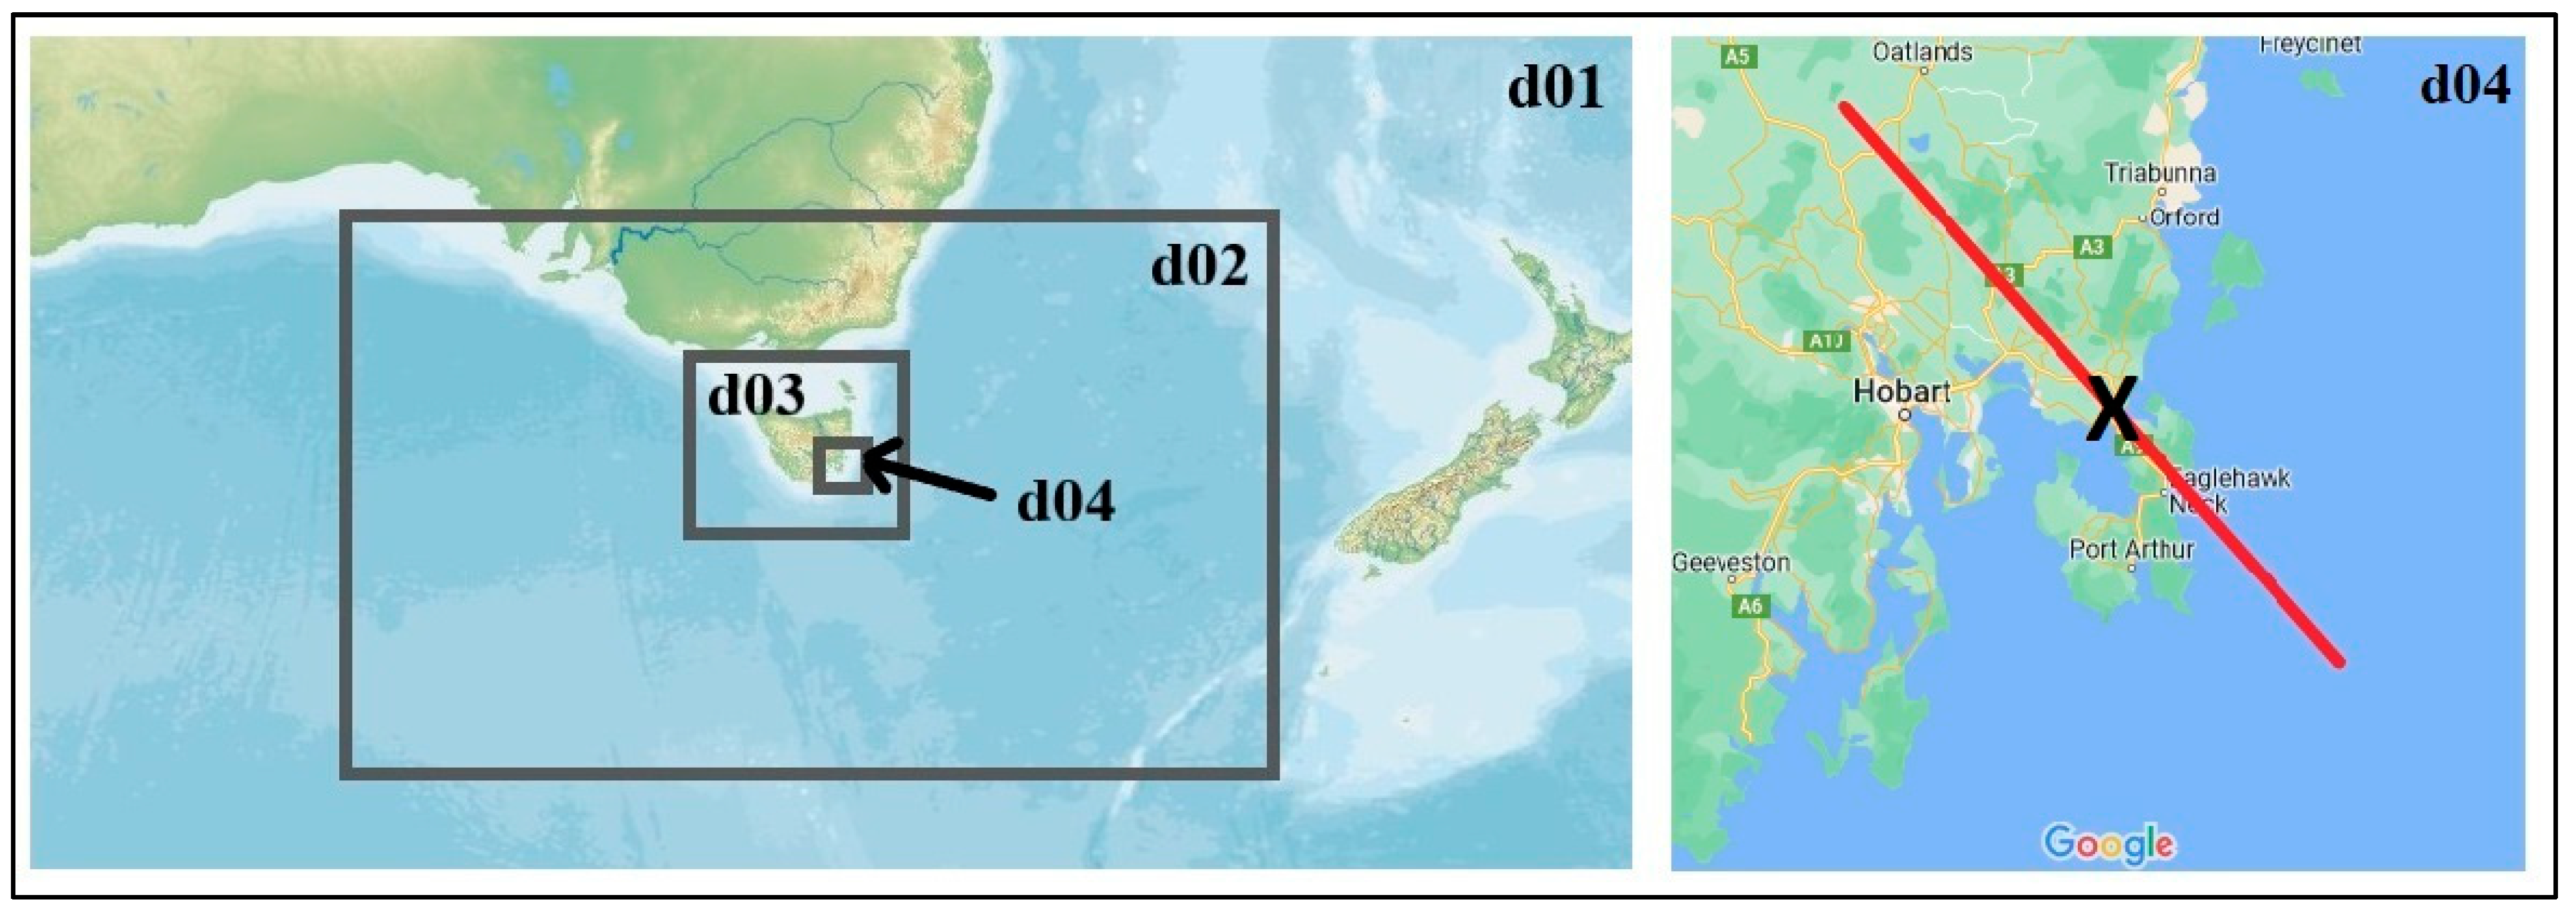
2.2. The Forcett–Dunalley Wildfire in Tasmania

The Forcett–Dunalley wildfire from January 2013 is the most catastrophic Tasmanian wildfire in the last five decades and the only one to have produced a fire storm in the form of pyrocumulonimbus (pyroCb, Figure 2) in Tasmania to date [11]. The wildfire threatened people’s lives and almost completely destroyed the township of Dunalley. It lasted 16 days (from 3 to 18 January 2013) and burned 25,950 ha, mostly in only 6 h, which points to extreme fire behavior (Figure 2, [28,29]). The total cost of the Tasmanian wildfires from January 2013 is estimated at US$ 71.9 million [28]. More details about the Forcett–Dunalley wildfire can be found in [28] and [12,29].
The Forcett–Dunalley wildfire occurred in southeast Tasmania along the highly indented coastline with numerous peninsulas. The strong northwest wind pushed the fire from its ignition in Forcett at 14 AEDT (eastern Australia daylight-saving time) on 3 January 2013. After the fire burned through dry eucalypt forests, it grew into an extensive fire storm immediately before its arrival in Dunalley, with an approximate spread rate of up to 50 m min−1 [29]. The wildfire culminated as a fire storm around 16 AEDT on 4 January 2013. The violent pyroconvective storm that occurred in less than an hour caused at least two lightning strikes [29]. Numerical modeling of fire weather conditions accompanying the fire storm in the afternoon on 4 January 2013, as well as weather conditions coinciding with the wildfire’s ignition a day before, will be the focus of this research.

3. Materials and Methods

3.1. Numerical Model

In order to compare the fire weather characteristics of both wildfires, high-resolution simulations were performed using the weather research forecasting (WRF) model. The WRF model, supported by the National Centre for Atmospheric Research (NCAR), is a three-dimensional, non-hydrostatic atmospheric model developed for NWP and research [30]. The model uses a terrain-following hydrostatic pressure coordinate as a vertical coordinate. In both horizontal and vertical directions, it incorporates the Runge–Kutta second and third order time integration schemes, and second to sixth order advection schemes. It uses a time-split small step for acoustic and gravity-wave modes [31]. WRF calculates sets of equations for fluid motion, mass conservation, and atmospheric thermodynamics, together with predictive equations for water states, in order to produce a three-dimensional forecast of air temperature and wind speed, water vapor, cloud water, rain, and ice [32]. The model’s spectrum of physics and dynamics options makes it suitable for a wide range of applications at various spatial scales, from large eddy to global simulations. Such applications include real-time NWP, parameterization and data assimilation research, regional climate simulations, air quality modeling, coupled fire-atmosphere modeling, atmosphere-ocean coupling, idealized simulations, and education. The model’s nesting capabilities enable users to simulate weather at high spatiotemporal resolution in the inner domain.
WRF is therefore able to simulate various atmospheric phenomena related to catastrophic wildfires, including fronts, windstorms, and convective updrafts. For instance, high-resolution WRF runs provided an insight into the finer-scale features of downslope windstorms that caused dangerous wind-driven wildfires, such as hydraulic jumps and strong surface winds along and near lee slopes (e.g., [33,34,35,36]). Consistent with previous research and in order to investigate mesoscale and microscale drivers related to two catastrophic wildfires, one from Croatia and one from Australia, high resolution WRF simulations were used from the model version 4.1.5.

3.2. Model Setup

Two sets of WRF simulations were run, one for each case study. Both simulations were initialized using the ERA-interim reanalysis, provided by the European Centre for Medium-Range Weather Forecasts (ECMWF), on a regular grid spacing of 0.75° × 0.75° and a temporal resolution of 6 h [37]. Simulation for the Croatian case study ran for 60 h from 12 UTC 16 July 2017–00 UTC 19 July 2017 and for the Australian case study for 72 h from 00 UTC 3 January 2013–00 UTC 6 January 2013. Both simulations were made with output at a 1 h interval. A two-way coupling approach [38] was used to define four nested domains (Figure 3 and Figure 4) of grid spacing ratio 1:2:3:3 and with spatial resolutions of 9 (d01), 4.5 (d02), 1.5 (d03), and 0.5 km (d04) for both case studies (Table 1).
In the vertical, there were 66 hybrid levels, from approximately 10 m up to 18 km above terrain height, with increasing resolution near the surface to realistically represent atmospheric processes in the planetary boundary layer (PBL). Physics options for both simulations included the Mellor–Yamada–Nakanishi–Niino boundary layer (MYNN2.5; [39]) scheme in combination with the quasi-normal scale elimination PBL surface physics scheme. The rapid radiative transfer model scheme (RRTM) [40] is used for longwave radiation and the Dudhia scheme [41] for shortwave radiation. The chosen microphysical scheme was the Morrison double-moment scheme (MORR) [42] and in the outermost domain, convection was described using the Kain–Fritsch scheme [43]. For the Australian case, the global 30 s USGS topography data set and land cover at 15 s based on that by Broxton et al. (2014, [44]) and Ref. [45] were employed (https://www2.mmm.ucar.edu/wrf/users/download/get_sources_wps_geog.html, Last accessed: 25 June 2023). For the Split simulation, topographic and land-cover data were used from the 100 m resolution of the SRTM (Shuttle Radar Topographic Mission) digital topographic database and the 100 m resolution CORINE (Coordination of Information on the Environment and Land Cover) database, respectively. Simulations were run using the infrastructure of the supercomputer called “Bura” from the University of Rijeka.

4. Results

4.1. Antecedent Conditions and Fire Danger Rating

The antecedent conditions in both cases included drier and warmer-than-average periods in the months prior to the wildfires. In the Split case, the summer was extremely warm and dry, with air temperatures at the Split–Marjan meteorological station 3.1 °C above average and only 6% of the 30 year (1961–1990) mean rainfall. The last significant rainfall in Split occurred two months prior to the wildfire [10]. Weather conditions were more extreme in Dunalley, which occurred at the peak of the heatwave after months of rainfall deficiency and air temperatures above average. Precisely, the maximum air temperature anomaly for the first two days of the wildfire was 12 °C above average [46,47,48,49,50].
The extreme weather conditions in both cases consequently contributed to the continued drying out of fuels in the area of each wildfire and had an impact on the fire danger rating. The fire danger rating is represented by indices in both countries. In Croatia, the Canadian Forest Fire Weather Index System (CFFWIS) or Fire Weather Index (FWI; [47]) is used, while in Australia, the McArthur Forest Fire Danger Index (FFDI; [48,49]) is used. Both are calculated operationally at the Meteorological Service of each country (FWI at the Croatian Meteorological and Hydrological Service—DHMZ; and FFDI at the Australian Bureau of Meteorology—BoM). The final product describes the joint influence of various meteorological and fuel conditions important to estimating the risk associated with wildfires. In the Split case, the most endangered area in summer 2017 was the wider area of the wildfire [50]. In particular, the fire danger was very high for more than 20 consecutive days prior to the Split wildfire and the FWI reached its annual maximum exactly on the day of the fire ignition. In the case of Dunalley, FFDI reached the ‘catastrophic’ category and got close to the all-time state record [46]. The catastrophic range in this case coincided with the violent pyroCumulonimbus (pyroCb). Therefore, in both cases, the fire danger rating pointed to extreme fire behavior, which eventually did occur in both cases.

4.2. Model Comparison with Measurements

The WRF model results are qualitatively compared against automatic weather station (AWS) data in the case of the Split wildfire [10] and against AWS and radiosonde data in the case of the Forcett–Dunalley (from here after Dunalley) wildfire [11]. Detailed analysis on AWS air temperature, relative humidity, and wind for the Split wildfire can be found in Čavlina Tomašević et al. (2022, [10]) and for the Dunalley wildfire in [12]. The simulations of mean sea level pressure, 2-meter air temperature, relative humidity, and 10-meter wind were quite satisfactory in both cases. The maximum temperature was slightly overestimated (up to 2 °C) in the case of the Split wildfire (Figure 8a in [10]) and underestimated in the case of Dunalley (Figure 2 in [11]). On the day when the Dunalley wildfire turned into a firestorm (4 January 2013), the maximum simulated air temperature was 38 °C, in contrast to the record-breaking 41.8 °C measured in Hobart. The morning maximum and the afternoon minimum relative humidity at 2 m were well simulated, with the moisture advection accompanying the passage of a cold front in the case of Dunalley slightly delayed [46]. Horizontal wind at 10 m was slightly underestimated in both cases, more evidently in the case of Dunalley [11]. The wind direction changes from northeast to southwest by the end of the Split case study period were not evident, and the timing of the primary wind change after the cold front passage in the case of Dunalley was about 1 h late. Compared to radiosonde measurements in the case of Dunalley [46], upper-level wind speed was well estimated with the WRF model.
The WRF model results of outer domains with lower resolution can also be qualitatively compared with the operational Aire Limitee Adaptation Dynamique Developpement InterNational (ALADIN) model [51] and the Bureau of Meteorology Atmospheric Regional Reanalysis for Australia (BARRA) reanalysis [52]. The operational limited area mesoscale numerical weather prediction model ALADIN/HR, which is based on the METEO-France ALADIN model, has been used for operational weather forecast in the Croatian Meteorological and Hydrological Service (DHMZ) since 2000. The model uses 37 levels in the vertical and a mass-based hybrid terrain-influenced vertical coordinate η. The horizontal resolution of the model is 4 km, with the dynamical adaptation of wind fields at 2 km. Details on model setup and configuration can be found in [38,53,54,55]. The Bureau of Meteorology Atmospheric High-Resolution Regional Reanalysis for Australia (BARRA-R) is a 12 km, 70 vertical level, regional reanalysis that was undertaken by the Australian Bureau of Meteorology. It provides hourly atmospheric information over Australia from 1990 to early 2019. BARRA-R was generated using ERA-interim boundary conditions and is based on the UK Met Office Unified Model. Several convection-permitting downscaled subdomains were also generated, at 1.5 km horizontal resolution, including BARRA-TA. For model details, see [52] for BARRA-R and [56] for BARRA-TA.
The tendency of the wind speed and direction within the Split wildfire area and its wider region over the Adriatic coast is consistent between the ALADIN and WRF models. However, although simulated wind speed from the WRF model generally corresponds to measurements from the Split–Marjan station, situated on the Split city peninsula, wind speed in the wider area is stronger than in ALADIN [10]. This includes the fire-affected area in the Split hinterland. Additionally, the discrepancy between simulations can be found in the timing of the offshore wind change, which occurred on 17 July 2017, during the daytime downslope fire spread. The turn from northeast bura wind to northwest was simulated 4 h earlier than in the operational model ALADIN. Although both models simulated the general ease in wind speed at the end of the analyzed period, neither simulated the wind direction change from northeast bura wind to southwest, which was observed at the Split–Marjan station. The peak in upper-level wind speed is in agreement with both models.
The WRF model simulated the convergence line that appeared in the case of Dunalley, presenting it closer to the pyroCb location at the time of its peak than the BARRA reanalysis [12]. In general, upper-level wind speed achieved its maximum approximately 4 h later in WRF. Thus, upper-level wind speed at the time of the peak pyroCb was weaker than in BARRA, presenting more favorable conditions for the pyroCb development in this case. The discrepancy found to be more favorable for the pyroCb in the BARRA reanalysis data was the vertical wind speed. In the WRF simulation, the maximum vertical wind speed covered the smaller area downwind of Dunalley and appeared one hour earlier. Note that although there are only 37 levels in the BARRA reanalysis, the model, including the data assimilation process, was conducted based on 70 vertical model levels, which is comparable to the number in WRF.

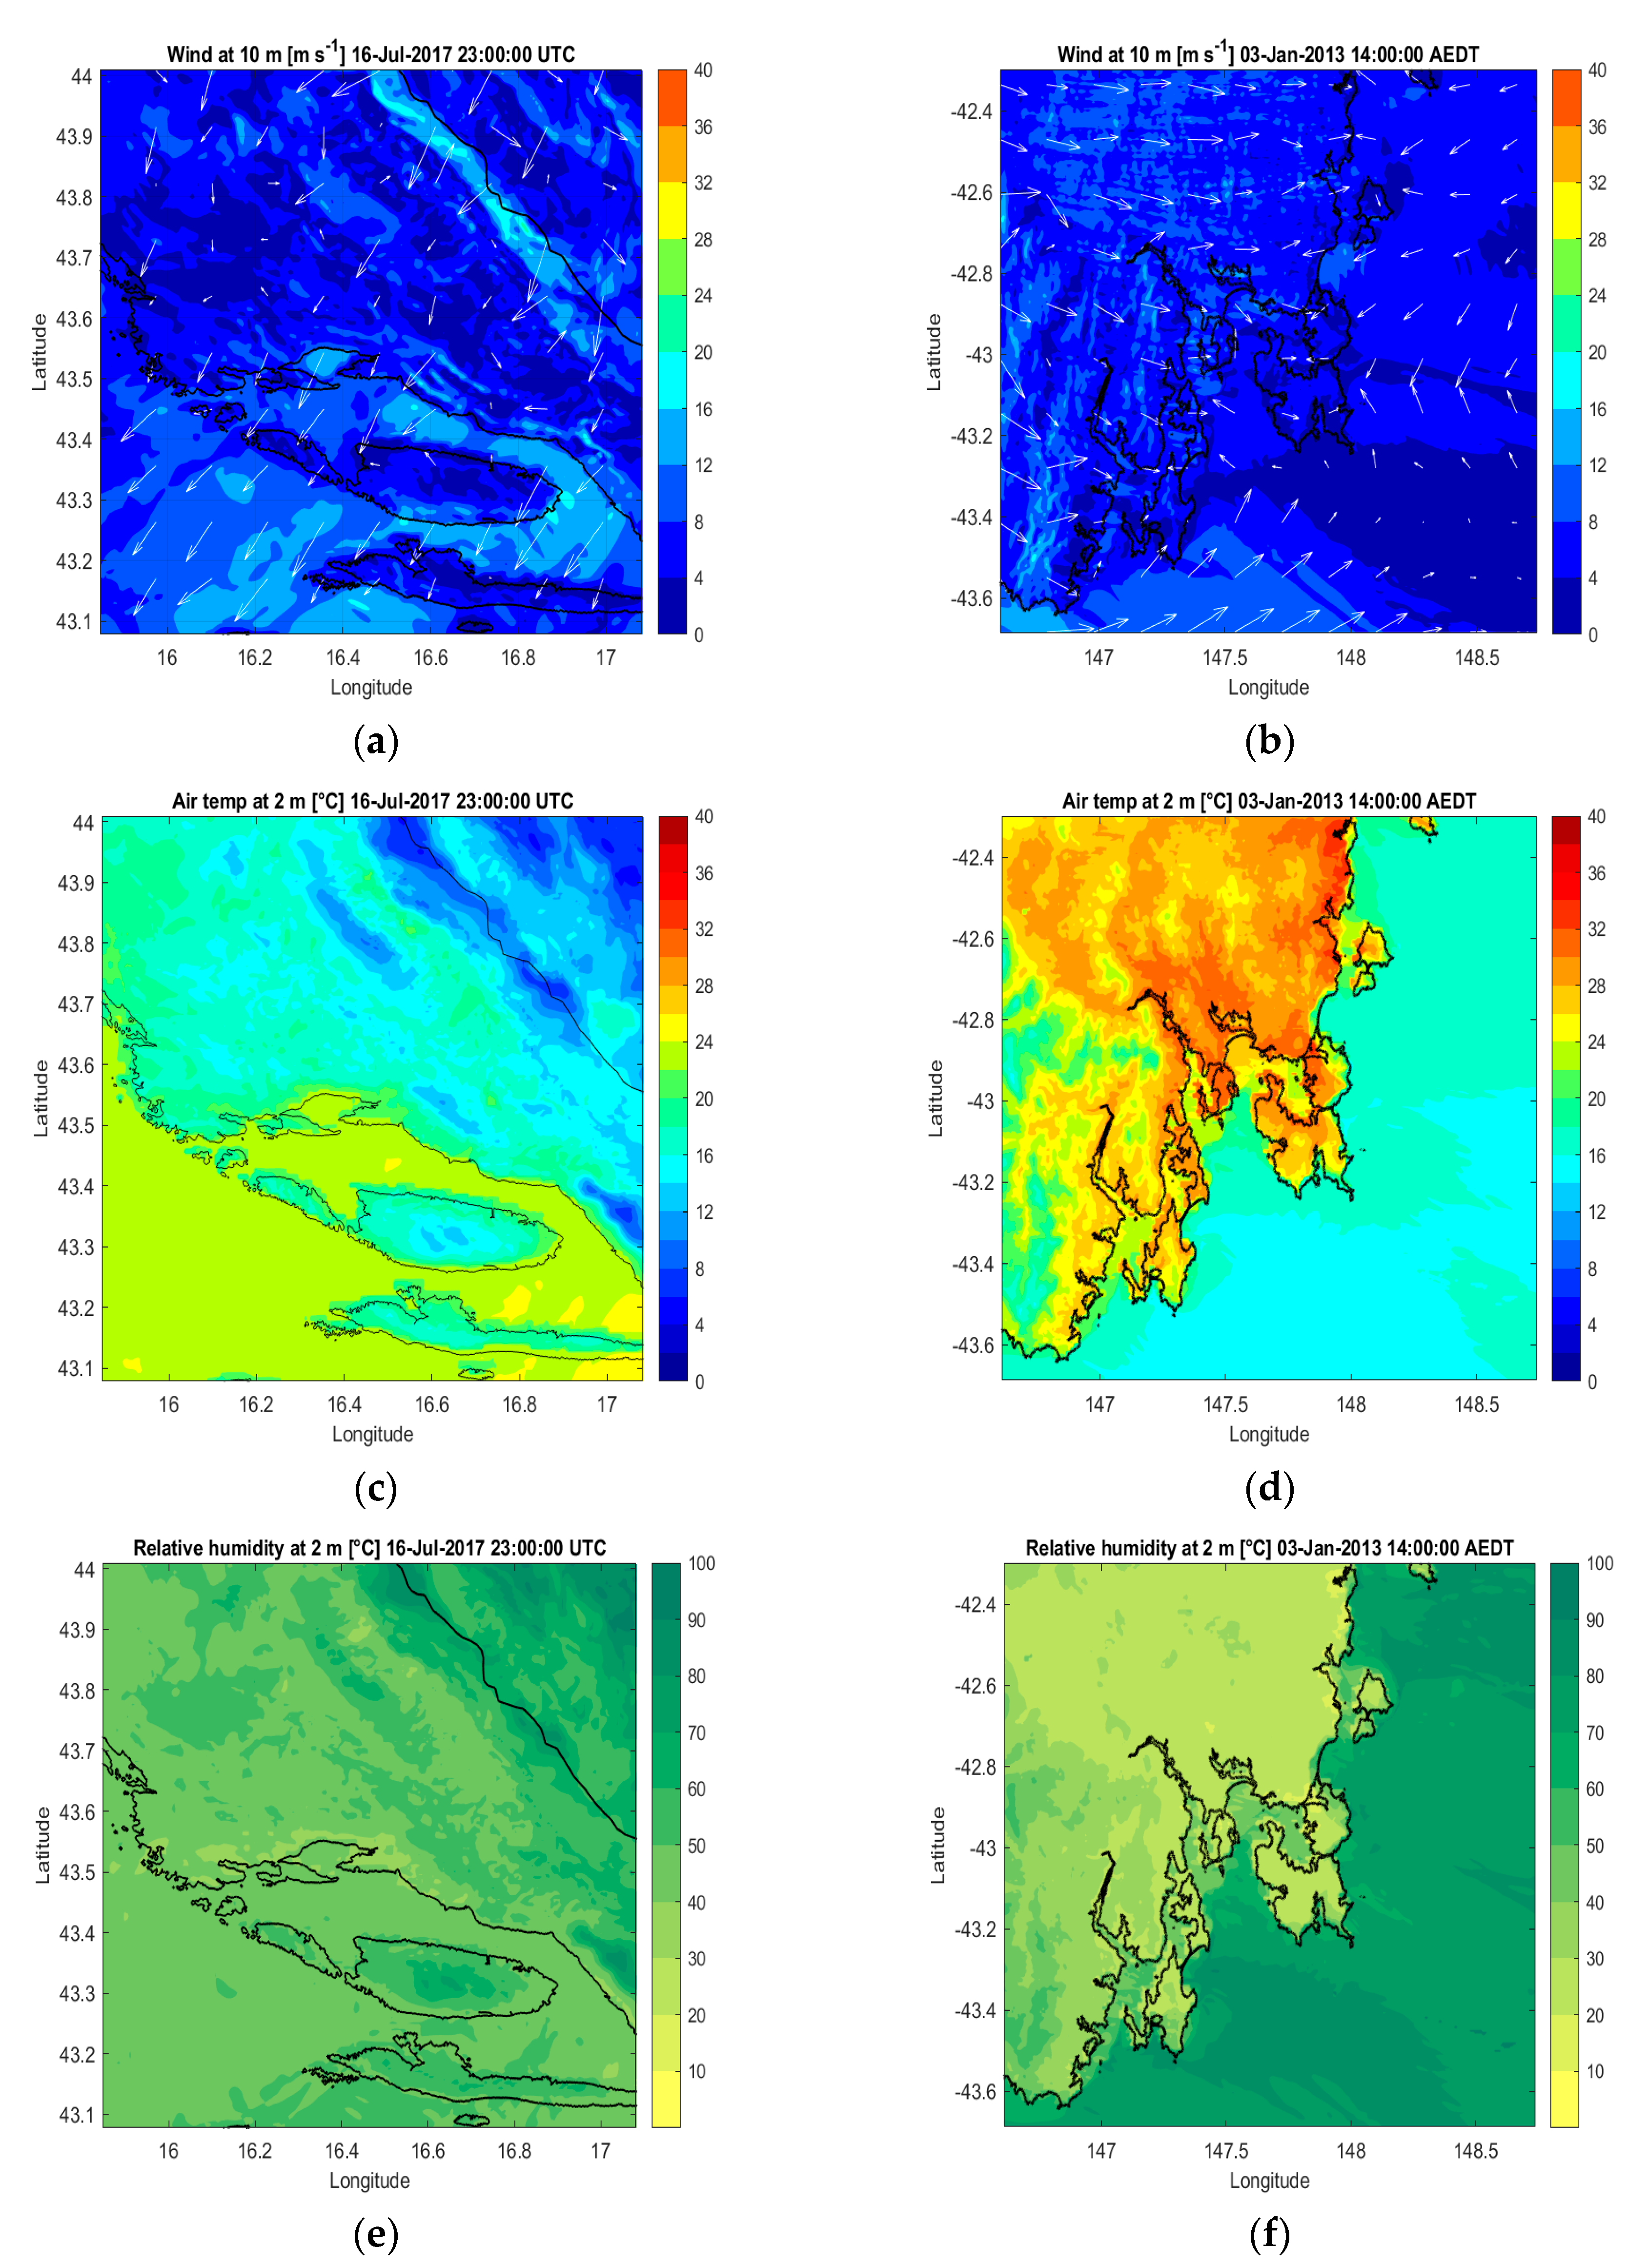
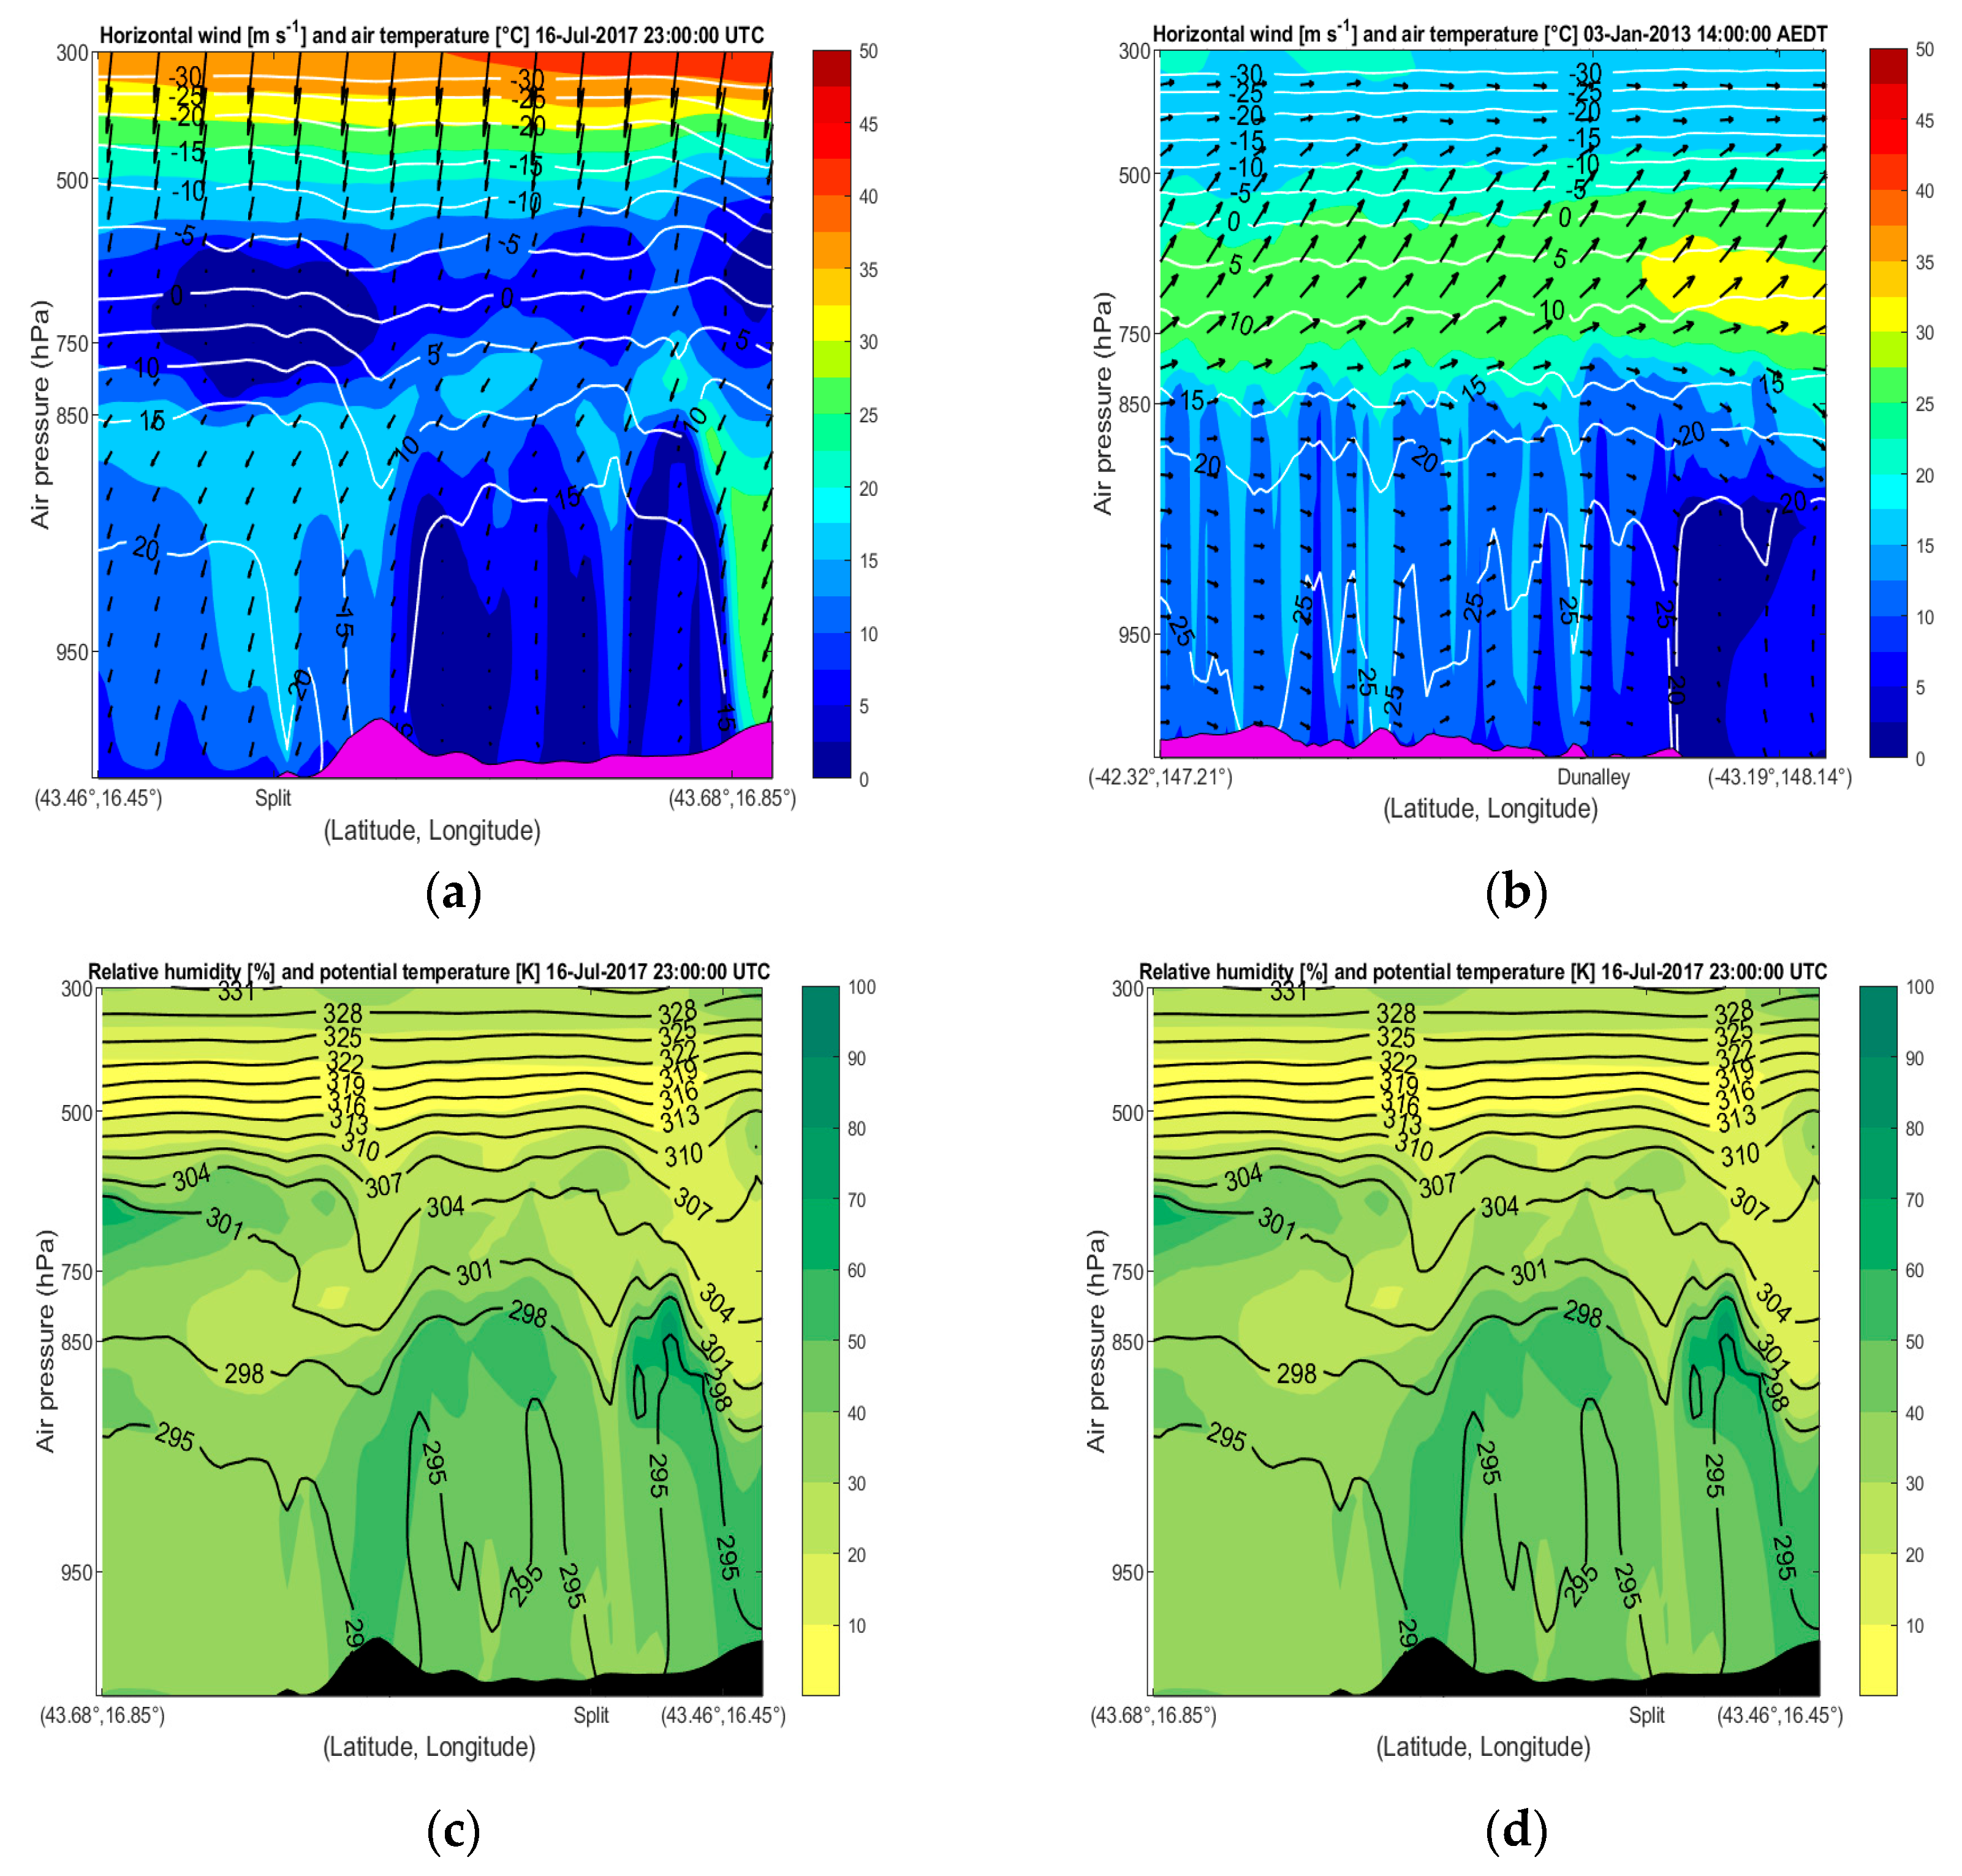
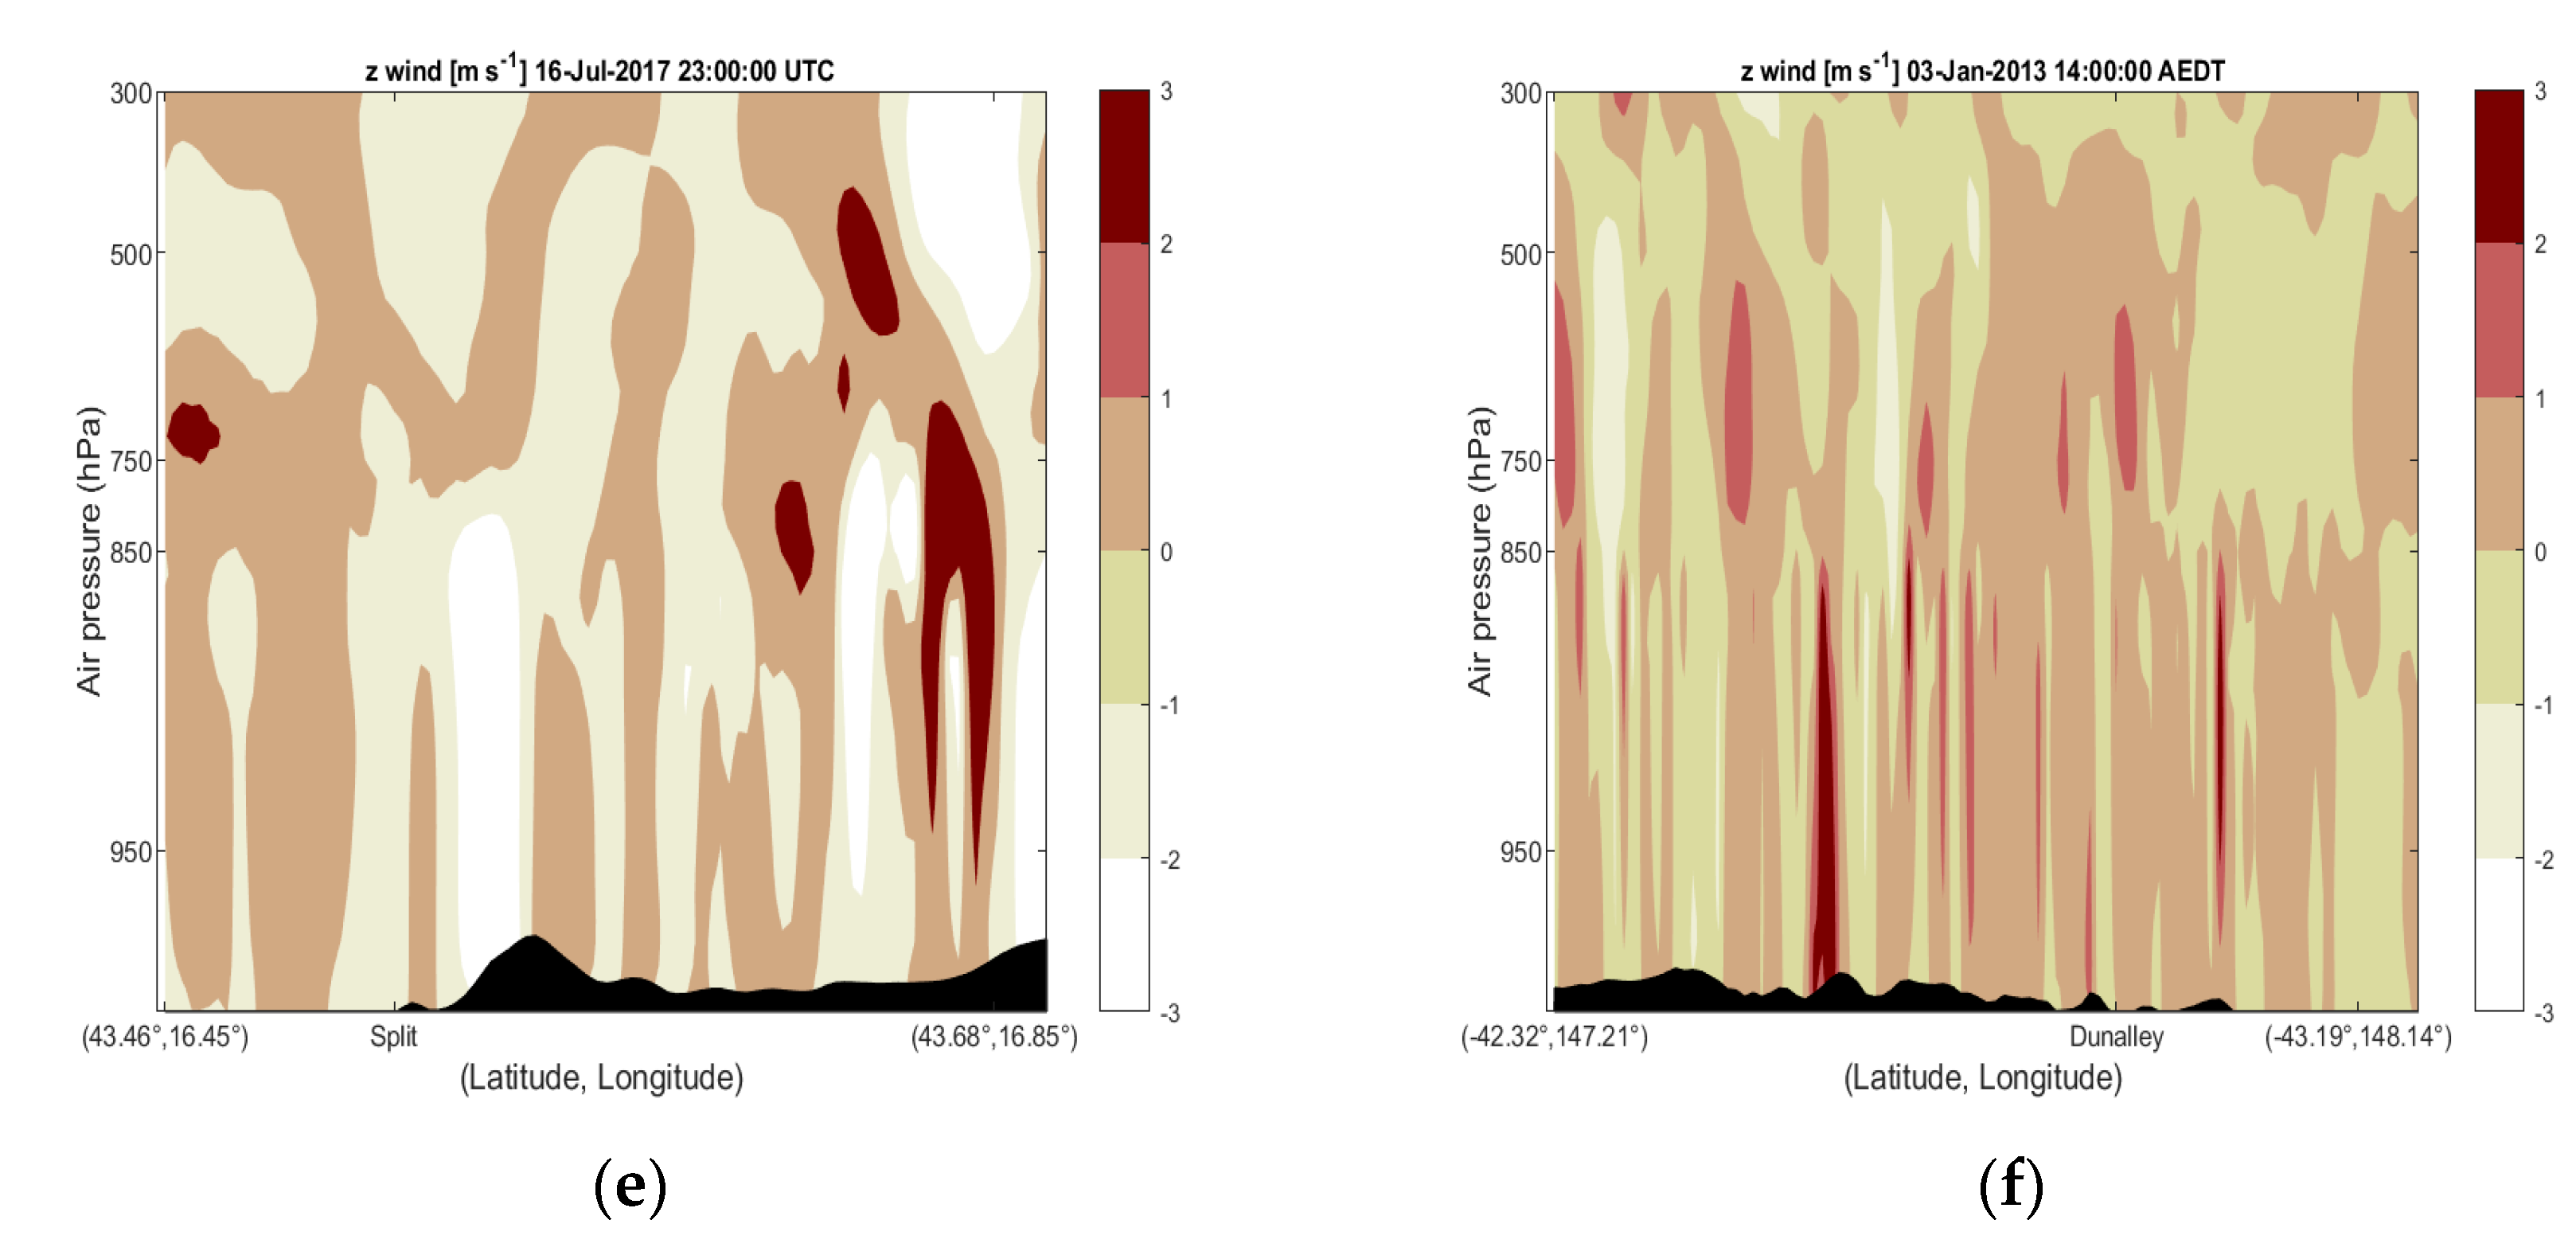
4.3. Comparison of Initial Fire Weather Conditions

Similar surface conditions at the ignition time for both wildfires included moderate to strong gusty wind (Figure 5a,b) as a result of the tight pressure gradient over their areas (not shown). Notably, both wildfires were fanned by the wind blowing from inland towards the coast. From the ignition, the Split wildfire was pushed towards the Adriatic Sea by the northeast bura wind, while Dunalley was carried towards the Tasman Sea by the northwest bura wind. According to the WRF model, bura wind at the Split wildfire location had speeds between 8 m s−1 and 12 m s−1, and in the case of Dunalley, northwest wind had speeds between 4 m s−1 and 8 m s−1, which is slightly lower than recorded in measurements.
Along with strong wind determining fire activity, other meteorological conditions coinciding with the wildfire’s ignition were severe in both cases in their own terms. While the ignition of the Dunalley wildfire coincided with the culmination of the heat wave in Tasmania, the Split wildfire occurred after the cool change. It is also important to remember that the Dunalley wildfire started around midday (14 AEDT), while the Split wildfire started in the evening (22:38 UTC). While the north-east bura wind in the case of Split, located in Croatia, in the northern hemisphere means advection of cool air in summertime, the northwest wind in Tasmania in the southern hemisphere means advection of hot and dry air from the central Australian mainland. This resolves the question of why air and skin temperature (WRF output variable for surface temperature) and relative humidity values differed in these cases. According to the WRF model, the initial surface weather conditions in the Split case included an air temperature of 20 °C and relative humidity under 50% (Figure 5c,e). In the case of Dunalley, simulated surface weather conditions were an air temperature of 32 °C and relative humidity under 30% (Figure 5d,f).
Different synoptic backgrounds caused different dynamics at the ignition time in both cases, which is most clearly evident from vertical atmospheric cross sections. On the one hand, in the Split case, there is wind flow alignment throughout the troposphere, presenting a deep bura case with the jet stream at the tropopause (Figure 6a), while on the other hand, in the Dunalley case, there is an upper-level divergence at approximately the 800 hPa level (Figure 6b). In the Split case, a deep northeast bura flow was caused by the synchronization of the low surface pressure area with the upper-level trough. In the case of Dunalley, the divergence was caused by the anticyclone situated northeast of Tasmania, over the Tasman Sea, supporting advection of warm and dry northwest air from the Australian mainland in the lower levels while the southwest air flow remained in the upper levels.
The cross sections of relative humidity reveal other significant upper-level differences in these two cases. In the Split case, there was high relative humidity over the inland and lower relative humidity over the Adriatic Sea (Figure 6c), and in the Dunalley case, it was the opposite, with warm and dry air over the inland and moist air over the Tasman Sea (Figure 6d). Likewise, the differences are found in the cross sections of vertical wind speed, which indicate strong downward motion above the wildfire’s area in the case of Split (Figure 6e) and upward motion in the case of Dunalley (Figure 6f). It is also interesting to note that, in contrast to the ALADIN model, the WRF simulation does not clearly indicate the hydraulic jump accompanied by strong bura flow in cross sections of horizontal wind speed. However, WRF does present strong subsidence or downward motion in the area of the Split wildfire.

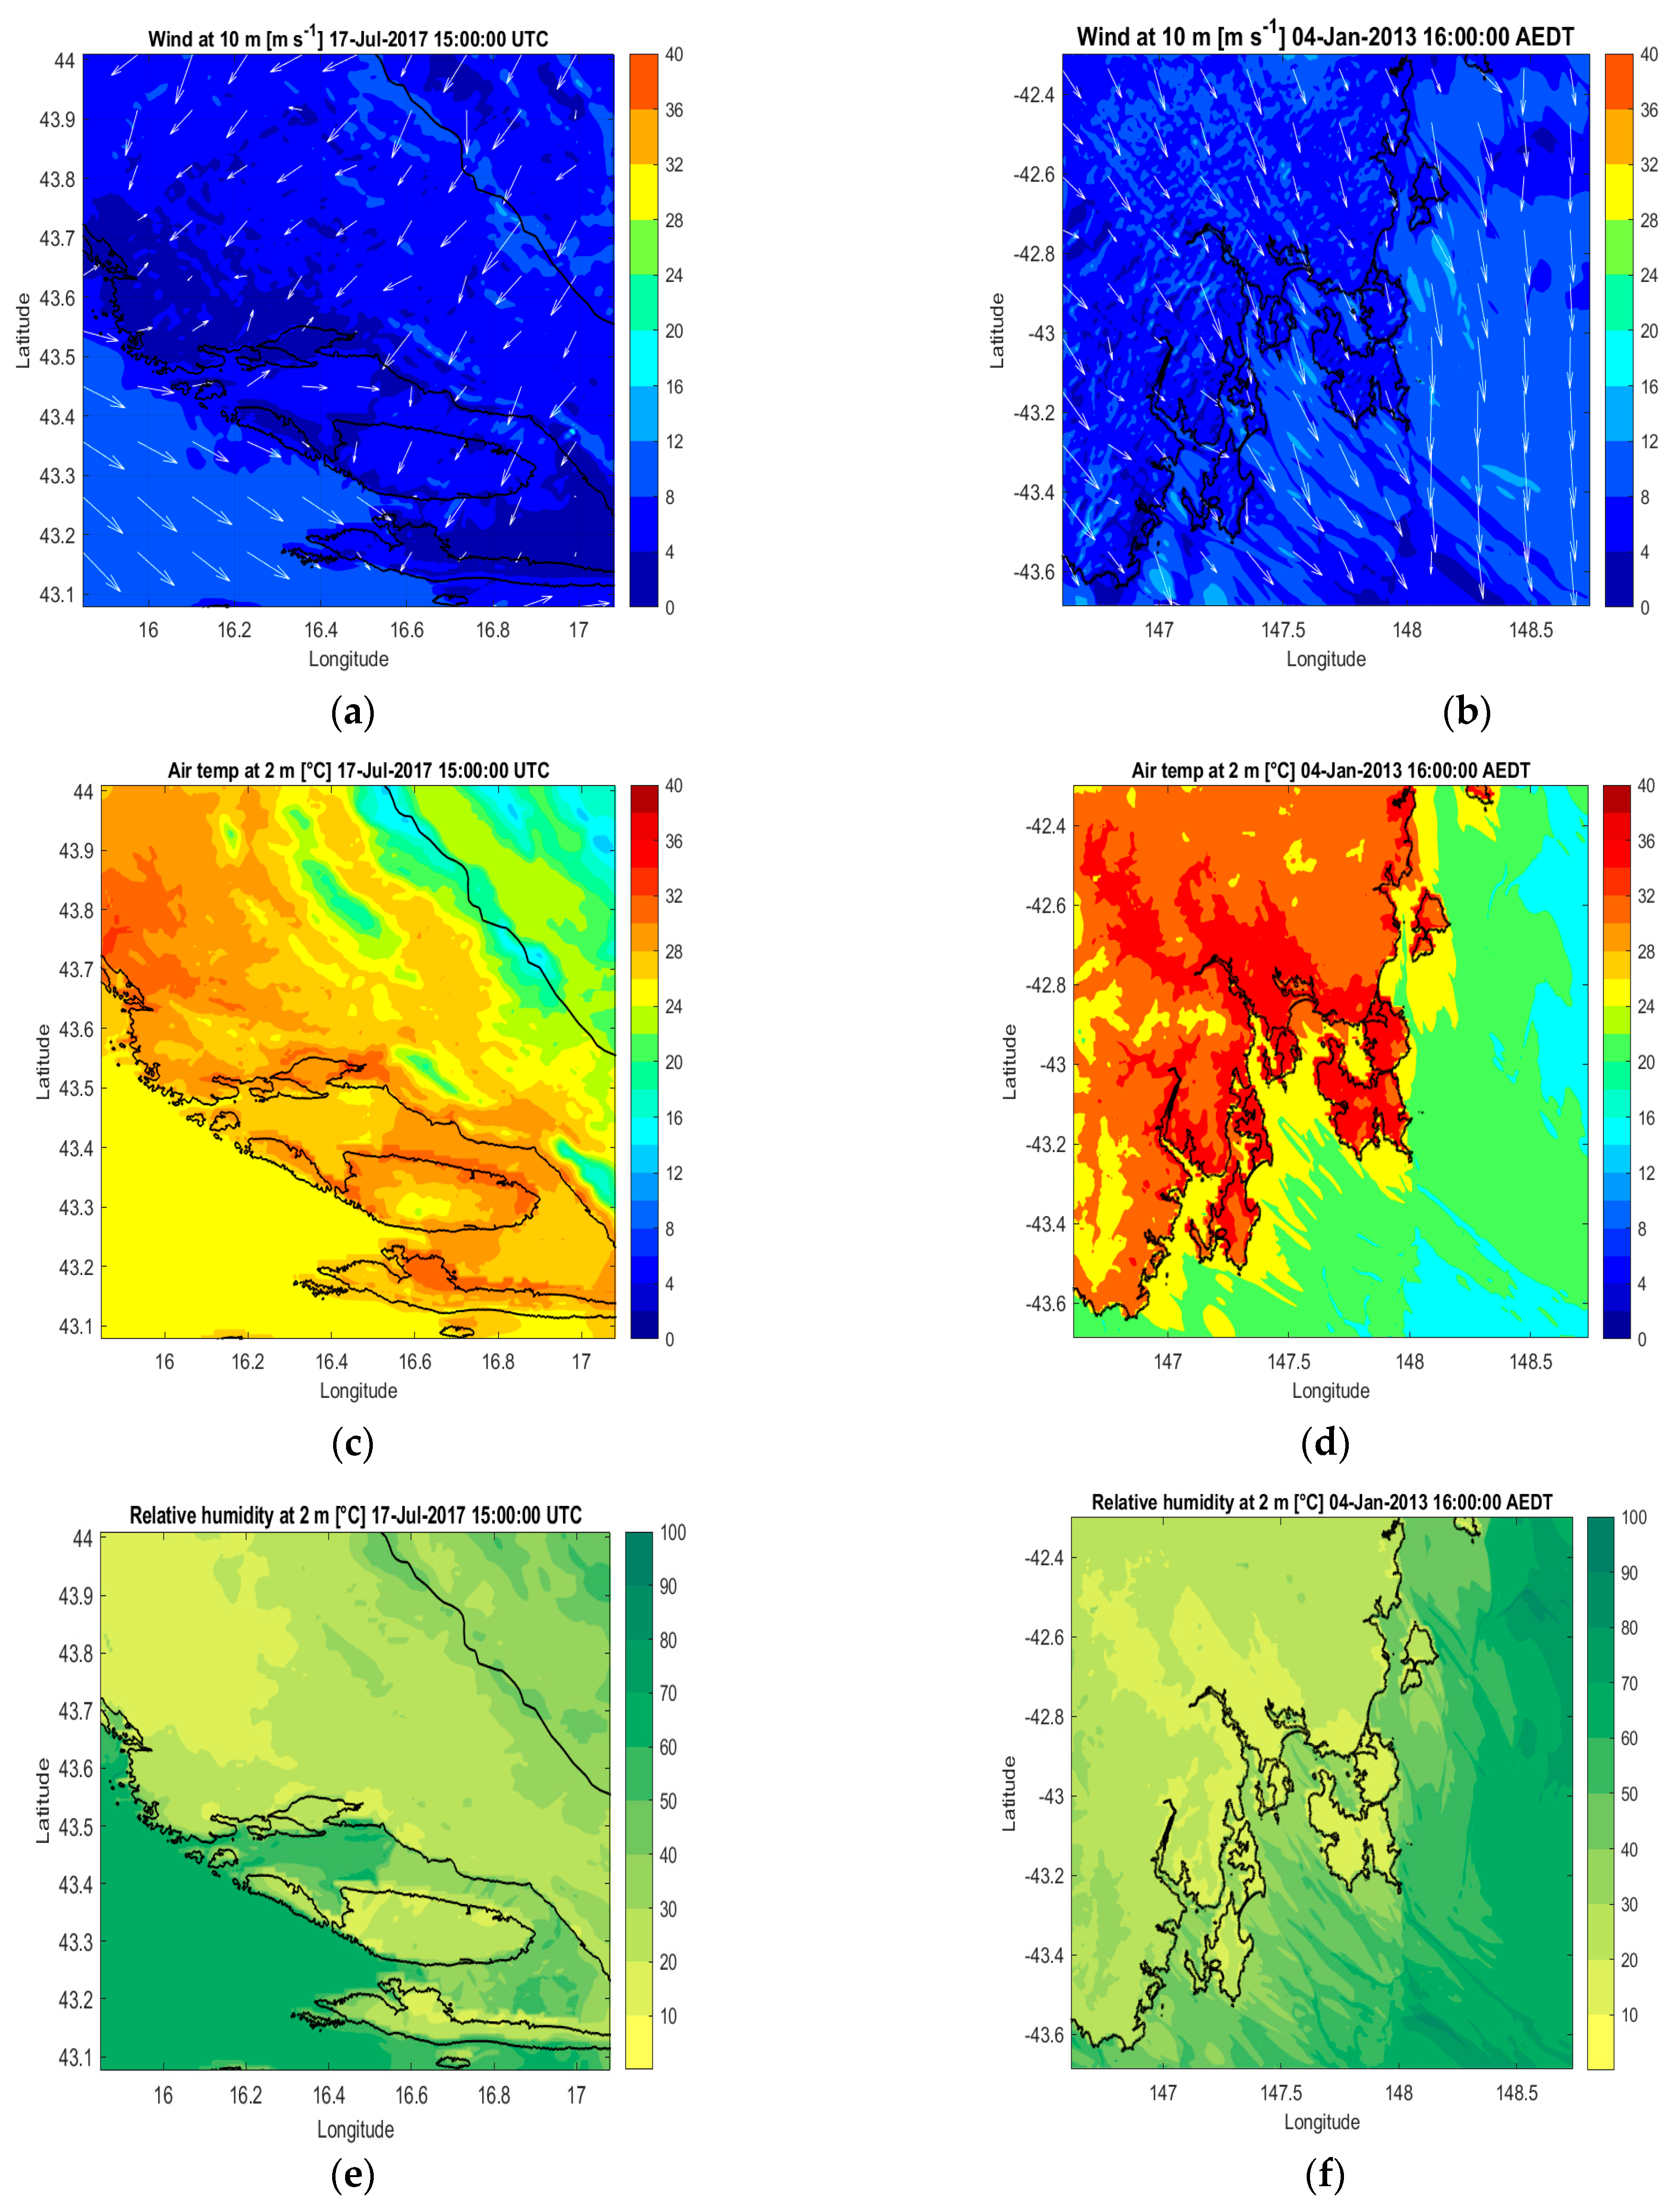
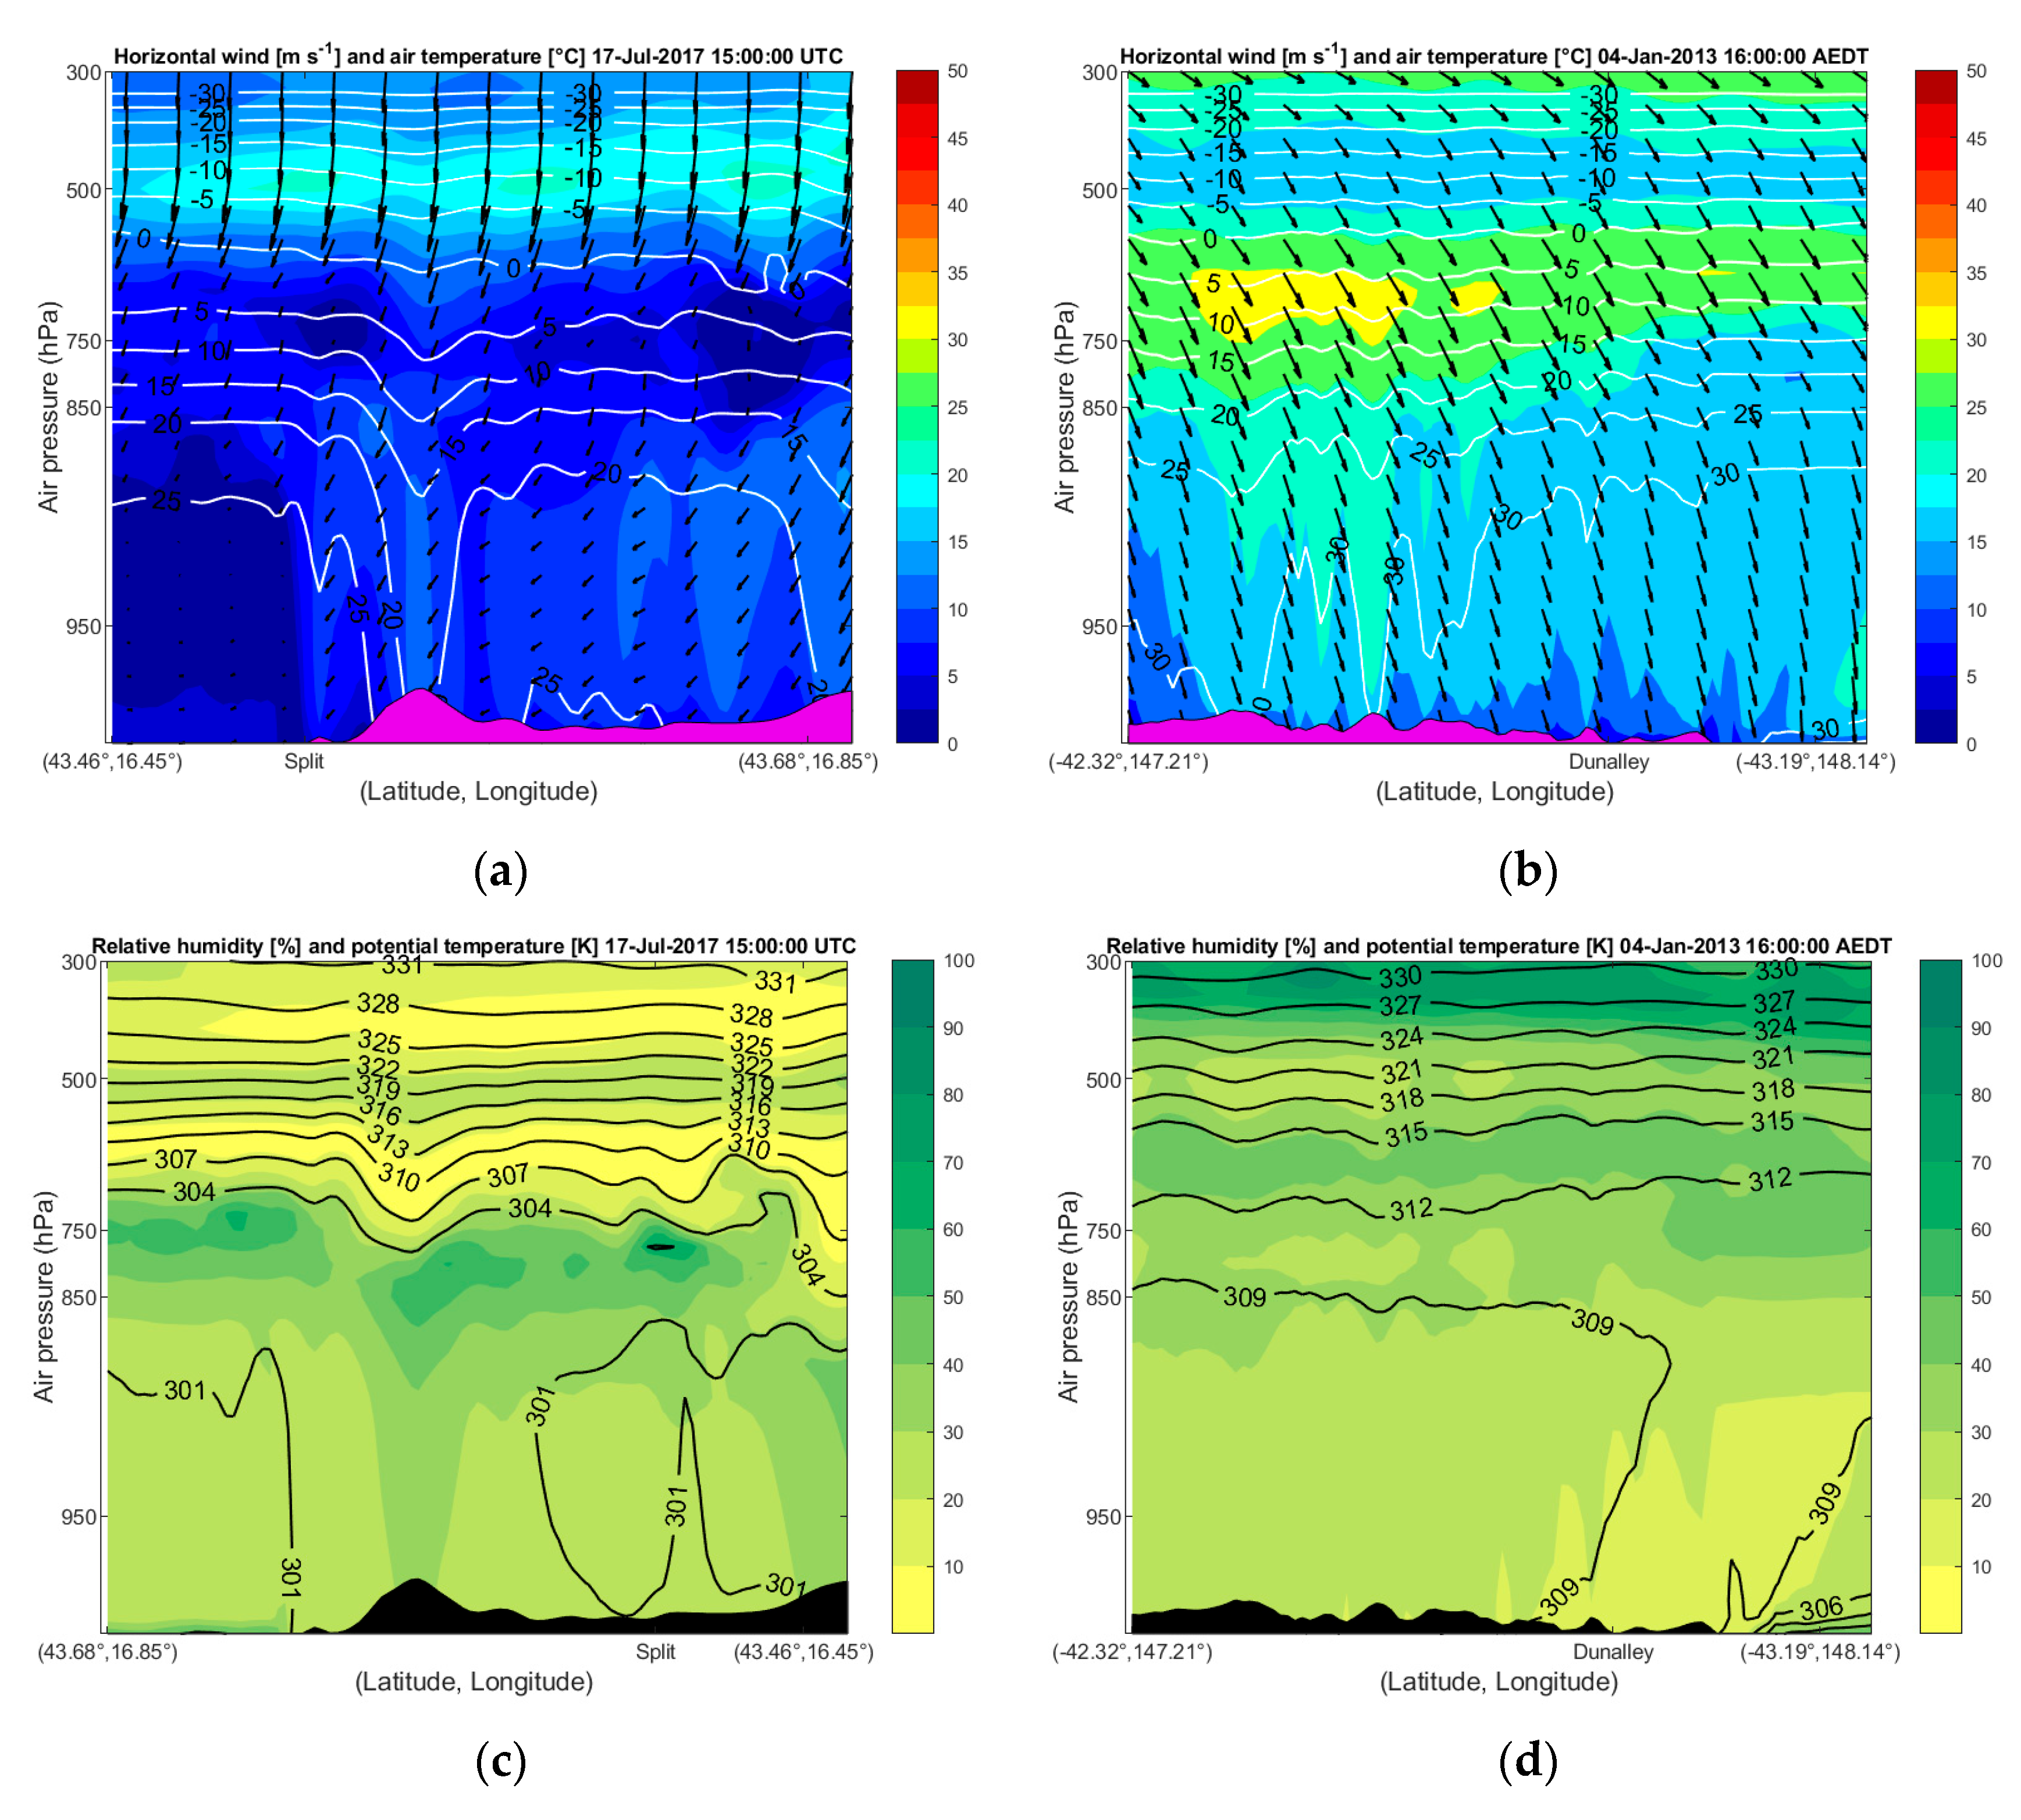
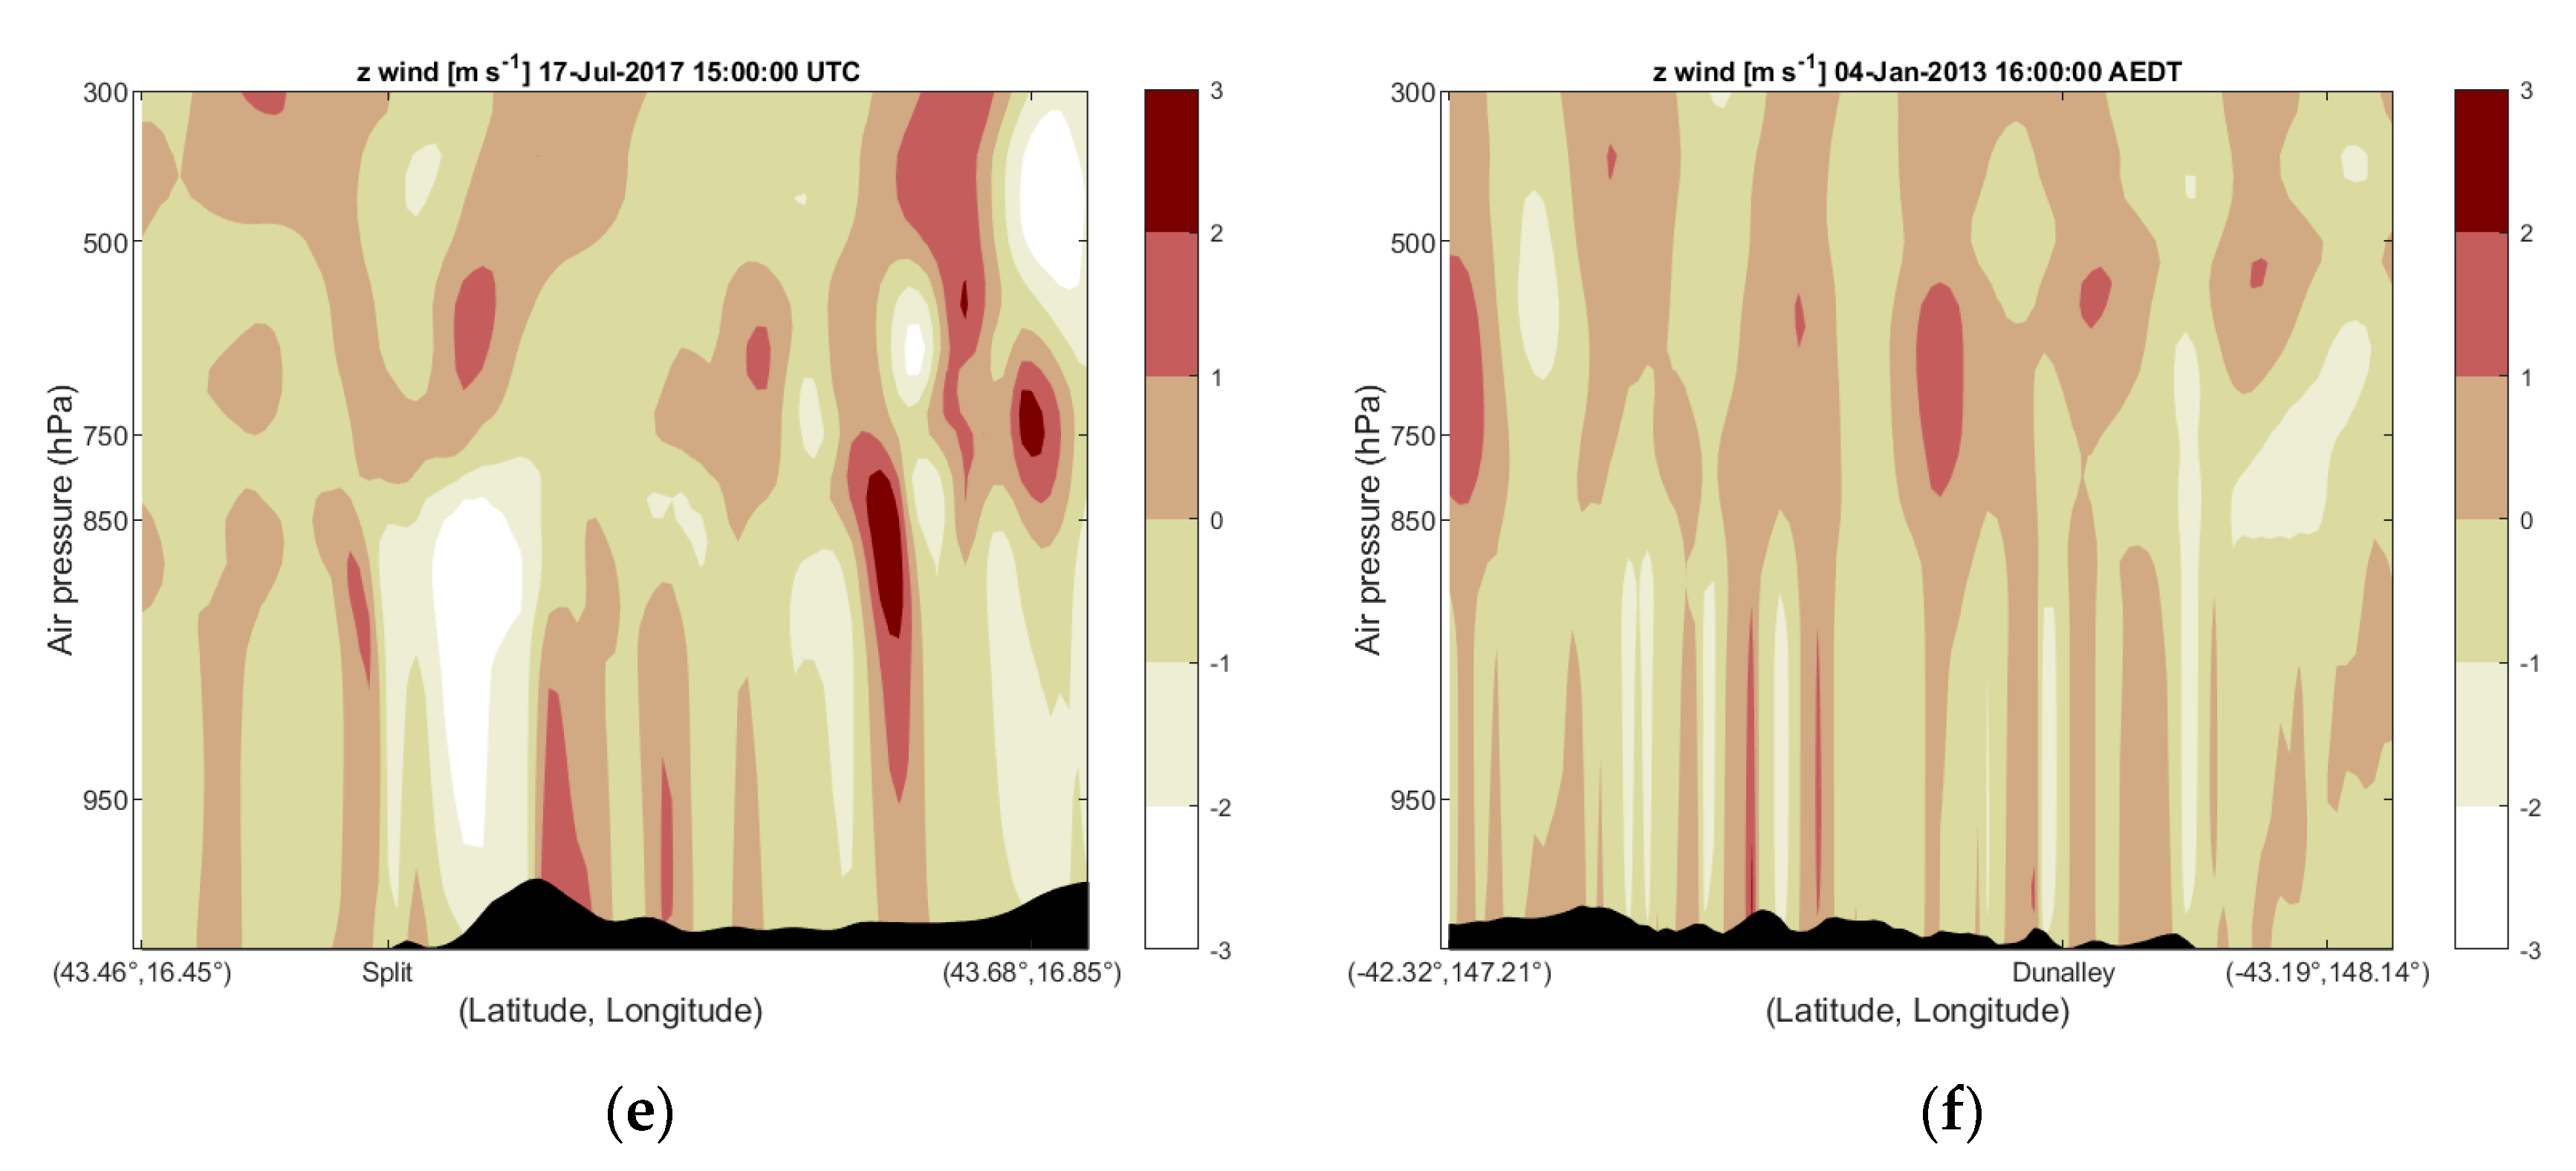
4.4. Comparison of Weather Conditions Coinciding with the Most Extreme Fire Behavior

The most severe hours of the analyzed wildfires included the escalation in extent and severity, including the downslope run towards the city of Split and extreme fire behavior in the form of pyroconvection near Dunalley.
The peak in extreme fire behavior in both cases occurred in the afternoon hours, when surface weather conditions are usually the most severe and favorable for wildfire development. The WRF model results confirmed the worst surface weather conditions in the case of Dunalley. This is because the downslope run in the Split case occurred after the cool change, while the pyroconvection in the Dunalley case coincided with the culmination of the heatwave, when Hobart station recorded its highest air temperature in 120 years. According to the model, both cases included very hot and dry conditions with air temperatures up to 36 °C (Figure 7c,d), skin temperatures up to 40 °C (not shown), and relative humidity under 20% (Figure 7e,f). As presented in the previous analysis [11], the actual air temperature in Dunalley was even higher. It is also noteworthy that the night before the most extreme fire behavior in both cases did not allow for cooling and fuel moisture recovery, which was again more extreme in the case of Dunalley.
The surface wind field in both cases confirms uniform wind direction from the ignition until the period of the most extreme fire behavior. In the case of Split, it was a northeasterly bura wind, and in the case of Dunalley, a northwesterly wind. As aforementioned, wind flow in both cases was oriented from the inland, where fires were burning, towards the coastline. At the time of the extreme fire behavior in both cases, the wind field in the innermost domain revealed the appearance of a line of convergence. In the case of Dunalley, this line of convergence aligned parallel to the main northwest wind flow and was closer to the Dunalley area (Figure 7b). In the case of Split, the line of convergence appears further offshore, where the northeast bura flow perpendicularly coincides with the northwest flow (Figure 7a), which is a common wind appearing over the Adriatic Sea during daytime in summer, known as maestral. The line of convergence in the Split case did not have any influence on fire behavior. Although surface wind speed in both cases was between 4 m s−1 and 8 m s−1, compared to measurements, the model underestimated it.
Upper-level conditions coinciding with the most extreme fire behavior in both cases included the alignment of wind flow throughout the troposphere, i.e., uniform wind direction from the surface up to the tropopause (Figure 8a,b). In the case of the Split wildfire, this occurred in the hours prior to ignition and during all burn periods, while in the case of Dunalley, the alignment occurred after the ignition and prior to the pyroconvection. Therefore, in the Split case study, the plume extended in a southwest direction and in the Dunalley case in a southeast direction, or in both cases, the plume extended from the mainland towards the sea. According to previous Split wildfire reconstructions, its extensive plume was sheared off sharply at approximately 4500 m altitude [10], while the Dunalley plume blew out into the pyroCb [11]. The reason why the plume in the Split case was cut off sharply is the gale-force wind at 500 hPa (Figure 8a). Although the wind at upper levels in the case of Dunalley was even stronger (Figure 8b), the high fire intensity in combination with the unstable atmosphere in the pre-frontal air mass was enough for extensive convection up to the tropopause, although it lasted only for a few minutes.
Other upper-level weather conditions coinciding with the most extreme fire behavior included persistent downward motion in the case of Split (Figure 8e) and upward and well-mixed boundary layer conditions in the case of Dunalley (Figure 8f). The difference between upper-level conditions between ignition time and the most severe wildfire hours included a lowering of wind speed across the troposphere in the case of Split and a strengthening of wind speed in the case of Dunalley. In both cases, upper-level fire weather conditions could not be clearly classified as causing such extreme fire behavior as occurred in these catastrophic wildfires. By the time of the downslope fire run in the case of Split, the bura flow had eased and was weaker than 24 h prior. However, as the meteorological analysis showed [10], wildfires burned plenty of dry fuels at higher altitudes in the mountainous outback of Split, where the bura flow was still moderate to strong. The topography of the area provided ideal conditions for a channeled downslope fire run towards the city. Although not as extreme as at the ignition time, the cross sections at the time of the downslope fire run in the case of Split still indicated sinking motion and a dry upper troposphere caused by a trough crossing the wildfire’s area (Figure 8c,e).
In the case of Dunalley, a stronger northwest wind flow than 24 h prior contributed to the fire spread rate and pushed the fire towards the area of dry eucalyptus forests [31], which in the end enhanced the fire intensity and blew it into an extensive plume. The wildfire’s plume eventually evolved into pyroCb in spite of strong and gale-force upper-level horizontal wind (Figure 8b). PyroCb managed to break this strong horizontal northwest air flow in the mid-troposphere and inject it over the tropopause for a few minutes [11]. However, the vertical development of the firestorm in the case of Dunalley was supported by the unstable conditions, strong vertical mixing, and upward motion over the wildfire’s area (Figure 8f), together with the source of moist air in the upper troposphere and over the Tasman Sea (Figure 8d).

5. Discussion

Two catastrophic wildfires from opposite sides of the world and different hemispheres do share some similarities in the fire weather associated with their occurrence. Antecedent conditions in both wildfire events were undeniably similar, with a lack of precipitation and higher-than-average air temperatures in the months’ prior to both wildfires. Extreme antecedent weather conditions consequently had an impact on the fire danger rating, which was extreme in both cases. A high fire danger rating pointed to possible extreme fire behavior, including rapid fire spread, multiple fire fronts, and fire burning in the crown of trees. According to the reconstruction of the wildfires, this type of fire behavior occurred in both cases.
The initial surface ignition conditions differed in air temperature and relative humidity but were similar in wind conditions. The difference in air temperature and relative humidity was due to Split wildfire ignition occurring in the late evening hours on a day after the cool change, while Dunalley wildfire was re-ignited from the smoldering remains of a pre-existing fire in the early afternoon, a day before the culmination of the heatwave in Tasmania. However, in the subsequent hours after the ignition, surface conditions in the Split case also aligned with the hot and dry conditions found in the Dunalley case. At the time of ignition, both wildfires were fanned by strong surface winds.
The upper-level atmospheric conditions in the analyzed cases were different due to a different synoptic background. The catastrophic wildfire in Split coincided with the upper-level trough and accompanied deep and strong bura flow, which favored the sinking motion of dry air from aloft, while the most extreme fire behavior in the Dunalley case occurred at the peak of the heatwave and immediately prior to the cold front passage. The extreme fire behavior in the analyzed wildfires included downslope fire runs in the Split case and pyroconvection in the Dunalley case.
Several wildfire cases have generated catastrophic pyroCbs around the world since the beginning of the 21st century [1,11,57,58,59]. For instance, five pyroCbs occurred during the large fires in British Columbia, Canada and Northern Washington State, USA, on 12 August 2017 with a stratospheric injection of smoke over the U.S. Pacific northwest [60]. A bushfire in the Grampians National Park in Victoria, Australia, generated pyroCb with 12 km-wide column of smoke and its own weather pattern, including lightning and thunder, on 21 February 2014 [61]. This pyroCb collected burning embers, which then dispersed many kilometers beyond the fire front and caused new fires.
Wildfires with pyroCb in Croatia have not been confirmed yet, but pyroconvection has certainly occurred. One of them was during a wildfire on the mid-Adriatic Island of Brač in 2011, which created pyroCu [1,62].
In conclusion, the Split wildfire can be defined as a wind-driven wildfire, while the Dunalley wildfire was a combination of a wind-driven and buoyancy-driven type of wildfire.

6. Conclusions

With the WRF model simulations, our study has identified similarities between the dynamic atmospheric processes and mechanisms that occurred in the two wildfire cases. The research has shown that both wildfires were wind-driven from the ignition due to their locations situated in areas of high-pressure gradient, which resulted in strong gusty surface winds (e.g., bura windstorm in the case of Split fire). The antecedent conditions in both cases included drier and warmer-than-average periods (e.g., at the peak of a heatwave when the Dunalley fire occurred), which contributed to the continued drying out of fuels in the area and a very high fire danger rating (FWI and FFDI). The Dunalley case was also associated with a cold front [12].
Upper-level features and atmospheric instability are found to distinguish the two fire events’ different subsequent developments. In the Split case, a shortwave upper-level trough caused a cool and dry air outbreak and produced a deep northeasterly bura flow. The hydraulic jump mechanism then led to dry air subsidence and LLJ. On the other hand, the explosive pyroCb development in the case of Dunalley was triggered by the highly unstable atmosphere, and the line of convergence over the wildfire’s area was further enhanced by a cold front passage. While the deep bura flow in the Split fire has sheared off the plumes from the fire at mid-levels, the combustion processes within the Dunalley fire further enhanced instability and contributed to the blow-up up to 12 km height, in spite of the strong jet stream at the tropopause. In general, complex local topography in combination with unique fuel types in both events also played important roles in their respective fire escalation processes.
These catastrophic wildfire events provided an opportunity to investigate the most severe fire weather patterns, reveal the mechanisms that contribute to their generation, and draw similarities between dynamic atmospheric processes and the mechanisms that occurred in these cases. The analysis of two wildfires that occurred in such widely separated locations revealed that, while the individual circumstances of each individual fire varied, they exhibited similar characteristics of interaction with the atmosphere, fuels, and topography. This highlights the value of such comparative studies in that an understanding of fire’s interactions with its environment can be applied globally. This new understanding may provide a useful early indicator of future severe events and therefore help to improve predictions on fire risk and behavior and contribute to fire management.

Author Contributions

Conceptualization, I.Č.T., V.V., K.K.W.C., P.F.-H. and M.T.P.; methodology, I.Č.T., V.V., K.K.W.C., P.F.-H. and M.T.P.; software, I.Č.T.; validation, I.Č.T. and B.M.; formal analysis, I.Č.T. and V.V.; investigation, I.Č.T., V.V., K.K.W.C. and P.F.-H.; resources, I.Č.T., V.V., K.K.W.C., P.F.-H. and M.T.P.; data curation, I.Č.T., B.M.; writing—original draft preparation, I.Č.T.; writing—review and editing, I.Č.T., V.V., K.K.W.C., P.F.-H., P.J.B., M.T.P. and B.M.; visualization, I.Č.T.; supervision, V.V., K.K.W.C., P.F.-H., P.J.B. and M.T.P.; project administration, I.Č.T., P.F.-H. and P.J.B.; funding acquisition, P.F.-H. and M.T.P. All authors have read and agreed to the published version of the manuscript.

Funding

The first author (ICT) was supported by the Macquarie University Cotutelle Scholarship per the Cotutelle Agreement between Croatia and Australia. The publication of this research was supported by the Australian Climate Service.

Institutional Review Board Statement

Not applicable.

Informed Consent Statement

Not applicable.

Data Availability Statement

The data applied in this study, including the observations and model outputs, can be obtained from the corresponding author upon request.

Acknowledgments

The authors would like to thank the University of Rijeka, Centre for Advanced Computing and Modelling, for providing high-performance computing infrastructure using the “Bura” supercomputer. We thank the handling editor and the anonymous reviewers for their input on this manuscript.

Conflicts of Interest

The authors declare no conflict of interest.

References

  1. Tomašević, I.Č.; Cheung, K.K.W.; Vučetić, V.; Fox-Hughes, P. Comparison of Wildfire Meteorology and Climate at the Adriatic Coast and Southeast Australia. Atmosphere 2022, 13, 755. [Google Scholar] [CrossRef]
  2. Vučetić, M.; Vučetić, V.; Španjol, Ž.; Barčić, D.; Rosavec, R.; Mandić, A. Secular variations of monthly severity rating on the Croatian Adriatic coast during the forest fire season. For. Ecol. Manag. 2006, 234 (Suppl. 1), 251. [Google Scholar] [CrossRef]
  3. Lucas, C.; Hennessy, K.; Mills, G.; Bathols, J. Bushfire Weather in Southeast Australia: Recent Trends and Projected Climate Change Impacts; Consultancy Report Prepared for The Climate Institute of Australia; Bureau of Meteorology Research Centre: Melbourne, Australia, 2007.
  4. Barešić, D. The Impact of Climate Change on the Potential Risk of Forest Fires in Croatia. Master’s Thesis, Faculty of Science, University of Zagreb, Zagreb, Croatia, 2011. (In Croatian). [Google Scholar]
  5. Dowdy, A.J. Climatological Variability of Fire Weather in Australia. J. Appl. Meteorol. Climatol. 2018, 57, 221–234. [Google Scholar] [CrossRef]
  6. Dowdy, A.J.; Pepler, A. Pyroconvection risk in Australia: Climatological changes in atmospheric stability and surface fire weather conditions. Geophys. Res. Lett. 2018, 45, 2005–2013. [Google Scholar] [CrossRef]
  7. Vučetić, M.; Vučetić, V. Wildfire risk in Croatia using the Canadian Forest Fire Weather Index System. In Proceedings of the 6th International Fire Behavior and Fuels Conference, Marseille, France, 29 April–3 May 2019. [Google Scholar]
  8. Flannigan, M.D.; Cantin, A.S.; de Groot, W.J.; Wotton, M.; Newbery, A.; Gowman, L.M. Global wildland fire season severity in the 21st century. For. Ecol. Manag. 2013, 294, 54–61. [Google Scholar] [CrossRef]
  9. IPCC. Climate Change 2021: The Physical Science Basis. In Contribution of Working Group I to the Sixth Assessment Report of the Intergovernmental Panel on Climate Change; Masson-Delmotte, V., Zhai, P., Pirani, A., Connors, S.L., Péan, C., Berger, S., Caud, N., Chen, Y., Goldfarb, L., Gomis, M.I., et al., Eds.; Cambridge University Press: London, UK, 2021. [Google Scholar]
  10. Čavlina Tomašević, I.; Cheung, K.K.W.; Vučetić, V.; Fox-Hughes, P.; Horvath, K.; Telišman Prtenjak, M.; Beggs, P.J.; Malečić, B.; Milić, V. The 2017 Split wildfire in Croatia: Evolution and the role of meteorological conditions. Nat. Hazards Earth Syst. Sci. 2022, 22, 3143–3165. [Google Scholar] [CrossRef]
  11. Ndalila, M.N.; Williamson, G.J.; Fox-Hughes, P.; Sharples, J.; Bowman, D.M.J.S. Evolution of an extreme pyrocumulonimbus driven wildfire event in Tasmania, Australia. Nat. Hazards Earth Syst. Sci. 2020, 20, 1497–1511. [Google Scholar] [CrossRef]
  12. Čavlina Tomašević, I. Analysis of Extreme Fire Weather during Catastrophic Wildfires in Croatia and Australia. Ph.D. Thesis, University of Zagreb, Faculty of Science, Zagreb, Croatia, 2022. Available online: https://urn.nsk.hr/urn:nbn:hr:217:146249 (accessed on 28 April 2023).
  13. Fox-Hughes, P. Impact of More Frequent Observations on the Understanding of Tasmanian Fire Danger. J. Appl. Meteor. Climatol. 2011, 50, 1617–1626. [Google Scholar] [CrossRef]
  14. Clarke, H.G.; Lucas, C.; Smith, P.L. Changes in Australian fire weather between 1973 and 2010. Intl. J. Climatol. 2013, 33, 931–944. [Google Scholar] [CrossRef]
  15. Tomašević, I.; Vučetić, V. Rating the fire season 2013 and comparison with the fire season 2012. Firef. Manag. 2014, 4, 19–35. (In Croatian) [Google Scholar]
  16. Bakšić, N.; Vučetić, M.; Španjol, Ž. A potential risk of fire on open space in the Republic of Croatia. Firef. Manag. 2015, 5, 30–40. (In Croatian) [Google Scholar]
  17. Harris, S.; Mills, G.; Brown, T. Variability and drivers of extreme fire weather in fire-prone areas of south-eastern Australia. Intl. J. Wildland Fire 2017, 26, 177–190. [Google Scholar] [CrossRef]
  18. Turco, M.; Llasat, M.C.; Von Hardenberg, J.; Provenzale, A. Climate change impacts on wildfires in a Mediterranean environment. Clim. Change 2014, 125, 369–380. [Google Scholar] [CrossRef]
  19. Turco, M.; Rosa-Cánovas, J.J.; Bedia, J.; Jerez, S.; Montávez, J.P.; Llasat, M.C.; Provenzale, A. Exacerbated fires in Mediterranean Europe due to anthropogenic warming projected with nonstationary climate-fire models. Nature Comm. 2018, 9, 3821. [Google Scholar] [CrossRef] [Green Version]
  20. Dupuy, J.L.; Fargeon, H.; Martin-St Paul, N.; Pimont, F.; Ruffault, J.; Guijarro, M.; Hernando, C.; Madrigal, J.; Fernandes, P. Climate change impact on future wildfire danger and activity in southern Europe: A review. Ann. For. Sci. 2020, 77, 35. [Google Scholar] [CrossRef]
  21. Clarke, H.; Evans, J.P. Exploring the future change space for fire weather in southeast Australia. Theor. Appl. Climatol. 2019, 136, 513–527. [Google Scholar] [CrossRef] [Green Version]
  22. Dowdy, A.J.; Ye, H.; Pepler, A.; Thatcher, M.; Osbrough, S.L.; Evans, J.P. Future changes in extreme weather and pyroconvection risk factors for Australian wildfires. Sci. Rep. 2019, 9, 10073. [Google Scholar] [CrossRef] [Green Version]
  23. Fox-Hughes, P.; Harris, R.M.B.; Lee, G.; Grose, M.R.; Bindoff, N.L. Future fire danger climatology for Tasmania, Australia, using a dynamically downscaled regional climate model. Intl. J. Wildland Fire. 2014, 23, 309–321. [Google Scholar] [CrossRef]
  24. Mills, G.A.; Pendlebury, S. Processes leading to a severe windshear incident at Hobart Airport. Aust. Meteorol. Mag. 2003, 52, 171–188. [Google Scholar]
  25. Mills, G.A.; McCaw, L. Atmospheric Stability Environments and Fire Weather in Australia–Extending the Haines Index; CAWCR Technical Report No. 20; Centre for Australian Weather and Climate Research: Melbourne, Australia, 2010.
  26. Fox-Hughes, P. Springtime fire weather in Tasmania, Australia: Two case studies. Wea. Forecast. 2012, 27, 379–395. [Google Scholar] [CrossRef] [Green Version]
  27. Jovanović, N.; Župan, R. Analysis of vegetation conditions before and after forest fires in Dalmatia using Sentinel-2 satellite images. Geodetski List. 2017, 71, 233–248. [Google Scholar]
  28. Marsden-Smedley, J. Tasmanian Wildfires January–February 2013: Forcett-Dunalley, Repulse, Bicheno, Giblin River, Montumana, Molesworth and Gretna; Bushfire Cooperative Research Centre: Melbourne, Australia, 2014. [Google Scholar]
  29. Ndalila, M.N.; Williamson, G.J.; Bowman, D. Geographic Patterns of Fire Severity Following an Extreme Eucalyptus Forest Fire in Southern Australia: 2013 Forcett-Dunalley Fire. Fire 2018, 1, 40. [Google Scholar] [CrossRef] [Green Version]
  30. Skamarock, W.C.; Klemp, J.B.; Dudhia, J.; Gill, D.O.; Baker, D.M.; Wang, W.; Powers, J.G. A description of the Advanced Research WRF Version 2; NCAR Tech. Note NCAR/TN-468+STR; National Center for Atmospheric Research: Boulder, CO, USA, 2005; p. 88.
  31. Wang, W.; Barker, D.; Bray, J.; Bruyère, C.; Duda, M.; Dudhia, J.; Gill, D.; Michalakes, J. Users Guide for the Advanced Research WRF (ARW) Modeling System v4.2; National Center for Atmospheric Research: Boulder, CO, USA, 2007; pp. 1–464.
  32. Coen, J.L.; Cameron, M.; Michalakes, J.; Patton, E.G.; Riggan, P.J.; Yedinak, K.M. WRF-FIRE: Coupled Weather–Wildland Fire Modelling with the Weather Research and Forecasting Model. J. Appl. Meteorol. Clim. 2013, 52, 16–38. [Google Scholar] [CrossRef]
  33. Telišman Prtenjak, M.; Viher, M.; Jurković, J. Sea-land breeze development during a summer bora event along the north-eastern Adriatic coast. Quart. J. R. Meteorol. Soc. 2010, 136, 1554–1571. [Google Scholar] [CrossRef]
  34. Telišman Prtenjak, M.; Horvat, I.; Tomažić, I.; Kvakić, M.; Viher, M.; Grisogono, B. Impact of mesoscale meteorological processes on anomalous radar propagation conditions over the northern Adriatic area. J. Geophys. Res. Atmos. 2015, 120, 8759–8782. [Google Scholar] [CrossRef]
  35. Nauslar, N.; Abatzoglou, J.; Marsh, P. The 2017 North Bay and Southern California fires: A case study. Fire 2018, 1, 18. [Google Scholar] [CrossRef] [Green Version]
  36. Brewer, M.J.; Clements, C.B. The 2018 Camp Fire: Meteorological analysis using in situ observations and numerical simulations. Atmosphere 2020, 11, 47. [Google Scholar] [CrossRef] [Green Version]
  37. Dee, D.; Uppala, S.M.; Simmons, A.; Berrisford, P.; Poli, P.; Kobayashi, S.; Andrae, U.; Balmaseda, M.A.; Balsamo, G.; Bauer, P.; et al. The ERA-Interim reanalysis: Configuration and performance of the data assimilation system. Quart. J. Roy. Meteorol. Soc. 2011, 137, 553–597. [Google Scholar] [CrossRef]
  38. Tudor, M.; Stanešić, A.; Ivatek-Šahdan, S.; Hrastinski, M.; Odak Plenković, I.; Horvath, K.; Bajić, A.; Kovačić, T. Operational validation and verification of ALADIN forecast in Meteorological and hydrological service of Croatia. Croat. Meteorol. J. 2015, 50, 47–70. [Google Scholar]
  39. Nakanishi, M.; Niino, H. An improved Mellor-Yamada Level-3 model: Its numerical stability and application to a regional prediction of advection fog. Bound.-Layer Meteorol. 2006, 119, 397–407. [Google Scholar] [CrossRef]
  40. Mlawer, E.J.; Taubman, S.J.; Brown, P.D.; Iacono, M.J.; Clough, S.A. Radiative transfer for inhomogeneous atmospheres: RRTM, a validated correlated-k model for the longwave. J. Geophys. Res. Atmos. 1997, 102, 16663–16682. [Google Scholar] [CrossRef] [Green Version]
  41. Dudhia, J. Numerical study of convection observed during the Winter Monsoon Experiment using a mesoscale two-dimensional model. J. Atmos. Sci. 1989, 46, 3077–3107. [Google Scholar] [CrossRef]
  42. Morrison, H.; Thompson, G.; Tatarskii, V. Impact of cloud microphysics on the development of trailing stratiform precipitation in a simulated squall line: Comparison of one- and two-moment schemes. Mon. Weather Rev. 2009, 137, 991–1007. [Google Scholar] [CrossRef] [Green Version]
  43. Kain, J.S.; Kain, J. The Kain—Fritsch convective parameterization: An update. J. Appl. Meteorol. 2004, 43, 170–181. [Google Scholar] [CrossRef]
  44. Broxton, P.D.; Zeng, X.; Sulla-Menashe, D.; Troch, P.A. A global land cover climatology using MODIS data. J. Appl. Meteor. Climatol. 2014, 53, 1593–1605. [Google Scholar] [CrossRef]
  45. Pielke, R.A. Mesoscale Meteorological Modeling; Academic Press: San Diego, CA, USA, 2002. [Google Scholar]
  46. BoM (Bureau of Meteorology). Tasmanian Bushfires Inquiry; Bureau of Meteorology: Hobart, TAS, Australia, 2013.
  47. Van Wagner, C.E.; Pickett, T.L. Equations and Fortran Program for the Canadian Forest Fire Weather Index System; Forestry Technical Report 33; Canadian Forestry Service, Government of Canada: Ottawa, ON, Canada, 1985.
  48. McArthur, A.G. Fire Behaviour in Eucalypt Forests, Leaflet Number 107; Commonwealth of Australia Department of National Development, Forestry and Timber Bureau: Canberra, Australia, 1967.
  49. Luke, R.; McArthur, A. Bushfires in Australia; Australian Government Publishing Service: Canberra, Australia, 1978.
  50. Ferina, J.; Vučetić, V. Rating the Fire Season 2017; Croatian Meteorological and Hydrological Service: Zagreb, Croatia, 2018. (In Croatian)
  51. ALADIN International Team. In The ALADIN Project: Mesoscale Modelling Seen as a Basic Tool for Weather Forecasting and Atmospheric Research; World Meteorological Organization (WMO) Bulletin: Geneva, Switzerland, 1997; Volume 46, pp. 317–324.
  52. Su, C.-H.; Eizenberg, N.; Steinle, P.; Jakob, D.; Fox-Hughes, P.; White, C.J.; Rennie, S.; Franklin, C.; Dharssi, I.; Zhu, H. BARRA v1.0: The Bureau of Meteorology Atmospheric high-resolution Regional Reanalysis for Australia. Geosci. Model Dev. 2019, 12, 2049–2068. [Google Scholar] [CrossRef] [Green Version]
  53. Tudor, M.; Ivatek-Šahdan, S.; Stanešić, A.; Horvath, K.; Bajić, A. Forecasting weather in Croatia using ALADIN numerical weather prediction model. In Climate Change and Regional/Local Responses; Zhang, Y., Ray, P., Eds.; IntechOpen: Rijeka, Croatia, 2013; pp. 59–88. [Google Scholar] [CrossRef] [Green Version]
  54. Tudor, M. Improvements in the operational forecast of dentrimental weather conditions in the numerical limited area model ALADIN. Ph.D. Thesis, Faculty of Science, University of Zagreb, Zagreb, Croatia, 2018. [Google Scholar]
  55. Stanešić, A.; Horvath, K.; Keresturi, E. Comparison of NMC and Ensemble-Based Climatological Background-Error Covariances in an Operational Limited-Area Data Assimilation System. Atmosphere 2019, 10, 570. [Google Scholar] [CrossRef] [Green Version]
  56. Su, C.-H.; Eizenberg, N.; Jakob, D.; Fox-Hughes, P.; Steinle, P.; White, C.J.; Franklin, C. BARRA v1.0: Kilometre-scale downscaling of an Australian regional atmospheric reanalysis over four midlatitude domains. Geosci. Model Dev. 2021, 14, 4357–4378. [Google Scholar] [CrossRef]
  57. Fromm, M.; Tupper, A.; Rosenfeld, D.; Servranck, R.; McRae, R. Violent pyro-convective storm devastates Australia’s capital and pollutes the stratosphere. Geophys. Res. Lett. 2006, 33, L05815. [Google Scholar] [CrossRef]
  58. Cruz, M.G.; Sullivan, A.L.; Gould, J.S.; Sims, N.C.; Bannister, A.J.; Hollis, J.J.; Hurley, R.J. Anatomy of a catastrophic wildfire: The Black Saturday Kilmore East fire in Victoria, Australia. For. Ecol. Manag. 2012, 284, 269–285. [Google Scholar] [CrossRef]
  59. Field, R.D.; Luo, M.; Fromm, M.; Voulgarakis, A.; Mangeon, S.; Worden, J. Simulating the Black Saturday 2009 smoke plume with an interactive composition-climate model: Sensitivity to emissions amount, timing, and injection height. J. Geophys. Res. Atmos. 2016, 121, 4296–4316. [Google Scholar] [CrossRef] [PubMed] [Green Version]
  60. Peterson, D.A.; Campbell, J.R.; Hyer, E.J.; Fromm, M.D.; Kablick, P., III; Cossuth, J.H.; Deland, M.T. Wildfire-driven thunderstorms cause a volcano-like stratospheric injection of smoke. Npj Clim. Atmos. Sci. 2018, 1, 30. [Google Scholar] [CrossRef] [PubMed] [Green Version]
  61. Sharples, J.J.; Cary, G.J.; Fox-Hughes, P.; Mooney, S.; Evans, J.P.; Fletcher, M.S.; Fromm, M.; Grierson, P.F.; McRae, R.; Baker, P. Natural hazards in Australia: Extreme bushfire. Clim. Chang. 2016, 139, 85–99. [Google Scholar] [CrossRef]
  62. Mifka, B.; Vučetić, V. Weather analysis during extreme forest fire on island of Brač from 14 to 17 July 2011. Vatrog. I Upravlj. Požarima 2012, 1, 13–25. (In Croatian) [Google Scholar]
Figure 1. The most extreme fire behavior during the Split wildfire: (a) crown fire burning through pine forest during the downslope fire spread towards the city with flames higher than 30 m and an extensive plume; (b) photographic evidence of generated fire whirl. Both photos were taken at 15 UTC on 17 July 2017 (photographed by Ivan Boban).
Atmosphere 14 01076 g001
Figure 2. The extreme fire behavior in the case of Forcett–Dunalley wildfire in a form of pyroconvection or pyrocumulonimbus clouds at around 16 AEDT on 4 January 2013 (photographed by Janice James).
Atmosphere 14 01076 g002
Figure 3. (a) Domains (d01–d04) used in WRF simulation for the Croatian case study and (b) location of the cross section in the innermost domain (red line) with the X denoting the Split wildfire location.
Atmosphere 14 01076 g003
Figure 4. As in Figure 3, except for the Australian case study and with the X denoting the Forcett–Dunalley wildfire location.
Atmosphere 14 01076 g004
Figure 5. WRF model results at 500 m resolution: (a,b) 10 m wind vectors (arrows) and windspeed (m s−1, shaded); (c,d) 2 m air temperature (°C) (e,f) 2 m relative humidity (%). The time at (a,c,e) is 2300 UTC 16 July 2017 for The Split cast study, while that at (b,d,f) is 14 AEDT 3 January 2013 for the Dunalley case study.
Atmosphere 14 01076 g005
Figure 6. Cross section of simulated (a,b) horizontal and vertical wind (arrows, m s−1) and air temperature (°C), (c,d) relative humidity (%) and potential temperature (K), and (e,f) z wind (m s–1) along the cross sections at Figure 3 and Figure 4, respectively. The time at (a,c,e) is at 23 UTC on 16 July 2017 for the Split case study, while that at (b,d,f) is at 14 AEDT on 3 January 2013 for the Dunalley case study.
Atmosphere 14 01076 g006aAtmosphere 14 01076 g006b
Figure 7. As in Figure 5 except for (a,c,e) 1500 UTC 17 July 2017 for the Split case study and (b,d) and (f) 1600 AEDT 4 January 2013 for the Dunalley case study.
Atmosphere 14 01076 g007
Figure 8. As in Figure 6 except for (a,c,e) 1500 UTC 17 July 2017 for the Split case study and (b,d) and (f) 1600 AEDT 4 January 2013 for the Dunalley case study.
Atmosphere 14 01076 g008aAtmosphere 14 01076 g008b
Table 1. Number of grid points in simulations for two case studies. There are 66 hybrid levels for both simulations.
WRF Simulation Domain
and Resolution
Number of Grid Points
(West-East × South-North × Hybrid Levels)
and Size of Domain
Croatian Case StudyAustralian Case Study
d01 (9.0 km)110 × 110 × 66
990 km × 990 km
434 × 392 × 66
3906 km × 3528 km
d02 (4.5 km)151 × 153 × 66
679.5 km × 688.5 km
457 × 423 × 66
2056 km × 1903.5 km
d03 (1.5 km)244 × 223 × 66
366 km × 334.5 km
352 × 331 × 66
528 km × 496.5 km
d04 (0.5 km)196 × 202 × 66
98 km × 101 km
346 × 310 × 66
173 km × 155 km
Disclaimer/Publisher’s Note: The statements, opinions and data contained in all publications are solely those of the individual author(s) and contributor(s) and not of MDPI and/or the editor(s). MDPI and/or the editor(s) disclaim responsibility for any injury to people or property resulting from any ideas, methods, instructions or products referred to in the content.

