

Wind Simulations over Western Patagonia Using the Weather Research and Forecasting model and Reanalysis


 , and
, and
Abstract
1. Introduction
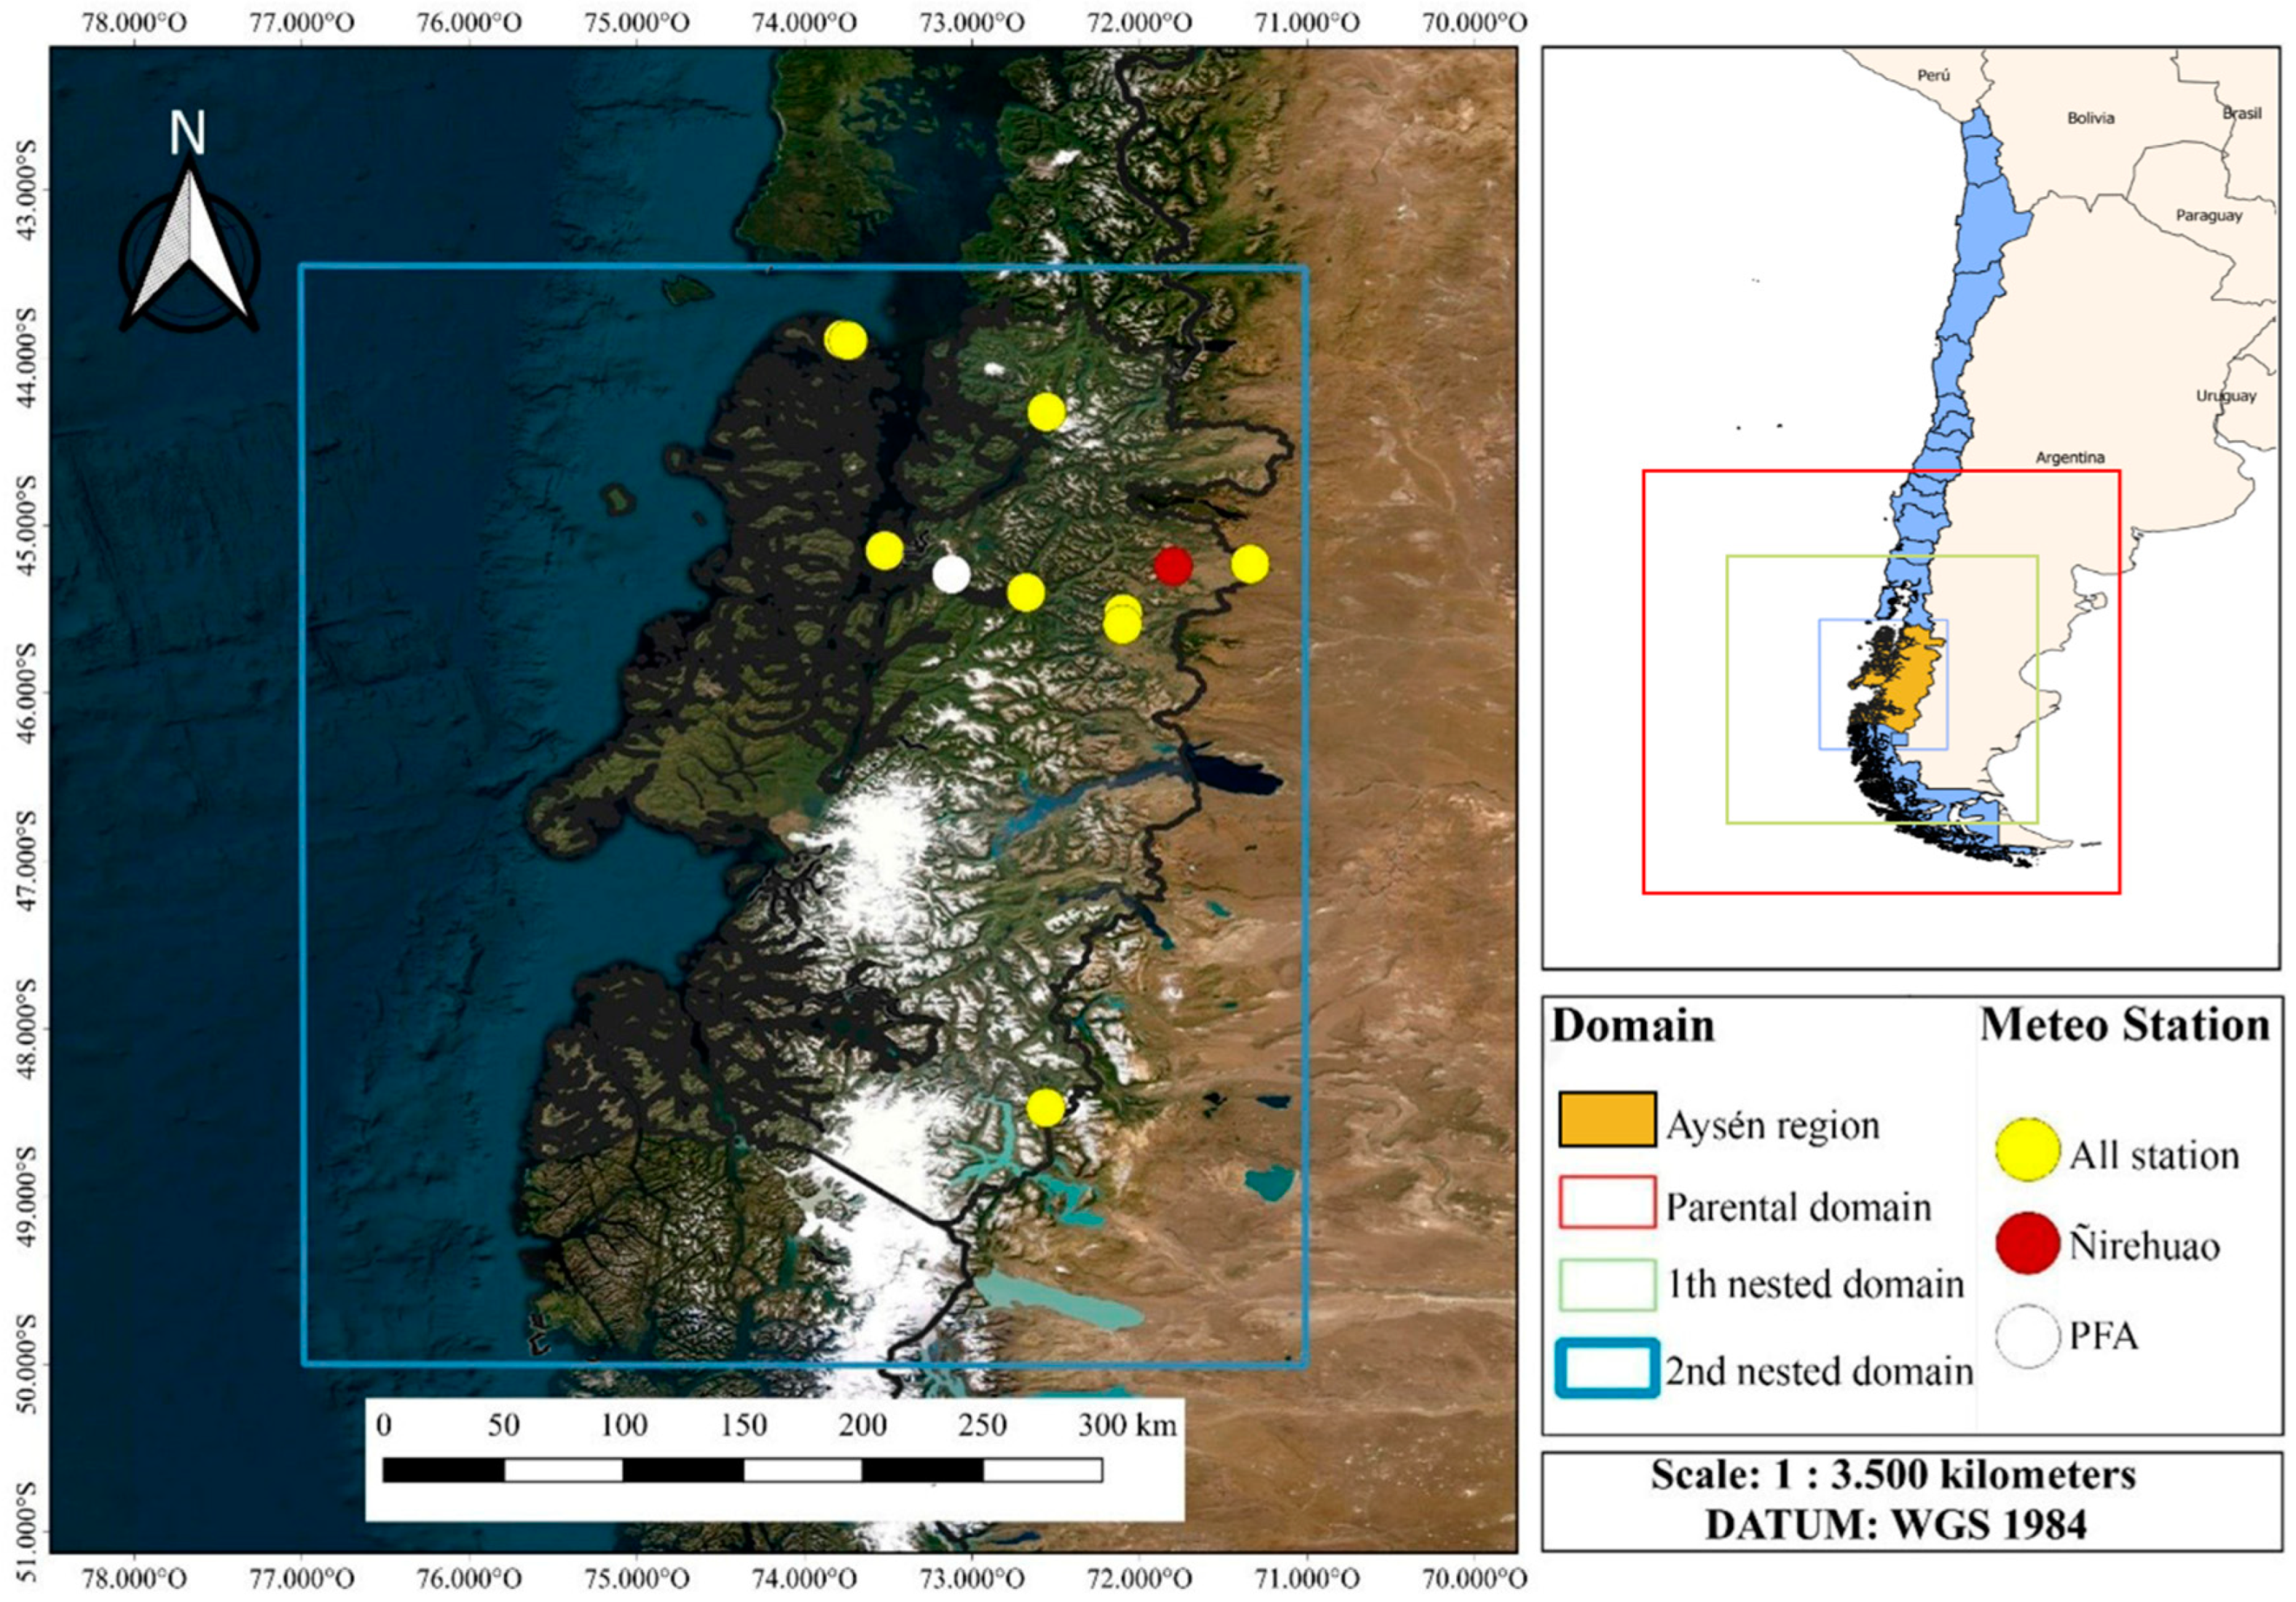
2. Study Area
3. Data and Methodology
3.1. Meteorological Stations
3.2. Eddy Covariance Flux Tower
3.3. Wind Speed Data Sets
3.4. Mesoscale Simulation
3.5. Statistical Analysis
4. Results and Analysis
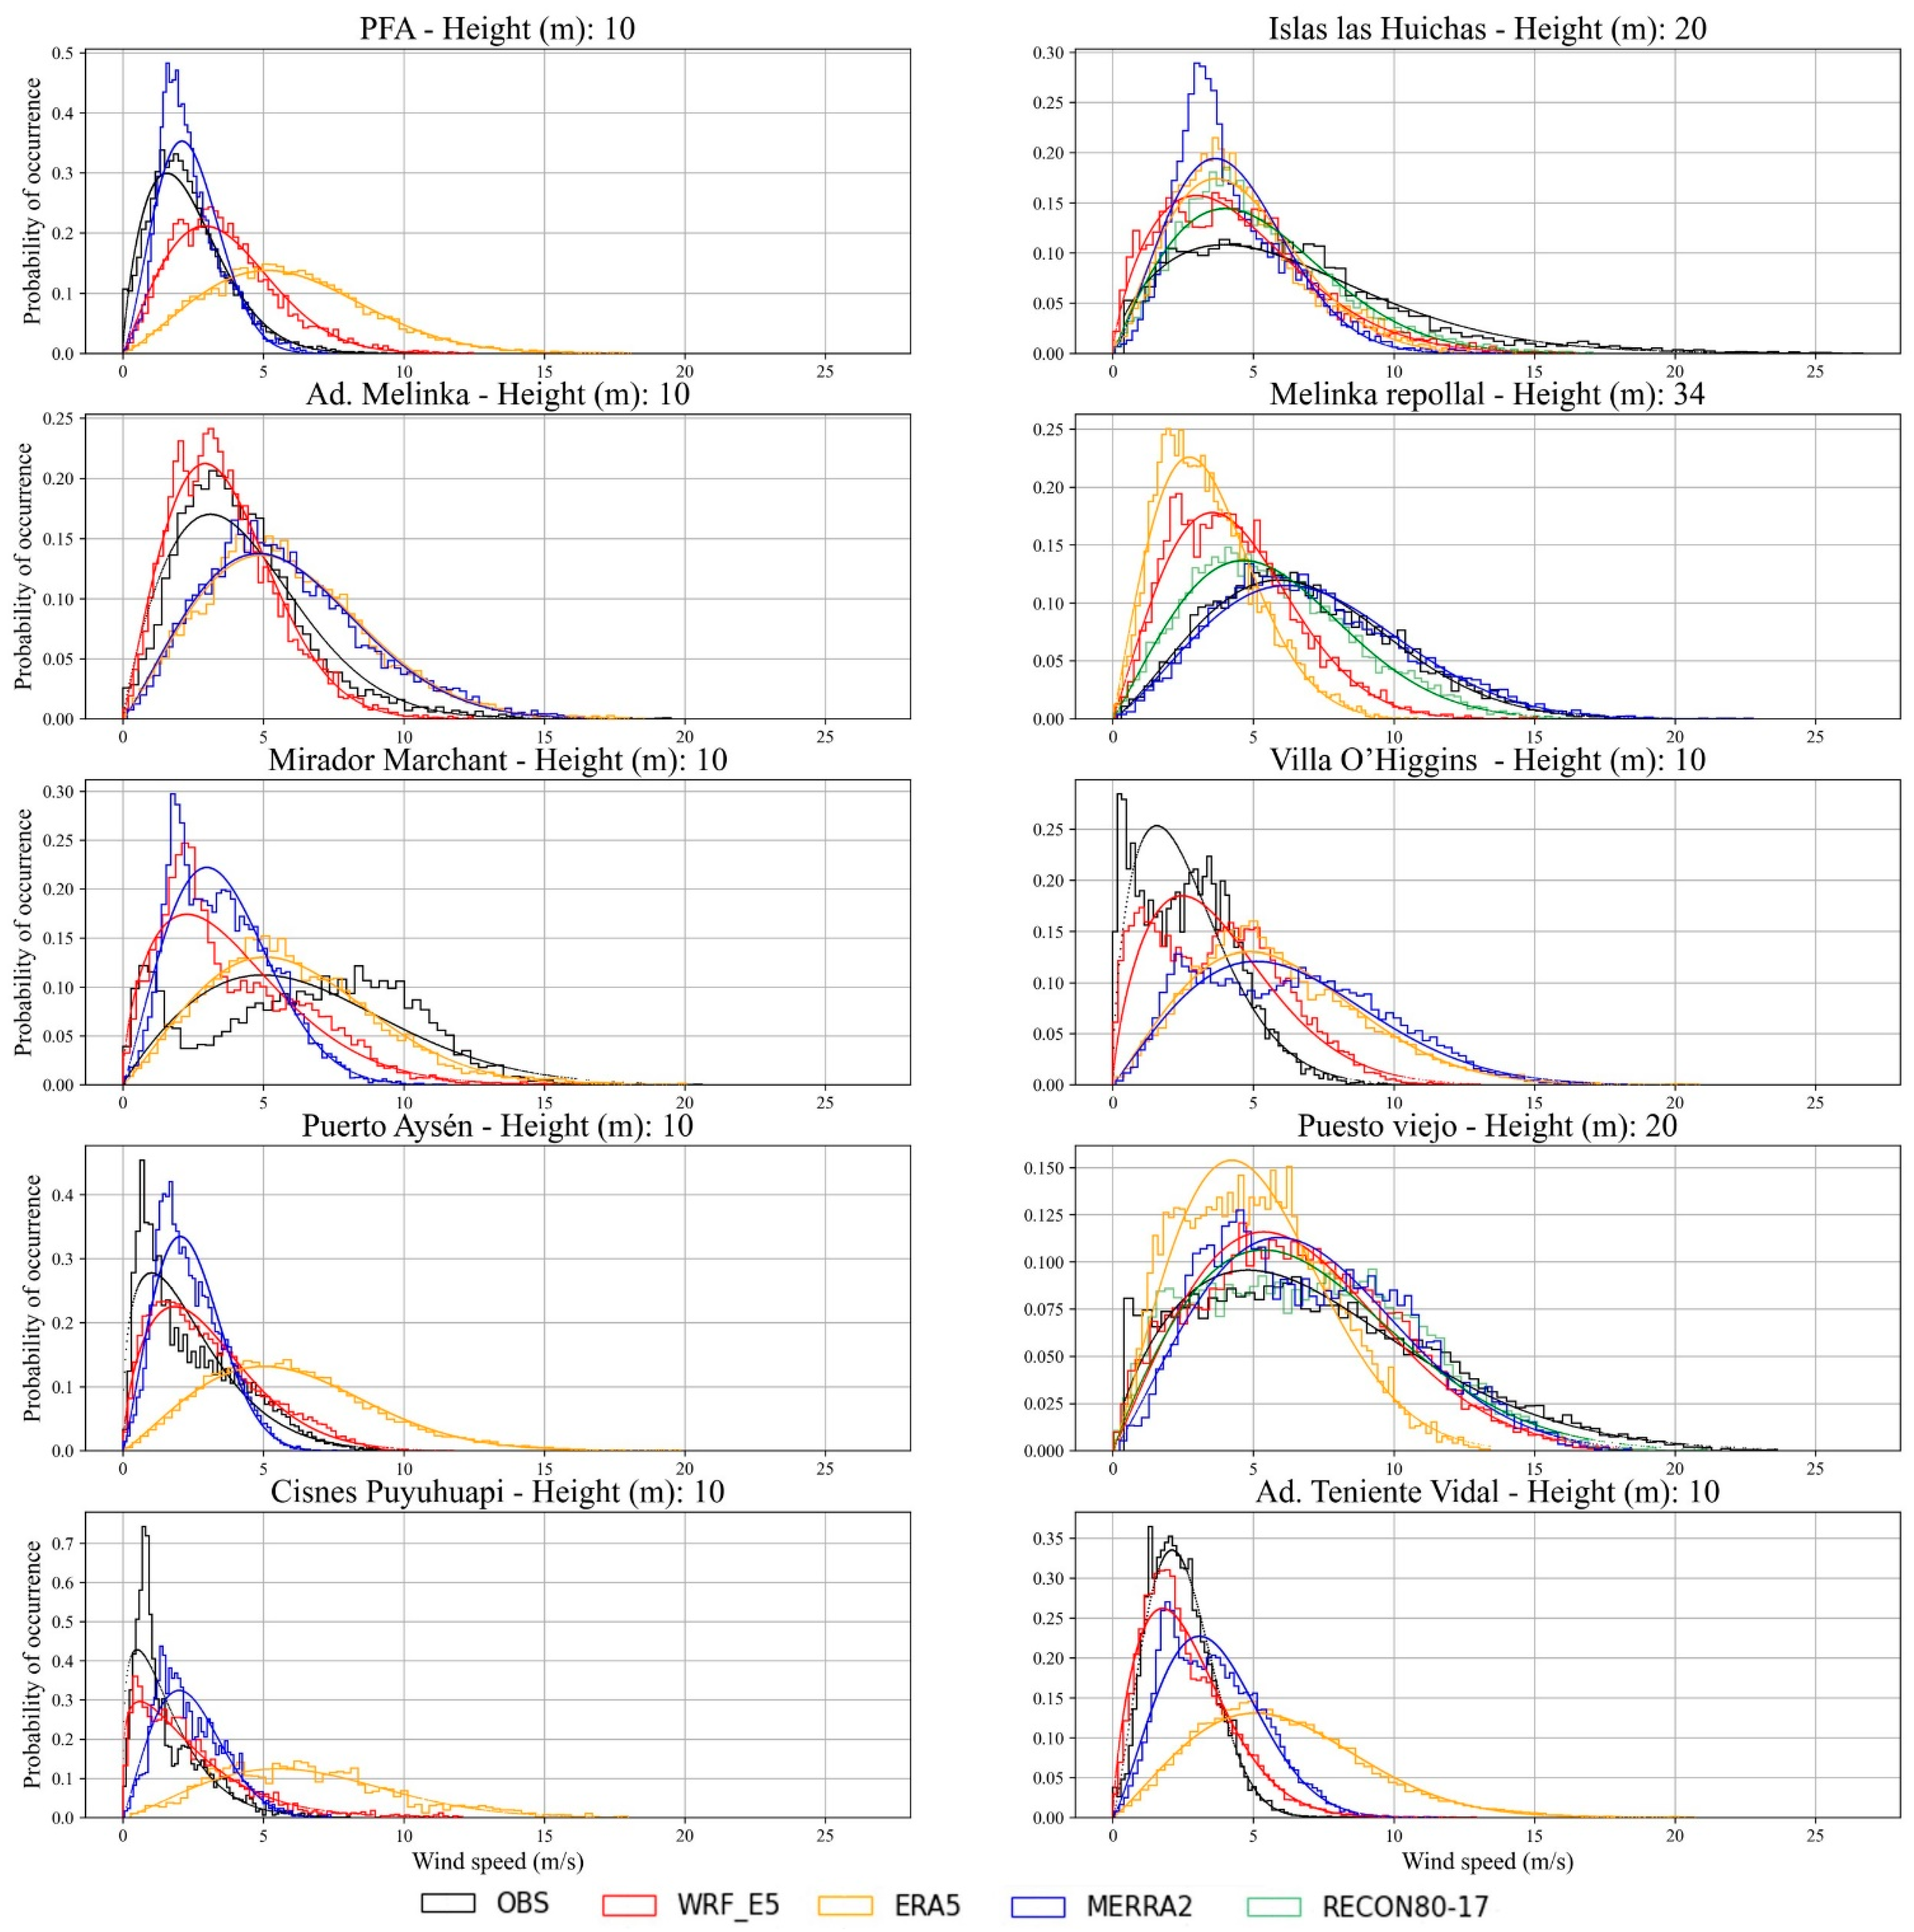
4.1. Comparison of Wind Speed from ERA-5, MERRA-2, RECON80-17 and WRF_E5 Simulation
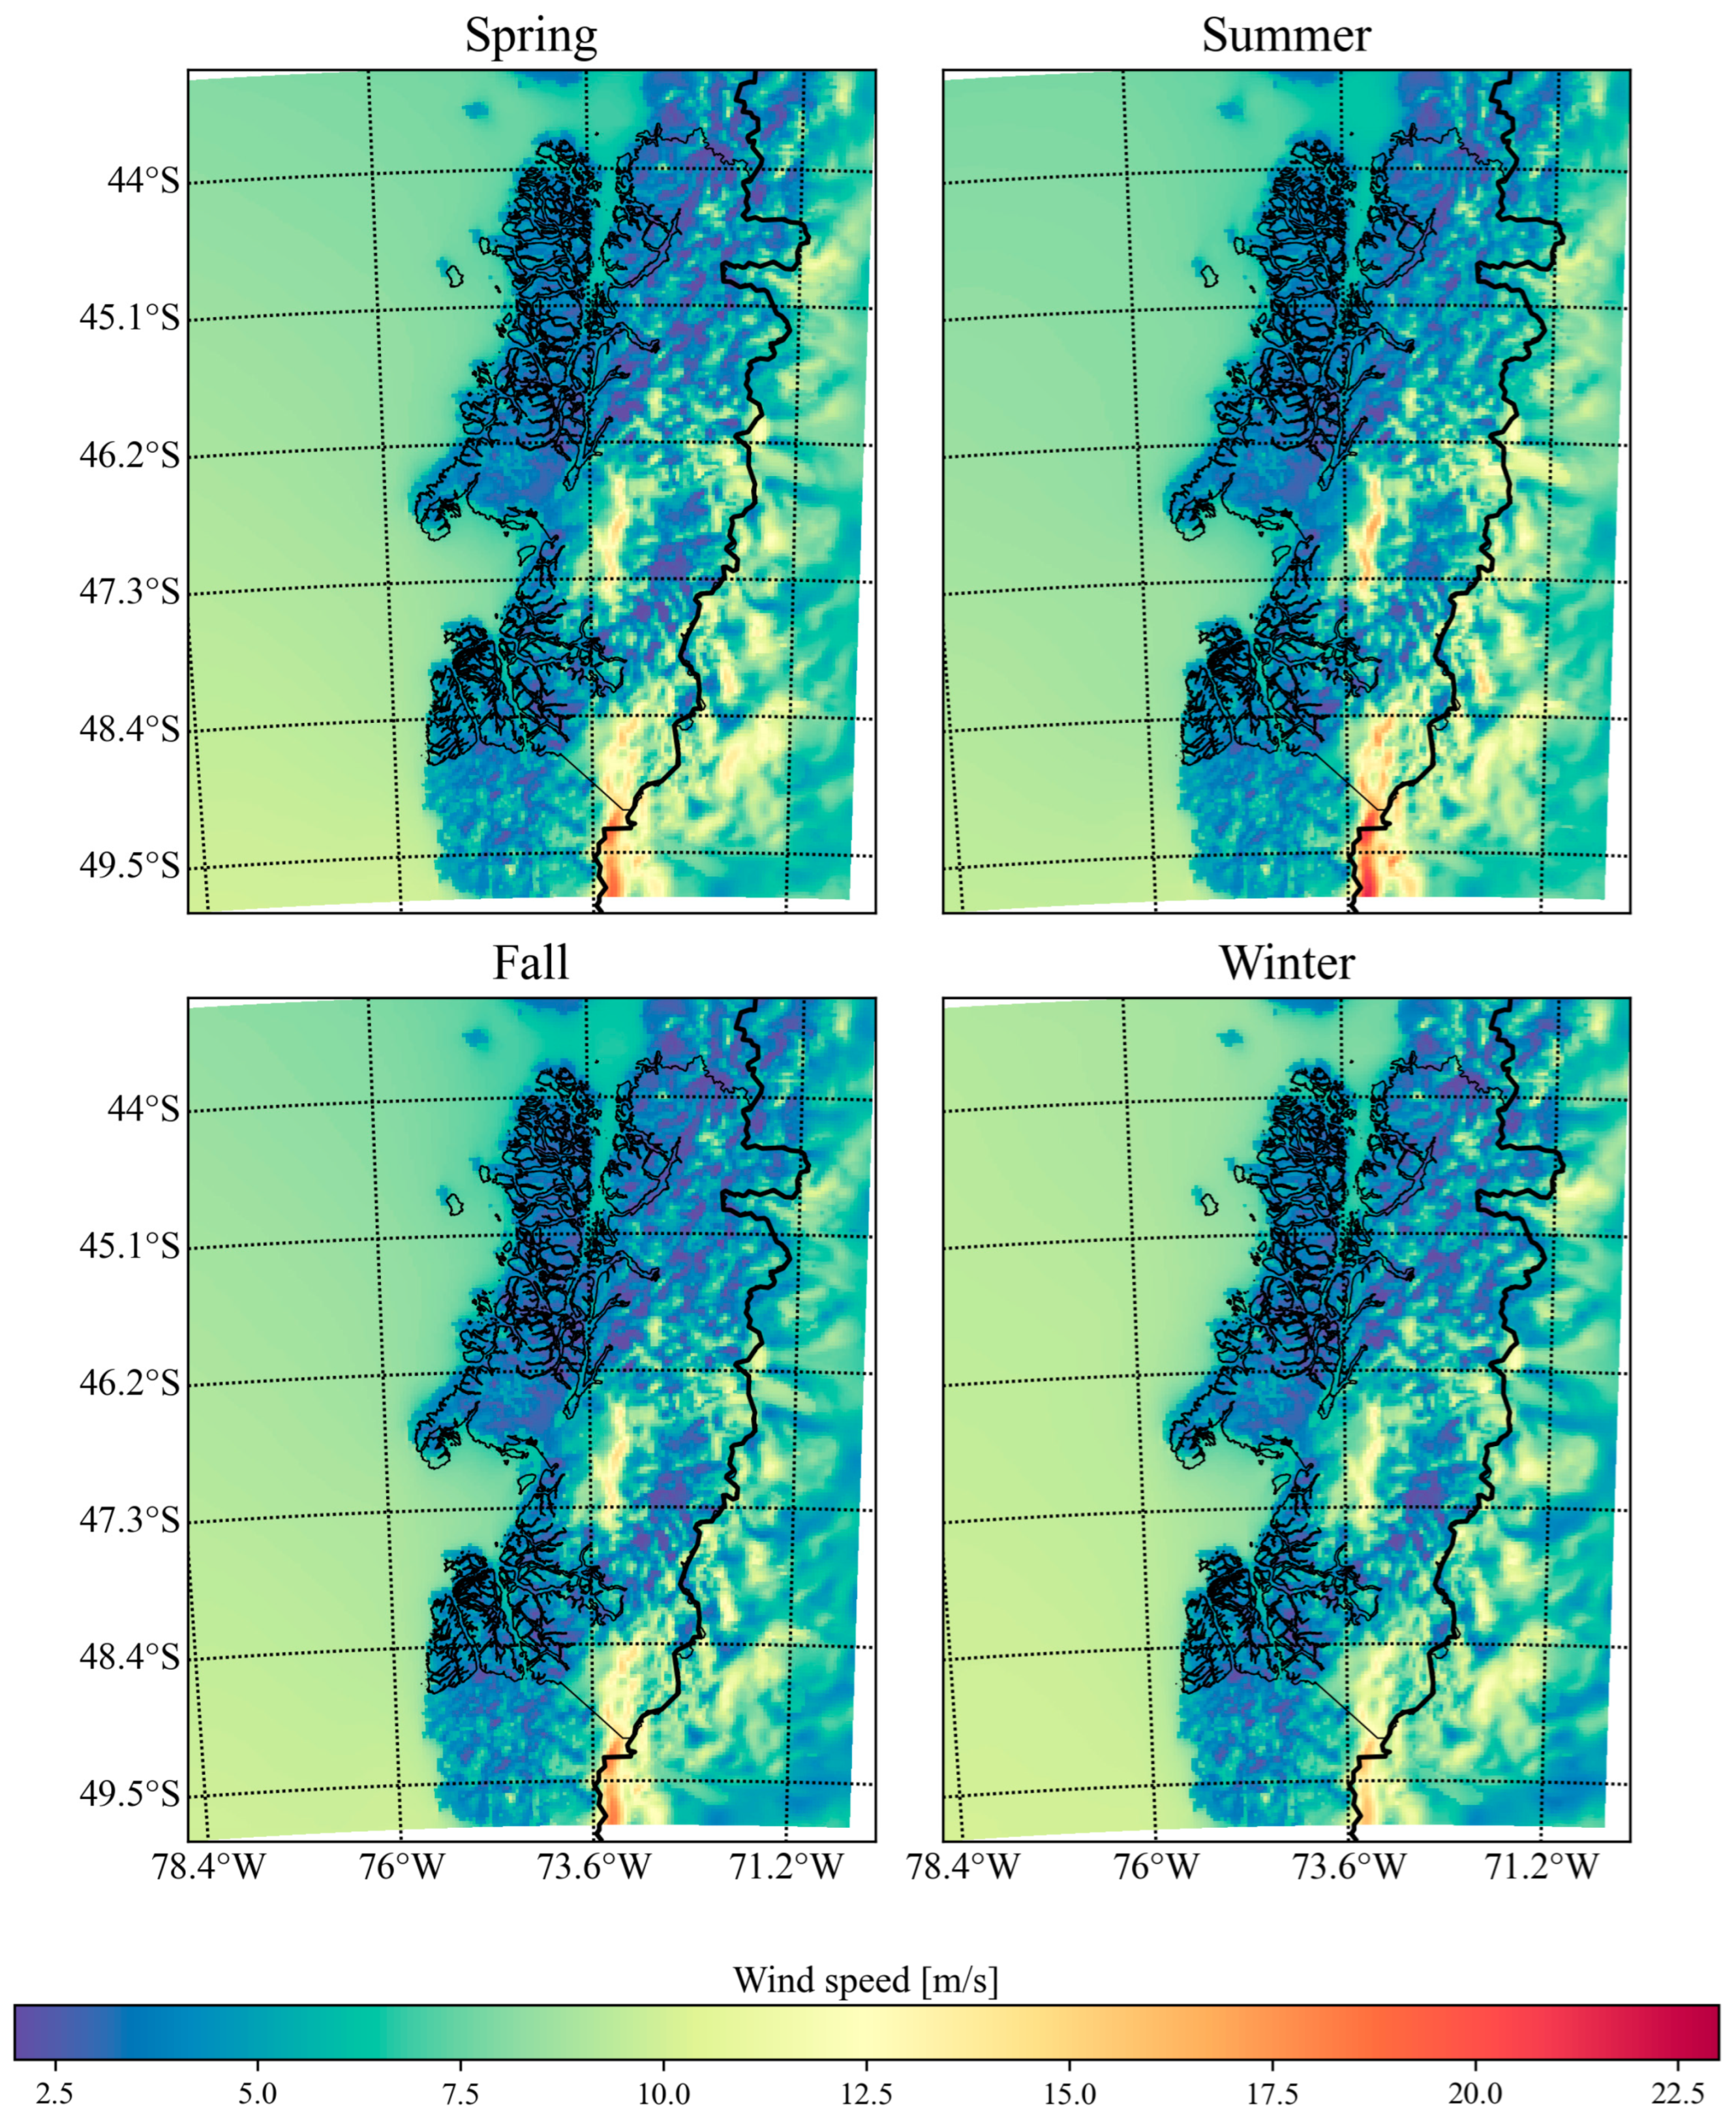
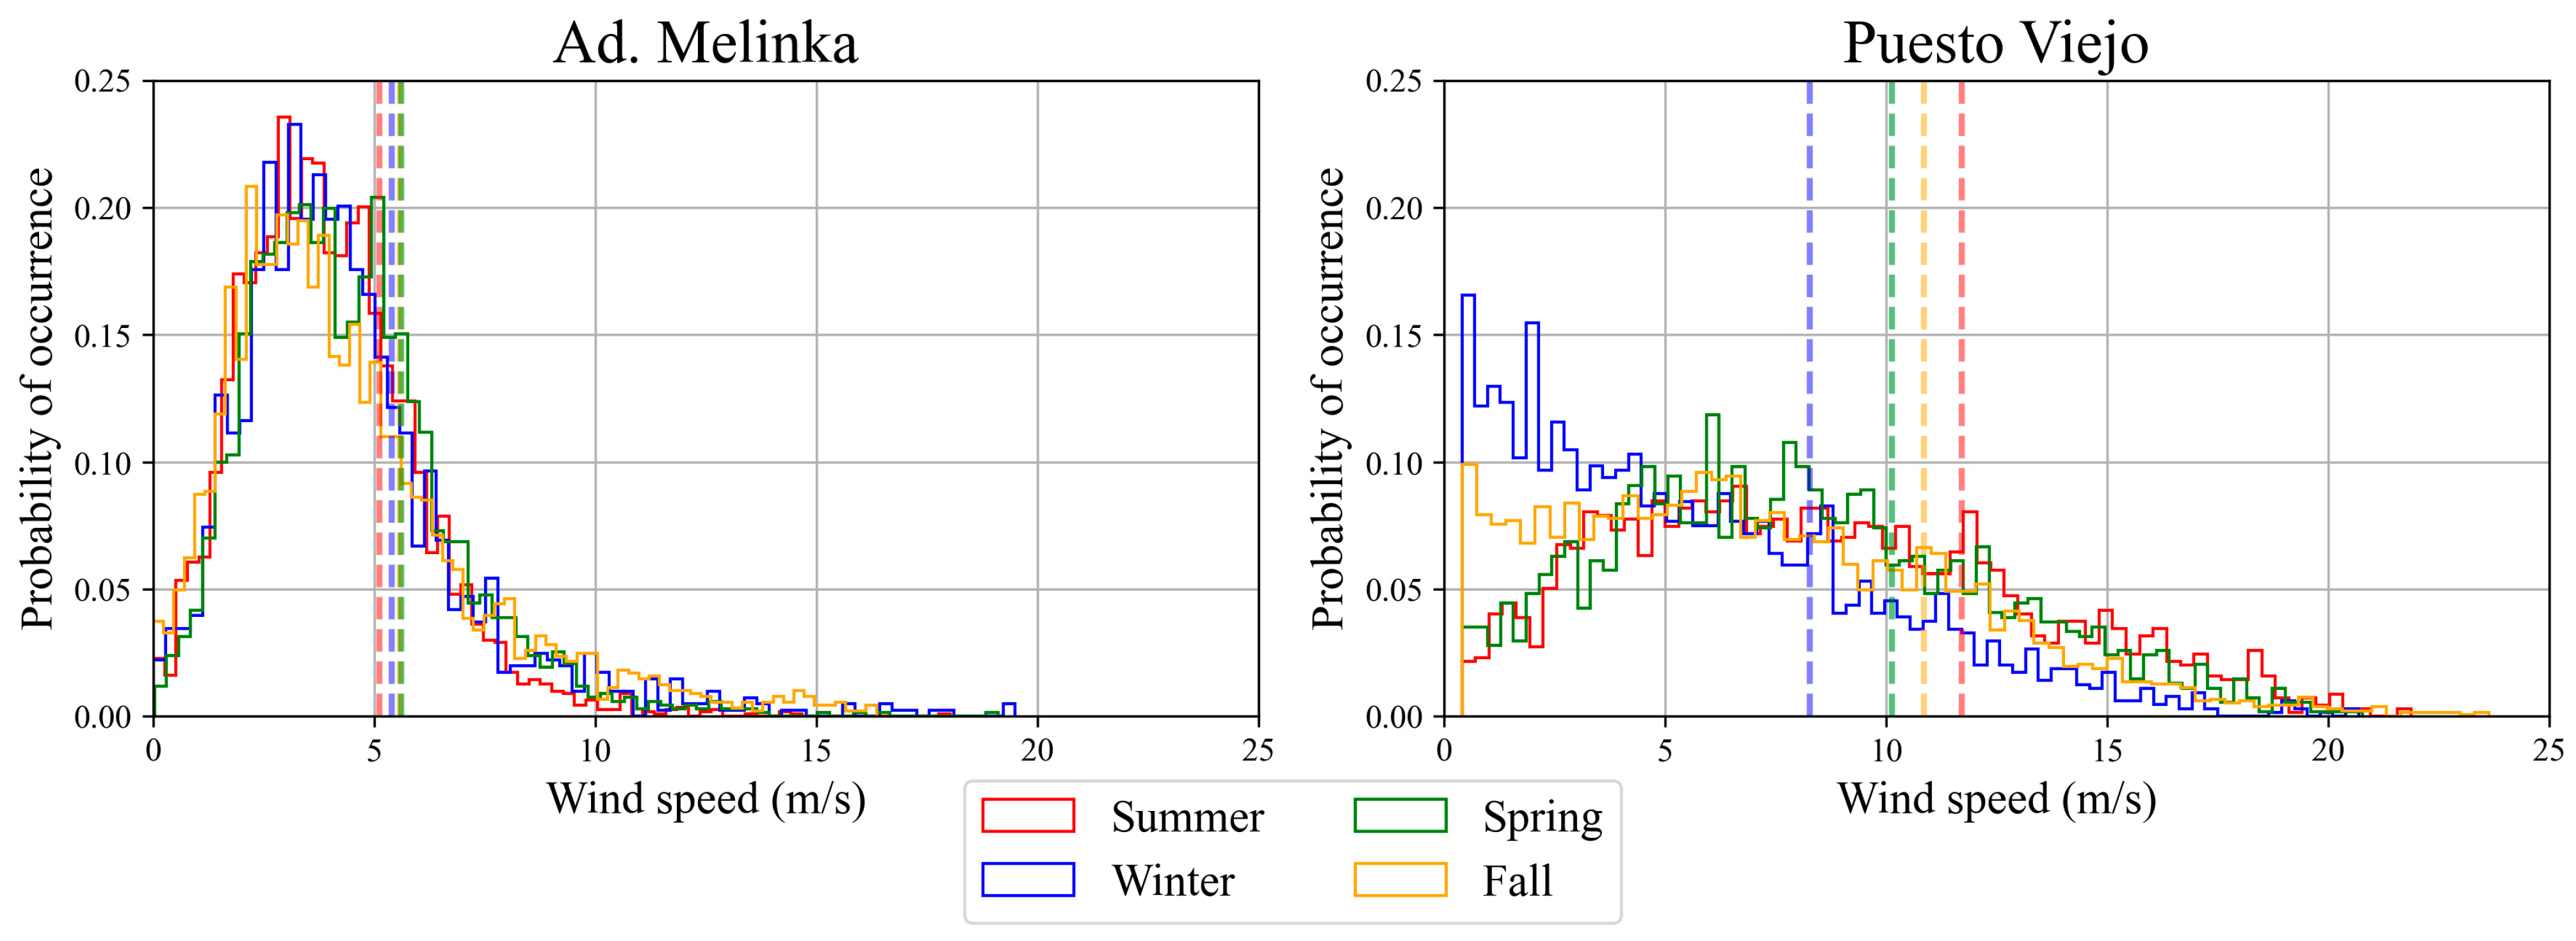
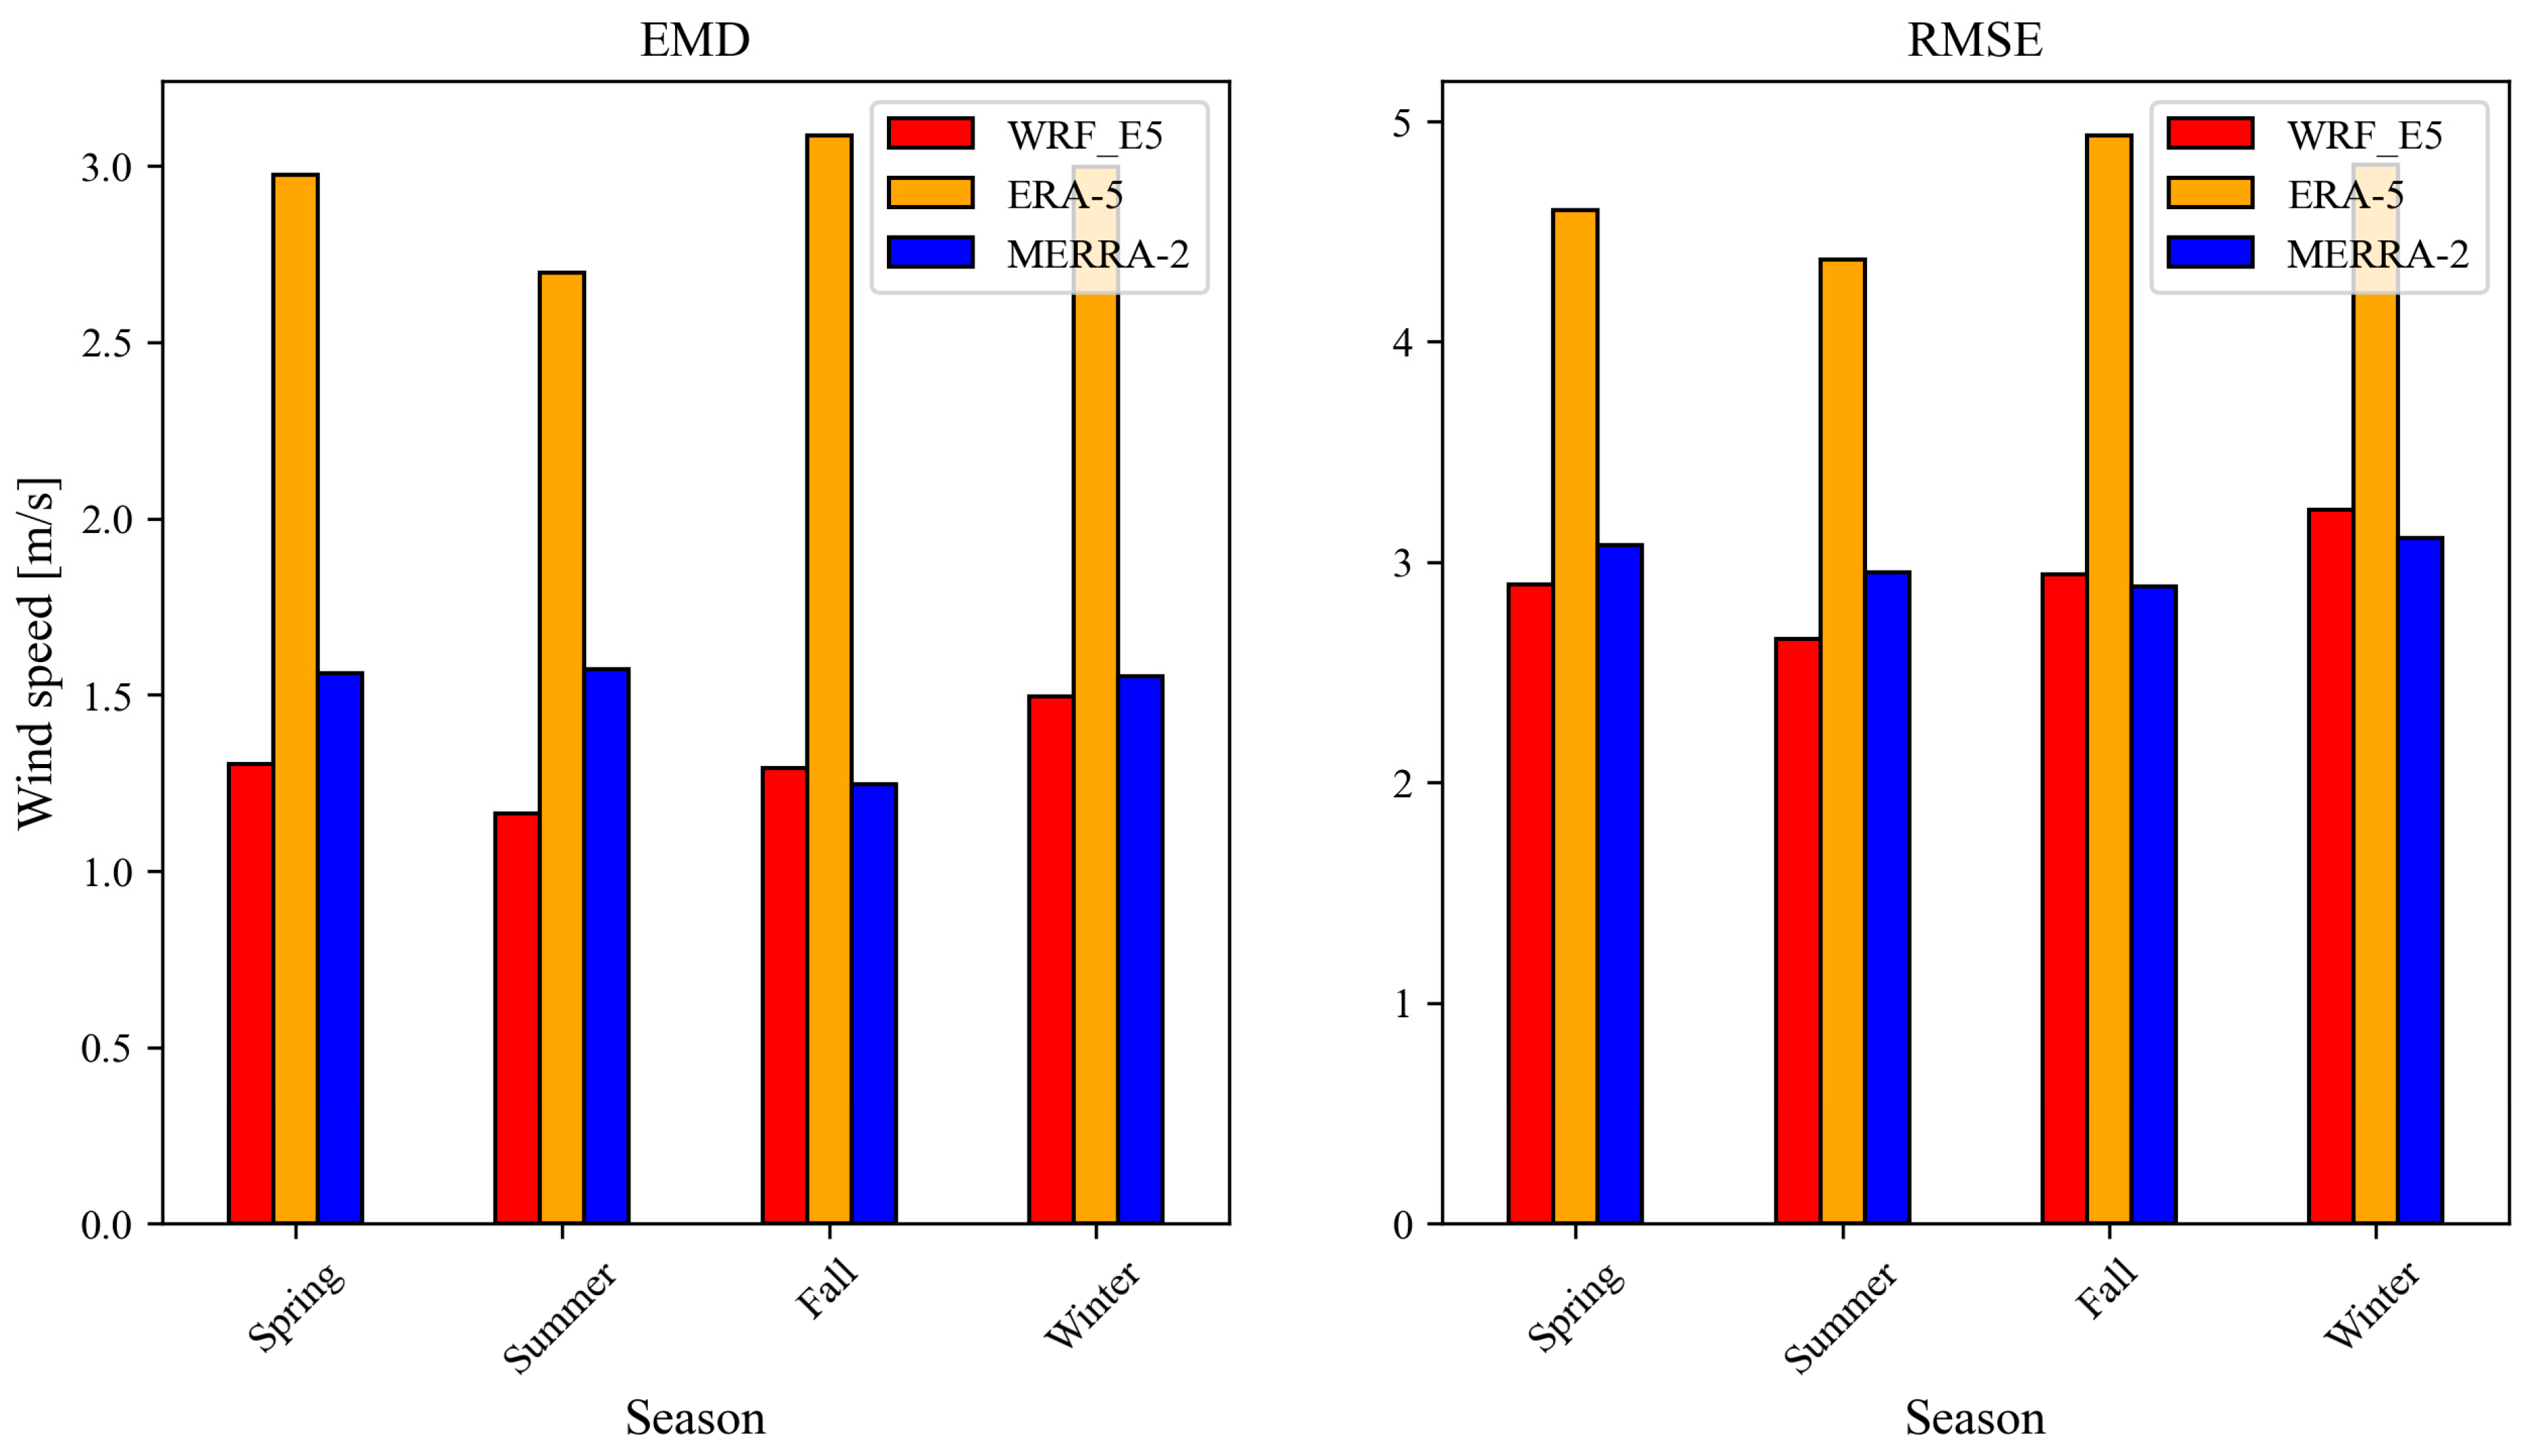
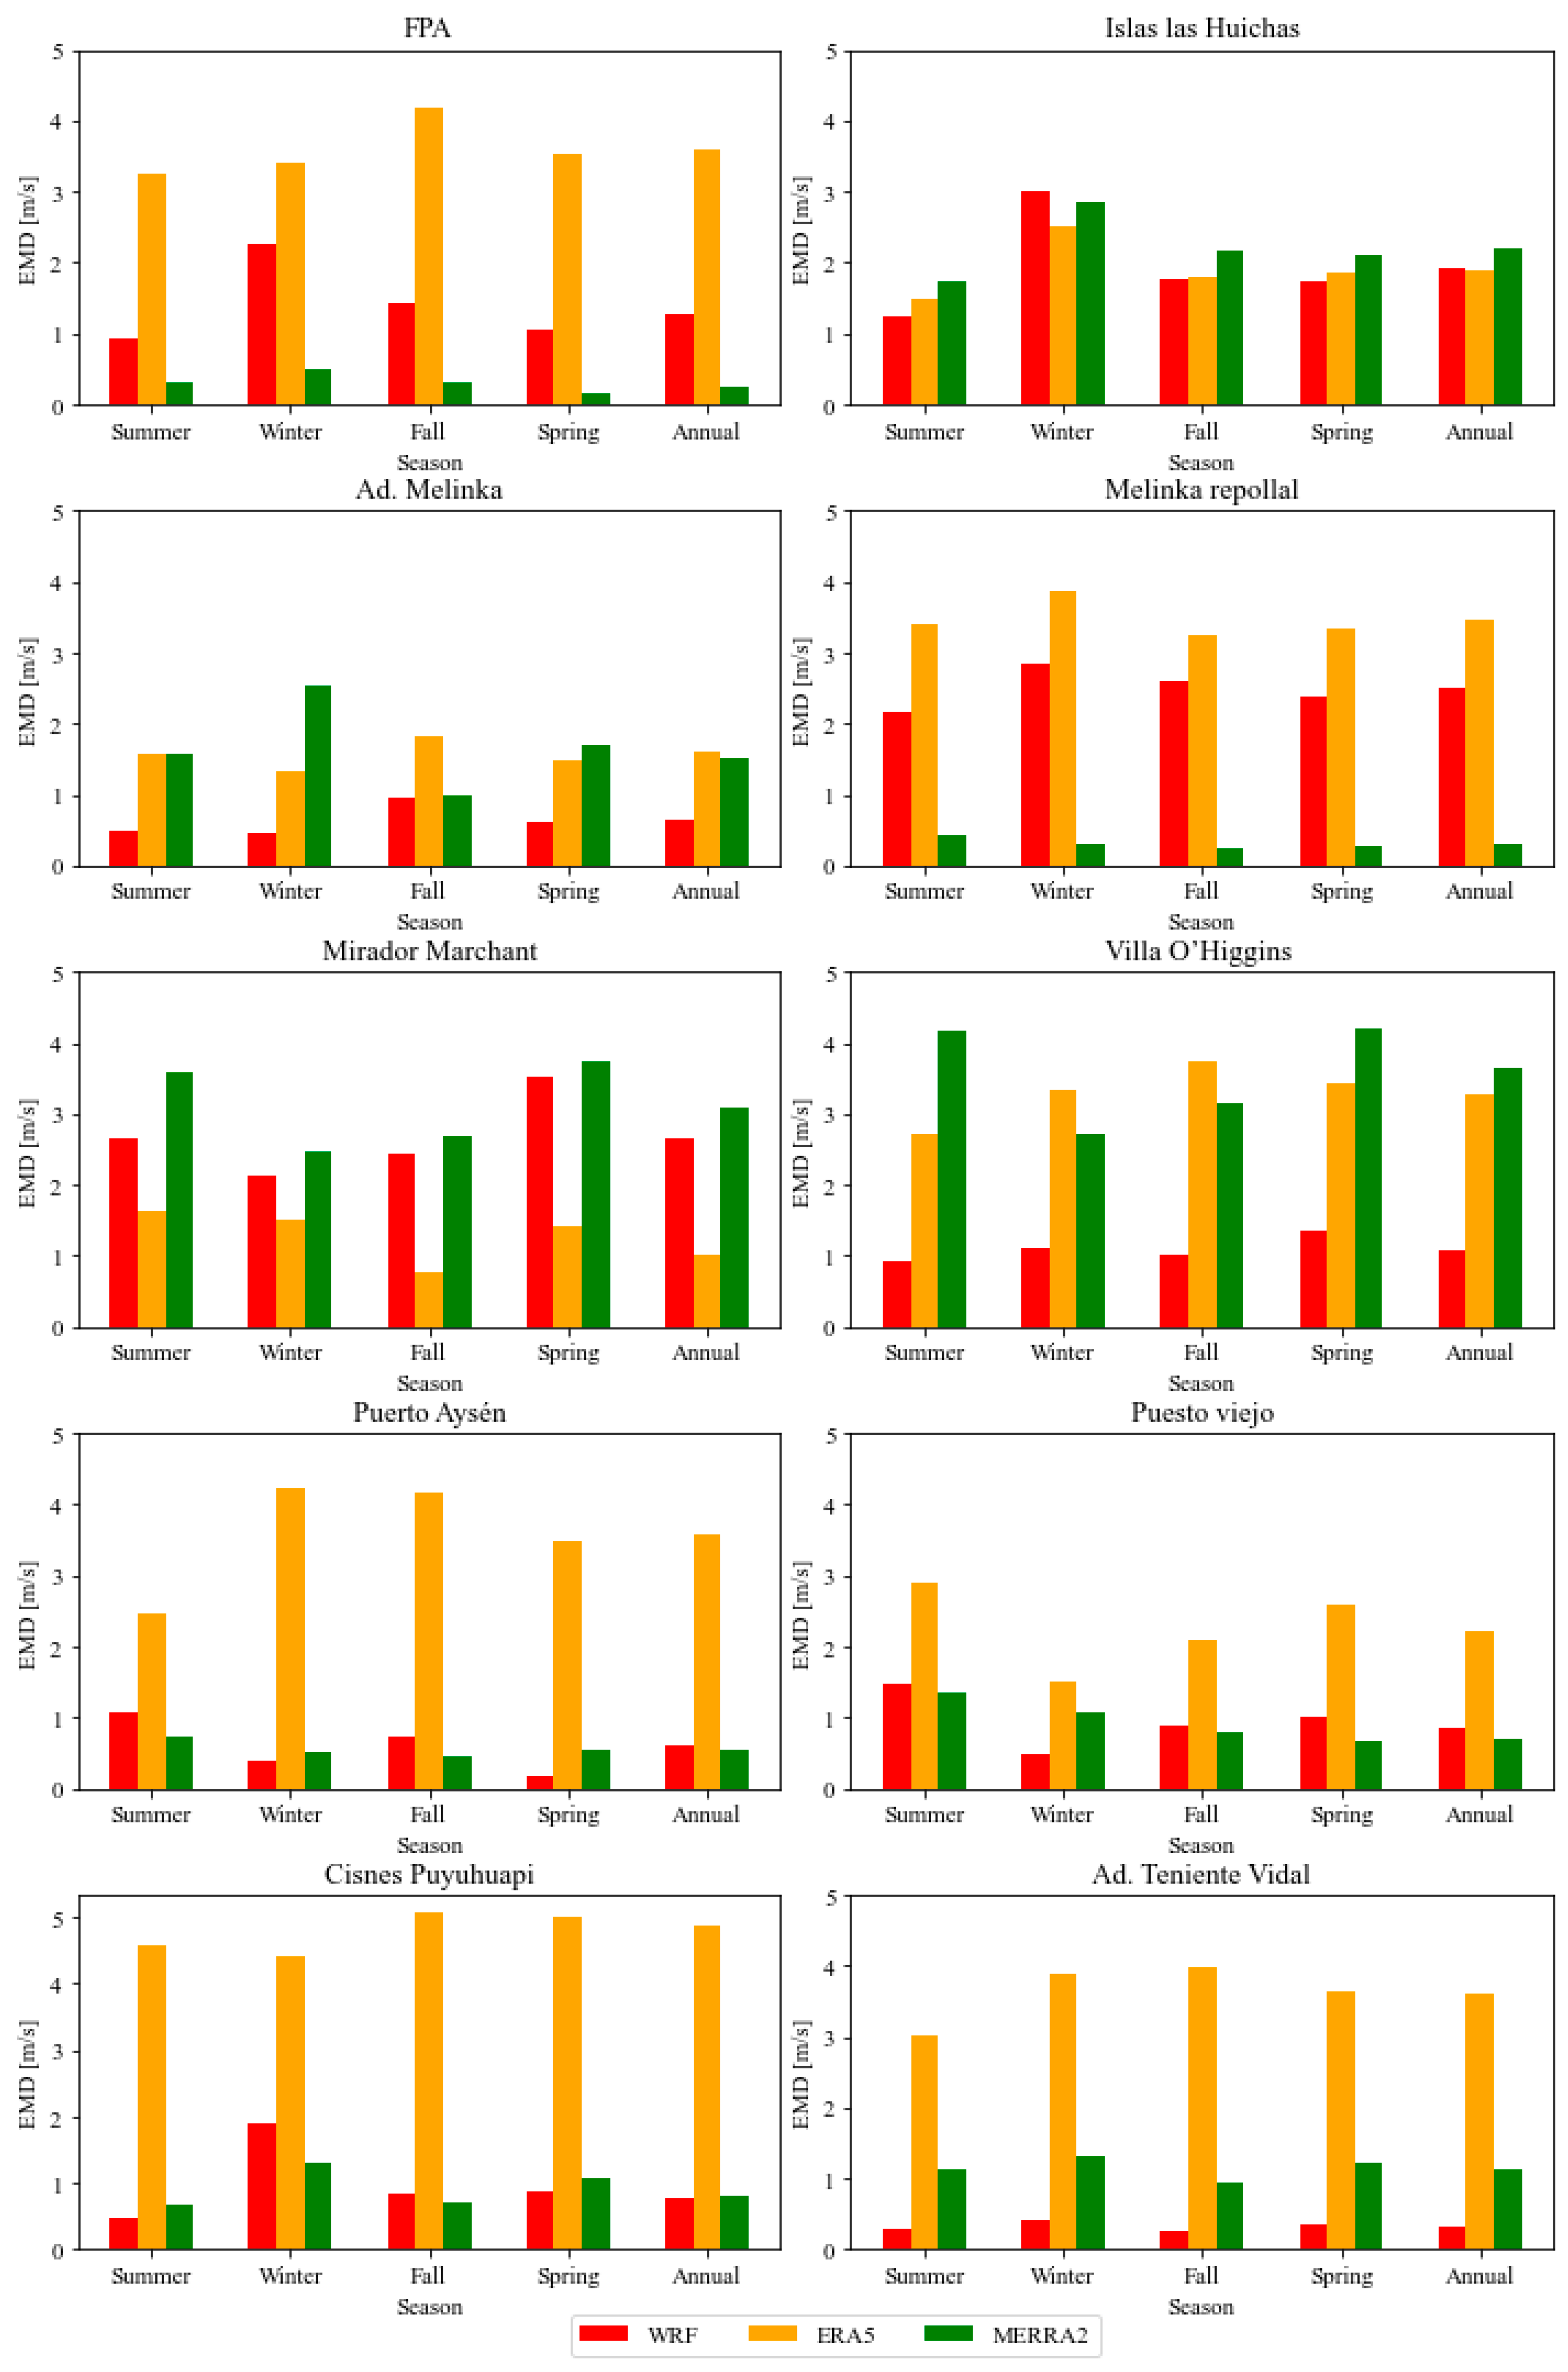
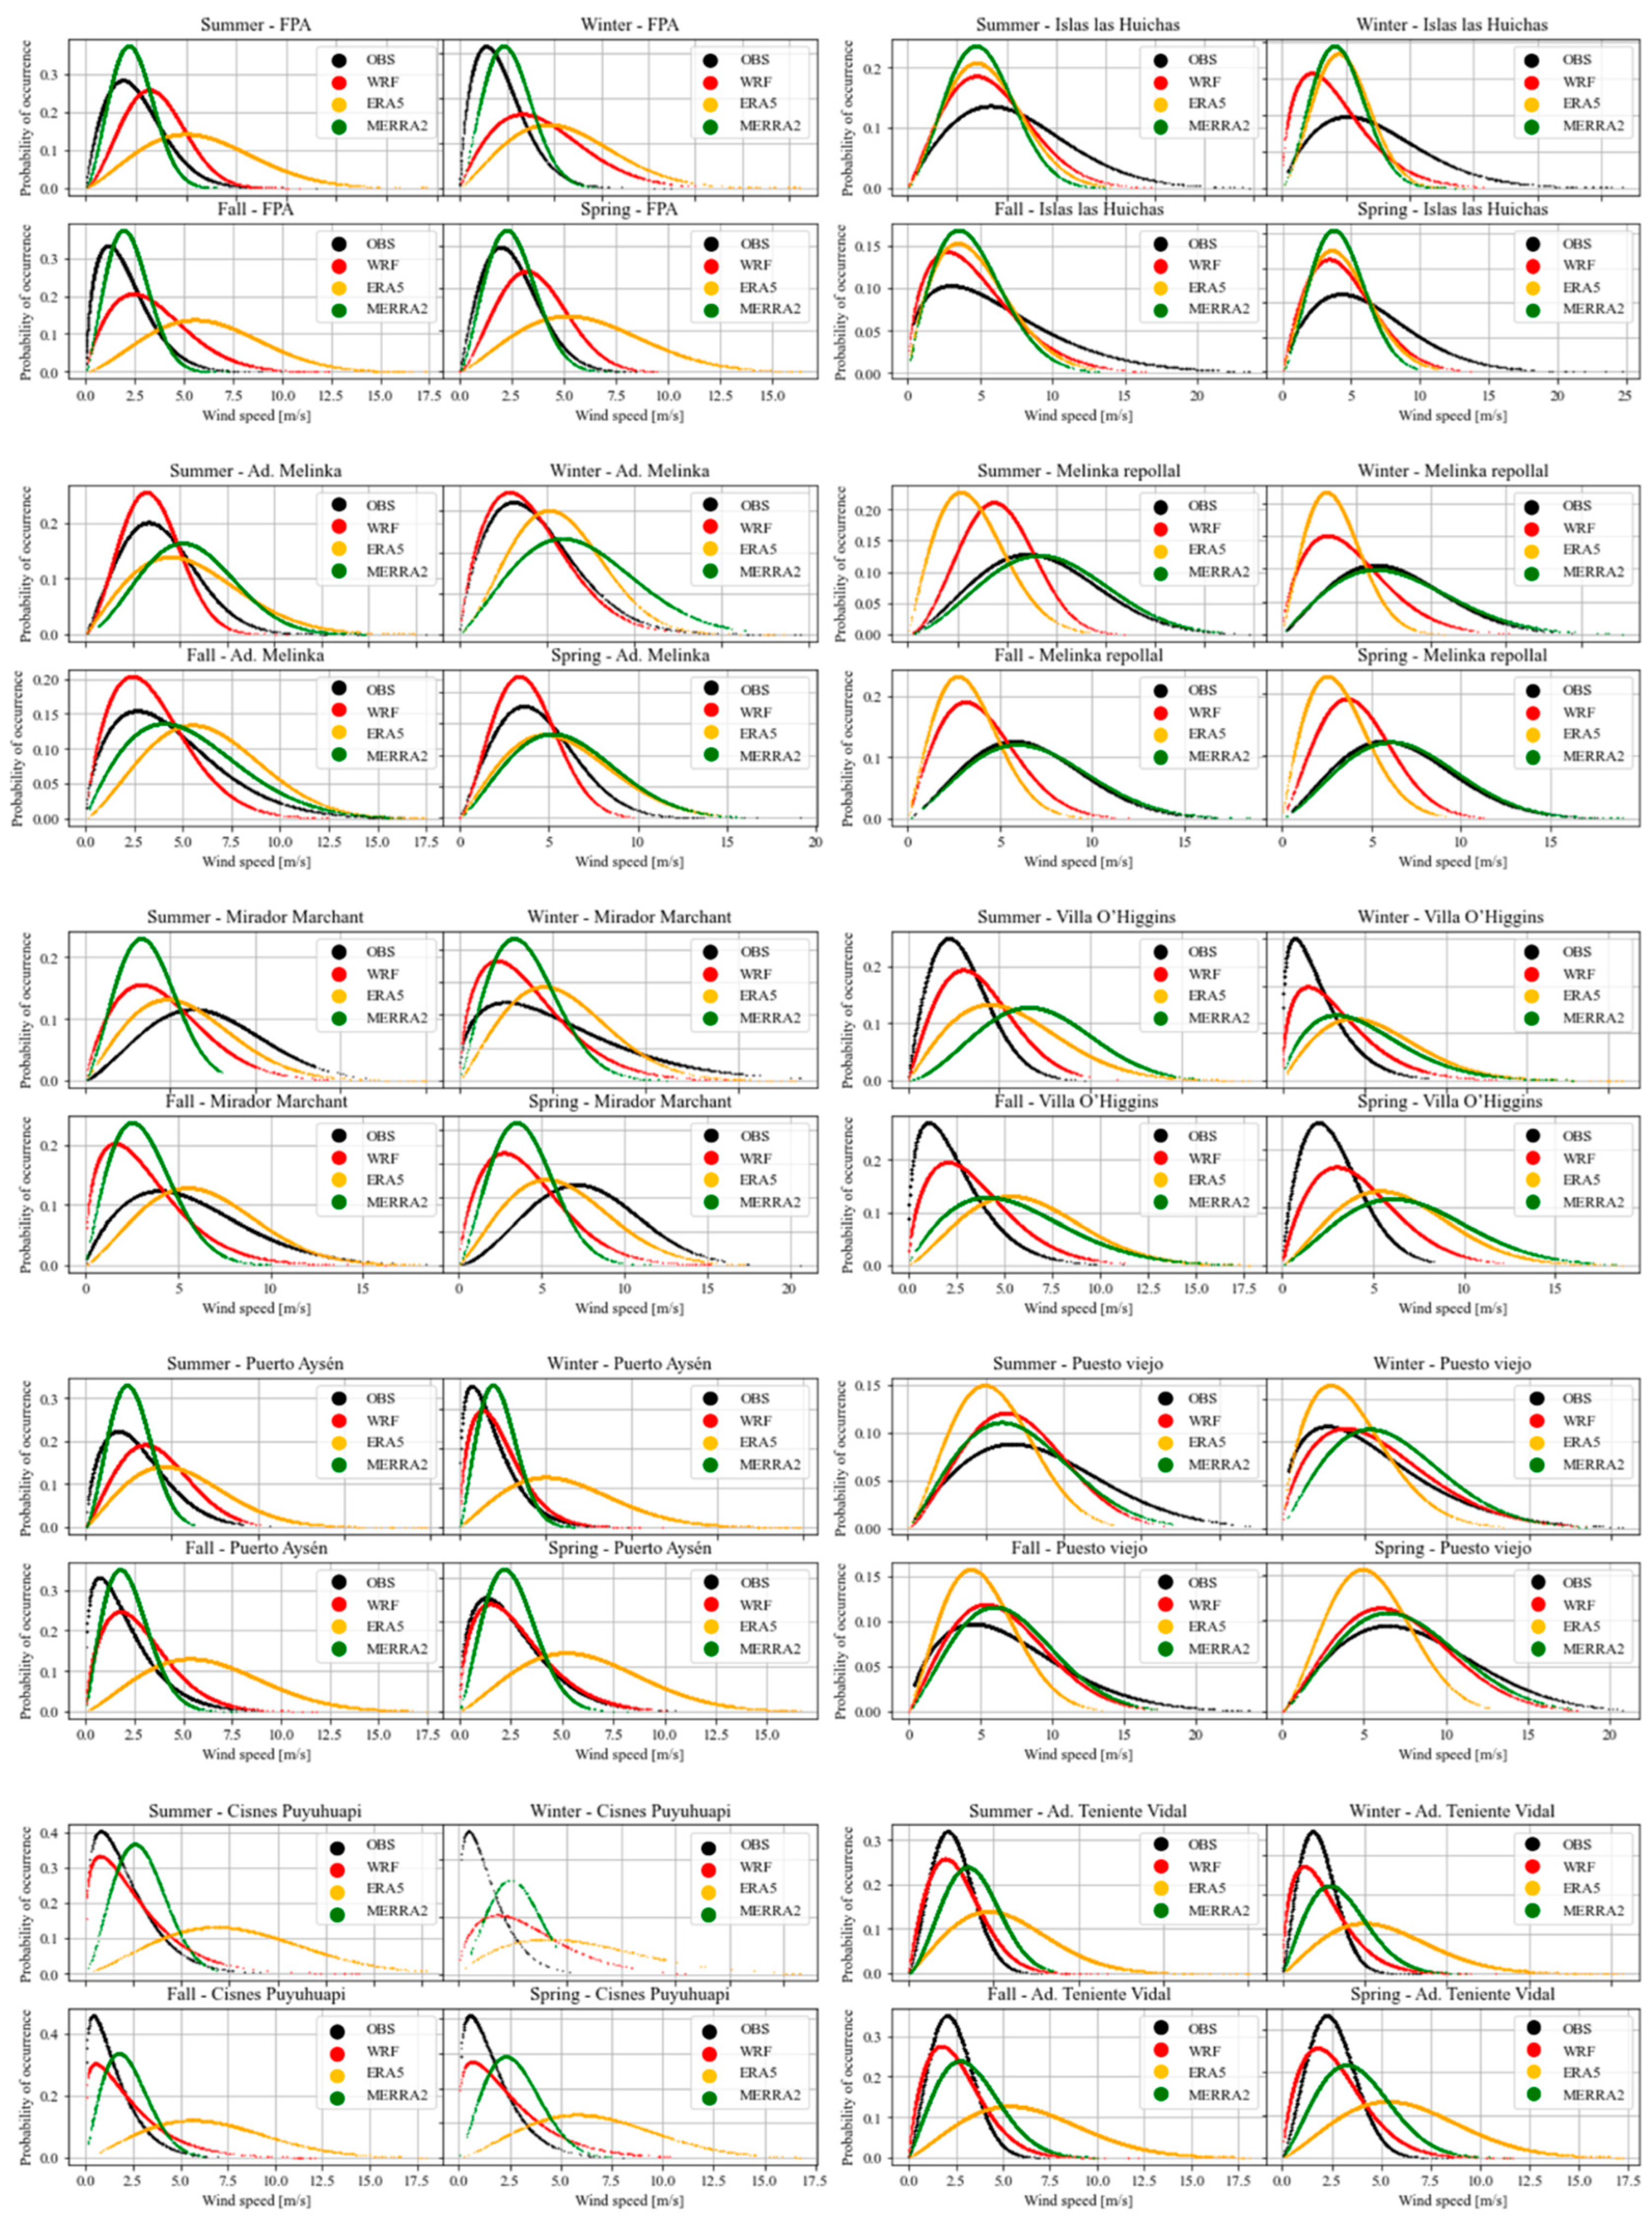
4.2. Seasonal Comparison of Wind Speed from ERA-5, MERRA-2 and WRF_E5 Data Sets
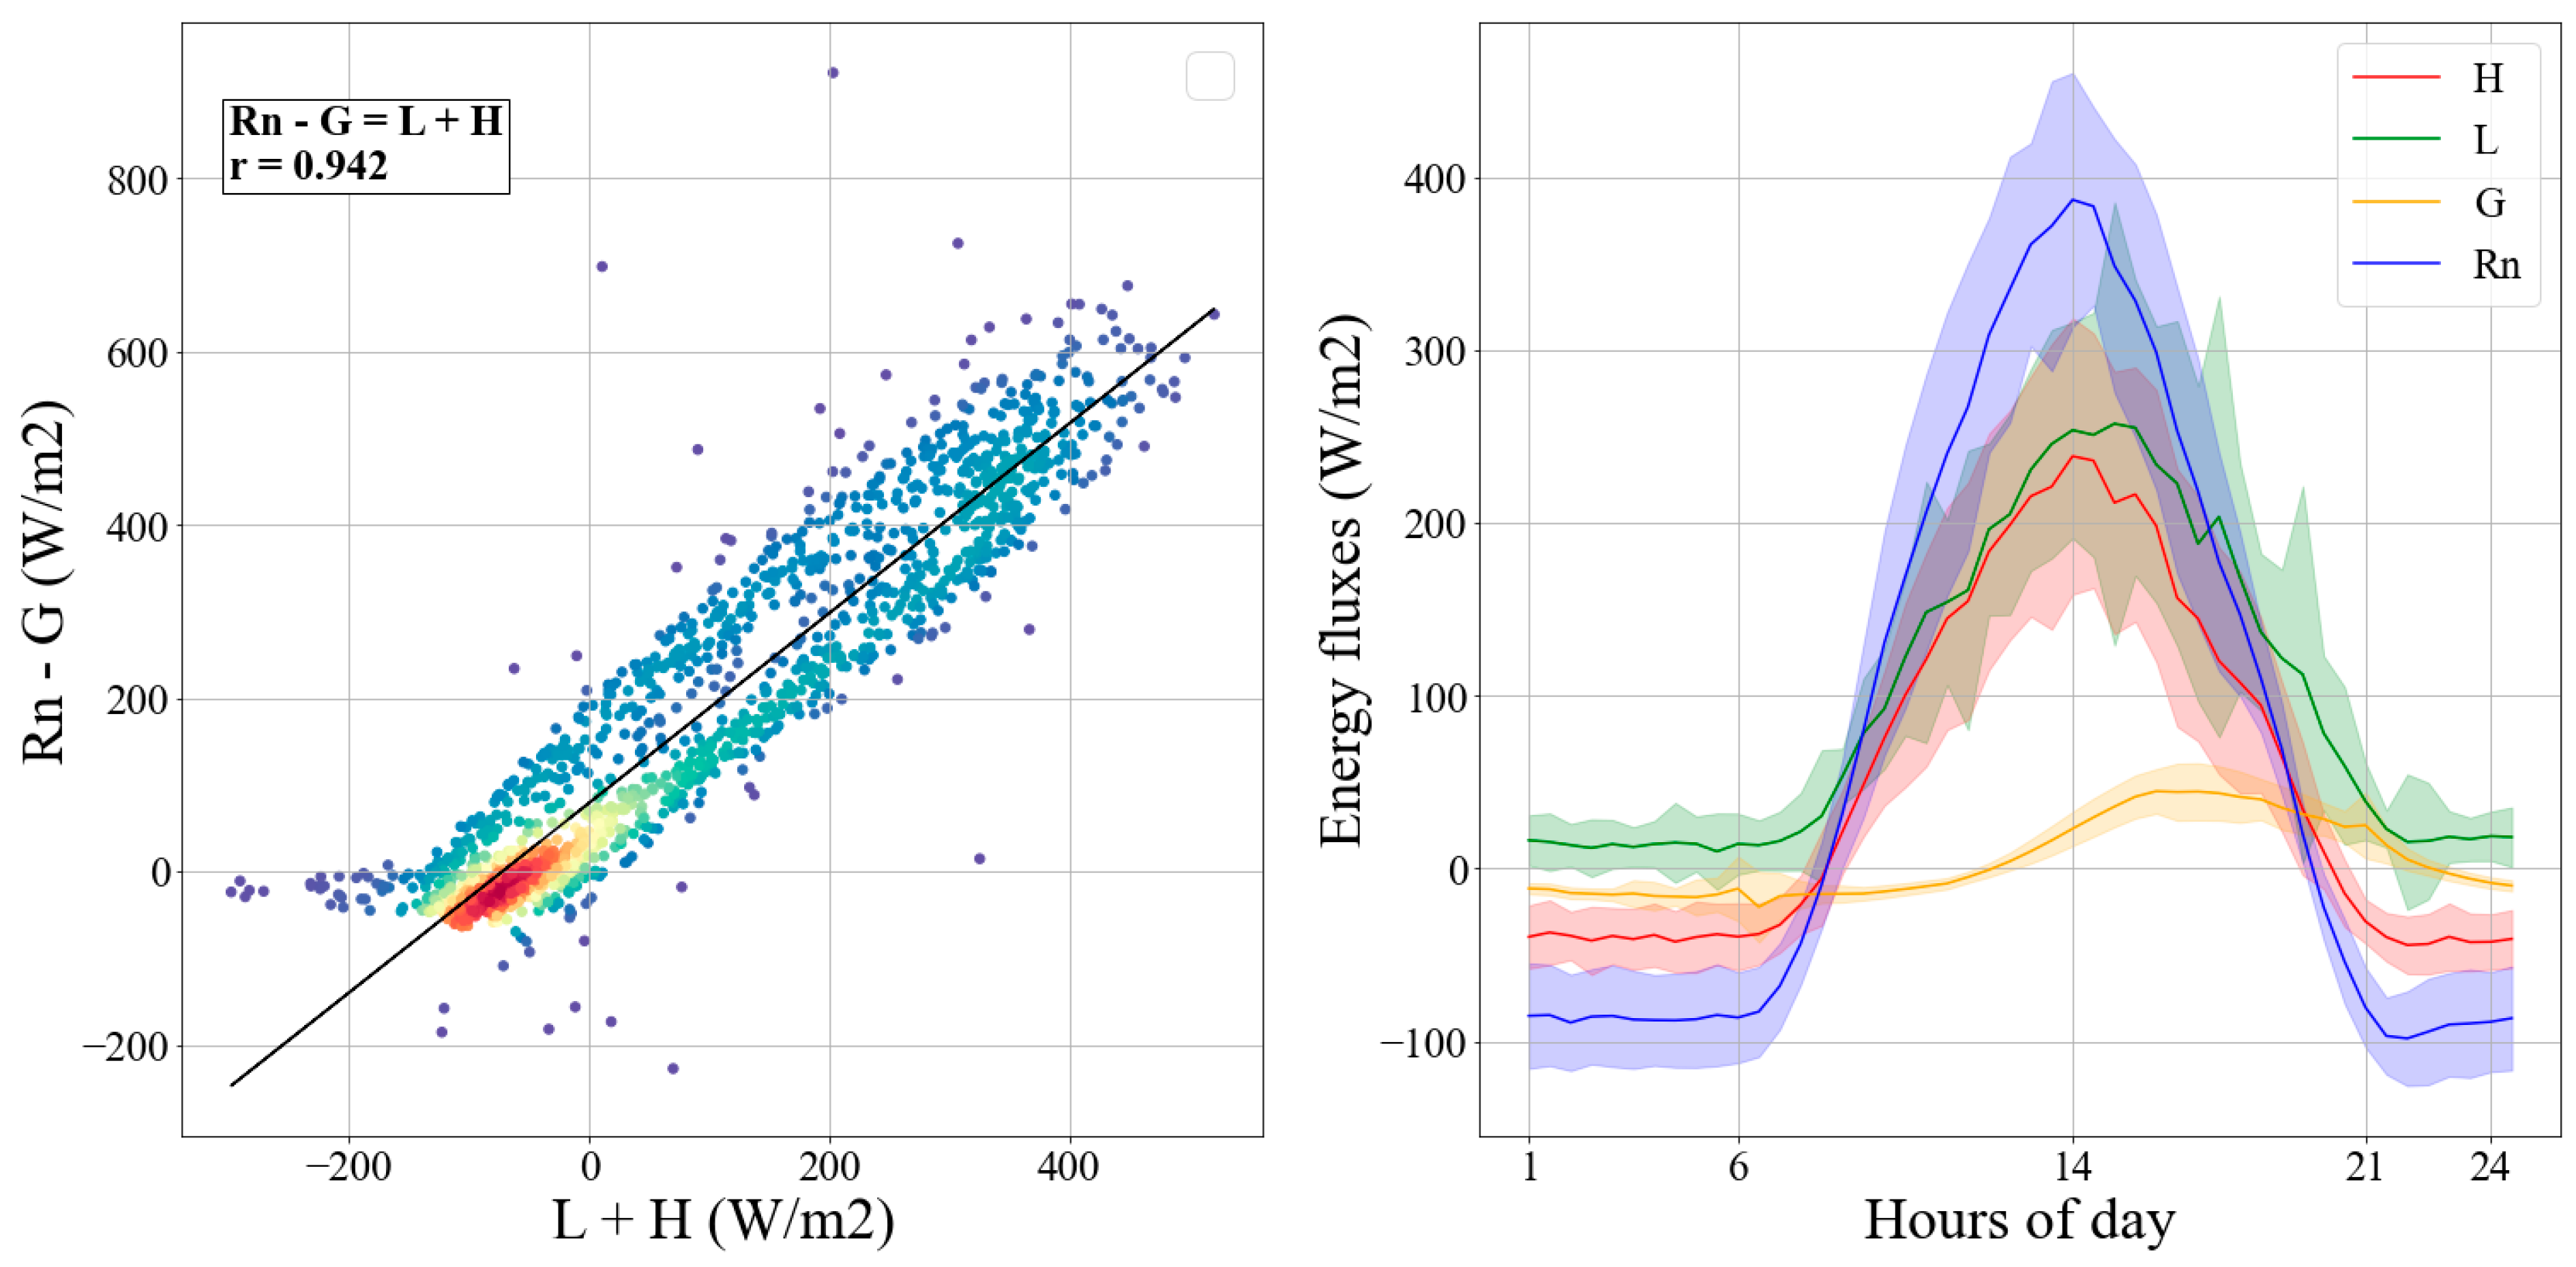
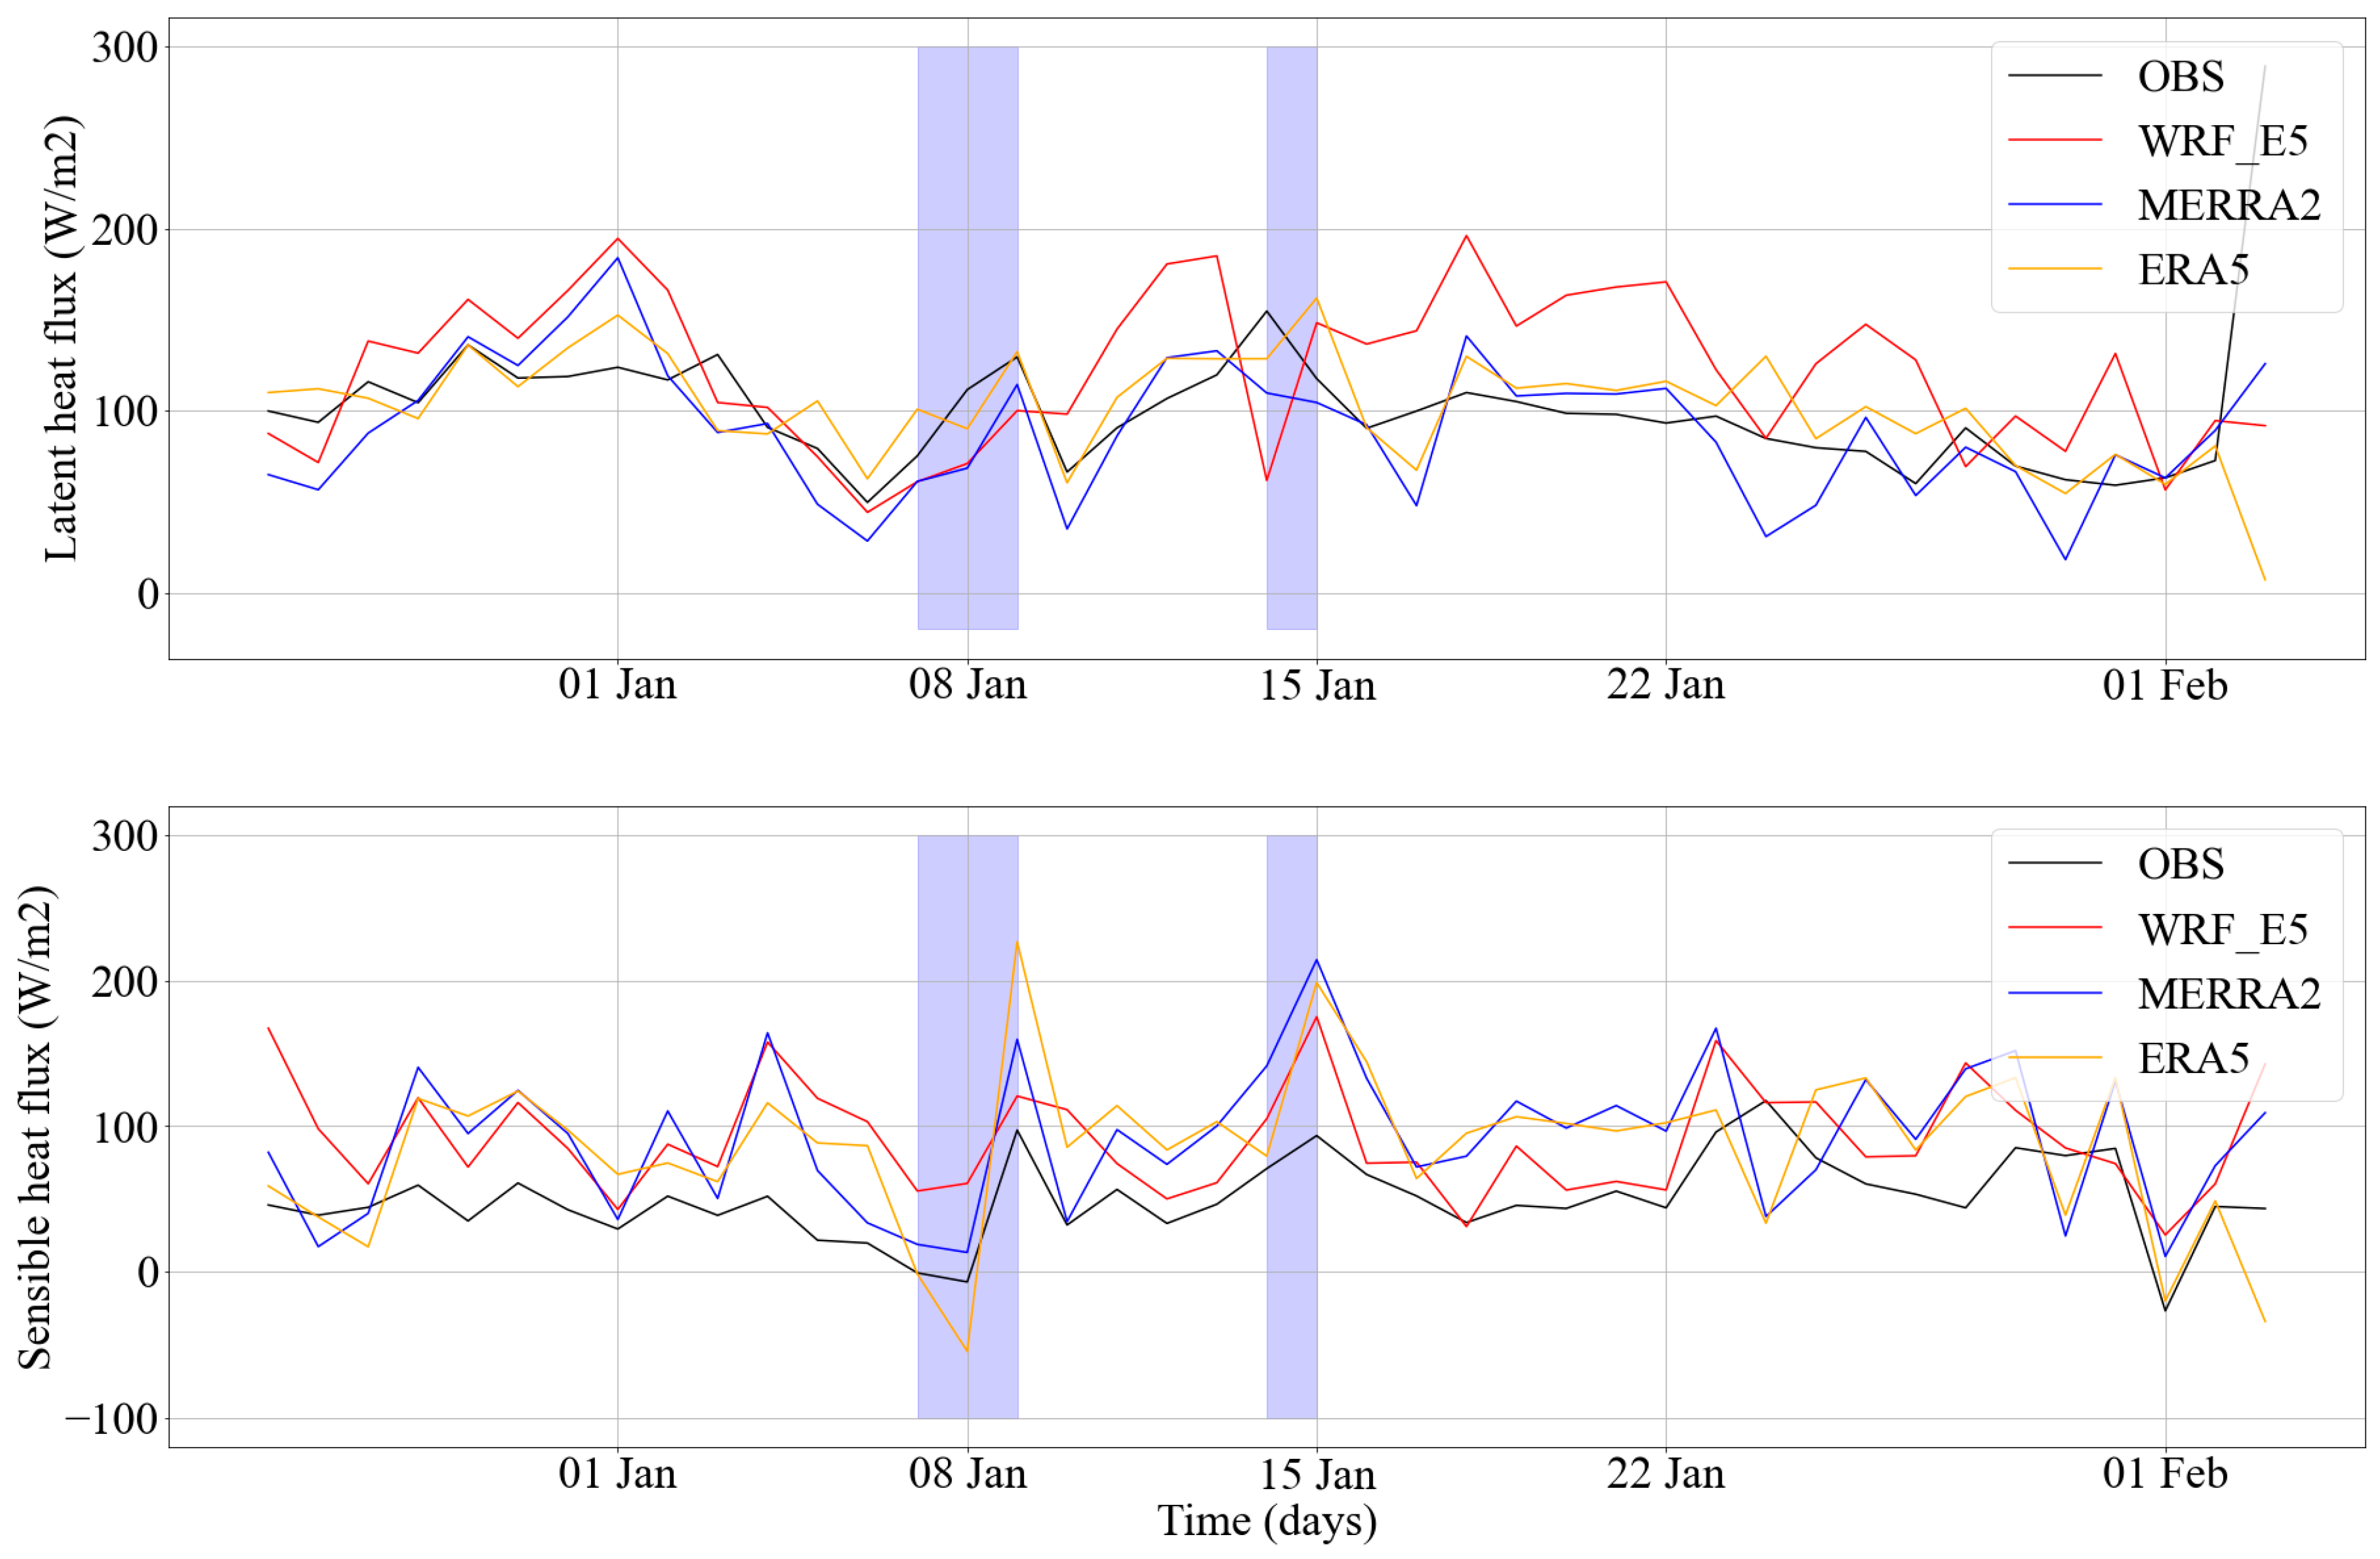
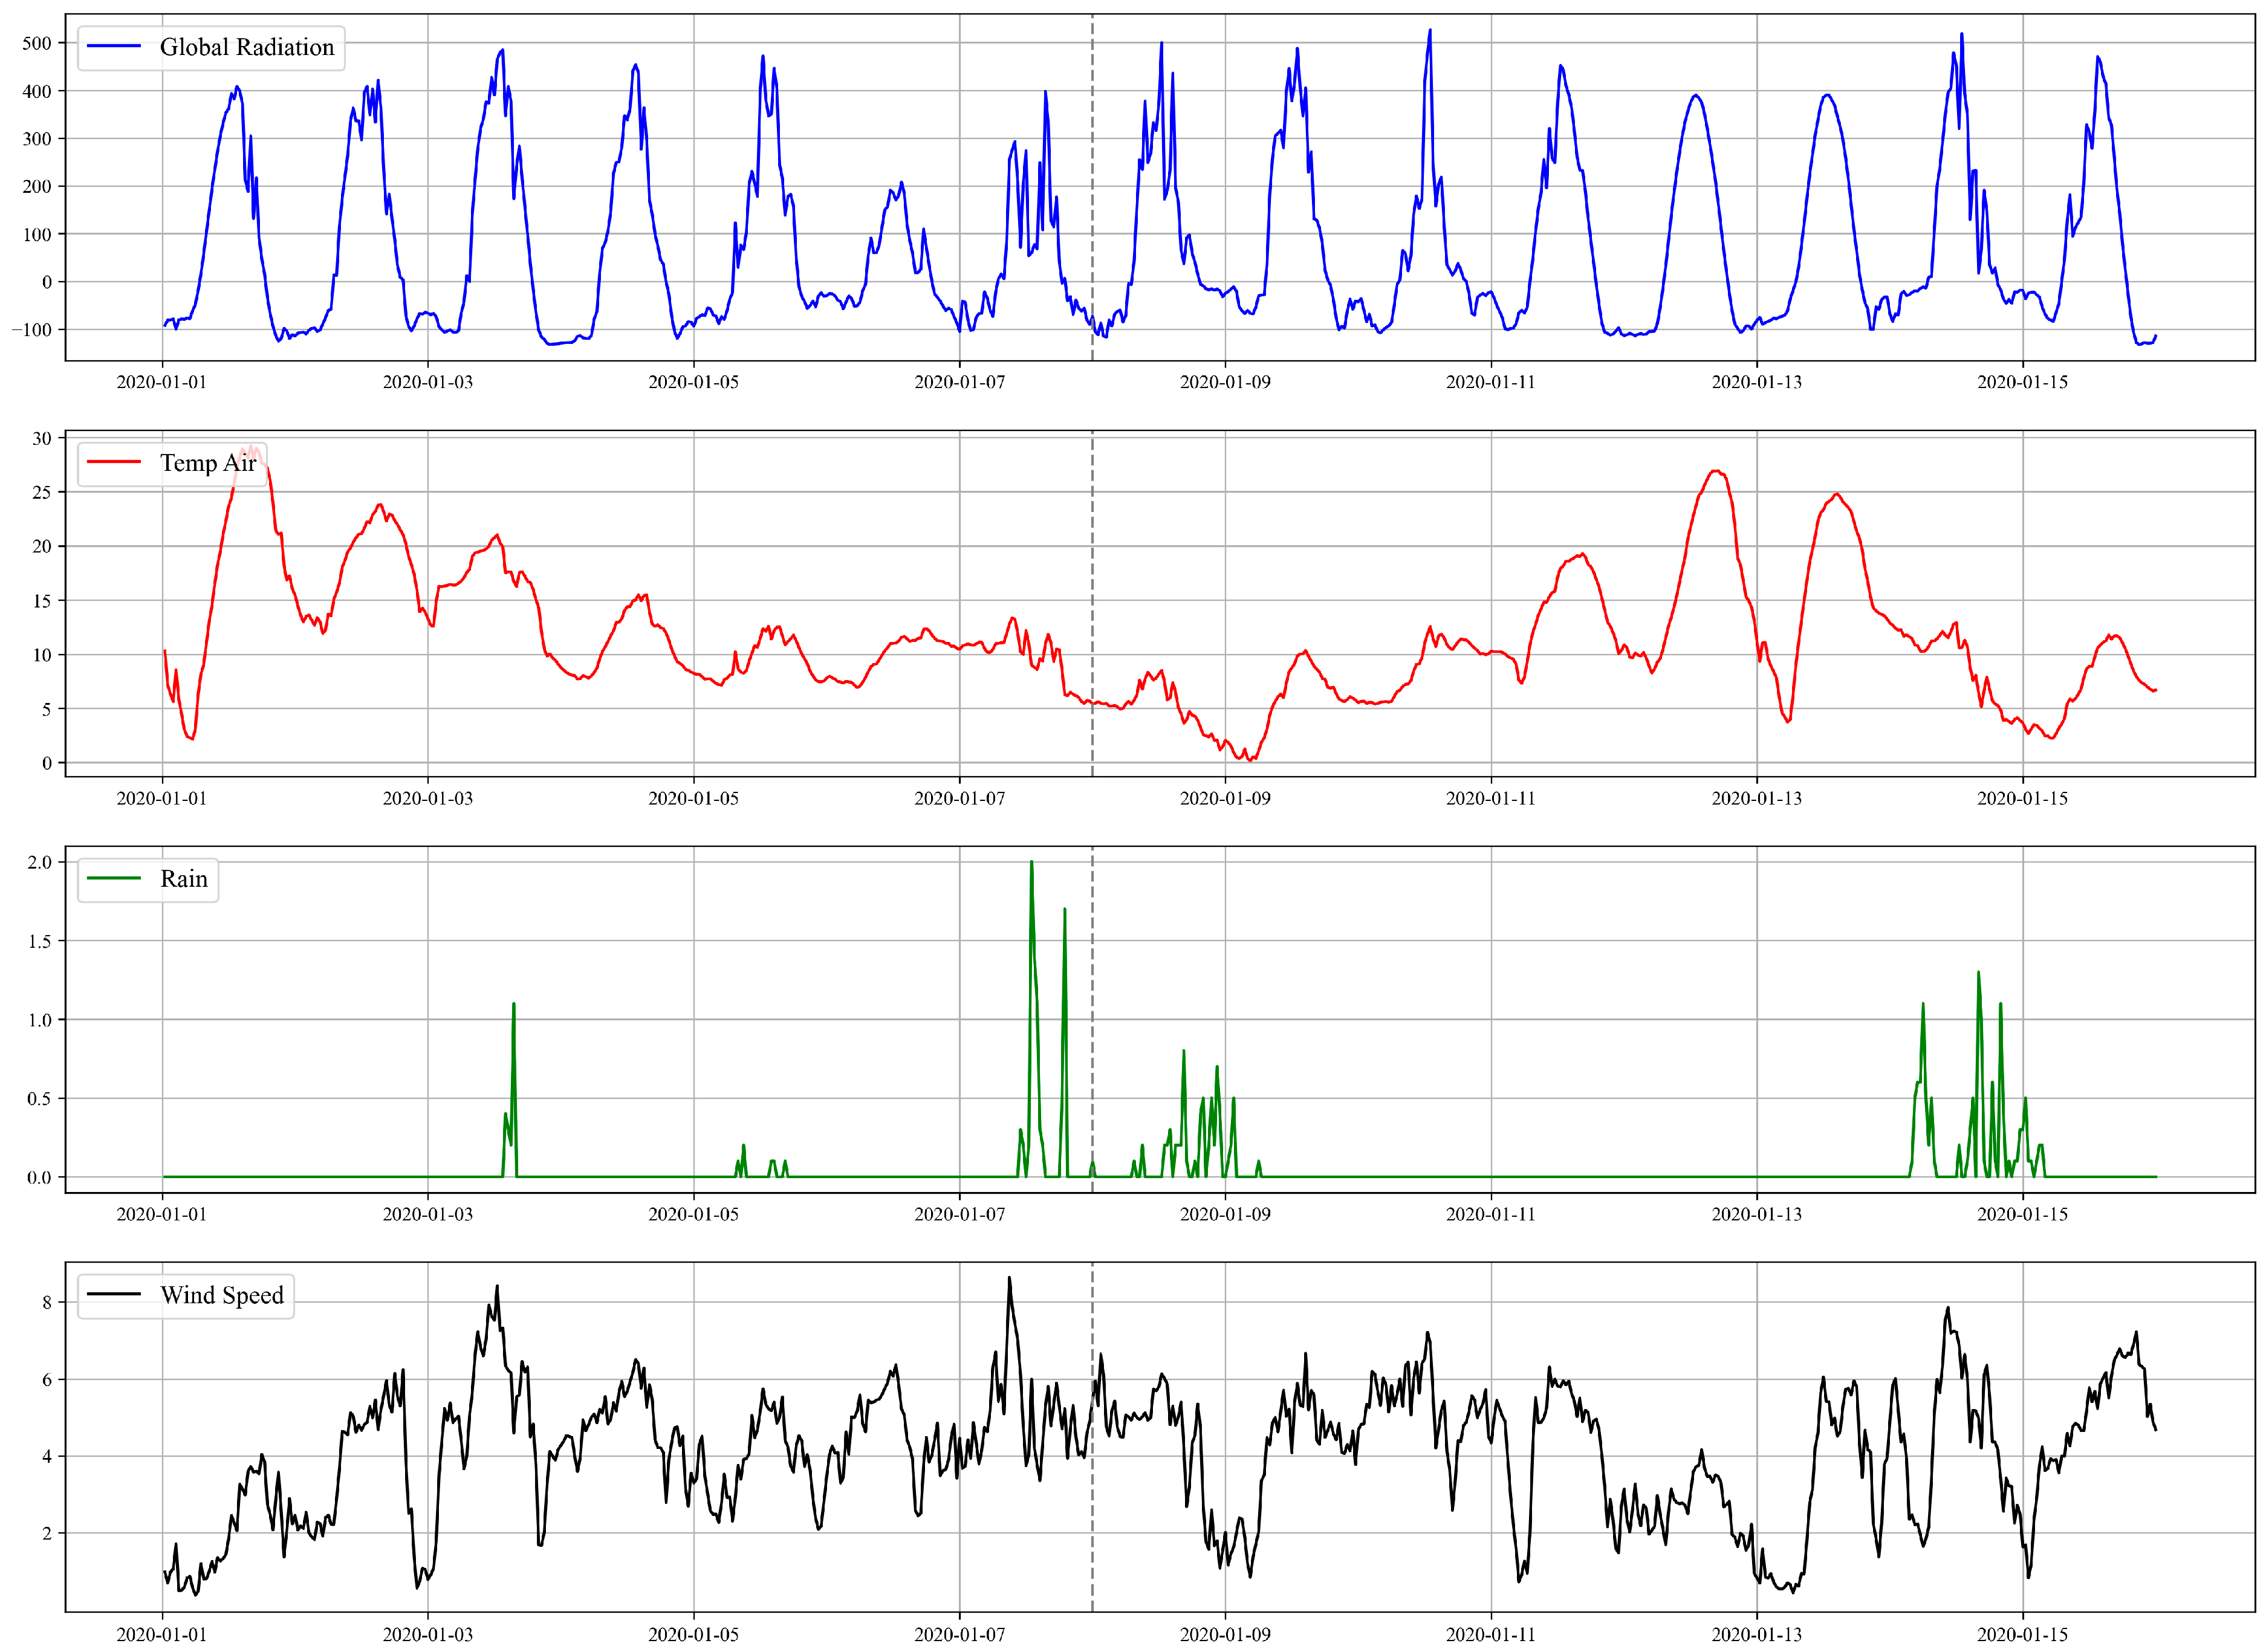
4.3. Comparison of Heat Fluxes at Ñirehuao Station across Different Data Sets
5. Discussion
6. Conclusions
Author Contributions
Funding
Institutional Review Board Statement
Informed Consent Statement
Data Availability Statement
Acknowledgments
Powered@NLHPC
Conflicts of Interest
Abbreviations
| EC | Eddy Covariance |
| GFS | Global Forecast System |
| GLDS | Global Land Data Assimilation System |
| LSM | Land surface model |
| LWR | Longwave radiation |
| NWP | Numerical weather prediction |
| PBL | Planetary boundary layer |
| SL | Surface layer |
| SWR | Shortwave radiation |
| WRF | Weather Research and Forecasting |
| WP | Western Patagonia |
Appendix A


References
- Martínez-Harms, M.J.; Gajardo, R. Ecosystem value in the Western Patagonia projected areas. J. Nat. Conserv. 2008, 16, 72–87. [Google Scholar] [CrossRef]
- Olivera-Guerra, L.; Quintanilla, M.; Moletto-Lobos, I.; Pichuante, E.; Zamorano-Elgueta, C.; Mattar, C. Water dynamics over a Western Patagonian watershed: Land surface changes and human factors. Sci. Total Environ. 2022, 804, 150221. [Google Scholar] [CrossRef] [PubMed]
- Pérez, T.; Mattar, C.; Fuster, R. Decrease in Snow Cover over the Aysén River Catchment in Patagonia, Chile. Water 2018, 10, 619. [Google Scholar] [CrossRef]
- Olivares-Contreras, V.; Mattar, C.; Gutiérrez, A.; Jiménez, J. Warming trends in Patagonian subantartic forest. Int. J. Appl. Earth Obs. Geoinf. 2019, 76, 51–65. [Google Scholar] [CrossRef]
- Mattar, C.; Borvarán, D. Off-shore wind power simulation by using WRF in the central coast of Chile. Renew. Energy 2016, 94, 22–31. [Google Scholar] [CrossRef]
- Muñoz, R.C.; Falvey, M.J.; Arancibia, M.; Astudillo, V.I.; Elgueta, J.; Ibarra, M.; Santana, C.; Vásquez, C. Wind Energy Exploration over the Atacama Desert: A Numerical Model–Guided Observational Program. Bull. Am. Meteorol. Soc. 2018, 99, 2079–2092. [Google Scholar] [CrossRef]
- De Linaje, N.G.-A.; Mattar, C.; Borvarán, D. Quantifying the wind energy potential differences using different WRF initial conditions on Mediterranean coast of Chile. Energy 2019, 188, 116027. [Google Scholar] [CrossRef]
- Brune, S.; Keller, J.D.; Wahl, S. Evaluation of wind speed estimates in reanalyses for wind energy applications. Adv. Sci. Res. 2021, 18, 115–126. [Google Scholar] [CrossRef]
- Hasager, C.B.; Hahmann, A.N.; Ahsbahs, T.; Karagali, I.; Sile, T.; Badger, M.; Mann, J. Europe’s offshore winds assessed with synthetic aperture radar, ASCAT and WRF. Wind Energy Sci. 2020, 5, 375–390. [Google Scholar] [CrossRef]
- Dörenkämper, M.; Olsen, B.T.; Witha, B.; Hahmann, A.N.; Davis, N.N.; Barcons, J.; Ezber, Y.; García-Bustamante, E.; González-Rouco, J.F.; Navarro, J.; et al. The Making of the New European Wind Atlas—Part 2: Production and evaluation. Geosci. Model Dev. 2020, 13, 5079–5102. [Google Scholar] [CrossRef]
- Li, H.; Claremar, B.; Wu, L.; Hallgren, C.; Körnich, H.; Ivanell, S.; Sahlée, E. A sensitivity study of the WRF model in offshore wind modeling over the Baltic Sea. Geosci. Front. 2021, 12, 101229. [Google Scholar] [CrossRef]
- Gualtieri, G. Reliability of ERA5 Reanalysis Data for Wind Resource Assessment: A Comparison against Tall Towers. Energies 2021, 14, 4169. [Google Scholar] [CrossRef]
- Olauson, J. ERA5: The new champion of wind power modelling? Renew Energy 2018, 126, 322–331. [Google Scholar] [CrossRef]
- Dorrego Portela, J.R.; Hernández Galvez, G.; Hernandez-Escobedo, Q.; Saldaña Flores, R.; Sarracino Martínez, O.; Lastres Danguillecourt, O.; López de Paz, P.; Perea-Moreno, A.-J. Microscale Wind Assessment, Comparing Mesoscale Information and Observed Wind Data. Sustainability 2022, 14, 11991. [Google Scholar] [CrossRef]
- Carvalho, D. An Assessment of NASA’s GMAO MERRA-2 Reanalysis Surface Winds. J. Clim. 2019, 32, 8261–8281. [Google Scholar] [CrossRef]
- Carvalho, D.; Rocha, A.; Gómez Gesteira, M.; Santos, C.S. WRF wind simulation and wind energy production estimates forced by different reanalyses: Comparison with observed data for Portugal. Appl. Energy 2014, 117, 116–126. [Google Scholar] [CrossRef]
- Staffell, I.; Pfenninger, S. Using bias-corrected reanalysis to simulate current and future wind power output. Energy 2016, 114, 1224–1239. [Google Scholar] [CrossRef]
- Zhou, Y.; Mu, Z. Impact of Different Reanalysis Data and Parameterization Schemes on WRF Dynamic Downscaling in the Ili Region. Water 2018, 10, 1729. [Google Scholar] [CrossRef]
- Tavares, L.F.D.A.; Shadman, M.; Assad, L.P.D.F.; Estefen, S.F. Influence of the WRF model and atmospheric reanalysis on the offshore wind resource potential and cost estimation: A case study for Rio de Janeiro State. Energy 2021, 240, 122767. [Google Scholar] [CrossRef]
- Gómez-Fontealba, C.; Flores-Aqueveque, V.; Alfaro, S.C. Variability of the Southwestern Patagonia (51°S) Winds in the Recent (1980–2020) Period: Implications for Past Wind Reconstructions. Atmosphere 2022, 13, 206. [Google Scholar] [CrossRef]
- Skamarock, W.C.; Klemp, J.B.; Dudhia, J.; Gill, D.O.; Barker, D.M.; Duda, M.G.; Huang, X.-Y.; Wang, W.; Powers, J.G. A Description of the Advanced Research WRF Version 3; NCAR Technical: Boulder, CO, USA, 2008; p. 113. [Google Scholar] [CrossRef]
- Hahmann, A.N.; Sīle, T.; Witha, B.; Davis, N.N.; Dörenkämper, M.; Ezber, Y.; García-Bustamante, E.; González-Rouco, J.F.; Navarro, J.; Olsen, B.T.; et al. The making of the New European Wind Atlas—Part 1: Model sensitivity. Geosci. Model Dev. 2020, 13, 5053–5078. [Google Scholar] [CrossRef]
- Hahmann, A.N.; Lennard, C.; Badger, J.; Vincent, C.L.; Kelly, M.C.; Volker, P.J.; Argent, B.; Refslund, J. Mesoscale modeling for the Wind Atlas of South Africa (WASA) project. DTU Wind Energy 2015, 50, 80. [Google Scholar]
- Peleg, S.; Werman, M.; Rom, H. A unified approach to the change of resolution: Space and gray-level. IEEE Trans. Pattern Anal. Mach. Intell. 1989, 11, 739–742. [Google Scholar] [CrossRef]
- Optis, M.; Bodini, N.; Debnath, M.; Doubrawa, P. Best Practices for the Validation of U.S. Offshore Wind Resource Models; NREL/TP-5000-78375; National Renewable Energy Laboratory: Golden, CO, USA, 2020. [Google Scholar]
- Garreaud, R.; Lopez, P.; Minvielle, M.; Rojas, M. Large Scale Control on the Patagonian Climate. J. Clim. 2013, 26, 215–230. [Google Scholar] [CrossRef]
- Jourdier, B. Evaluation of ERA5, MERRA-2, COSMO-REA6, NEWA and AROME to simulate wind power production over France. Adv. Sci. Res. 2020, 17, 63–77. [Google Scholar] [CrossRef]
- Thomas SH, L.; Nicolau, S.; Martinez-Alvarado, O.; Drew, D.S.; Bloomfield, H. How well do atmospheric reanalyses reproduce observed winds in coastal regions of Mexico? Meteorol. Appl. 2021, 28, e2023. [Google Scholar] [CrossRef]
- Urraca, R.; Huld, T.; Gracia-Amillo, A.; Martinez-De-Pison, F.J.; Kaspar, F.; Sanz-Garcia, A. Evaluation of global horizontal irradiance estimates from ERA5 and COSMO-REA6 reanalyses using ground and satellite-based data. Sol. Energy 2018, 164, 339–354. [Google Scholar] [CrossRef]
- Dörenkämper, M.; Optis, M.; Monahan, A.; Steinfeld, G.; Doerenkaemper, M. On the Offshore Advection of Boundary-Layer Structures and the Influence on Offshore Wind Conditions. Bound.-Layer Meteorol. 2015, 155, 459–482. [Google Scholar] [CrossRef]
- Lydia, M.; Kumar, S.S.; Selvakumar, A.I.; Kumar, G.E.P. Wind resource estimation using wind speed and power curve models. Renew. Energy 2015, 83, 425–434. [Google Scholar] [CrossRef]
- Gualtieri, G. Improving investigation of wind turbine optimal site matching through the self-organizing maps. Energy Convers. Manag. 2017, 143, 295–311. [Google Scholar] [CrossRef]
- Soares, P.; Lima DC, A.; Cardoso, R.M.; Nascimento, M.L.; Semedo, A. Western Iberian offshore wind resources: More or less in a global warming climate? Appl. Energy 2017, 203, 72–90. [Google Scholar] [CrossRef]
- Golzio, A.; Ferrarese, S.; Cassardo, C.; Diolaiuti, G.A.; Pelfini, M. Land-Use Improvements in the Weather Research and Forecasting Model over Complex Mountainous Terrain and Comparison of Different Grid Sizes. Bound.-Layer Meteorol. 2021, 180, 319–351. [Google Scholar] [CrossRef]
- Teklay, A.; Dile, Y.T.; Asfaw, D.H.; Bayabil, H.K.; Sisay, K. Impacts of Land Surface Model and Land Use Data on WRF Model Simulations of Rainfall and Temperature over Lake Tana Basin, Ethiopia. Heliyon 2019, 5, e02469. [Google Scholar] [CrossRef] [PubMed]


| Station Name | Altitude (m) | Height (m.a.g.l) | Start Date | End Date | Data Source | |
|---|---|---|---|---|---|---|
| Melinka repollal | 100 | 34.6 | 12 November 2010 | 2 December 2011 | Wind explorer | |
| Puesto viejo | 850 | 20 | 25 February 2004 | 18 May 2005 | Wind explorer | |
| Islas las huichas | 101 | 20 | 22 June 2005 | 9 August 2006 | Wind explorer | |
| Ad. Melinka | 8 | 10 | 1 January 2014 | 1 January 2020 | Meteochile | |
| Ad. Puerto Aysén | 11 | 10 | 1 January 1960 | 1 January 2020 | Meteochile | |
| Ad. Teniente Vidal | 299 | 10 | 1 January 1946 | 1 January 2020 | Meteochile | |
| Cisnes Puyuhuapi | 11 | 10 | 1 January 2016 | 1 January 2020 | Meteochile | |
| Mirador Marchant | 480 | 10 | 11 January 2019 | 1 February 2020 | Meteochile | |
| Villa O’Higgins | 280 | 10 | 1 January 2013 | 1 January 2020 | Meteochile | |
| PFA (Fjord Aysen) | 5 | 2, 5, 10 | 11 January 2020 | 14 February 2020 | F. 1,181,155 | |
| Option | MERRA-2 | ERA-5 | WRF_E5 | RECON80-17 |
|---|---|---|---|---|
| Institution | NASA GMAO | ECMWF | - | MinEnergia |
| Model | GEOS v5.12.4 | IFS Cycle 41r2 | WRF v3.7.1 | Mathematical reconstruction |
| Spatial coverage | Global | Global | Western Patagonia | Chile |
| Boundary condition | - | - | ERA-5 | MERRA-2 |
| Data assimilation | 3D-Var | 4D-Var | Nudging | - |
| Horizontal grid spacing | 0.5° × 0.625° | 0.25° | 3 km | 1 km |
| Vertical wind speed heights (m) | 10, 50 | 10, 100 | 10 | 5.5–180 |
| Time coverage | 1980–present | 1979–present | 1980–2020 | 1980–2017 |
| Time resolution | 1 h | 1 h | 1 h | 1 h |
| Parameterization | Option |
|---|---|
| PBL | MYNN 2.5 |
| SL | MYNN |
| LSM | Noah–LSM |
| Microphysics | WSM 5 |
| Cumulus | Kain-Fritsch |
| LWR | RRTMG |
| SWR | Dudhia |
| Measurement Sites | Data | RMSE m s−1 | EMD m s−1 |
|---|---|---|---|
| PFA | WRF_E5 | 2.6 | 1.28 |
| ERA-5 | 4.8 | 3.60 | |
| MERRA-2 | 1.6 | 0.23 | |
| RECON80-17 | - | - | |
| Ad. Melinka | WRF_E5 | 2.3 | 0.64 |
| ERA-5 | 4.1 | 1.60 | |
| MERRA-2 | 3.2 | 1.52 | |
| RECON80-17 | - | - | |
| Mirador Marchant | WRF_E5 | 4.3 | 2.65 |
| ERA-5 | 4.7 | 1.02 | |
| MERRA-2 | 4.4 | 3.10 | |
| RECON80-17 | - | - | |
| Villa O’Higgins | WRF_E5 | 2.6 | 1.08 |
| ERA-5 | 4.82 | 3.27 | |
| MERRA-2 | 4.71 | 3,65 | |
| RECON80-17 | - | - | |
| Puerto Aysén | WRF_E5 | 2.1 | 0.62 |
| ERA-5 | 5.0 | 3.58 | |
| MERRA-2 | 1.8 | 0.53 | |
| RECON80-17 | - | - | |
| Cisnes Puyuhuapi | WRF_E5 | 2.2 | 0.78 |
| ERA-5 | 5.9 | 4.87 | |
| MERRA-2 | 1.7 | 0.82 | |
| RECON80-17 | - | - | |
| Ad. Teniente Vidal | WRF_E5 | 1.7 | 0.33 |
| ERA-5 | 4.8 | 3.60 | |
| MERRA-2 | 2.1 | 1.14 | |
| RECON80-17 | - | - | |
| Islas las Huichas | WRF_E5 | 4.8 | 1.91 |
| ERA-5 | 4.4 | 1.89 | |
| MERRA-2 | 4.5 | 2.19 | |
| RECON80-17 | 4.5 | 1.21 | |
| Melinka Repollal | WRF_E5 | 3.3 | 2.49 |
| ERA-5 | 4.3 | 3.45 | |
| MERRA-2 | 2.4 | 0.31 | |
| RECON80-17 | 2.1 | 1.16 | |
| Puesto Viejo | WRF_E5 | 3.1 | 0.86 |
| ERA-5 | 4.1 | 2.23 | |
| MERRA-2 | 3.6 | 0.71 | |
| RECON80-17 | 3.1 | 0.46 |
Disclaimer/Publisher’s Note: The statements, opinions and data contained in all publications are solely those of the individual author(s) and contributor(s) and not of MDPI and/or the editor(s). MDPI and/or the editor(s) disclaim responsibility for any injury to people or property resulting from any ideas, methods, instructions or products referred to in the content. |
© 2023 by the authors. Licensee MDPI, Basel, Switzerland. This article is an open access article distributed under the terms and conditions of the Creative Commons Attribution (CC BY) license (https://creativecommons.org/licenses/by/4.0/).
Share and Cite
Vásquez Anacona, H.; Mattar, C.; G. Alonso-de-Linaje, N.; Sepúlveda, H.H.; Crisóstomo, J. Wind Simulations over Western Patagonia Using the Weather Research and Forecasting model and Reanalysis. Atmosphere 2023, 14, 1062. https://doi.org/10.3390/atmos14071062
Vásquez Anacona H, Mattar C, G. Alonso-de-Linaje N, Sepúlveda HH, Crisóstomo J. Wind Simulations over Western Patagonia Using the Weather Research and Forecasting model and Reanalysis. Atmosphere. 2023; 14(7):1062. https://doi.org/10.3390/atmos14071062
Chicago/Turabian StyleVásquez Anacona, Hugo, Cristian Mattar, Nicolás G. Alonso-de-Linaje, Héctor H. Sepúlveda, and Jessica Crisóstomo. 2023. "Wind Simulations over Western Patagonia Using the Weather Research and Forecasting model and Reanalysis" Atmosphere 14, no. 7: 1062. https://doi.org/10.3390/atmos14071062
APA StyleVásquez Anacona, H., Mattar, C., G. Alonso-de-Linaje, N., Sepúlveda, H. H., & Crisóstomo, J. (2023). Wind Simulations over Western Patagonia Using the Weather Research and Forecasting model and Reanalysis. Atmosphere, 14(7), 1062. https://doi.org/10.3390/atmos14071062