Article

Short-Term Exposure to PM10 and Black Carbon in Residential Microenvironments in Bragança, Portugal: A Case Study in Bedrooms, Living Rooms, and Kitchens

by
Yago Alonso Cipoli
1,2,3,*,
Carla Alexandra Gamelas
4,5,
Susana Marta Almeida
4,
Manuel Feliciano
2,3 and
Célia Alves
1,*
1
Centre for Environmental and Marine Studies (CESAM), Department of Environment, University of Aveiro, 3810-193 Aveiro, Portugal
2
Centro de Investigação de Montanha (CIMO), Instituto Politécnico de Bragança, 5300-253 Bragança, Portugal
3
Laboratório Associado para a Sustentabilidade e Tecnologia em Regiões de Montanha (SusTEC), Instituto Politécnico de Bragança, 5300-253 Bragança, Portugal
4
Centro de Ciências e Tecnologias Nucleares, Instituto Superior Técnico, Universidade de Lisboa, Estrada Nacional 10, 2695-066 Bobadela, Portugal
5
Instituto Politécnico de Setúbal, Escola Superior de Tecnologia de Setúbal, Centro de Investigação em Energia e Ambiente, IPS Campus, 2914-508 Setúbal, Portugal
*
Authors to whom correspondence should be addressed.
Atmosphere 2023, 14(7), 1064; https://doi.org/10.3390/atmos14071064
Submission received: 17 May 2023 / Revised: 16 June 2023 / Accepted: 21 June 2023 / Published: 23 June 2023
(This article belongs to the Special Issue Air Quality in Spain and the Iberian Peninsula)

Abstract

:
Several studies have evaluated PM concentrations in single specific microenvironments as a measure of exposure in the entire house. In this study, PM10 was monitored at the same time in three microenvironments (bedroom, living room, and kitchen) from three dwellings located in a small inland town of the Iberian Peninsula to assess whether exposure varies significantly between them. Real-time optical instruments and low-volume gravimetric samplers were employed. A multi-wavelength absorption instrument was used to determine black carbon (BC) concentrations on the filters. The Multiple-Path Particle Dosimetry Model (MPPD) was applied to evaluate the deposition of PM10 and BC in the airways of adults. For all dwellings, the highest PM10 concentrations were recorded in bedrooms (B1 = 22.7 µg m−3; B2 = 19.5 µg m−3; and B3 = 68.1 µg m−3). Houses 1 and 3 did not show significant differences between microenvironments. This did not happen in house 2, suggesting that ventilation is a determining factor for concentrations. BC originated mainly from fossil fuel emissions (90%), while biomass burning represented a minor contribution (10%). MPPD showed that PM10 is predominantly deposited in the head region (≥85% of the total dose), while BC is mainly deposited in the pulmonary region (14%). Higher doses were estimated for males than for females.

1. Introduction

Air pollution has become a growing public health concern, especially in indoor environments, where people spend most of their time [1,2,3]. Scientific evidence has shown that inhalation of polluted air is associated with increased mortality and morbidity rates [4,5], reduced lung function [6,7], worsening of cardiorespiratory diseases [8,9], and cancer [10], even at low doses and short-term exposures. The World Health Organization (WHO) has estimated that a total of 3.2 million deaths per year worldwide are attributable to exposure to particulate matter (PM) in domestic environments [11]. PM is classified as a group 1 carcinogen and ranks fifth on the list of global death factors [12,13]. PM is a complex mixture of solid and liquid particles suspended in the air, varying in shape, aerodynamic diameter, and chemical composition, depending on the sources or formation processes [14].
The assessment and management of outdoor air quality are well-documented, with legally stipulated limit values in European countries. However, indoor air quality is regulated only in some countries (e.g., Portugal, Finland, Slovenia, and Lithuania). Rapid urbanisation contributes to changes in the lifestyle and habits of the population, with residents spending more than 90% of their time indoors, most of which is in homes [15]. Furthermore, indoor PM concentrations and chemical composition can be very distinct from those observed outdoors [16,17,18], with higher levels of PM and specific elements reported for indoor environments [19]. Thus, it is equally or even more important to assess PM inhalation and deposition in the human respiratory tract in these environments. In general, indoor PM concentrations are influenced by human activities, including emission sources such as cooking [20], smoking [21], heating systems [22], and particle resuspension [23], as well as residential characteristics, such as distance from external sources, orientation and layout, ventilation rates, air infiltration, and building materials [24,25,26].
Several studies have documented PM concentrations in specific microenvironments in dwellings, including living rooms, bedrooms, and kitchens [27,28,29,30,31,32]. Due to the noise generated by gravimetric instruments, few studies have evaluated these microenvironments simultaneously using reference methods. In general, the characterisation of dwellings is based on a single microenvironment using low-cost and/or photometric devices, which generate less discomfort for residents. However, the unavailability of a reference method simultaneous with other devices makes data interpretation difficult, since the aerosol composition can be different for each microenvironment. Thus, the present study focuses on monitoring PM10 concentrations in three different microenvironments (bedroom, living room, and kitchen) simultaneously, using optical and gravimetric equipment, to assess whether concentrations measured in one room are representative of exposures in other spaces of the house. In addition, Multiple-Path Particle Dosimetry (MPPD) was applied to evaluate the PM10 and BC deposition in the human respiratory tract for each microenvironment. The study can provide important information for directing future research in indoor microenvironments in dwellings and human health assessments.

2. Materials and Methods

2.1. Monitoring Sites

An indoor monitoring campaign in specific microenvironments (bedroom—B, living room—LR, and kitchen—K) was conducted in three naturally ventilated dwellings (Figure 1) in the city of Bragança. With a population of about 35,000 inhabitants [33], Bragança is located in the northeast of Portugal in a mountainous region (alt. 690 m), with a temperate climate (Csa) according the Köppen–Geiger classification [34]. The climate of the region is characterised by high thermal amplitude, with dry and hot summers and frequent rains in winter [35].
Given the annoying noise of the equipment, especially in the bedroom, the three target homes were selected from among the few residents who volunteered to participate in the study. The different configurations of each microenvironment are described in Table 1.
The selected houses were occupied by non-smoker students aged between 25–30 years. Students in Bragança represent 1/3 of the total population. During the sampling campaign, a logbook was left in each microenvironment so that the occupants of the residence could opportunely write down the activities developed there. Volunteers were requested to carry out activities under normal conditions. It is worth mentioning that, even though no heating system was used during the monitoring period, house 1 has an open fireplace, which may affect the ventilation rates of this environment. None of the houses had open spaces, that is, all microenvironments were individual rooms, communicating with each other through hallways. The average distance between microenvironments was 7 m.

2.2. Experimental Setup

Sample collection of PM10 took place over 3 weeks in the 2022 spring, from the end of May to mid-June, covering one week in each dwelling. Continuous monitoring of PM10 was performed with photometric instruments (DustTrak, DRX 8533 and Optical Particle Size, OPS 3330, both instruments from TSI Inc., Shoreview, MN, USA). Measurements of CO2 were carried out with WolfSense probes (Gray Wolf®, Roswell, GA, USA, IQ-610). The real-time monitors were operated with a sampling rate of 1 min and were previously calibrated by the manufacturers before the monitoring campaign. In addition, before moving to the next house, the inlet was cleaned, the impactors greased, and the zero check was performed with a high-efficiency particulate air (HEPA) filter. Simultaneously, the gravimetric collection of PM10 took place for 24 h and was performed by low-volume samplers (Echo Tecora, Italy and Leckel LVS6, Germany) at a constant flow rate of 2.3 m3 h−1, equipped with 47 mm pre-weighed PTFE filters (Pall).
The instrumentation set consisted of one photometric and gravimetric instrument and a CO2 monitor for each microenvironment, following the same configuration in each dwelling: bedroom—OPS, Tecora, and WolfSense; living room—DustTrak, Leckel, and WolfSense; and kitchen—DustTrak, Leckel, and WolfSense. CO2 was used to calculate the air change rate. In all microenvironments, the samplers were positioned at a minimum distance of 1 m from the walls and at 1.5 m height, which corresponds approximately to the breathing zone.

2.3. Data Quality Assurance

Photometric instruments can provide a high spatiotemporal resolution capable of reporting PM in real time [36,37,38]. However, these instruments can suffer deviations due to different responses in the measurement of various types of aerosols [39,40]. The calibration process is essential to ensure accurate measurements under the prevailing ambient conditions. Tecora and Leckel samplers are certified by the European Committee for Standardisation as reference instruments for PM10 measurements according to EN 14907. In situ comparisons between photometric and gravimetric instruments showed a good reproducibility for 24 h measurements for each microenvironment: bedroom (r2 = 0.82–0.92; slope between 0.8 and 1.1 and y-offset between −5.5 and 3); living room (r2 = 0.84–0.99; slope between 0.7 and 2 and y-offset between −0.21 and −0.04); and kitchen (r2 = 0.83–0.91; slope between 1.6 and 2.6 and y-offset between −4.1 and 1.8). Therefore, PM10 hourly concentrations of DustTrak and OPS instruments were rectified using the equations (Figure S1, Supplementary Material) obtained from the intercomparison with the reference method. The values found are in agreement with previous studies, in which it was observed that the OPS (factory calibrated with density of 1 g cm−3) generally underestimates the concentrations in relation to the gravimetric method [41], while DustTraks (factory calibrated with Arizona Road Dust with a density of 2.65 g cm−3) overestimate by 1.94–2.57 times filter-based concentrations [39,42,43].

2.4. Air Change Rate

To characterise the ventilation in the microenvironments, air changes per hour (ACH, h−1) were calculated using the CO2 decay method. Decay or step-down methods can be used when a space is vacated after occupancy. ACH is typically estimated by analysing how quickly CO2 concentrations decrease in a room after the source has been stopped. More details can be found in Hänninen [44] and elsewhere. Previous studies applied the same methodology in different microenvironments, such as educational buildings [45], classrooms [46], and a university cafeteria [47].

2.5. Black Carbon Analyses

All PM10 samples obtained from gravimetric measurements were analysed by a Multi-wavelength Absorption Black Carbon Instrument (MABI, Ansto) to determine the BC concentrations in the filters. The light absorption was measured through unexposed filters (Io) and exposed filters (I) at seven wavelengths (405 nm, 465 nm, 525 nm, 639 nm, 870 nm, 940 nm, and 1050 nm), and the BC mass concentrations were determined for each wavelength following Equation (1):
B C μ g   m 3 = 10 2 . A ε . V . ln I o I = b a b s ε
The mass absorption coefficient (ε) for each wavelength (Table S1, Supplementary Material) was estimated using the central wavelength (λ = 639 nm) as a reference with a value of ε = 6.036 m2 g−1, which was recommended for 47 mm Teflon filters by ANSTO [48] and Ryś et al. [49]. BC from different sources can vary in light-absorbing ability. Concentration from biomass burning is mainly associated with the lowest wavelength (405 nm), while fossil fuel emissions are related to the highest wavelength (1050 nm) [49,50]. This allows for differentiation of biomass burning contributions by subtracting BC405 nm–BC1050 nm concentrations.

2.6. Deposition Dose and Dosimetry in the Human Respiratory Tract

PM10 and BC depositions in the human respiratory tract (HRT) were calculated using the Multiple-Path Particle Dosimetry model (MPPD, v 3.04). The model can provide the total and regional deposition fractions (DFs) in the HRT, namely on head (H), tracheobronchial (TB), and pulmonary (P) regions [51]. DF refers to the proportion of size-segregated particles that deposit in a specific region compared to the total mass of particles of the same size that initially enter in the HRT [52]. A constant exposure scenario considering a light activity (e.g., sitting) was set for adult males and females (25–30 years old). The physiological parameters used in the model were obtained from the International Commission on Radiological Protection (ICRP) [53], and these are given in Table 2. The Yeh-Schum 5-Lobe model was adopted, representing an asymmetric human lung with multiple paths [54].
The model default particle density (1 g cm−3) and a shape factor value of 1 were assumed to run the model. PM10 mass median diameter (MMAD) and geometric standard deviation (GSD) were calculated for each dwelling using the size-segregated data obtained from the OPS (16 channels in the range from 0.3 to 10 µm). MMAD and GSD values for BC were taken as 0.3 µm and 2.92, respectively, based on the study by Hitzenberger et al. [55]. The PM10 and BC total and regional doses were estimated using Equation (2) [56]:
D o s e μ g   m i n 1 = C × D F × V E
where C is the mean concentration of PM10 or BC (μg m−3) for each microenvironment, DF is the total or regional deposition fraction, and VE is the ventilation per minute (m3 min−1). The VE values were set to 0.009 m3 min−1 and 0.0065 m3 min−1 for short-term exposure of males and females, respectively [53].

2.7. Air Mass Trajectories

In the Iberian Peninsula, Saharan dust and wildfire smoke can contribute to increased PM concentrations [57,58,59,60]. To identify possible long-range transport events to the receptor sites, backward trajectories were calculated using the Hybrid Single-Particle Lagrangian Integrated Trajectory (HYSPLIT 4.0) model [61], combined with the location of fire foci (http://effis.jrc.ec.europa.eu/, accessed on 12 December 2022). In this study, 5-day backward trajectories were computed for the days with elevated concentrations (>90th percentile), using the Global Forecast System Reanalysis (0.25°, global) arriving at 1500 m above ground level. The 850 hPa pressure level (i.e., 1500 m) was selected as the characteristic height of the top of the transport layer, which is representative for this region [62].

2.8. Statistical Analyses

All descriptive statistics and tests were performed using SPSS software (IBM Statistics software v. 24) and MATLAB 2018a (The MathWorks Inc., Natick, MA, USA). PM10 and BC concentrations were tested for normality with the Shapiro–Wilk test. The Mann–Whitney test was used to evaluate the differences between microenvironments. Pearson’s correlations were employed to establish linear relationships between gravimetric and light-scattering measurements. A significance level of 5% was used for all tests (p < 0.05).

3. Results and Discussion

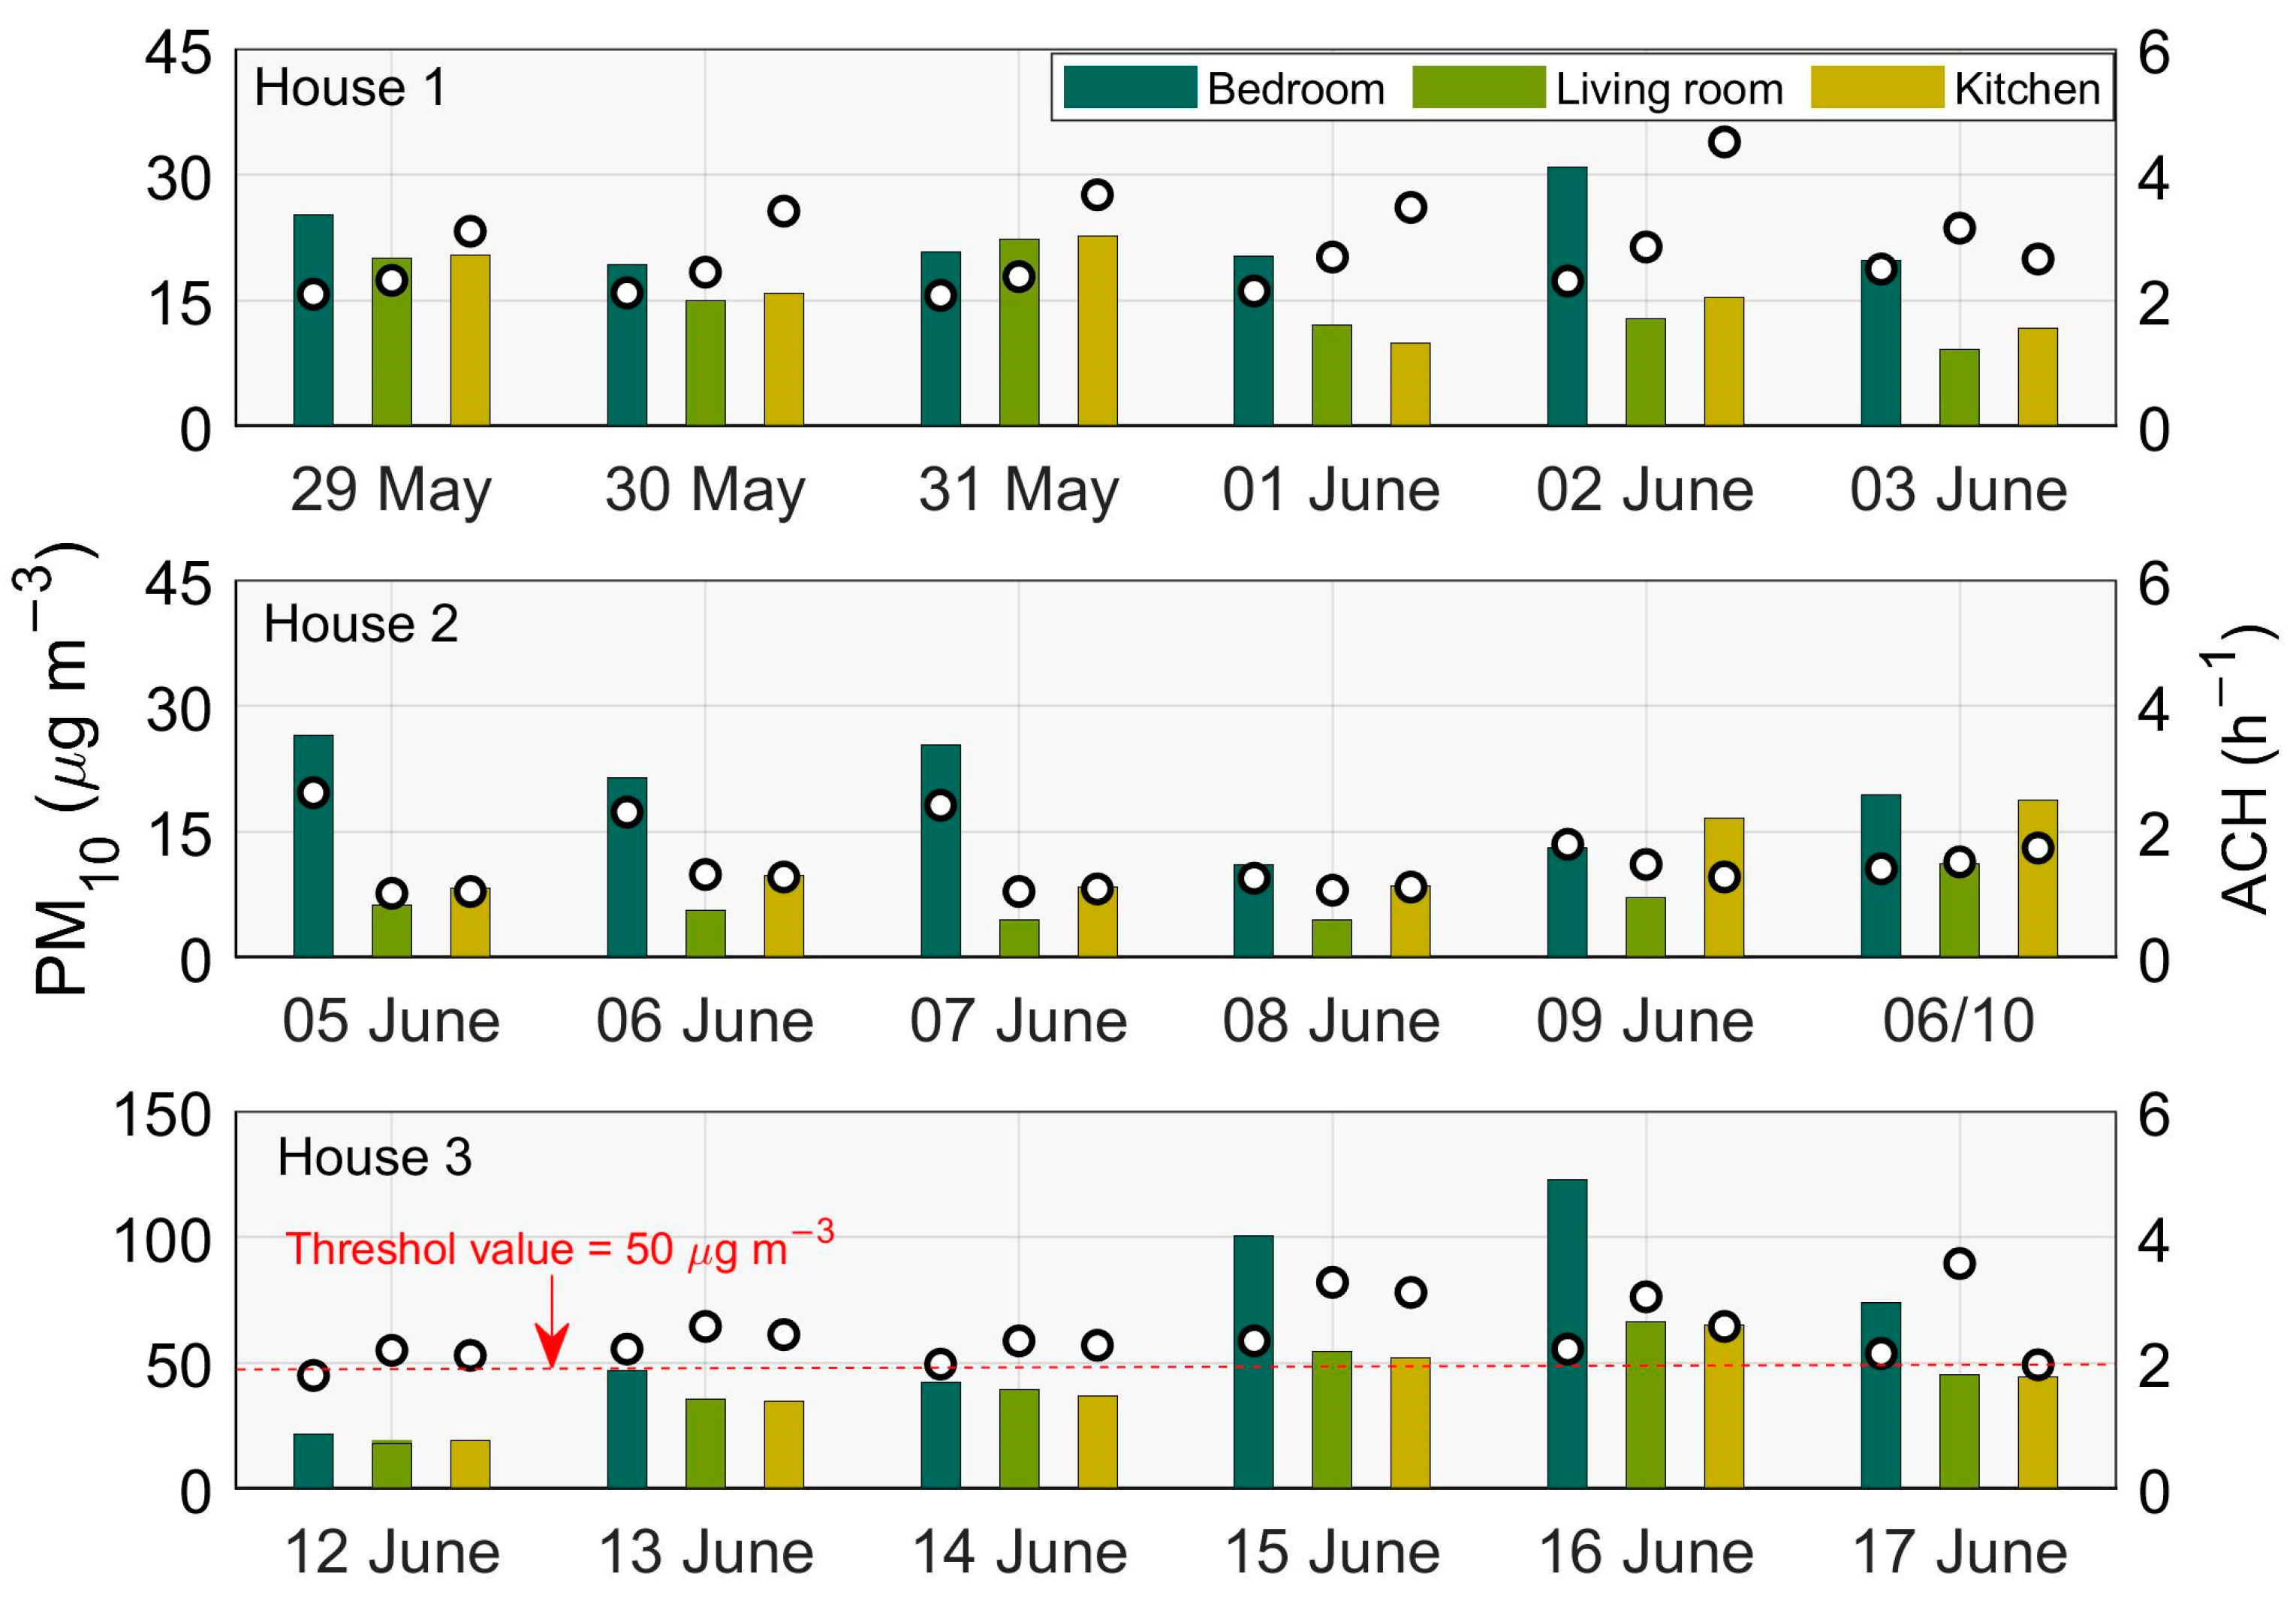
3.1. PM10 Concentrations

From the gravimetric determination of PM10, the indoor daily concentrations of PM10 for all selected microenvironments are shown in Figure 2. High inter-house variations were observed. Mean concentrations of PM10 in house 3 considering all microenvironments (51.2 µg m−3) were around 4 and 3 times higher than in house 2 (12.4 µg m−3) and house 1 (17.9 µg m−3), respectively. PM10 levels for each dwelling did not show significant statistical differences between the monitored microenvironments, except in house 2, for which notable differences (p < 0.05) were registered. The daily PM10 surpassed the threshold of 50 μg m−3 imposed by the European legislation (Directive 2008/50/EC) on 50% of measurement days in house 3, whilst no exceedances were observed for houses 1 and 2.
The average of the ACH (h−1) calculations for each microenvironment were as follows: house 1 (B—2.21; LR—2.64; K—3.41), house 2 (B—1.97; LR—1.21; K—1.26), and house 3 (B—2.12; LR—2.84; K—2.42). The information on door/window opening and closing procedures was recorded by occupants in a logbook. Records suggest that, in house 2, CDCW (closed doors, closed windows) predominated, which may have contributed to the lower ACHs and statistical differences between microenvironments. In addition, the living room of this dwelling was only accessed for a few minutes on three days of the sampling period, which may explain the low ACH and pollutant concentration values.
The ventilation setting associated with higher daily PM10 concentrations was closed doors with semi-open windows (CDSW), which was practised in all bedrooms (house 1—22.7 μg m−3; house 2—17.5 μg m−3; and house 3—68.1 μg m−3). On the other hand, the lowest PM10 mean concentrations (LR = 6.53 µg m−3; K = 11.7 µg m−3) were recorded in house 2, for ventilation conditions characterised by CDCW (closed doors and windows). These results are distinct from those reported by Canha et al. [63], who studied PM10 concentrations for different ventilation configurations in bedrooms, reporting the highest mean concentrations for CDCW (26.7 μg m−3) and the lowest for ODCW (18.5 μg m−3). The lower occupancy in the LR and K of house 2 likely contributed to lower PM10 concentrations. In addition, the ventilation settings (e.g., CDCW) can act as a barrier against infiltration of air pollutants or migration from another microenvironment. In another study, higher PM10 concentrations with increasing ACH values were registered because of the infiltration of outdoor air [30].
The hourly PM10 mean concentrations for the measurement days are shown in Figure 3. In bedrooms (a, d, and g), PM10 concentrations increased sharply between 8 and 10 a.m. and 6 and 7 p.m., corresponding to getting up and returning in the late afternoon. Due to the lower activities registered in the K and LR of the house 2, PM10 concentrations did not show marked variation throughout the day. On the other hand, PM10 concentrations in the kitchen of house 1 (c) were linked to frequent cooking activities (9–12 a.m. and 6–9 p.m.). The living room of the same house presented a very similar pattern (b), probably due to the migration of cooking fumes from the kitchen and the use of this microenvironment after meals by the occupants.
The inspection of the diurnal cycle and the notes in the logbooks referring to the activities in the bedrooms showed that the highest peaks (house 1 = 55.3 μg m−3 and house 3 = 339 μg m−3) corresponded to making the beds and the use of aerosol sprays and incense. Details of the main activities can be seen in Table S2 in the Supplementary Material. In addition to indoor sources, outdoor contributions to PM levels were notable in house 3 for all microenvironments. The backward trajectories showed contributions from the long-range transport of smoke from wildfires located in Zamora (Spain) and dust from the Sahara (Africa) only for the sampling period in house 3, which is shown in Figure S2 of the Supplementary Material. Thus, indoor air pollution in house 3 represented a mixture of indoor sources and long-range transport. Furthermore, in addition to the dominant mineral matter, anthropogenic constituents such as BC can also represent a significant aerosol component during dust outbreaks. Different processes can lead to an increase in the anthropogenic PM load of the dust. Among others, these processes include anthropogenic emission sources in the proximity of the desert, such as large petrochemical and power plants, frequent wildfires in the Sub-Saharan region, and interaction between the mineral particles and anthropogenic emissions during transport [64]. Only on the 1st day (06/12), no influence of smoke and dust on indoor PM concentrations was observed. On the other hand, the concentrations recorded on the 5th day (06/15) were the highest, corresponding to 5.7-, 3.7-, and 3.4-fold increases in PM10 levels compared to those on the first day (06/12) for the bedroom, living room, and kitchen, respectively. Higher PM10 levels in the bedroom may be associated with the orientation of the window (opposite to the kitchen and living room), in addition to common housekeeping activities, which favour dust resuspension in that microenvironment. Backward trajectories were also calculated for the sampling periods in houses 1 and 2 and showed no influence of long-range transport of dust or smoke.
In house 2, the morning peak in the bedroom (74.1 μg m−3) can be related to infiltration from the outdoors of PM from high traffic on the adjacent avenue. In fact, opening the window took place around 8 a.m., during the period of greatest road congestion [38]. Abdel-Salam et al. [65] reported stronger correlations between indoor and outdoor PM10 concentrations through frequent opening of ventilation settings, which favours the infiltration of pollutants from outdoor air into indoor microenvironments.

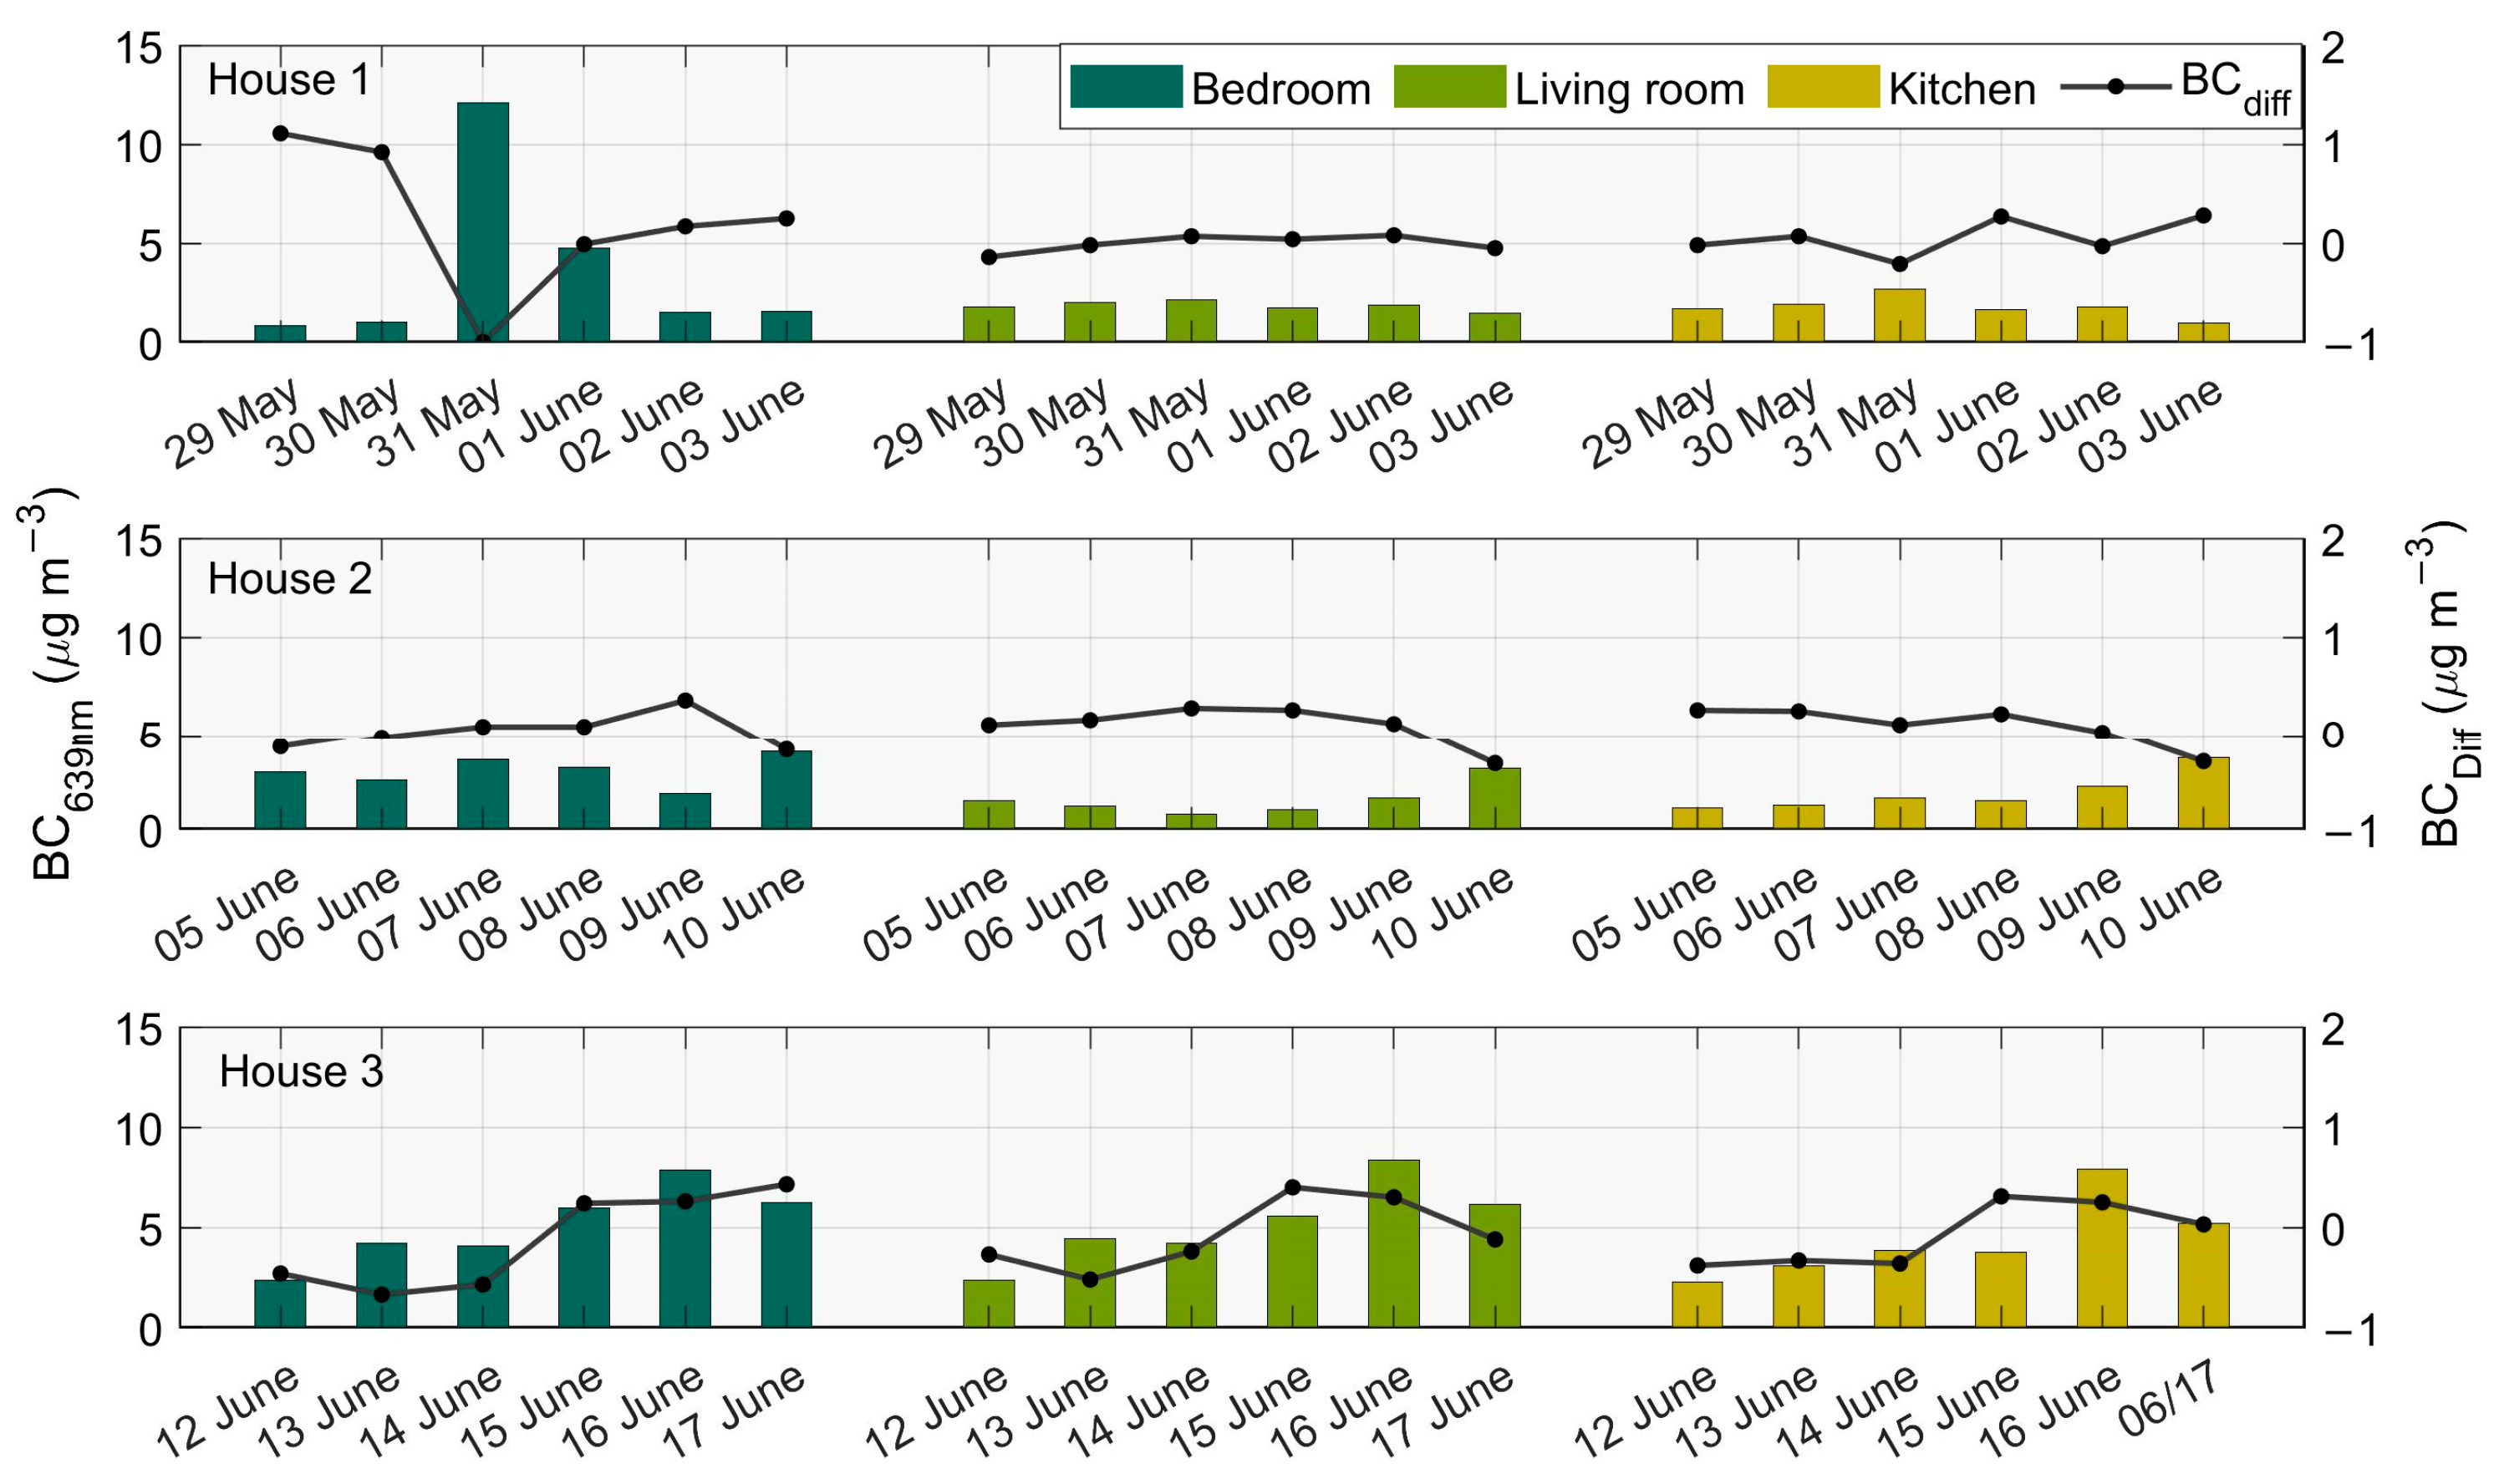
3.2. Black Carbon Concentrations

BC is emitted directly from combustion sources and is a good indicator of traffic-related PM pollution [66,67]. Higher percentages of BC in PM10 (between 15% and 22.6%) were found in house 2. In general, markedly higher concentrations were observed for BC in the bedrooms (Figure 4) (house 1 = 3.63 μg m−3, house 2 = 2.93 μg m−3, and house 3 = 5.17 μg m−3), likely due to both indoor activities (candles and incense) and outdoor sources, including the infiltration of vehicular traffic emissions, given that these compartments were located on the facade of the buildings facing the main streets.
BCdiff values (black line) higher than 0.5 μg m−3 suggest an impact from biomass burning combined with other sources, while values close to or less than 0 represent a major contribution from vehicular emissions [50]. The highest daily values of BCdiff were found in the bedroom of house 1, likely due to specific indoor sources (candles and incense). However, BC concentrations in the corresponding days were low (05/29 = 0.83 μg m−3 and 05/30 = 1.01 μg m−3). On the other hand, the highest daily BC value for all microenvironments (12.1 μg m−3) was recorded in the bedroom of house 1, but no specific activities were written down in the logbook that allow explaining this concentration, suggesting infiltration from outdoor pollution from traffic. As expected, house 2 displayed BCdiff values close to 0 for all microenvironments, confirming the influence of traffic emissions. Substantial variations in BC concentrations in house 3 were registered. Considering the entire period, average BC contributions from fossil fuel (BCff) were higher than that from biomass burning (BCbb) for all houses (house 1: BCff = 90% and BCbb = 10%; house 2: BCff = 93% and BCbb = 7%; and house 3: BCff = 88% and BCbb = 12%). As mentioned earlier, the sampling period in this house covered a desert dust intrusion event, which contributed to increased levels of particulate material and specific chemical constituents [68].

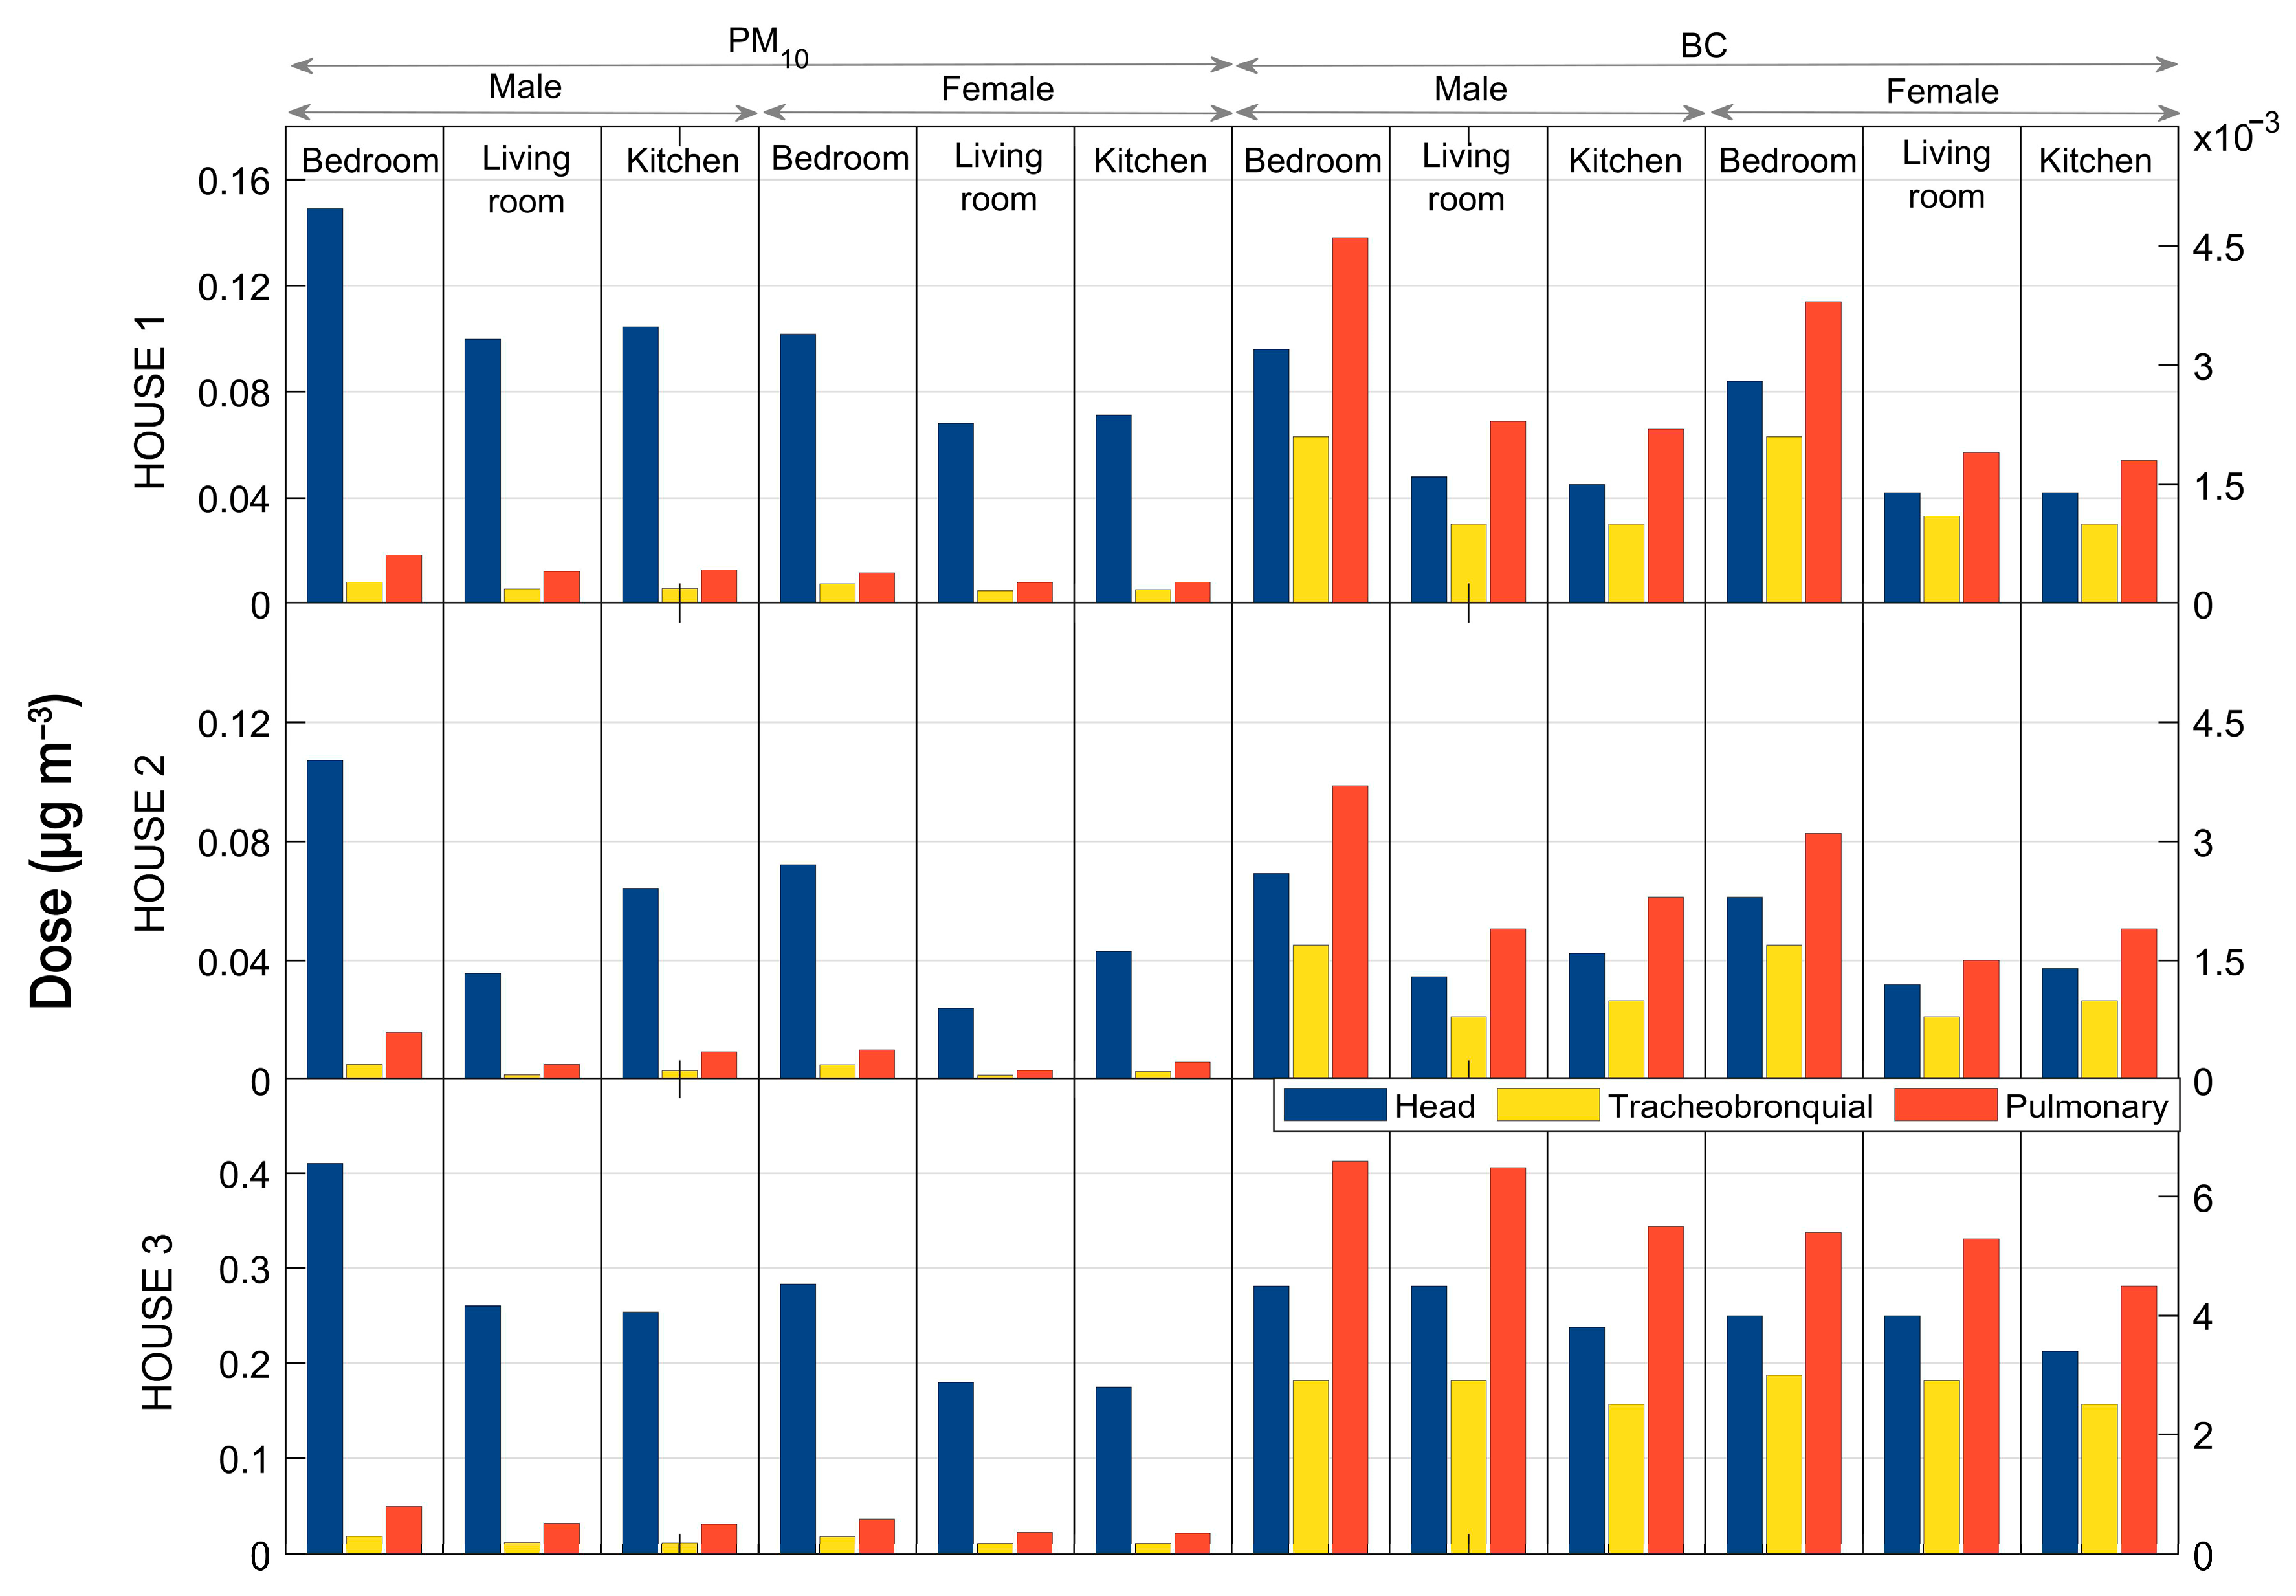
3.3. Deposition Fractions and Dose of PM10 and BC

The PM10 and BC total and regional deposition fractions are shown in Table 3. Total PM10 deposition fractions ranged from 73% to 86% for males and 69% to 83% for females. In general, the regional DF of PM10 showed a similar pattern, irrespective of the house: H > P > TB. On the other hand, the regional DF for BC presented higher values for the P region, followed by H and TB. In summary, given that BC is essentially bound to the finest particles, its deposition is governed by Brownian diffusion, and penetrates deeper into the airways, while PM10 is mainly deposited in the upper region of the HRT by mechanisms involving impact and gravitational sedimentation [69,70]. These results are in line with findings from other authors [38,71,72].
Regardless of gender, total DF was mainly dependent on MMAD and GSD values. However, the values of the total DF for males were slightly higher than for females, except for the TB region. The differences in total DFs between genders can be attributed to larger and heavier lungs, tidal volume, and functional residual capacity for males [73]. Higher values for males than for females have been also reported in previous studies [74,75].
Doses were estimated for both sexes and the three microenvironments based on mean PM10 concentrations (Figure 5). The PM10 regional dose showed the largest fraction in the H region: house 1 at 0.07–0.15 µg min−1, house 2 at 0.02–0.11 µg min−1, and house 3 at 0.17–0.45 µg min−1, representing 86% of the total dose. In comparison, the doses for the P region were as follows: house 1 at 0.05–0.08 × 10⁻¹ µg min−1, house 2 at 0.02–0.05 × 10⁻¹ µg min−1, and house 3 at 0.1–0.2 × 10⁻¹ µg min−1. The does for the TB region were as follows: house 1 at 0.08–0.18 × 10⁻¹ µg min−1, house 2 at 0.03–0.15 × 10⁻¹ µg min−1, and house 3 at 0.22–0.50 × 10⁻¹ µg min−1. Similar PM10 doses for the upper region were reported in a previous study, with contributions up to 99% in the H region [76]. The doses of PM10 followed the trend observed for the DF, with higher values for males compared to females. Furthermore, regarding the specific microenvironments, the following order was observed for the dose of PM10: house 3 (B > LR > K) > house 1 (B > K > LR) > house 2 (B > K > LR).
Unlike PM10, BC inhaled in different microenvironments showed the same pattern, with higher contributions to the P region: house 1 at 1.8–4.6 × 10⁻³ µg min−1, house 2 at 1.5–3.7 × 10⁻³ µg min−1, and house 3 at 4.5–6.6 × 10⁻³ µg min−1. This was followed by the H region: house 1 at 1.4–3.2 × 10⁻³ µg min−1, house 2 at 1.2–2.6 × 10⁻³ µg min−1, and house 3 at 3.4–4.5 × 10⁻³ µg min−1. This was then followed by the TB region: house 1 at 1.0–2.1 × 10⁻³ µg min−1, house 2 at 0.8–1.7 × 10⁻³ µg min−1, and house 3 at 2.5–2.9 × 10⁻³ µg min−1. Doses in the P region accounted for up to 45% of the total doses. These results highlight the deposition of finer particles, in particular BC, in the pulmonary region. Several studies have shown increased harm to human health with decreasing particle sizes [77]. BC deposition in the P region is responsible for severe respiratory health problems due to the induction of mutagenicity, intracellular oxidative stress, and inflammatory responses [78,79].

3.4. Study Limitations

Some limitations to the study carried out can be pointed out, which may partially influence the interpretations made: (i) lack of monitoring of pollutants outside homes, to better understand the contribution and infiltration from outdoor sources; (ii) the limited number of houses covered in the study; (iii) size-segregated PM monitors available only in the bedrooms (OPS); (iv) calculations of PM10 and BC deposition in the HRT performed with lung parameters and MMAD and GSD values for BC from the literature and model calculations only apply to adult males and females (25–30 years old). Hence, future studies should cover different seasons and simultaneous monitoring inside and outside, including monitors that provide size-segregated PM and BC concentrations. In addition, more houses should be considered in other urban areas, with other sources and pollution loads.

4. Conclusions

The monitoring of air pollutants in homes is usually carried out in only one specific microenvironment. This study demonstrated that the exposure assessment can be biased, as concentrations can vary from compartment to compartment. The specific ventilation conditions, together with the different activities by the occupants, were determinant for the significant differences in PM and BC concentrations. Increasing the air change rate by opening ventilation settings can improve PM dispersion. However, it can also result in the infiltration of certain pollutants from sources other than those present in the microenvironment.
In this study, which covered houses essentially occupied by students, it was found that the hotspot for exposure to PM10 and BC concentrations is the bedroom microenvironment. Furthermore, the MPPD model indicated that the highest deposition doses occur in this hotspot, pointing to higher total deposition fractions of PM10 in the head region, while BC is mainly deposited in the pulmonary region. It has been observed that finer particles can penetrate deeper into the HRT, potentially causing adverse health effects, especially for males, who inhale higher total doses than females. As future work, a detailed chemical characterisation of indoor and outdoor pollutants is recommended, including not only size-segregated particles, but also gases, for a more complete picture of the impact of domestic activities and specific events on concentrations and exposure.

Supplementary Materials

The following supporting information can be downloaded at: https://www.mdpi.com/article/10.3390/atmos14071064/s1. Figure S1. Linear correlation between PM10 concentrations obtained from photometric and gravimetric devices for each microenvironment during the sampling campaign; Table S1. Absorption coefficients (ε) for each wavelength by microenvironment using λ = 639 nm as baseline; Figure S2. Five-day backward trajectories arriving at house 3 at 6 p.m. on five different days. Figure S3. Daily profile of CO2 concentrations and activities associated with each peak.

Author Contributions

Conceptualisation, Y.A.C. and C.A.; methodology, Y.A.C., C.A., C.A.G. and S.M.A.; data curation, Y.A.C.; visualisation, Y.A.C.; writing—original draft preparation, Y.A.C. and C.A.; writing—review and editing, Y.A.C., C.A. and S.M.A.; supervision, C.A. and M.F.; funding acquisition, C.A. and M.F. All authors have read and agreed to the published version of the manuscript.

Funding

Yago A. Cipoli was funded by the Portuguese Foundation for Science and Technology (FCT) through a PhD scholarship (SFRH/BD/04992/2021). CIMO (UIDB/00690/2020 + UIDP/00690/2020), SusTEC (LA/P/0007/2020), CESAM (UIDP/50017/2020 + UIDB/50017/2020 + LAP/0094/2020), and C2TN (UIDB/04349/2020 + UIDP/04349/2020) were funded by FCT/MCTES through national funds.

Institutional Review Board Statement

Not applicable.

Informed Consent Statement

Not applicable.

Data Availability Statement

The data presented in this study are available upon request from the corresponding author.

Acknowledgments

Our special thanks go to volunteers Maria Zampieri, Leonardo Furst, and Regis Pacheco for allowing us to install equipment in their houses, as well as to Thalles Perdigão for his assistance during the installation of the measuring instruments.

Conflicts of Interest

The authors declare no conflict of interest.

References

  1. Saini, J.; Dutta, M.; Marques, G. A Comprehensive Review on Indoor Air Quality Monitoring Systems for Enhanced Public Health. Sustain. Environ. Res. 2020, 30, 6. [Google Scholar] [CrossRef]
  2. Van Tran, V.; Park, D.; Lee, Y.C. Indoor Air Pollution, Related Human Diseases, and Recent Trends in the Control and Improvement of Indoor Air Quality. Int. J. Environ. Res. Public Health 2020, 17, 2927. [Google Scholar] [CrossRef] [PubMed]
  3. Cincinelli, A.; Martellini, T. Indoor Air Quality and Health. Int. J. Environ. Res. Public Health 2017, 14, 1286. [Google Scholar] [CrossRef]
  4. Landrigan, P.J.; Fuller, R.; Acosta, N.J.R.; Adeyi, O.; Arnold, R.; Basu, N.; Baldé, A.B.; Bertollini, R.; Bose-O’Reilly, S.; Boufford, J.I.; et al. The Lancet Commission on Pollution and Health. Lancet 2018, 391, 462–512. [Google Scholar] [CrossRef] [PubMed]
  5. World Health Organization. Health, Environment and Climate Change: Report by the Director-General; World Health Organization: Geneva, Switzerland, 2018; Available online: https://apps.who.int/iris/handle/10665/276332 (accessed on 24 May 2023).
  6. Lange, P.; Celli, B.; Agustí, A.; Boje Jensen, G.; Divo, M.; Faner, R.; Guerra, S.; Marott, J.L.; Martinez, F.D.; Martinez-Camblor, P.; et al. Lung-Function Trajectories Leading to Chronic Obstructive Pulmonary Disease. N. Engl. J. Med. 2015, 373, 111–122. [Google Scholar] [CrossRef] [PubMed]
  7. Liu, S.; Zhou, Y.; Liu, S.; Chen, X.; Zou, W.; Zhao, D.; Li, X.; Pu, J.; Huang, L.; Chen, J.; et al. Association between Exposure to Ambient Particulate Matter and Chronic Obstructive Pulmonary Disease: Results from a Cross-Sectional Study in China. Thorax 2017, 72, 788–795. [Google Scholar] [CrossRef]
  8. Farraj, A.K.; Walsh, L.; Haykal-Coates, N.; Malik, F.; Mcgee, J.; Winsett, D.; Duvall, R.; Kovalcik, K.; Cascio, W.E.; Higuchi, M.; et al. Carbon Black Nanoparticle Instillation Induces Sustained Inflammation and Genotoxicity in Mouse Lung and Liver. Part. Fibre Toxicol. 2012, 9, 5. [Google Scholar] [CrossRef]
  9. Brook, R.D.; Rajagopalan, S.; Pope, C.A.; Brook, J.R.; Bhatnagar, A.; Diez-Roux, A.V.; Holguin, F.; Hong, Y.; Luepker, R.V.; Mittleman, M.A.; et al. Particulate Matter Air Pollution and Cardiovascular Disease. Circulation 2010, 121, 2331–2378. [Google Scholar] [CrossRef]
  10. Gray, D.L.; Wallace, L.A.; Brinkman, M.C.; Buehler, S.S.; La Londe, C. Respiratory and Cardiovascular Effects of Metals in Ambient Particulate Matter: A Critical Review. Rev. Environ. Contam. Toxicol. 2015, 234, 135–203. [Google Scholar] [CrossRef]
  11. World Health Organization. Household Air Pollution. 2022. Available online: https://www.who.int/news-room/fact-sheets/detail/household-air-pollution-and-health (accessed on 30 March 2023).
  12. Loomis, D.; Grosse, Y.; Lauby-Secretan, B.; El Ghissassi, F.; Bouvard, V.; Benbrahim-Tallaa, L.; Guha, N.; Baan, R.; Mattock, H.; Straif, K. The Carcinogenicity of Outdoor Air Pollution. Lancet Oncol. 2013, 14, 1262. [Google Scholar] [CrossRef]
  13. Cohen, A.J.; Brauer, M.; Burnett, R.; Anderson, H.R.; Frostad, J.; Estep, K.; Balakrishnan, K.; Brunekreef, B.; Dandona, L.; Dandona, R.; et al. Estimates and 25-Year Trends of the Global Burden of Disease Attributable to Ambient Air Pollution: An Analysis of Data from the Global Burden of Diseases Study 2015. Lancet 2017, 389, 1907–1918. [Google Scholar] [CrossRef] [PubMed]
  14. Seinfeld, J.H.; Pandis, S.N. Atmospheric Chemistry and Physics: From Air Pollution to Climate Change; John Wiley & Sons: New York, NY, USA, 2016. [Google Scholar]
  15. Leech, J.A.; Nelson, W.C.; Burnett, R.T.; Aaron, S.; Raizenne, M.E. It’s about Time: A Comparison of Canadian and American Time–Activity Patterns. J. Expo. Sci. Environ. Epidemiol. 2002, 12, 427–432. [Google Scholar] [CrossRef] [PubMed]
  16. Han, Y.; Li, X.; Zhu, T.; Lv, D.; Chen, Y.; Hou, L.A.; Zhang, Y.; Ren, M. Characteristics and Relationships between Indoor and Outdoor PM2.5 in Beijing: A Residential Apartment Case Study. Aerosol Air Qual. Res. 2016, 16, 2386–2395. [Google Scholar] [CrossRef]
  17. Gao, X.; Gao, W.; Sun, X.; Jiang, W.; Wang, Z.; Li, W. Measurements of Indoor and Outdoor Fine Particulate Matter during the Heating Period in Jinan, in North China: Chemical Composition, Health Risk, and Source Apportionment. Atmosphere 2020, 11, 885. [Google Scholar] [CrossRef]
  18. Tofful, L.; Perrino, C.; Canepari, S. Comparison Study between Indoor and Outdoor Chemical Composition of PM2.5 in Two Italian Areas. Atmosphere 2020, 11, 368. [Google Scholar] [CrossRef]
  19. Alves, C.; Vicente, A.; Oliveira, A.R.; Candeias, C.; Vicente, E.; Nunes, T.; Cerqueira, M.; Evtyugina, M.; Rocha, F.; Almeida, S.M. Fine Particulate Matter and Gaseous Compounds in Kitchens and Outdoor Air of Different Dwellings. Int. J. Environ. Res. Public Health 2020, 17, 5256. [Google Scholar] [CrossRef]
  20. Canha, N.; Lage, J.; Galinha, C.; Coentro, S.; Alves, C.; Almeida, S.M. Impact of Biomass Home Heating, Cooking Styles, and Bread Toasting on the Indoor Air Quality at Portuguese Dwellings: A Case Study. Atmosphere 2018, 9, 214. [Google Scholar] [CrossRef]
  21. Pastuszka, J.S.; Talik, E.; Płoszaj-Pyrek, J.; Grygierek, K.; Ferdyn-Grygierek, J. Exposure to PM4 in Homes with Tobacco Smoke in and around Katowice, Poland. Atmosphere 2021, 12, 1590. [Google Scholar] [CrossRef]
  22. Vicente, E.D.; Alves, C.A.; Martins, V.; Almeida, S.M.; Lazaridis, M. Lung-Deposited Dose of Particulate Matter from Residential Exposure to Smoke from Wood Burning. Environ. Sci. Pollut. Res. 2021, 28, 65385–65398. [Google Scholar] [CrossRef]
  23. Qian, J.; Peccia, J.; Ferro, A.R. Walking-Induced Particle Resuspension in Indoor Environments. Atmos. Environ. 2014, 89, 464–481. [Google Scholar] [CrossRef]
  24. Karagulian, F.; Belis, C.A.; Dora, C.F.C.; Prüss-Ustün, A.M.; Bonjour, S.; Adair-Rohani, H.; Amann, M. Contributions to Cities’ Ambient Particulate Matter (PM): A Systematic Review of Local Source Contributions at Global Level. Atmos. Environ. 2015, 120, 475–483. [Google Scholar] [CrossRef]
  25. Vardoulakis, S.; Dimitrova, R.; Richards, K.; Hamlyn, D.; Camilleri, G.; Weeks, M.; Sini, J.F.; Britter, R.; Borrego, C.; Schatzmann, M.; et al. Numerical Model Inter-Comparison for Wind Flow and Turbulence Around Single-Block Buildings. Environ. Model. Assess. 2011, 16, 169–181. [Google Scholar] [CrossRef]
  26. Nadali, A.; Arfaeinia, H.; Asadgol, Z.; Fahiminia, M. Indoor and Outdoor Concentration of PM10, PM2.5 and PM1 in Residential Building and Evaluation of Negative Air Ions (NAIs) in Indoor PM Removal. Environ. Pollut. Bioavailab. 2020, 32, 47–55. [Google Scholar] [CrossRef]
  27. Yang, Y.Y.; Fan, L.; Wang, J.; Zhu, Y.D.; Li, X.; Wang, X.Q.; Yan, X.; Li, L.; Zhang, Y.; Yang, W.; et al. Characterization and Exposure Assessment of Household Fine Particulate Matter Pollution in China. Indoor Air 2021, 31, 1391–1401. [Google Scholar] [CrossRef]
  28. Feliciano, M.; Lira, F.; Furst, L.C.; Arioli, R. The influence of domestic heating systems in indoor air quality in homes of a region of Northeastern Portugal. Prog. Ind. Ecol. 2022, 15, 162–182. [Google Scholar] [CrossRef]
  29. BéruBé, K.A.; Sexton, K.J.; Jones, T.P.; Moreno, T.; Anderson, S.; Richards, R.J. The Spatial and Temporal Variations in PM10 Mass from Six UK Homes. Sci. Total Environ. 2004, 324, 41–53. [Google Scholar] [CrossRef]
  30. Abdel-Salam, M.M.M. Indoor Exposure of Elderly to Air Pollutants in Residential Buildings in Alexandria, Egypt. Build. Environ. 2022, 219, 109221. [Google Scholar] [CrossRef]
  31. Scibor, M. Are We Safe inside? Indoor Air Quality in Relation to Outdoor Concentration of PM10 and PM2.5 and to Characteristics of Homes. Sustain. Cities Soc. 2019, 48, 101537. [Google Scholar] [CrossRef]
  32. Madureira, J.; Slezakova, K.; Silva, A.I.; Lage, B.; Mendes, A.; Aguiar, L.; Pereira, M.C.; Teixeira, J.P.; Costa, C. Assessment of Indoor Air Exposure at Residential Homes: Inhalation Dose and Lung Deposition of PM10, PM2.5 and Ultrafine Particles among Newborn Children and Their Mothers. Sci. Total Environ. 2020, 717, 137293. [Google Scholar] [CrossRef]
  33. Pordata. Municipalities Database. Available online: https://www.pordata.pt/Municipios (accessed on 21 March 2023).
  34. Peel, M.C.; Finlayson, B.L.; Mcmahon, T.A. Hydrology and Earth System Sciences Updated World Map of the Köppen-Geiger Climate Classification. Hydrol. Earth Syst. Sci 2007, 11, 1633–1644. [Google Scholar] [CrossRef]
  35. Gonçalves, A.; Ornellas, G.; Ribeiro, A.C.; Maia, F.; Rocha, A.; Feliciano, M. Urban Cold and Heat Island in the City of Bragança (Portugal). Climate 2018, 6, 70. [Google Scholar] [CrossRef]
  36. Carrico, C.M.; Karacaoglu, J. Impacts of a Prescribed Fire on Air Quality in Central New Mexico. Atmosphere 2023, 14, 316. [Google Scholar] [CrossRef]
  37. Wadlow, I.; Paton-Walsh, C.; Forehead, H.; Perez, P.; Amirghasemi, M.; Guérette, É.-A.; Gendek, O.; Kumar, P. Understanding Spatial Variability of Air Quality in Sydney: Part 2—A Roadside Case Study. Atmosphere 2019, 10, 217. [Google Scholar] [CrossRef]
  38. Cipoli, Y.A.; Targino, A.C.; Krecl, P.; Furst, L.C.; dos Alves, C.A.; Feliciano, M. Ambient Concentrations and Dosimetry of Inhaled Size-Segregated Particulate Matter during Periods of Low Urban Mobility in Bragança, Portugal. Atmos. Pollut. Res. 2022, 13, 101512. [Google Scholar] [CrossRef] [PubMed]
  39. Ramachandran, S.; Cherian, R. Regional and Seasonal Variations in Aerosol Optical Characteristics and Their Frequency Distributions over India during 2001–2005. J. Geophys. Res. Atmos. 2008, 113, 8207. [Google Scholar] [CrossRef]
  40. Moosmüller, H.; Arnott, W.P.; Rogers, C.F.; Bowen, J.L.; Gillies, J.A.; Pierson, W.R.; Collins, J.F.; Durbin, T.D.; Norbeck, J.M. Time Resolved Charaterization of Diesel Particulate Emissions. 1. Instruments for Particle Mass Measurements. Environ. Sci. Technol. 2001, 35, 781–787. [Google Scholar] [CrossRef]
  41. Raparthi, N.; Debbarma, S.; Phuleria, H.C. Development of Real-World Emission Factors for on-Road Vehicles from Motorway Tunnel Measurements. Atmos. Environ. X 2021, 10, 100113. [Google Scholar] [CrossRef]
  42. Wallace, L.A.; Wheeler, A.J.; Kearney, J.; Van Ryswyk, K.; You, H.; Kulka, R.H.; Rasmussen, P.E.; Brook, J.R.; Xu, X. Validation of Continuous Particle Monitors for Personal, Indoor, and Outdoor Exposures. J. Expo. Sci. Environ. Epidemiol. 2010, 21, 49–64. [Google Scholar] [CrossRef]
  43. Kingham, S.; Durand, M.; Aberkane, T.; Harrison, J.; Gaines Wilson, J.; Epton, M. Winter Comparison of TEOM, MiniVol and DustTrak PM10 Monitors in a Woodsmoke Environment. Atmos. Environ. 2006, 40, 338–347. [Google Scholar] [CrossRef]
  44. Hänninen, O. Novel Second-Degree Solution to Single Zone Mass-Balance Equation Improves the Use of Build-up Data in Estimating Ventilation Rates in Classrooms. J. Chem. Health Saf. 2013, 20, 14–19. [Google Scholar] [CrossRef]
  45. Aguilar, A.J.; de la Hoz-Torres, M.L.; Costa, N.; Arezes, P.; Martínez-Aires, M.D.; Ruiz, D.P. Assessment of Ventilation Rates inside Educational Buildings in Southwestern Europe: Analysis of Implemented Strategic Measures. J. Build. Eng. 2022, 51, 104204. [Google Scholar] [CrossRef]
  46. Westgate, S.; Ng, N.L. Using In-Situ CO2, PM1, PM2.5, and PM10 Measurements to Assess Air Change Rates and Indoor Aerosol Dynamics. Build. Environ. 2022, 224, 109559. [Google Scholar] [CrossRef]
  47. Alves, C.A.; Vicente, E.D.; Evtyugina, M.; Vicente, A.M.; Nunes, T.; Lucarelli, F.; Calzolai, G.; Nava, S.; Calvo, A.I.; del Alegre, C.B.; et al. Indoor and Outdoor Air Quality: A University Cafeteria as a Case Study. Atmos. Pollut. Res. 2020, 11, 531–544. [Google Scholar] [CrossRef]
  48. Atanacio, A.J.; Cohen, D.D.; Button, D.; Paneras, N.; Garton, D. Multi-Wavelength Absorption Black Carbon Instrument (MABI) Manual. Available online: https://www.ansto.gov.au/media/2716/download (accessed on 20 March 2023).
  49. Ryś, A.; Samek, L. Measurement report: Determination of Black Carbon concentration in PM2.5 fraction by Multi-wavelength absorption black carbon instrument (MABI). Atmos. Chem. Phys. 2021, 1–14. [Google Scholar] [CrossRef]
  50. Manohar, M.; Atanacio, A.; Button, D.; Cohen, D. MABI—A Multi-Wavelength Absorption Black Carbon Instrument for the Measurement of Fine Light Absorbing Carbon Particles. Atmos. Pollut. Res. 2021, 12, 133–140. [Google Scholar] [CrossRef]
  51. Anjilvel, S. A Multiple-Path Model of Particle Deposition in the Rat Lung. Fundam. Appl. Toxicol. 1995, 28, 41–50. [Google Scholar] [CrossRef]
  52. Cheng, K.H.; Swift, D.L. Calculation of Total Deposition Fraction of Ultrafine Aerosols in Human Extrathoracic and Intrathoracic Regions. Aerosol Sci. Technol. 1995, 22, 194–201. [Google Scholar] [CrossRef]
  53. ICRP. Human Respiratory Tract Model for Radiological Protection. J. Radiol. Prot. 1994, 66, 24. [Google Scholar]
  54. Yeh, H.; Schum, G. Models of Human Lung Airways and Their Application to Inhaled Particle Deposition. Bull. Math. Biol. 1980, 42, 461–480. [Google Scholar] [CrossRef]
  55. Hitzenberger, R.; Tohno, S. Comparison of Black Carbon (BC) Aerosols in Two Urban Areas—Concentrations and Size Distributions. Atmos. Environ. 2001, 35, 2153–2167. [Google Scholar] [CrossRef]
  56. Goel, A.; Izhar, S.; Gupta, T. Study of Environmental Particle Levels, Its Effects on Lung Deposition and Relationship With Human Behaviour. Energy Environ. Sustain. 2018, 77–91. [Google Scholar] [CrossRef]
  57. Díaz, J.; Linares, C.; Carmona, R.; Russo, A.; Ortiz, C.; Salvador, P.; Trigo, R.M. Saharan Dust Intrusions in Spain: Health Impacts and Associated Synoptic Conditions. Environ. Res. 2017, 156, 455–467. [Google Scholar] [CrossRef] [PubMed]
  58. Calheiros, T.; Nunes, J.P.; Pereira, M.G. Recent Evolution of Spatial and Temporal Patterns of Burnt Areas and Fire Weather Risk in the Iberian Peninsula. Agric. For. Meteorol. 2020, 287, 107923. [Google Scholar] [CrossRef]
  59. Cavaleiro, R.; Russo, A.; Sousa, P.M.; Durão, R. Association between Prevailing Circulation Patterns and Coarse Particles in Portugal. Atmosphere 2021, 12, 85. [Google Scholar] [CrossRef]
  60. Nicolae, V.; Talianu, C.; Andrei, S.; Antonescu, B.; Ene, D.; Nicolae, D.; Dandocsi, A.; Toader, V.E.; Ștefan, S.; Savu, T.; et al. Multiyear Typology of Long-Range Transported Aerosols over Europe. Atmosphere 2019, 10, 482. [Google Scholar] [CrossRef]
  61. Rolph, G.; Stein, A.; Stunder, B. Real-Time Environmental Applications and Display SYstem: READY. Environ. Model. Softw. 2017, 95, 210–228. [Google Scholar] [CrossRef]
  62. Katsoulis, B.D. The Potential for Long-Range Transport of Air-Pollutants into Greece: A Climatological Analysis. Sci. Total Environ. 1999, 231, 101–113. [Google Scholar] [CrossRef] [PubMed]
  63. Canha, N.; Lage, J.; Candeias, S.; Alves, C.; Almeida, S.M. Indoor Air Quality during Sleep under Different Ventilation Patterns. Atmos. Pollut. Res. 2017, 8, 1132–1142. [Google Scholar] [CrossRef]
  64. Querol, X.; Tobías, A.; Pérez, N.; Karanasiou, A.; Amato, F.; Stafoggia, M.; Pérez García-Pando, C.; Ginoux, P.; Forastiere, F.; Gumy, S.; et al. Monitoring the Impact of Desert Dust Outbreaks for Air Quality for Health Studies. Environ. Int. 2019, 130, 104867. [Google Scholar] [CrossRef]
  65. Abdel-Salam, M.M.M. Seasonal Variation in Indoor Concentrations of Air Pollutants in Residential Buildings. J. Air Waste Manag. Assoc. 2021, 71, 761–777. [Google Scholar] [CrossRef]
  66. Popovicheva, O.; Chichaeva, M.; Kovach, R.; Zhdanova, E.; Kasimov, N. Seasonal, Weekly, and Diurnal Black Carbon in Moscow Megacity Background under Impact of Urban and Regional Sources. Atmosphere 2022, 13, 563. [Google Scholar] [CrossRef]
  67. Reddington, C.L.; McMeeking, G.; Mann, G.W.; Coe, H.; Frontoso, M.G.; Liu, D.; Flynn, M.; Spracklen, D.V.; Carslaw, K.S. The Mass and Number Size Distributions of Black Carbon Aerosol over Europe. Atmos. Chem. Phys. 2013, 13, 4917–4939. [Google Scholar] [CrossRef]
  68. Lucarelli, F.; Calzolai, G.; Chiari, M.; Nava, S.; Carraresi, L. Study of Atmospheric Aerosols by IBA Techniques: The LABEC Experience. Nucl. Instrum. Methods Phys. Res. Sect. B Beam Interact. Mater. Atoms 2018, 417, 121–127. [Google Scholar] [CrossRef]
  69. Heyder, J.; Gebhart, J.; Rudolf, G.; Stahlhofen, W. Physical Factors Determining Particle Deposition in the Human Respiratory Tract. J. Aerosol Sci. 1980, 11, 505–515. [Google Scholar] [CrossRef]
  70. Heyder, J.; Gebhart, J.; Rudolf, G.; Schiller, C.F.; Stahlhofen, W. Deposition of Particles in the Human Respiratory Tract in the Size Range 0.005–15 Μm. J. Aerosol Sci. 1986, 17, 811–825. [Google Scholar] [CrossRef]
  71. Amoatey, P.; Omidvarborna, H.; Al-Jabri, K.; Al-Harthy, I.; Baawain, M.S.; Al-Mamun, A. Deposition Modeling of Airborne Particulate Matter on Human Respiratory Tract during Winter Seasons in Arid-Urban Environment. Aerosol Sci. Eng. 2022, 6, 71–85. [Google Scholar] [CrossRef]
  72. Manojkumar, N.; Srimuruganandam, B. Age-Specific and Seasonal Deposition of Outdoor and Indoor Particulate Matter in Human Respiratory Tract. Atmos. Pollut. Res. 2022, 13, 101298. [Google Scholar] [CrossRef]
  73. Carey, M.A.; Card, J.W.; Voltz, J.W.; Arbes, S.J.; Germolec, D.R.; Korach, K.S.; Zeldin, D.C. It’s All about Sex: Gender, Lung Development and Lung Disease. Trends Endocrinol. Metab. 2007, 18, 308–313. [Google Scholar] [CrossRef]
  74. Qiu, Z.; Song, J.; Xu, X.; Luo, Y.; Zhao, R.; Zhou, W.; Xiang, B.; Hao, Y. Commuter Exposure to Particulate Matter for Different Transportation Modes in Xi’an, China. Atmos. Pollut. Res. 2017, 8, 940–948. [Google Scholar] [CrossRef]
  75. Lv, H.; Li, H.; Qiu, Z.; Zhang, F.; Song, J. Assessment of Pedestrian Exposure and Deposition of PM10, PM2.5 and Ultrafine Particles at an Urban Roadside: A Case Study of Xi’an, China. Atmos. Pollut. Res. 2021, 12, 112–121. [Google Scholar] [CrossRef]
  76. Qiu, Z.; Wang, X.; Liu, Z.; Luo, J. Quantitative Assessment of Cyclists’ Exposure to PM and BC on Different Bike Lanes. Atmos. Pollut. Res. 2022, 13, 101588. [Google Scholar] [CrossRef]
  77. Islam, M.S.; Saha, S.C.; Sauret, E.; Gemci, T.; Gu, Y.T. Pulmonary Aerosol Transport and Deposition Analysis in Upper 17 Generations of the Human Respiratory Tract. J. Aerosol Sci. 2017, 108, 29–43. [Google Scholar] [CrossRef]
  78. Feng, S.; Gao, D.; Liao, F.; Zhou, F.; Wang, X. The Health Effects of Ambient PM2.5 and Potential Mechanisms. Ecotoxicol. Environ. Saf. 2016, 128, 67–74. [Google Scholar] [CrossRef]
  79. Redaelli, M.; Sanchez, M.; Fuertes, E.; Blanchard, M.; Mullot, J.; Baeza-Squiban, A.; Garçon, G.; Léger, C.; Jacquemin, B. Health Effects of Ambient Black Carbon and Ultrafine Particles. Environ. Epidemiol. 2019, 3, 347–348. [Google Scholar] [CrossRef]
Figure 1. Location of the monitoring sites in the city of Bragança: (1) house 1, (2) house 2, and (3) house 3.
Atmosphere 14 01064 g001
Figure 2. PM10 24 h mean concentrations and ACH for the whole campaign divided by microenvironments.
Atmosphere 14 01064 g002
Figure 3. Diurnal cycle of PM10 concentrations obtained from continuous monitoring in each microenvironment: bedrooms (blue lines), the living rooms (green lines), and the kitchens (yellow lines) of houses 1, 2, and 3, respectively. Filled areas in red correspond to the associated errors.
Atmosphere 14 01064 g003
Figure 4. Black carbon concentrations for the entire campaign. BCdiff (right y-axis) represents the difference in concentrations between the lower (405 nm) and upper wavelengths (1050 nm) to characterise the contribution of biomass burning.
Atmosphere 14 01064 g004
Figure 5. Regional (head, tracheobronchial, and pulmonary) dose (µg min−1) of PM10 and BC for each microenvironment, split per dwelling and gender.
Atmosphere 14 01064 g005
Table 1. Characteristics of dwellings and specific microenvironments.
CharacteristicsHouse 1House 2House 3
BLRKBLRKBLRK
LocationResidential areaHigh-density traffic avenueApartment building/complex
OrientationYardStreetStreetStreetYardYardParkingParkingStreet
Area (m2)163030122010104020
Ventilation settingsCDSW *ODSW *ODOW *CDSW *CDCW *CDCW *CDSW *ODOW *ODCW *
Permanent occupants434
Daily occupancy (h)201424
Pets2 catsNo1 dog
Source of energy for cookingGasGasGas
Apartment floor113
* OD/CD—open doors/closed doors; OW/SW/CW—open windows/semi-open windows/closed windows.
Table 2. Input parameters in the MPPD model.
ParametersOptions/Values
Adult MaleAdult Female
Airway MorphometrySpeciesHuman
ModelYeh/Schum 5-Lobe
FRC (mL) a33002680
URT volume (mL) a5040
Particle
Properties
Density (g cm−3)1
Aspect ratio1
Diameter (µm)MMAD
Particle distributionSingle
MMADH1 = 5.96, H2 = 4.95, H3 = 7.74
GSDH1 = 2.13, H2 = 3.17, H3 = 2.82
Exposure
Scenario
Exposure conditionConstant exposure
Aerosol concentration (µg m−3)Mean of PM10
Breathing frequency (min−1) a1214
Tidal volume (mL) a750464
Inspiratory fraction0.50.5
Breathing scenarioNasal
a Reference [53]; H1 = house 1; H2 = house 2; H3 = house 3; URT—upper respiratory tract; FRC—functional residual capacity; MMAD—mass median diameter; GSD—geometric standard deviation.
Table 3. Total and regional DF of PM10 and BC.
PM10
SitesGenderTotalHeadTracheobronchialPulmonary
House 1Male0.860.730.040.09
Female0.830.690.050.08
House 2Male0.730.610.030.09
Female0.690.570.040.08
House 3Male0.790.670.030.08
Female0.760.640.040.08
BC
All housesMale0.300.100.060.14
Female0.260.080.070.11
Disclaimer/Publisher’s Note: The statements, opinions and data contained in all publications are solely those of the individual author(s) and contributor(s) and not of MDPI and/or the editor(s). MDPI and/or the editor(s) disclaim responsibility for any injury to people or property resulting from any ideas, methods, instructions or products referred to in the content.

