Article

Exploring Sources and Health Risks in Beijing PM2.5 in 2019 and 2020

1
State Key Laboratory of Environmental Criteria and Risk Assessment, Chinese Research Academy of Environmental Sciences, Beijing 100012, China
2
School of Materials Science and Chemical Engineering, Harbin Engineering University, Harbin 150006, China
3
College of Arts and Sciences, University of Cincinnati, Cincinnati, OH 45221, USA
*
Authors to whom correspondence should be addressed.
These authors contributed equally to this work.
Atmosphere 2023, 14(7), 1060; https://doi.org/10.3390/atmos14071060
Submission received: 27 April 2023 / Revised: 16 June 2023 / Accepted: 17 June 2023 / Published: 22 June 2023
(This article belongs to the Special Issue Chemical Composition and Sources of Particles in the Atmosphere)

Abstract

:
The various industries, sectors, and citizens’ daily lives have undergone significant changes after the outbreak of the COVID-19 pandemic. The researchers collected and analyzed PM2.5 samples including secondary inorganic ions (SO42−, NO3, and NH4+, namely SNA), organic carbon (OC), elemental carbon (EC), and other 16 metal elements in Beijing in 2019 (before the pandemic) and 2020 (after the pandemic). The particulate matter (PM2.5) concentration in the autumn and winter of 2020 is 21.16 µg/m3 and 14.05 µg/m3 lower than in 2019, respectively. The contribution of six sources of pollution, including coal combustion, secondary sources, transportation-related sources, dust, Industrial I, and Industrial II, were analyzed using the Positive Matrix Factorization (PMF) model. Due to the impacts of the COVID-19 pandemic, more and more people are choosing private transportation, such as private cars, instead of public transportation. As a result, the contribution of PM2.5 pollution related to transportation increased after the pandemic. The metal elements measured during the sampling period represent only a very small fraction (1%) of PM2.5. However, their health risk to humans cannot be ignored because of the toxicity of some metallic elements, and the carcinogenic risks induced by metal elements in PM2.5 exceeded the safety threshold (>10−6) during the autumn and winter of 2019 and 2020. Arsenic (As) contributes the most to carcinogenic risk, so controlling arsenic emissions is the primary approach to reducing cancer risk in Beijing. Considering the contribution to the health risk from various sources obtained in PMF, coal combustion is the most significant contributor to cancer risk. Therefore, serious consideration should be given to controlling coal combustion at the local and regional levels to reduce health risks in Beijing.

1. Introduction

PM2.5 is one of the world’s most harmful air pollutants and poses a major threat to human health [1,2]. Severe haze pollution, characterized by high concentrations of PM2.5, often occurs in urban areas of China and is particularly severe in winter due to dense natural and anthropogenic emission sources [3,4,5,6]. As an international metropolis, air quality in Beijing has become a focal point of concern, especially regarding the issue of delicate particulate matter.
The chemical composition of PM2.5 mainly consists of organic compounds, secondary inorganic ions, elemental carbon, and metal elements. The types mentioned earlier account for 54–90% of PM2.5 mass [7,8,9,10]. Although metal elements only represent a small fraction (~2–8%) of PM2.5 mass, their health risks to humans should not be ignored, because some metals are toxic [11]. Environmental metals can originate from natural sources, but those released by human activities are more toxic than naturally occurring [12,13]. Arsenic (As), lead (Pb), cadmium (Cd), hexavalent chromium (Cr6+), nickel (Ni), antimony (Sb), and their compounds have been classified as carcinogens by the International Agency for Research on Cancer (2017). The List of Air Pollutants (2018) developed by the Chinese Ministry of Ecology and Environment and the National Health and Wellness Commission includes five metal elements such as cadmium (Cd), chromium (Cr), hydrargyrum (Hg), lead (Pb), arsenic (As), and their compounds [14]. Understanding the health risks associated with the metal elements of PM2.5 and clarifying their respective sources are crucial for developing cost-effective risk mitigation strategies to protect public health. The health effects of emission sources can be analyzed by linking source profiles obtained through receptor modeling to risk assessment model [15,16].
Following the outbreak of the COVID-19 pandemic, many countries implemented strict quarantine measures to control the rampant spread of this highly contagious disease. These measures changed people’s lifestyles and work patterns and affected industrial production [17,18,19]. Recent studies have shown that the COVID-19 embargo has affected the vast majority of countries in the world, including China [20,21], the United States [22], Europe [23], Russia [24], and elsewhere [25]. Based on ground and satellite measurements, the concentrations of particulate matter (PM2.5), sulfur dioxide (SO2), and nitrogen dioxide (NO2) have dropped significantly in many cities [26,27,28].
To understand the changes in PM2.5 and metal health risks in Beijing before and after the COVID-19 outbreak, the researchers analyzed the spatial and temporal distribution of PM2.5 in Beijing in the autumn and winter of 2019 and 2020 and used the positive matrix decomposition (PMF) method to identify the sources of PM2.5. Furthermore, cancer (CR) and noncancer (NCR) risks induced by PM-bound metals were carefully assessed. Finally, the sources of trace elements and their health risks were quantified using a positive matrix decomposition (PMF) receptor model. It is understood that the COVID-19 outbreak in January 2020 led to changes in people’s lifestyles, which may affect the sources and health risks of PM2.5. Therefore, the authors have critically discussed source analysis and health risks of PM2.5 in Beijing before and after COVID-19 to provide references for studying air quality and reducing health risks after the pandemic.

2. Materials and Methods

2.1. Study Area and Sampling

The sampling site is located on the rooftop of a two-story building at the Chinese Research Academy of Environmental Sciences in Chaoyang District, Beijing (116°24′46″ E, 40°2′28″ N). As presented in Figure 1, the monitoring site is surrounded by commercial and residential areas, situated near the main urban thoroughfare, and away from industrial activities.
Air samples were collected using two BTPM-HS5 medium-sized air samplers (Liaoning Dandong Instrument Co., Ltd., Dandong), with polytetrafluoroethylene (PTFE) filters for collecting metal elements and ions (Whatman TM, 47 mm, Metastone), and quartz filters for collecting organic carbon (OC) and elemental carbon (EC) (Whatman TM, 47 mm, Metastone), at a flow rate of 16.7 L min−1. Sampling was conducted during the autumn and winter periods from October 13 to 29 and December 6 to January 8. The sampling duration was 23 h, starting from 5:00 p.m. and ending at 4:00 p.m. the next day. The researcher collected 41 samples at the sampling site, except for any sampling failures caused by power outages, equipment malfunctions, adverse weather conditions, or other unforeseen events. Before sampling, filters were heated in a muffle furnace (EYELA, Tokyo) at 500 °C for 3 h. After equilibration in a temperature-controlled (25 °C) and humidity-controlled (50%) room for 48 h, all filters were weighed before and after sampling using a microbalance with a reading accuracy of 10 μg. After weighing, samples were stored in the freezer (−18 °C) light-free membrane boxes for further analysis. The airflow rate of the sampler was calibrated before and after sampling to ensure that the instrument was operating at the specified flow rate. Stringent quality control procedures were implemented throughout the sampling process to avoid contamination.

2.2. Chemical Analysis

The PTFE filter containing the PM2.5 samples was cut into quarters and placed into a 15 mL tube containing 10 mL of ultrapure water (18.2 MΩ·cm). The samples were sonicated for about 30 min for extraction followed by filtration. The filtrate was then analyzed for secondary inorganic ions (SO42−, NO3, and NH4+) using an ion chromatography system (ICS-1100, Dionex, Sunnyvale, CA, USA).
A portion (1.5 cm2) of the quartz filters containing PM2.5 samples was used to measure the content of organic carbon (OC) and elemental carbon (EC) using a thermal/optical carbon aerosol analyzer (Model 5L, Sunset Laboratory, Tigard, OR, USA). Before measuring the samples, the instrument was calibrated by measuring 10 mL of standard sucrose solution (8.525 g/L) on blank quartz filters for OC and EC to ensure quality control. One sample from each group of 10 samples was randomly selected for repeat measurements, and the relative error of the test results was less than 10%. The blank values were subtracted from the measured OC and EC concentration values of each sample to determine their concentrations.
Fragment all quarters of the polytetrafluoroethylene (PTFE) filter containing PM2.5 samples in a 15 mL perfluoroalkoxy (PFA) pan and add a mixed acid solution (6 mL HNO3 + 2 mL H2O2 + 0.6 mL HF). Then, seal and heat at 120 °C for 20 min. After pouring out the waste acid, the pot was rinsed twice with deionized water (conductivity: 18.2 MΩ·cm) and dried using a dedicated drying apparatus. During the digestion process, 1 ampere of current was added to each sample in the vessel, followed by 6 mL of HNO3 (65% concentration, Magma Merck, Darmstadt, Germany), 2 mL of H2O2 (30% concentration, Magneto Merck, Darmstadt), and 0.6 mL of HF (40% concentration, Magneto Merck, Darmstadt). The pot was placed in a microwave digestion system and maintained at 195 °C for 50 min. After the move of digestion, the temperature inside the pot was cooled to room temperature. The digested solution was transferred to a polyethylene terephthalate (PET) plastic bottle, diluted to 50 mL with deionized water, and stored in the dark at 4 °C for analysis. The concentrations of beryllium (Be), chromium (Cr), cobalt (Co), arsenic (As), strontium (Sr), molybdenum (Mo), cadmium (Cd), stannum (Sn), antimony (Sb), cesium (Cs), tungsten (W), thallium (Tl), lead (Pb), manganese (Mn), hydrargyrum (Hg), and uranium (U) in PM2.5 and potential source materials were determined by an inductively coupled plasma mass spectrometer (Agilent 7800, USA), as described by Wang et al. (2019) [29].

2.3. Backward Trajectory

The researchers used the Hybrid Single Particle Lagrangian Integral Path (HYSPLIT) model developed by the National Oceanic and Atmospheric Administration (NOAA) to calculate the 72 h backward trajectory of the air mass arriving in Beijing. The archived Global Data Assimilation System (GDAS) provides meteorological data, and the trajectories were calculated every hour and terminated at a height of 500 m above ground level. Subsequently, a trajectory clustering analysis method was employed to group different trajectories based on their directions.

2.4. Positive Matrix Factorization (PMF) Model

The Positive Matrix Factorization (PMF) 5.0 model is provided by the U.S. Environmental Protection Agency (US EPA) is a widely used receptor model for source assignment, which can identify pollution sources with a high degree of accuracy [30]. Specific data processing methods and formulas can be found in the US EPA PMF 5.0 fundamentals and user guide [31]. If the concentration of the input element is greater than the detection limit (MDL), the uncertainty (Unc) is calculated as follows:
Unc = ( Concentration   ×   EF ) 2 + MDL 2
where EF is the relative error fraction (5%) summed in quadrature. If the concentration is less than the detection limit (MDL), half of the detection limit is used for the concentration, and 5/6 of the detection limit is regarded as the uncertainty.

2.5. Health Risk Assessment

Daily intake (DI, mg/kg/day) of PM2.5 metal elements was estimated by ingestion (DIinh), dermal contact (DIderm), and inhalation (DIing) [11,32,33].
DI inh = C   ×   ET × EF × ED AT 1
DI derm = C   ×   SA × AF × ABS × EF × ED BW × AT 2   ×   CF
DI ing = C   ×   IngR × EF × ED BW × AT 2   ×   CF
where C is the arithmetic mean concentration of the elements in PM2.5 (μg/m3). The value details of other parameters are in Table 1, and their calculations are in the Supplementary Materials.
Canaerrisk ( CR ) = ( DI inh   ×   IUR ) + ( DI dermal   ×   SF o GIABS ) + ( DI ing   ×   SF o )
HazardQuotient ( HQ ) = DI inh RfC i × 1000 ug / mg + DI dermal RfD o × GIABS + ( DI ing / RfD o )
In formula (6), IUR is the unit of inhalation risk (μg/m3). SFo is the slope factor (mg/(kg day))−1, and GIABS is the gastrointestinal absorption factor (1 in this study). In formula (7), RfCi is the inhalation reference concentration (mg/m3); RfDo is the oral reference dose, mg/(kg·day). Tables S3–S5 list all relevant parameters for PM metal-induced cancer risk and noncancer risk [34,35].
Due to differences in valence and toxicity, this study estimated the concentration of Cr6+ to be 1/7 of the Cr concentration in the health risk calculation [36,37].

3. Results and Discussion

3.1. PM2.5 Mass Concentrations

Compared to 2019, the concentration of PM2.5 in 2020 has decreased. In Figure 2, the concentrations of PM2.5 in autumn were significantly reduced from 59.23 μg/m3 to 38.07 μg/m3, while decreased from 63.26 μg/m3 to 49.21 μg/m3 in winter. During this period, PM2.5 concentrations in the autumn and winter decreased by 36% and 22%, respectively, but the average concentration of PM2.5 was still 1.5 to 2.5 times higher than the daily reference value (25 μg/m3) recommended by the World Health Organization. Like many northern areas of China, PM2.5 concentrations remain high in winter due to unfavorable weather conditions and increased emissions from coal burning for heating by residents [38].
In 2019 and 2020, the total concentrations of secondary inorganic ions, including SO42−, NO3, and NH4+, were 21.05 μg/m3 and 16.90 μg/m3, accounting for 34% and 39% of PM2.5 respectively. When the concentration of SNA decreases, its proportion in PM2.5 increases, revealing that the formation of secondary aerosols contributes more to PM2.5 pollution in Beijing. The researcher calculated the Sulphur oxidation rate (SOR) and Nitrogen oxidation rate (NOR) for two years in autumn and winter, which represents the degree of transformation of SO2 and NO2 to secondary ions SO42− and NO3. The higher values of SOR and NOR indicate a higher degree of secondary transformation. The emissions of NO2 remained stable in 2019 and 2020. Meanwhile, there was little change in NOR in the autumn and winter of both years, with values of 0.13 in autumn and 0.17 and 0.18 in winter. The SO2 concentrations in 2020 show an increasing trend. In the fall and winter of 2019, SO2 concentrations were 2.47 and 6.51 but increased to 4.24 and 7.04 in 2020, respectively. The SOR values in 2020 were lower compared to 2019, with values of 0.52 and 0.29 in autumn and 0.49 and 0.41 in winter for 2019 and 2020 respectively. As a result, the concentration of SO42− decreased in 2020. SOR was dramatically influenced by temperature and humidity. Higher temperature and humidity give rise to the conversion of SO2 to SO42− [39]. Although the temperature difference between the autumn and winter of 2019 and 2020 was not significant, the relative humidity in the autumn of 2019 was 21.9% higher than that of 2020 (relative humidity data for the winter of 2020 were missing). Thus, despite an increase in precursor SO2 emissions, there was a downward trend of SO42− concentrations, presumably due to the higher relative humidity in 2019 that facilitated the secondary transformation of SO2.
The concentrations of organic carbon (OC) and elemental carbon (EC) remained relatively stable in 2019 and 2020, with OC of 9.09 and 8.12 μg/m3, and EC of 1.64 and 1.59 μg/m3. Additionally, the authors calculated the correlation and ratio between OC and EC. The correlation between OC and EC was strong in 2019 and 2020, with R2 values of 0.96 and 0.99 in autumn, and 0.95 and 0.92 in winter, indicating similar sources for OC and EC. The OC/EC ratio ranged from 4.5 to 8.0, with an average ratio of 6.78 ± 1.5. Furthermore, the proportion of secondary inorganic ions in PM2.5 was relatively high, suggesting that secondary sources may be the significant contributors to OC and EC levels [40].
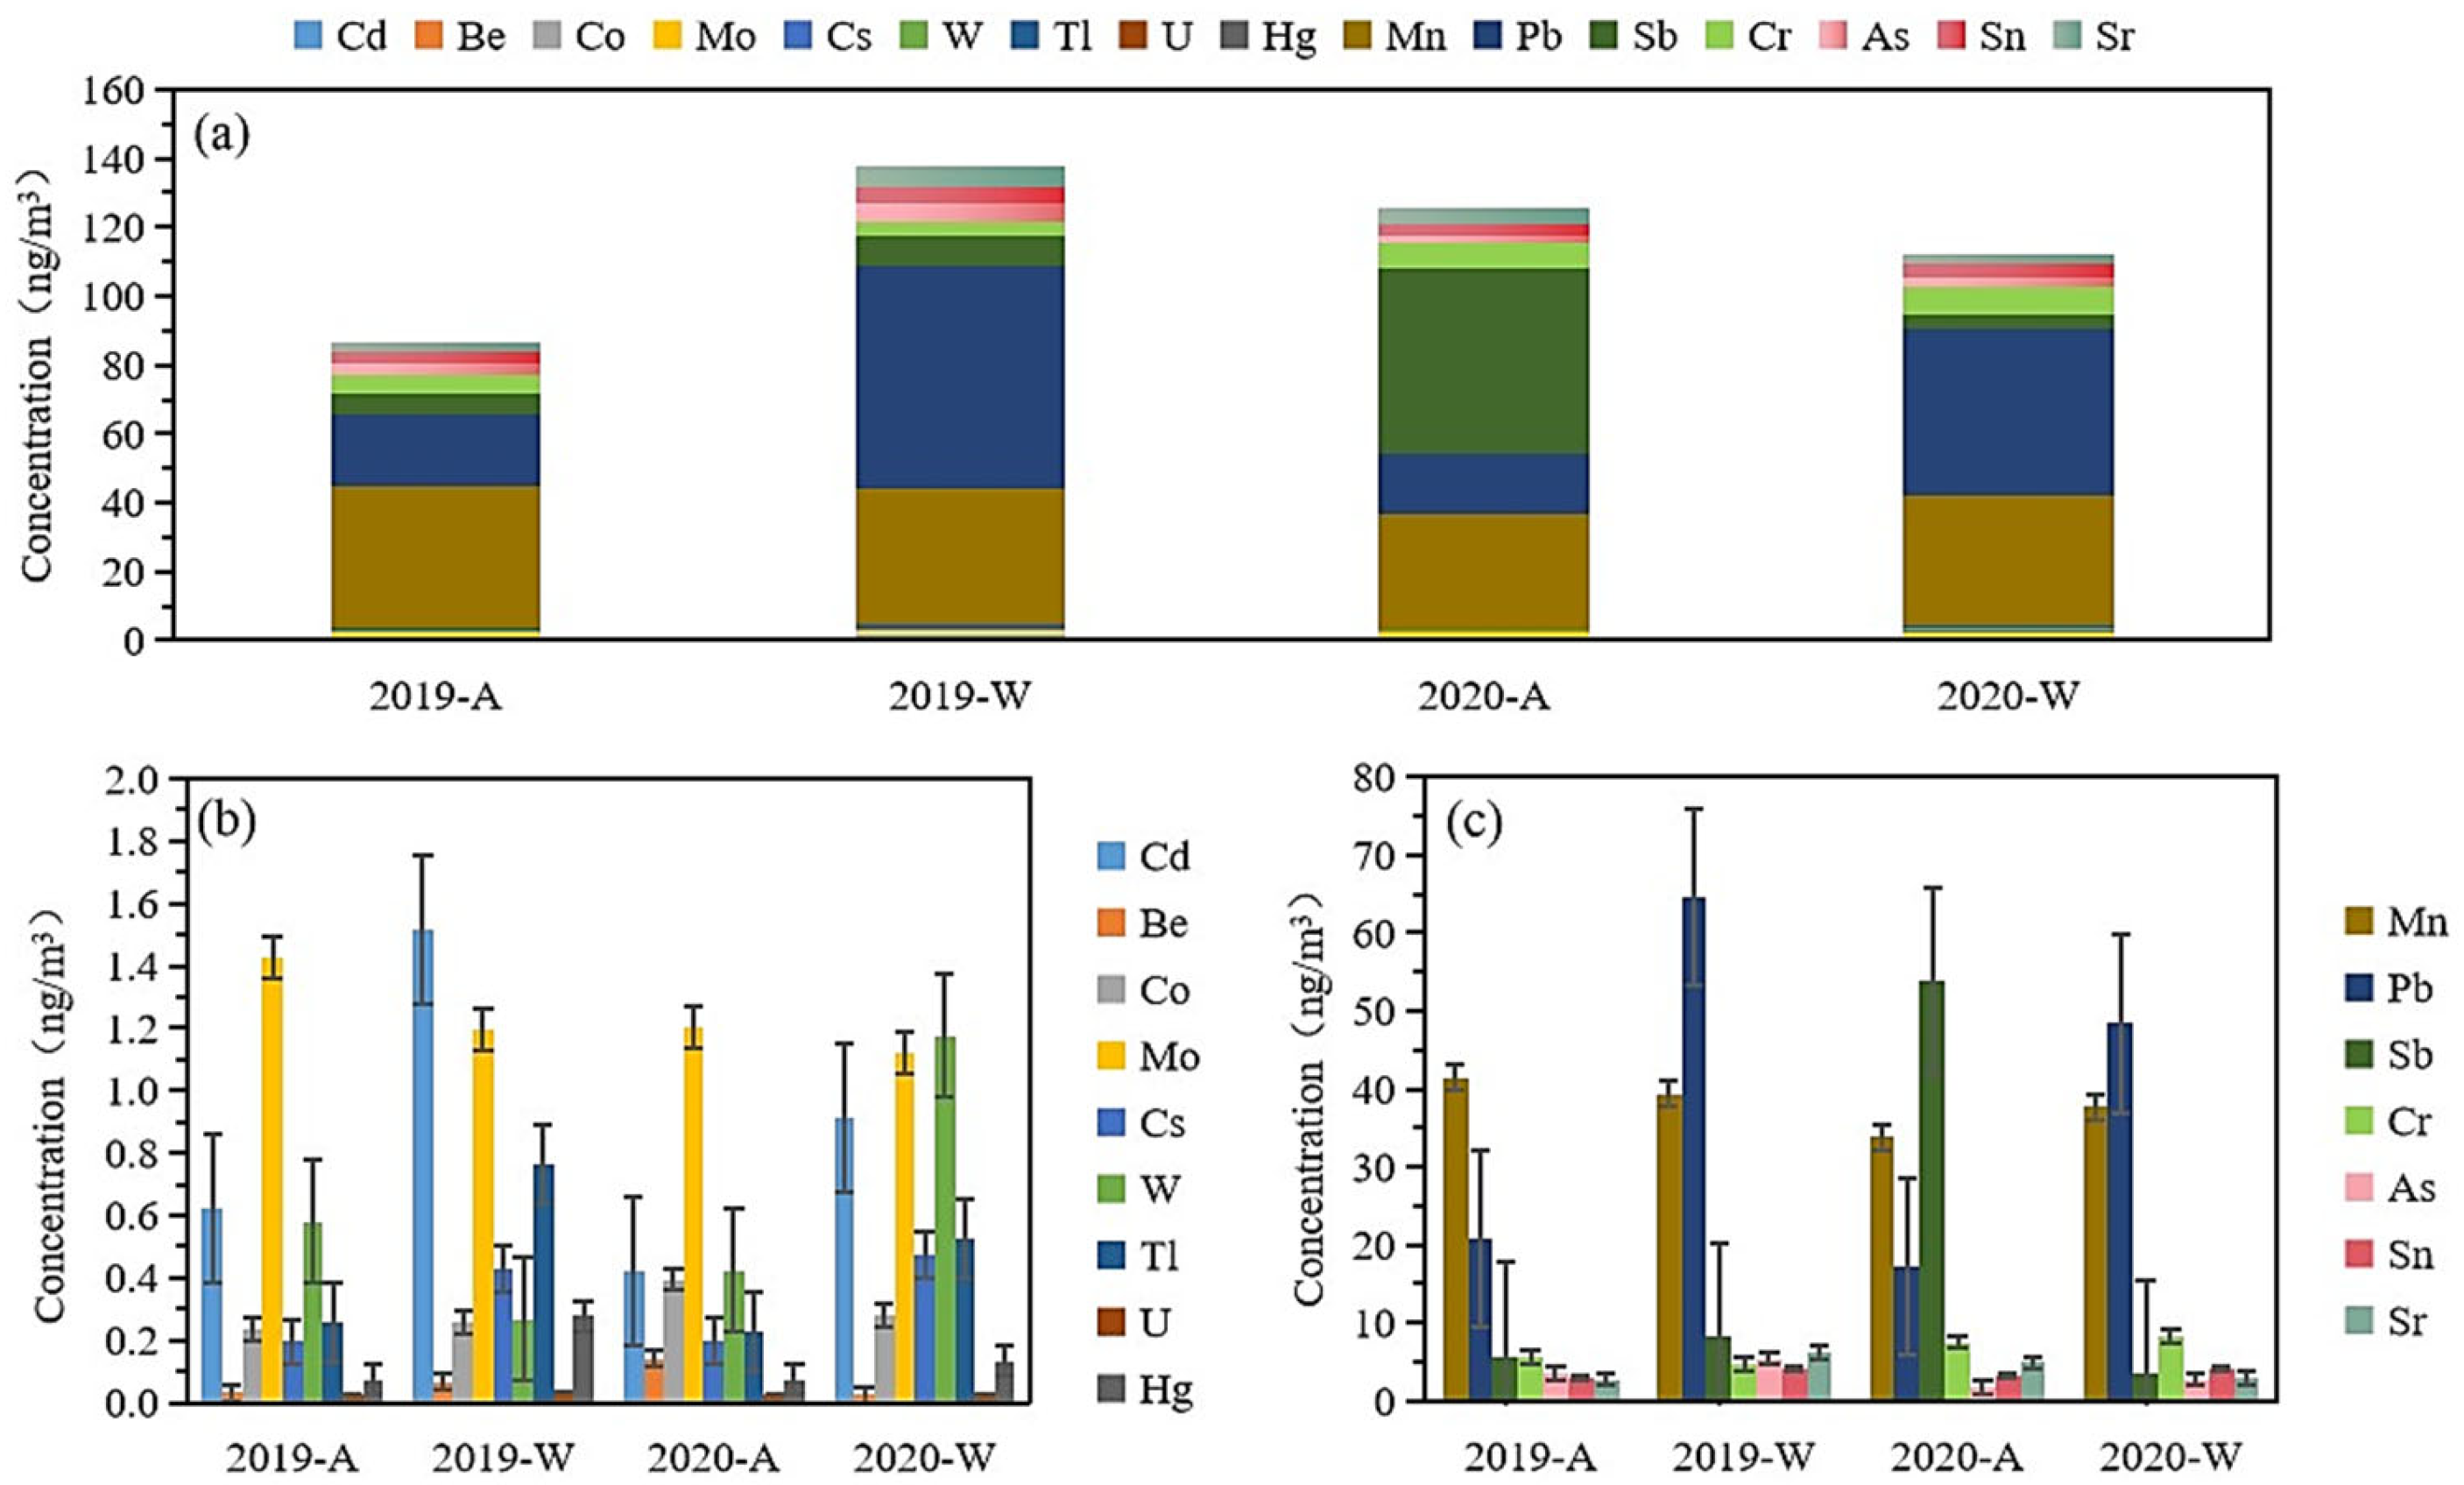
Figure 3 presents the average concentrations of metal elements in different seasons. On average, the relative abundance of the analyzed elements in PM2.5 was around 1%. The concentrations of metal elements in the autumn of 2020 showed an increase compared to 2019. It is mainly because of Sb, which dramatically rose from 5.74 ng/m3 in 2019 to 53.85 ng/m3 in 2020. In winter, the concentration of metal elements decreased, of which Pb showed the largest reduction from 64.67 ng/m3 to 48.37 ng/m3. Pb in Beijing is mainly attributed to industrial coal combustion and coal burning for winter heating [13]. The decrease in Pb concentration suggests reducing coal consumption in Beijing and the surrounding areas in 2020. The concentrations of metal elements were higher in winter than those in autumn. The elevated concentrations of these metal elements in winter may be derived from the combined effects of increased anthropogenic emissions and adverse meteorological conditions [27]. The concentration of As was higher in winter than in autumn, which is consistent with the increased use of coal for heating during winter [41]. The annual and seasonal variations of metal elements indicate that different years, weather conditions, and sources of PM2.5 can influence their composition and health risks.
As shown in Figure 4, high wind speeds can accelerate the dispersion of PM2.5, which is conducive to reducing PM2.5 concentrations. On the other hand, low wind speeds can result in the accumulation of PM2.5, and most strong winds in the study area are from the north direction. Furthermore, high levels of PM2.5 are consistent with an increase in relative humidity, indicating that humid air is one of the important factors contributing to haze formation [42]. The significant increase in concentrations of metals is related to the great enhancement in PM2.5, confirming the findings of Huang et al. (2018) [43]. The occurrence of peak PM2.5 levels is accompanied by an increment in secondary ion concentrations. Studies have shown that secondary inorganic aerosols contribute most to the mass of PM2.5 during periods of haze in Beijing [44,45].

3.2. Source Analysis

PMF analysis using a large number of measured chemical components (Section 2.2) identified six potential source factors, including (1) coal combustion, (2) secondary aerosol formation, (3) traffic-related, (4) dust, (5) Industrial I, and (6) Industrial II. All factors were reflected in >90% of bootstrap (BS) runs (Table S8), and no factor swapping was observed in the displacement (DISP) analysis. It shows that the analysis result of PMF is reasonable and accurate.
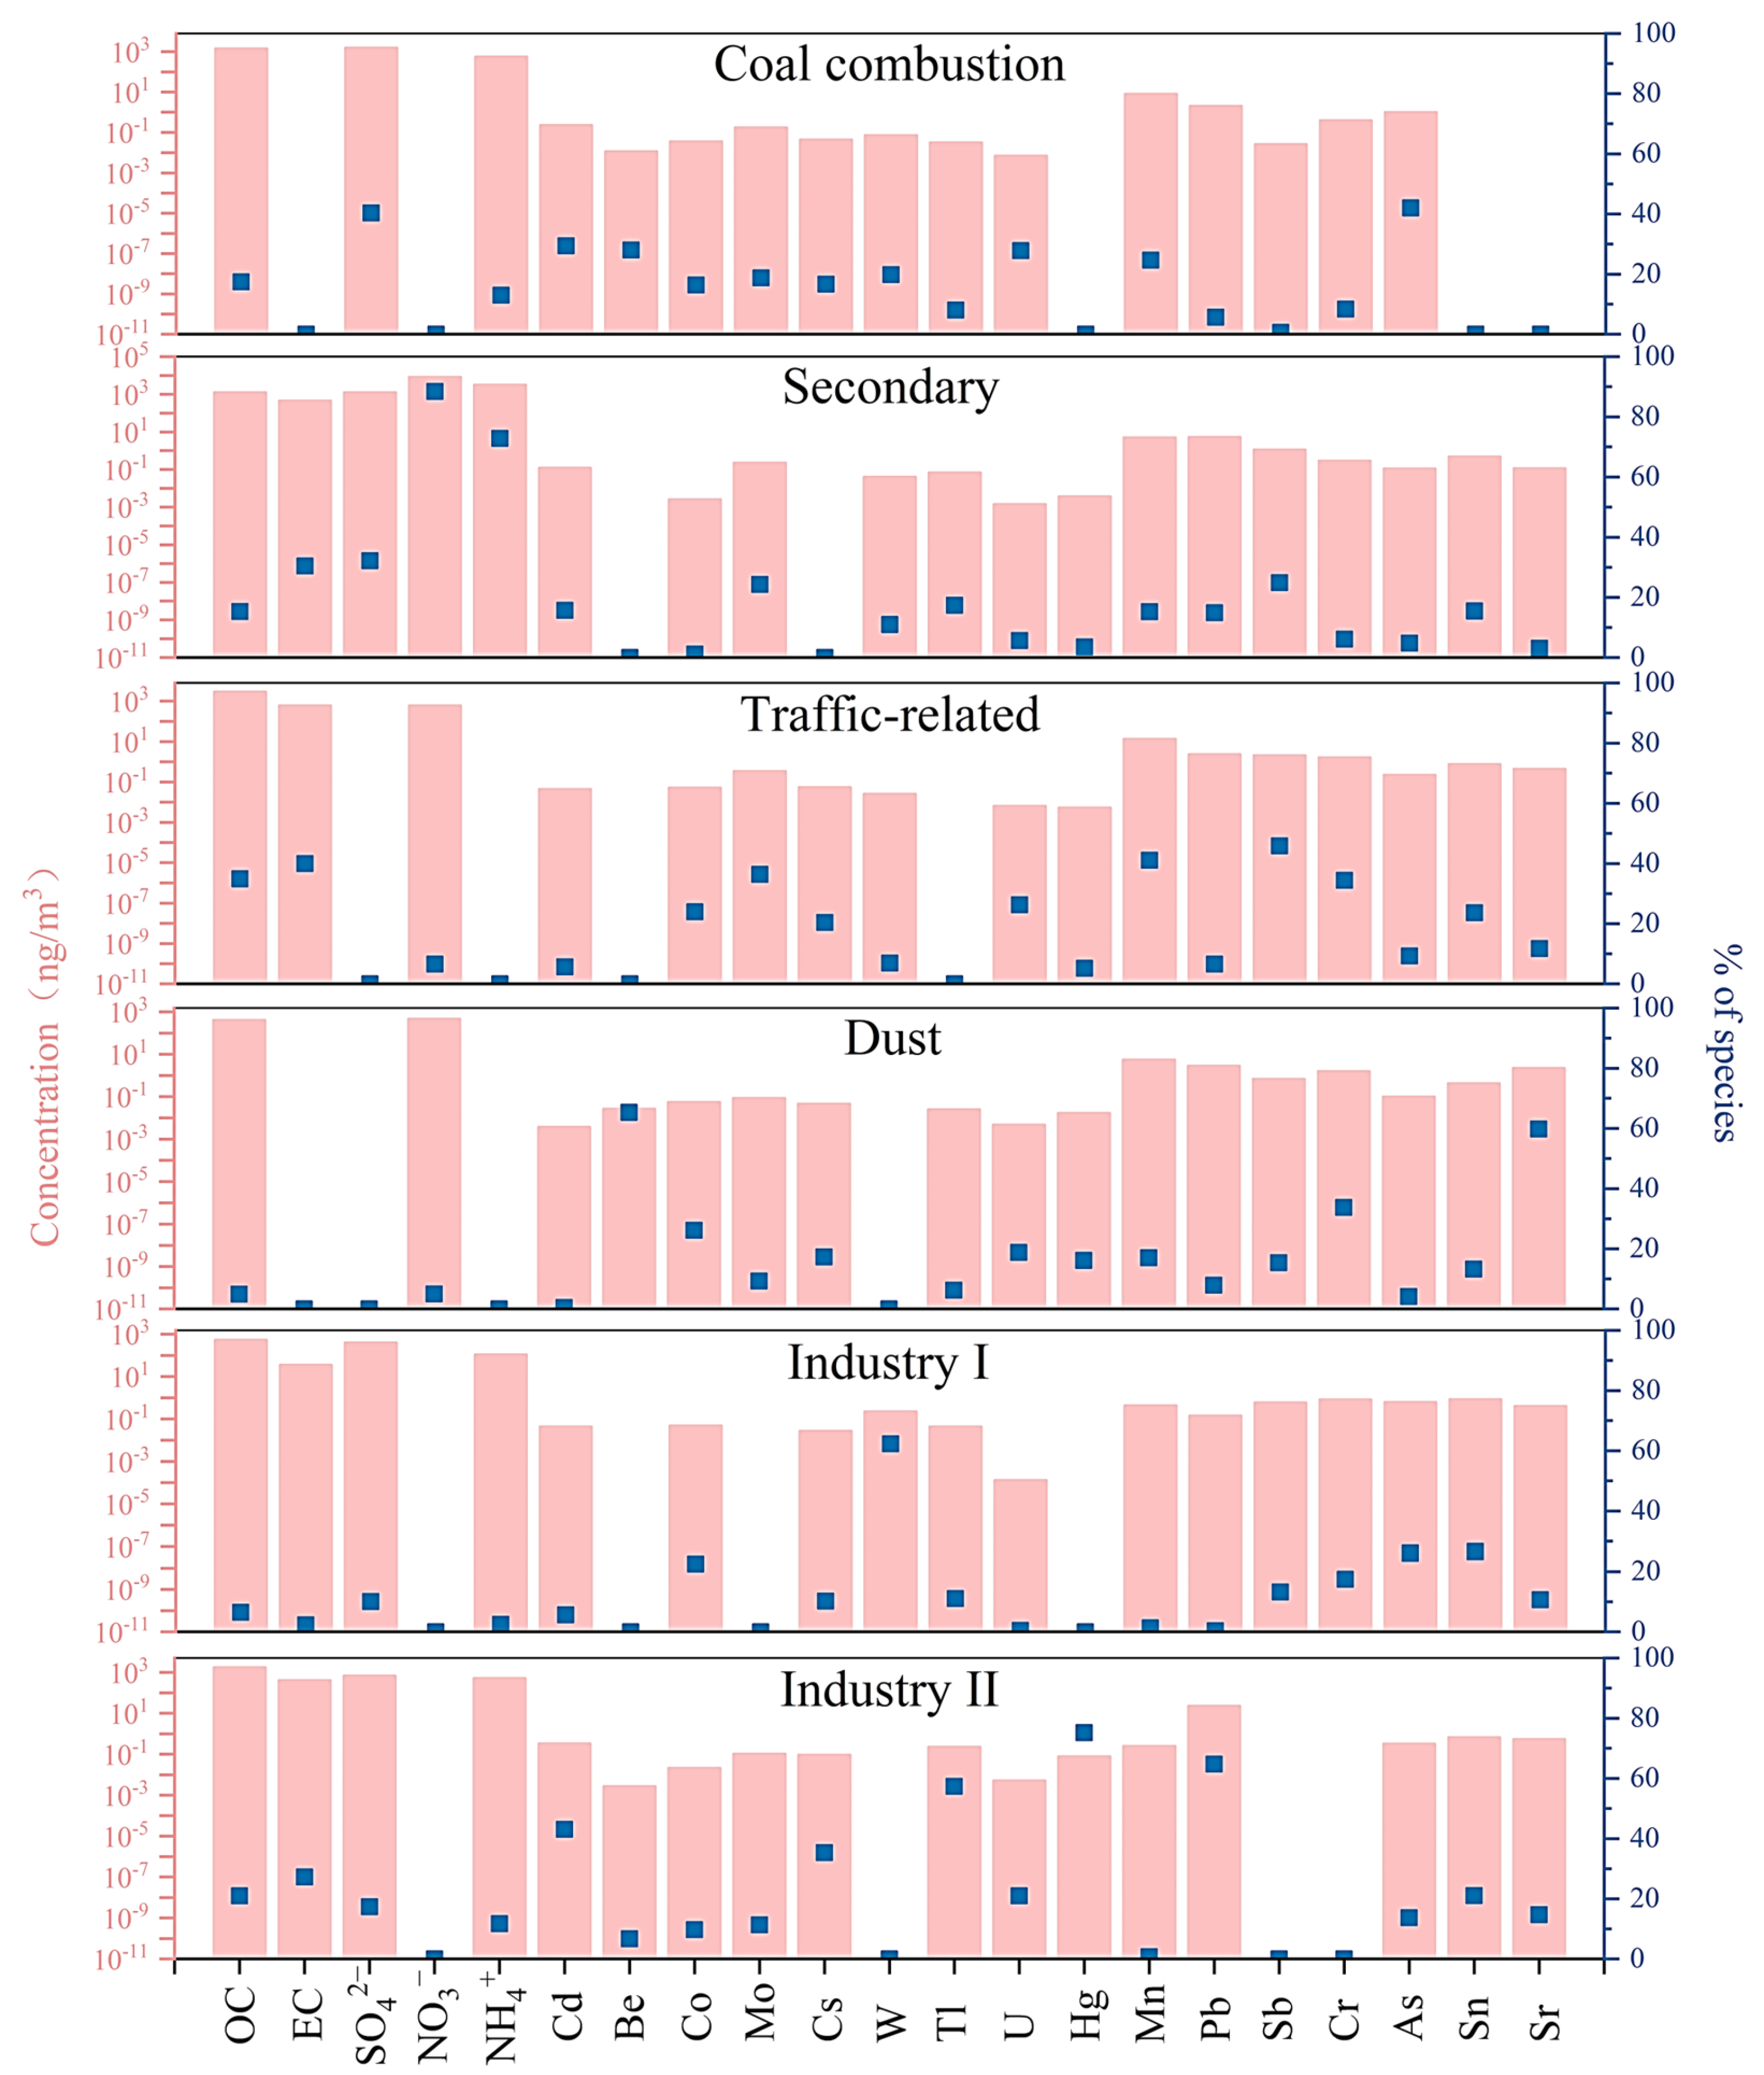
Figure 5 illustrates the source factor profiles (% of species total). The first factor is dominated by As and SO42−, contributing 42% and 40%, respectively. As is a typical tracer for coal combustion [46], while SO42− is primarily contributed by coal combustion [47]. Factor 2 shows high loadings of NO3 (88%), NH4+ (73%), and SO42− (32%), as well as moderate abundances of OC and EC, which are typical profiles of secondary sources. Previous studies have suggested that secondary aerosols are formed by the oxidation of precursor gases such as NOx and SO2 emitted from vehicle exhaust, biomass burning, and coal combustion, and NH3 emissions from agricultural activities [48]. Some chemicals such as OC (35%), EC (40%), Sb (46%), Mn (41%), Mo (36%), and Cr (34%) dominated Factor 3. Mn can be released from lubricating oil, wear or brake dust, or diesel engines of vehicles [49]. Cr, Mo, and Sb are also found in brake wear [50]. The ratio of OC to EC is consistent with the traffic-related sources. Factor 4 is dominated by Be (65%) and Sr (60%), and Be is mainly influenced by natural sources, usually from natural dust [29]. Some studies have reported that environmental Sr is linked to emissions from municipal solid waste incinerators [51]. W (62%) is the central part of Factor 5, and Hg (75%), Pb (65%), Tl (57%), and Cd (43%) prevail in Factor 6. Factors 5 and 6 explain the abundance of metals and are therefore referred to as Industrial I and Industrial II. Industrial emissions generally include elements involving multiple processes, such as fossil fuel combustion, mechanical wear, and metal smelting [52,53]. Factor 5 may be associated with alloy industries or mineral production sources related to W [26]. In addition, Cd and Pb from iron ore and steel industries have also been reported [54]. Tl is significantly enriched in industrial areas and widely used as an indicator of industrial processes [55]. Since the ban on leaded gasoline in China in 2000, coal combustion has become the primary source of Pb aerosols [56]. Therefore, Pb mainly comes from coal burning in industrial processes. The presence of extensive leather and metal coating industries near Beijing verifies the interpretation of this source.
The concentrations and contributions for each source in the fall and winter were estimated in Figure 6. The higher contribution of coal combustion in winter compared to fall is due to the heating demand in northern China during winter. In 2020, the contribution of coal combustion sources decreased since a series of control measures were applied in Beijing, involving the shutdown of coal-fired power plants, the promotion of clean energy alternatives to coal, and upgrades of coal-fired boilers [57]. As a result, the contribution of secondary sources in autumn 2020 was lower than in 2019. According to the analysis, there could be two possible reasons for this decrease. First, we calculated the NOR and SOR for both years, with values of 0.13 and 0.13 for NOR, and 0.52 and 0.29 for SOR in 2019 and 2020. The lower SOR in 2020 could be a possible reason for the decrease in secondary contribution in autumn 2020. Second, the studies have indicated that local power generation and transportation from the southern regions are essential ways for secondary pollution in Beijing. The proportions of air masses from the southwest in autumn were 40% and 36% in 2019 and 2020, respectively. The decrease in the proportion of air masses from the southwest direction could be another reason for the reduction in secondary contribution in autumn 2020. In both years, the contribution of traffic-related sources was lower in the winter compared to the fall, and the contribution from transportation-related sources increases in the fall of 2020 while remaining constant for winter. Vehicles are a prominent local pollution source in Beijing [58,59,60]. Local traffic-related emissions are generally thought to have decreased after the COVID-19 pandemic [61], implying that the situation in Beijing may be more complex after the pandemic. According to the “Beijing Traffic Development Report 2020”, private car usage in Beijing increased due to the impact of the pandemic and then caused higher overall traffic volume in contrast with 2019. The contribution of Industrial I remained similar in both autumn seasons but increased in the winter of 2020. The contribution of Industrial II was significantly higher in winter than in autumn. Based on backward trajectory cluster analysis (Figure S2), Beijing was more influenced by northwest air masses in winter, with a higher proportion of air masses from the northwest direction in 2020 compared to 2019. Metallurgy, machinery manufacturing, and power generation industries are widely distributed in northwest Beijing, including Shijiazhuang, Hohhot, and Baotou.

3.3. Health Risk Assessment

This section assesses the cancer/noncancer risk of ingestion, dermal contact, and inhalation based on the measured concentration of metal elements. The acceptable risk value for CR is 1 × 10⁻⁶ [62]. HQ values greater than 1 denote a significant risk of noncarcinogenic effects [62].
In 2019, the carcinogenic risks associated with inhalation, ingestion, and dermal contact with metal elements exceeded the threshold of 1 × 10⁻⁶, except for the risk of children inhaling carcinogens (Tables S6 and S7). Cr was found to be the metal that contributed the most to carcinogenic risk through inhalation, while As was the central metal inducing carcinogenic risk through ingestion and dermal contact. As was also found to be the foremost metal affecting the Hazard Quotient (HQ) values through all three exposure pathways. Ingestion was identified as the primary pathway affecting carcinogenic risk (CR) and HQ values. The results demonstrated that the CR and HQ values of metals in particulate matter (PM) from ingestion and dermal contact were similar or even higher than those from inhalation. Among the three exposure pathways, ingestion had the most significant impact on children, contributing to over 90% of the total CR value. For adults, dermal contact accounted for approximately 60% of the total CR value. Regarding noncarcinogenic risk, ingestion remained the dominant pathway for children, which contributes to about 87% of the total HQ value. Inhalation had the greatest impact on noncarcinogenic risk for adults, accounting for approximately 65% of the total HQ value. Since many previous studies have only assessed the health risks of inhalation, this may have led to an underestimation of CR and HQ values of PM metals. Therefore, the researchers insistently emphasize the need to consider ingestion, dermal contact, and inhalation when assessing the health risks of exposure to particulate matter in the environment, since all three pathways play significant roles.
Table 2 presents Beijing’s CR and HQ values during the autumn and winter of 2019 and 2020, respectively. The results indicate that the total CR values for both years exceeded the acceptable value of 1 × 10⁻⁶. Compared to other cities, the CR values were higher than Taiyuan (3.1 × 10⁻⁶) and Shanghai (6.6 × 10⁻⁶) [63,64], but lower than those Beijing’s winter values in 2018 (1.4 × 10⁻⁴) [11]. The overall carcinogenic and noncarcinogenic risks of PM2.5-bound metals were higher in children than in adults. Thus, PM2.5-bound metals pose a greater threat to children than to adults. In addition, carcinogenic and noncarcinogenic risks were higher in winter, which means a greater threat from PM2.5-bound metals during the winter. The carcinogenic and noncarcinogenic risks decreased from 2019 to 2022. As was the significant species affecting carcinogenic and non-carcinogenic risks in this study. Compared to 2019, the carcinogenic and noncarcinogenic risks associated with As decreased in 2020, and As contributed to approximately 80% of the cancer risk, which is also the reason for the decrease in cancer risk in 2020. There is a need to reinforce controls on emissions of arsenic resulting from coal combustion. The further reduction of carcinogenic risk of As in 2020 demonstrates the effectiveness of Beijing’s coal restriction policy, but joint prevention and control measures in surrounding areas still need to be strengthened.
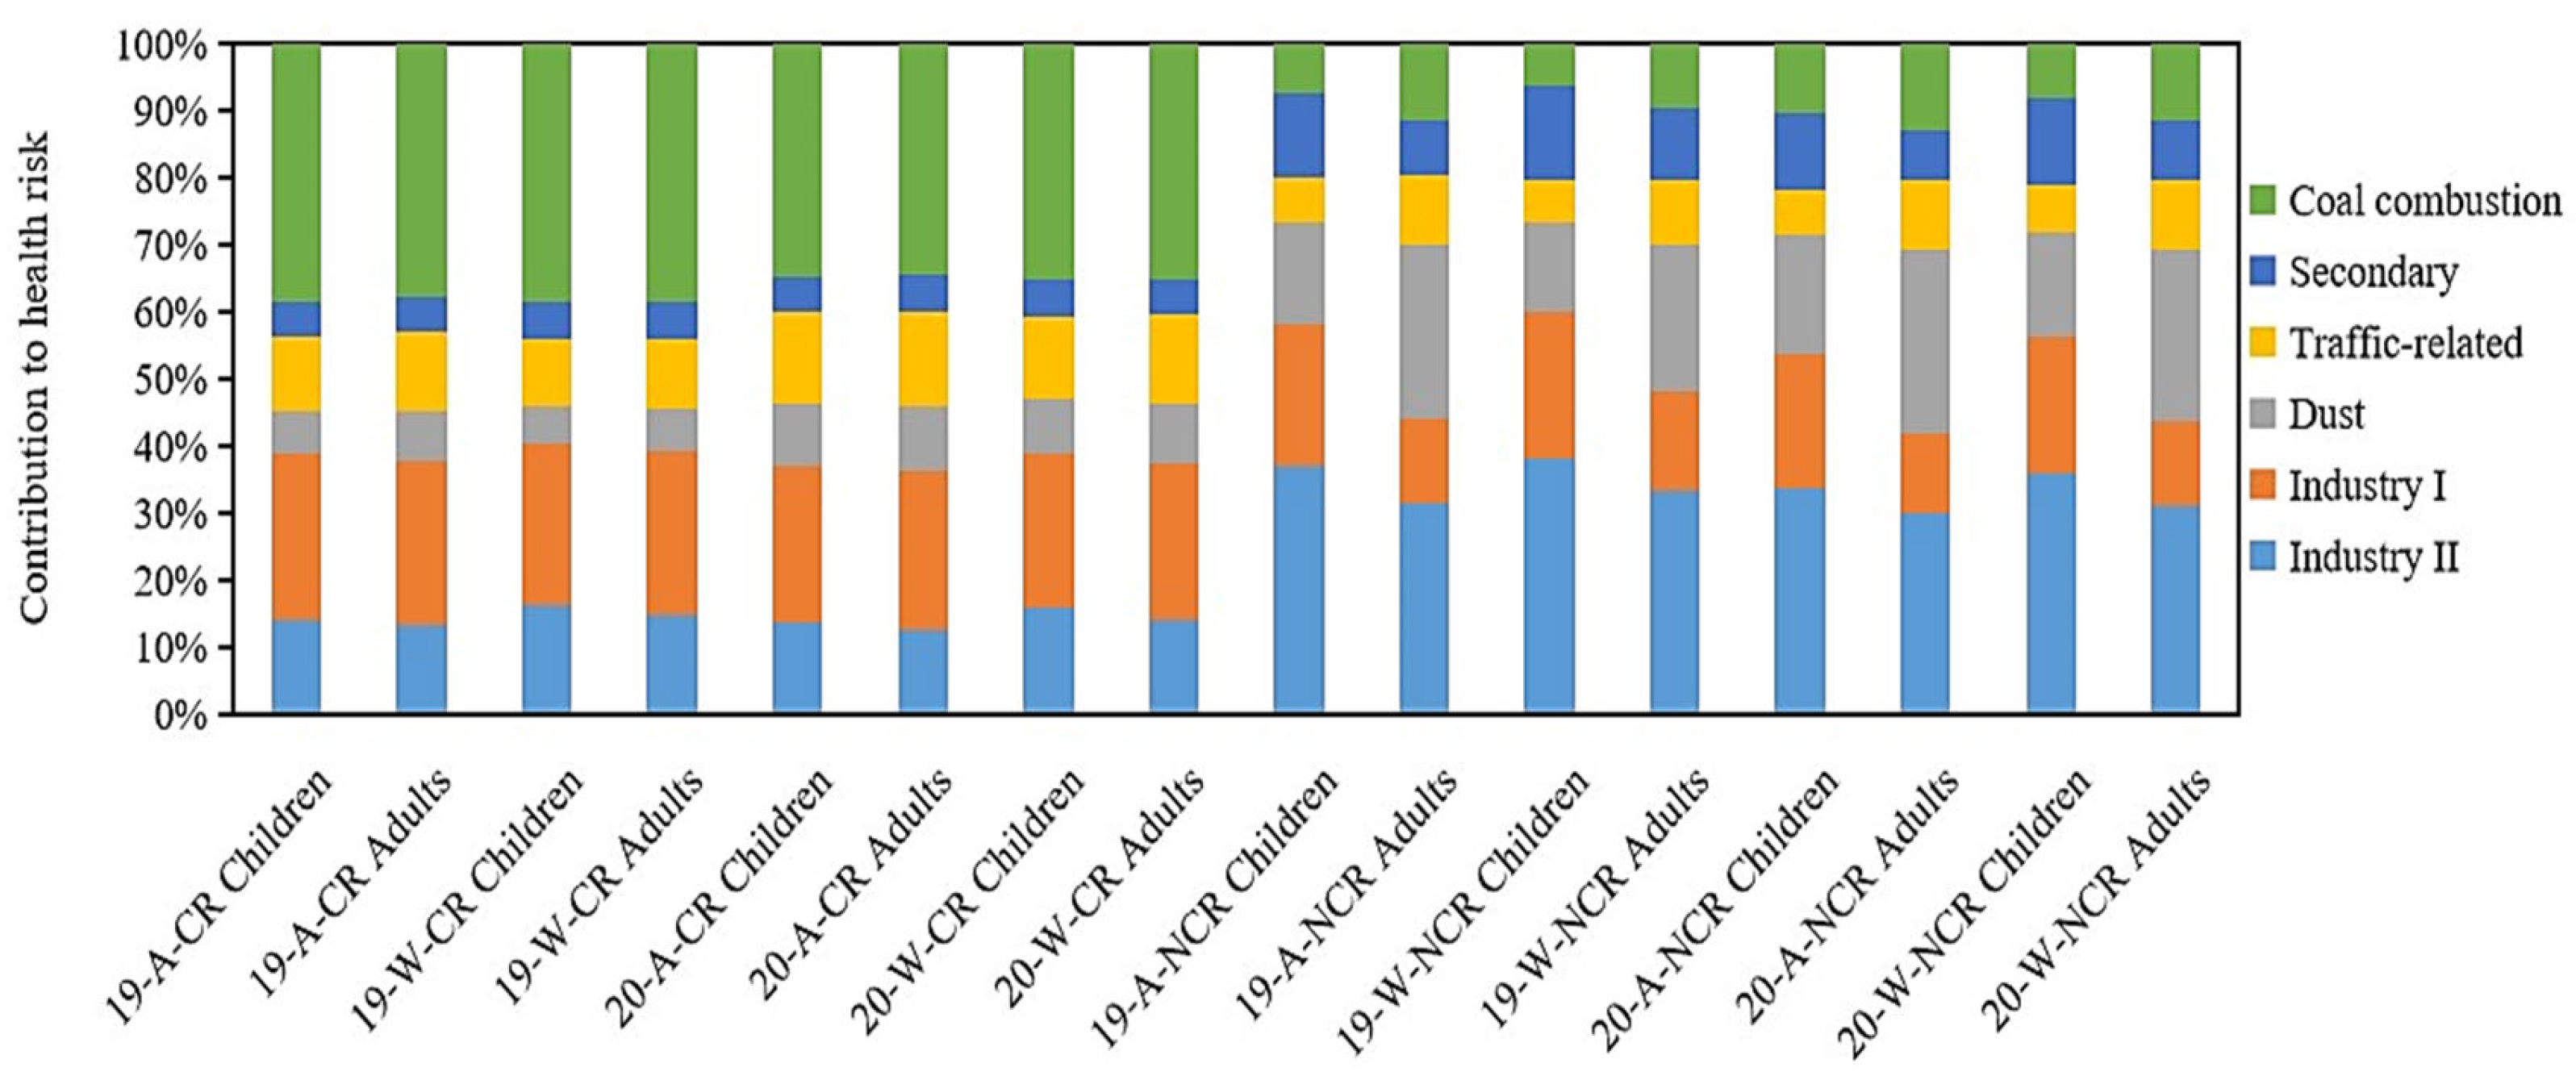
In this section, the researchers combine estimated health risk scores with PMF-parsed source profiles to quantify potential sources of CR and NCR. The calculation methods and meanings of each parameter can be found in Fan et al. (2021) [11]. As shown in Figure 7, although the overall health risk decreased in 2020 compared to 2019, the relative contributions of different sources to health risk did not change significantly over the two years. Coal combustion has been regarded as a major source of PM haze in Beijing, accounting for a large proportion of trace elements in polluted air (58%) [65]. The Beijing municipal government has implemented measures to control coal consumption since 2013 and forbade the use of residential coal heating in the winter of 2018. These control measures have reduced the concentrations of gaseous pollutants such as SO2 and NOx and degraded the concentrations of PM2.5-bound metals, thus reducing health risks [11]. In this study, the contribution of coal combustion to carcinogenic and noncarcinogenic risks was approximately 50% in 2019 and around 28% in 2020. These results make known that the ban on coal use has improved the air quality in Beijing and reduced the threat to human health.

4. Conclusions

There is no doubt that COVID-19 deeply affects the population’s daily life. In this study, the researchers identified the sources and health risks of PM2.5 in the autumn and winter of 2019 and 2020. The results showed that PM2.5 pollution levels were lower in 2020 compared to 2019. Six sources of PM2.5, including coal combustion, secondary sources, traffic-related emissions, dust, Industrial I, and Industrial II, were identified using Positive Matrix Factorization (PMF). Coal burning and traffic-related emissions are the main causes of PM2.5 pollution. The contribution of coal combustion decreased in 2020, denoting that Beijing’s coal consumption control policies have been effective. However, regional joint prevention and control measures still need to be strengthened. Due to the impact of the pandemic, personal travel in Beijing rose in 2020, leading to an increase in traffic-related emissions, and regional air masses mainly influenced industrial emissions. According to the data, the carcinogenic risk (CR) and hazard quotient (HQ) values for metals in PM2.5 from ingestion and skin contact are similar to or even higher than those from inhalation. Therefore, the researchers emphasize that when assessing health risks from exposure to environmental PM2.5, ingestion, dermal contact, and inhalation should all be considered. The cancer risk from PM2.5-bound metals in Beijing should be given attention, especially regarding its potential impact on children. Furthermore, the combined carcinogenic and noncarcinogenic risks of metals are higher in winter than in autumn, indicating a more significant potential impact on health during winter. As is the metal that contributes the most to the carcinogenic risk. Hence, controlling arsenic emissions is a key approach to reducing cancer risk in Beijing. The ban on coal combustion has improved air quality in Beijing and reduced the threat to human health.

Supplementary Materials

The following supporting information can be downloaded at: https://www.mdpi.com/article/10.3390/atmos14071060/s1, Figure S1: OC, EC correlation. (a–d) the linear regression of OC and EC in autumn/winter 2019 and autumn/winter 2020, respectively; Figure S2: 2019, 2020 autumn and winter backward trajectory cluster map. (a–d) backward trajectory clustering for autumn/winter 2019 and autumn/winter 2020, respectively; Figure S3: (a) Absolute concentrations and (b) relative contributions of the various emission sources to the total measured elements during the sampling period; Table S1: Detailed data on the evaluation of health risk posed by toxic elements in PM2.5; Table S2: Carcinogenic and non-carcinogenic risks contributed by six emission sources exposure to PM2.5 in autumn 2019 Beijing; Table S3: Carcinogenic and non-carcinogenic risks contributed by six emission sources exposure to PM2.5 in autumn 2019 Beijing; Table S4: Carcinogenic and non-carcinogenic risks contributed by six emission sources exposure to PM2.5 in autumn 2020 Beijing; Table S5: Carcinogenic and non-carcinogenic risks contributed by six emission sources exposure to PM2.5 in winter 2020 Beijing; Table S6: Carcinogenic and non-carcinogenic risks of the various toxic elements through inhalation, ingestion and dermal contact pathways in autumn; Table S7: Carcinogenic and non-carcinogenic risks of the various toxic elements through inhalation, ingestion and dermal contact pathways in winter; Table S8: Bootstrapping (BS) mapping for 6-factor solution in BeiJing; Table S9: The concentration of SO42−, SO2, NO3, NO2 and the value of SOR and NOR.

Author Contributions

J.Y.: writing—original draft, investigation, conceptualization, methodology, formal analysis. H.Z.: investigation, conceptualization, writing—review and editing. Y.J.: writing—review and editing. P.Z.: resources, methodology. Z.W. (Ziqi Wang): writing—review and editing. C.G.: resources. Z.W. (Zhanshan Wang): resources, methodology. Q.W.: resources. Y.C.: resources. Y.W.: resources, project administration, funding acquisition. X.L.: supervision, conceptualization, resources, writing—review and editing. All authors have read and agreed to the published version of the manuscript.

Funding

This research received no external funding.

Acknowledgments

This work was supported by the project of Investigation and Research on Environmental and Health Issues (EH(2023)-04-03).

Conflicts of Interest

The authors declare that there is no conflict of interest regarding the publication of this paper.

References

  1. Liu, Y.; Zhan, J.; Zheng, F.; Song, B.; Zhang, Y.; Ma, W.; Hua, C.; Xie, J.; Bao, X.; Yan, C.; et al. Dust emission reduction enhanced gas-to-particle conversion of ammonia in the North China Plain. Nat. Commun. 2022, 13, 6887. [Google Scholar] [CrossRef] [PubMed]
  2. Li, H.; Hart, J.E.; Mahalingaiah, S.; Nethery, R.C.; Bertone-Johnson, E.; Laden, F. Long-term exposure to particulate matter and roadway proximity with age at natural menopause in the Nurses’ Health Study II Cohort. Environ. Pollut. 2021, 269, 116216. [Google Scholar] [CrossRef] [PubMed]
  3. Li, J.; Mao, M.; Li, J.; Chen, Z.; Ji, Y.; Kong, J.; Wang, Z.; Zhang, J.; Wang, Y.; Liang, W.; et al. Oral Administration of Omega-3 Fatty Acids Attenuates Lung Injury Caused by PM2.5 Respiratory Inhalation Simply and Feasibly In Vivo. Int. J. Mol. Sci. 2022, 23, 5323. [Google Scholar] [CrossRef] [PubMed]
  4. Gouveia, N.; Kephart, J.L.; Dronova, I.; McClure, L.; Granados, J.T.; Betancourt, R.M.; O’Ryan, A.C.; Texcalac-Sangrador, J.L.; Martinez-Folgar, K.; Rodriguez, D.; et al. Ambient fine particulate matter in Latin American cities: Levels, population exposure, and associated urban factors. Sci. Total Environ. 2021, 772, 145035. [Google Scholar] [CrossRef]
  5. Wang, Q.; Wang, J.; He, M.Z.; Kinney, P.L.; Li, T. A county-level estimate of PM2.5 related chronic mortality risk in China based on multi-model exposure data. Environ. Int. 2018, 110, 105–112. [Google Scholar] [CrossRef]
  6. Shen, G.; Tao, S.; Wei, S.; Zhang, Y.; Wang, R.; Wang, B.; Li, W.; Shen, H.; Huang, Y.; Chen, Y.; et al. Emissions of parent, nitro, and oxygenated polycyclic aromatic hydrocarbons from residential wood combustion in rural China. Environ. Sci. Technol. 2012, 46, 8123–8130. [Google Scholar] [CrossRef]
  7. Rogula-Kozłowska, W. Size-segregated urban particulate matter: Mass closure, chemical composition, and primary and secondary matter content. Air Qual. Atmos. Health 2016, 9, 533–550. [Google Scholar] [CrossRef]
  8. Chow, J.C.; Lowenthal, D.H.; Chen, L.W.; Wang, X.; Watson, J.G. Mass reconstruction methods for PM2.5: A review. Air Qual. Atmos. Health 2015, 8, 243–263. [Google Scholar] [CrossRef]
  9. Liang, Y.; Fang, L.; Pan, H.; Zhang, K.; Kan, H.; Brook, J.R.; Sun, Q. PM2.5 in Beijing—Temporal pattern and its association with influenza. Environ. Health 2014, 13, 102. [Google Scholar] [CrossRef]
  10. Rogula-Kozłowska, W.; Klejnowski, K.; Rogula-Kopiec, P.; Ośródka, L.; Krajny, E.; Błaszczak, B.; Mathews, B. Spatial and seasonal variability of the mass concentration and chemical composition of PM2.5 in Poland. Air Qual. Atmos. Health 2014, 7, 41–58. [Google Scholar] [CrossRef]
  11. Fan, M.Y.; Zhang, Y.L.; Lin, Y.C.; Cao, F.; Sun, Y.L.; Qiu, Y.M.; Xing, G.H.; Dao, X.; Fu, P.Q. Specific sources of health risks induced by metallic elements in PM2.5 during the wintertime in Beijing, China. Atmos. Environ. 2021, 246, 1352–2310. [Google Scholar] [CrossRef]
  12. Tchounwou, P.B.; Yedjou, C.G.; Patlolla, A.K.; Sutton, D.J. Heavy metal toxicity and the environment. Exp. Suppl. 2012, 101, 133–164. [Google Scholar] [CrossRef] [PubMed]
  13. Hsu, C.Y.; Chiang, H.C.; Lin, S.L.; Chen, M.J.; Lin, T.Y.; Chen, Y.C. Elemental characterization and source apportionment of PM10 and PM2.5 in the western coastal area of central Taiwan. Sci. Total Environ. 2016, 541, 1139–1150. [Google Scholar] [CrossRef] [PubMed]
  14. Chinese Government News. 2019. Available online: http://www.gov.cn/xinwen/2019-02/05/content_5364004.htm (accessed on 15 August 2020).
  15. Choi, E.; Yi, S.M.; Lee, Y.S.; Jo, H.; Baek, S.O.; Heo, J.B. Sources of airborne particulate matter-bound metals and spatial-seasonal variability of health risk potentials in four large cities, South Korea. Environ. Sci. Pollut. Res. Int. 2022, 29, 28359–28374. [Google Scholar] [CrossRef] [PubMed]
  16. Lee, Y.S.; Kim, Y.K.; Choi, E.; Jo, H.; Hyun, H.; Yi, S.M.; Kim, J.Y. Health risk assessment and source apportionment of PM2.5-bound toxic elements in the industrial city of Siheung, Korea. Environ. Sci. Pollut. Res. Int. 2022, 29, 66591–66604. [Google Scholar] [CrossRef]
  17. Guo, Y.; Li, S.; Zhang, L.; Xuan, Q.; He, L.; Ye, Q.; Ma, J.; Peng, L.; Xiong, Y.; Yang, J.; et al. Depression and anxiety of medical students at Kunming Medical University during COVID-19: A cross-sectional survey. Front. Public Health 2022, 10, 957597. [Google Scholar] [CrossRef]
  18. Wang, S.; Chen, L.; Ran, H.; Che, Y.; Fang, D.; Sun, H.; Peng, J.; Liang, X.; Xiao, Y. Depression and anxiety among children and adolescents pre and post COVID-19: A comparative meta-analysis. Front. Psychiatry 2022, 13, 917552. [Google Scholar] [CrossRef]
  19. Piubelli, C.; Deiana, M.; Pomari, E.; Silva, R.; Bisoffi, Z.; Formenti, F.; Perandin, F.; Gobbi, F.; Buonfrate, D. Overall decrease in SARS-CoV-2 viral load and reduction in clinical burden: The experience of a hospital in northern Italy. Clin. Microbiol. Infect. 2021, 27, 131.e1–131.e3. [Google Scholar] [CrossRef]
  20. Shen, F.; Hegglin, M.I.; Luo, Y.; Yuan, Y.; Wang, B.; Flemming, J.; Wang, J.; Zhang, Y.; Chen, M.; Yang, Q.; et al. Disentangling drivers of air pollutant and health risk changes during the COVID-19 lockdown in China. npj Clim. Atmos. Sci. 2022, 5, 54. [Google Scholar] [CrossRef]
  21. Zhang, Y.; Wu, W.; Li, Y.; Li, Y. An investigation of PM2.5 concentration changes in Mid-Eastern China before and after COVID-19 outbreak. Environ. Int. 2023, 175, 107941. [Google Scholar] [CrossRef]
  22. Kerimray, A.; Baimatova, N.; Ibragimova, O.P.; Bukenov, B.; Kenessov, B.; Plotitsyn, P.; Karaca, F. Assessing air quality changes in large cities during COVID-19 lockdowns: The impacts of traffic-free urban conditions in Almaty, Kazakhstan. Sci. Total Environ. 2020, 730, 139179. [Google Scholar] [CrossRef] [PubMed]
  23. Bar, S.; Parida, B.R.; Mandal, S.P.; Pandey, A.C.; Kumar, N.; Mishra, B. Impacts of partial to complete COVID-19 lockdown on NO2 and PM2.5 levels in major urban cities of Europe and USA. Cities 2021, 117, 103308. [Google Scholar] [CrossRef]
  24. Gulyaev, E.; Antonov, K.; Markelov, Y.; Poddubny, V.; Shchelkanov, A.; Iurkov, I. Short-term effect of COVID-19 lockdowns on atmospheric CO2, CH4 and PM2.5 concentrations in urban environment. Int. J. Environ. Sci. Technol. 2023, 20, 4737–4748. [Google Scholar] [CrossRef] [PubMed]
  25. Nguyen, G.T.H.; Hoang-Cong, H.; La, L.T. Statistical Analysis for Understanding PM2.5 Air Quality and the Impacts of COVID-19 Social Distancing in Several Provinces and Cities in Vietnam. Water Air Soil Pollut. 2023, 234, 85. [Google Scholar] [CrossRef] [PubMed]
  26. Wang, S.S.; Hu, G.R.; Yu, R.L.; Shen, H.Z.; Yan, Y. Bioaccessibility and source-specific health risk of heavy metals in PM2.5 in a coastal city in China. Environ. Adv. 2021, 4, 100047. [Google Scholar] [CrossRef]
  27. Chen, G.; Tao, J.; Wang, J.; Dong, M.; Li, X.; Sun, X.; Cheng, S.; Fan, J.; Ye, Y.; Xiao, J.; et al. Reduction of air pollutants and associated mortality during and after the COVID-19 lockdown in China: Impacts and implications. Environ. Res. 2021, 200, 111457. [Google Scholar] [CrossRef]
  28. Etchie, T.O.; Etchie, A.T.; Jauro, A.; Pinker, R.T.; Swaminathan, N. Season, not lockdown, improved air quality during COVID-19 State of Emergency in Nigeria. Sci. Total Environ. 2021, 768, 145187. [Google Scholar] [CrossRef]
  29. Wang, S.S.; Hu, G.R.; Yan, Y.; Wang, S.; Yu, R.L.; Cui, J.Y. Source apportionment of metal elements in PM2.5 in a coastal city in Southeast China: Combined Pb-Sr-Nd isotopes with PMF method. Atmos. Environ. 2019, 198, 302–312. [Google Scholar] [CrossRef]
  30. Chalbot, M.G.; Chitranshi, P.; da Costa, G.G.; Pollock, E.; Kavouras, I.G. Characterization of water-soluble organic matter in urban aerosol by 1 H-NMR spectroscopy. Atmos. Environ. 2016, 128, 235–245. [Google Scholar] [CrossRef]
  31. Norris, G.; Duvall, R.; Brown, S.; Bai, S. EPA Positive Matrix Factorization (PMF) 5.0 Fundamentals and User Guide; EPA/600/R-614/108 (NTIS PB2015-105147); U.S. Environmental Protection Agency: Washington, DC, USA, 2014.
  32. Motesaddi Zarandi, S.; Shahsavani, A.; Khodagholi, F.; Fakhri, Y. Concentration, sources and human health risk of heavy metals and polycyclic aromatic hydrocarbons bound PM2.5 ambient air, Tehran, Iran. Environ. Geochem. Health 2019, 41, 1473–1487. [Google Scholar] [CrossRef]
  33. U.S. EPA. Risk Assessment Guidance for Superfund. In Part A: Human Health Evaluation Manual; Part E, Supplemental Guidance for Dermal Risk Assessment; Part, vol. I. F, Supplemental Guidance for Inhalation Risk Assessment. 2011. Available online: http://www.epa.gov/oswer/riskassessment/human_health_exposure.htm (accessed on 18 July 2022).
  34. U.S. EPA. The Screening Level (RSL) Tables (last updated June 2011). 2011. Available online: http://www.epa.gov/region9/superfund/prg/index.html (accessed on 18 July 2022).
  35. U.S. EPA. User’s Guide and Background Technical Document for US EPA Region 9’s Preliminary Remediation Goals (PRG) Table. 2011. Available online: http://www.epa.gov/reg3hwmd/risk/human/rb-concentrationtable/usersguide.htm (accessed on 18 July 2022).
  36. Birbeck, J.A.; Westrick, J.A.; O’Neill, G.M.; Spies, B.; Szlag, D.C. Comparative Analysis of Microcystin Prevalence in Michigan Lakes by Online Concentration LC/MS/MS and ELISA. Toxins 2019, 11, 13. [Google Scholar] [CrossRef] [PubMed]
  37. Park, E.J.; Kim, D.S.; Park, K. Monitoring of ambient particles and heavy metals in a residential area of Seoul, Korea. Environ. Monit. Assess. 2008, 137, 441–449. [Google Scholar] [CrossRef]
  38. Zhang, Z.; Zhang, X.; Gong, D.; Quan, W.; Zhao, X.; Ma, Z.; Kim, S. Evolution of surface O3 and PM2.5 concentrations and their relationships with meteorological conditions over the last decade in Beijing. Atmos. Environ. 2015, 108, 67–75. [Google Scholar] [CrossRef]
  39. Huang, X.; Liu, Z.; Zhang, J.; Zhang, J.K.; Wen, T.X.; Ji, D.S.; Wang, Y.S. Seasonal variation and secondary formation of size-segregated aerosol water-soluble inorganic ions during pollution episodes in Beijing. Atmos. Res. 2016, 168, 70–79. [Google Scholar] [CrossRef]
  40. Lim, H.J.; Turpin, B.J. Origins of primary and secondary organic aerosol in Atlanta: Results of time-resolved measurements during the Atlanta Supersite Experiment. Environ. Sci. Technol. 2002, 36, 4489–4496. [Google Scholar] [CrossRef]
  41. Duan, J.; Tan, J. Atmospheric heavy metals and Arsenic in China: Situation, sources and control policies. Atmos. Environ. 2013, 74, 93–101. [Google Scholar] [CrossRef]
  42. Wang, X.Q.; Duan, W.J.; Zhu, J.X.; Wei, W.; Cheng, S.Y.; Mao, S.S. Nonlinear influence of winter meteorology and precursor on PM2.5 based on mathematical and numerical models: A COVID-19 and Winter Olympics case study. Atmos. Environ. 2022, 278, 119072. [Google Scholar] [CrossRef]
  43. Huang, H.; Jiang, Y.; Xu, X.; Cao, X. In vitro bioaccessibility and health risk assessment of heavy metals in atmospheric particulate matters from three different functional areas of Shanghai, China. Sci. Total Environ. 2018, 610–611, 546–554. [Google Scholar] [CrossRef]
  44. Lv, Z.; Wang, X.; Deng, F.; Ying, Q.; Archibald, A.T.; Jones, R.L.; Ding, Y.; Cheng, Y.; Fu, M.; Liu, Y.; et al. Source-Receptor Relationship Revealed by the Halted Traffic and Aggravated Haze in Beijing during the COVID-19 Lockdown. Environ. Sci. Technol. 2020, 54, 15660–15670. [Google Scholar] [CrossRef]
  45. Wu, J.; Bei, N.; Hu, B.; Liu, S.; Wang, Y.; Shen, Z.; Li, X.; Liu, L.; Wang, R.; Liu, Z.; et al. Aerosol-photolysis interaction reduces particulate matter during wintertime haze events. Proc. Natl. Acad. Sci. USA 2020, 117, 9755–9761. [Google Scholar] [CrossRef]
  46. Lai, A.; Lee, M.; Carter, E.; Chan, Q.; Elliott, P.; Ezzati, M.; Kelly, F.; Yan, L.; Wu, Y.; Yang, X.; et al. Chemical Investigation of Household Solid Fuel Use and Outdoor Air Pollution Contributions to Personal PM2.5 Exposures. Environ. Sci. Technol. 2021, 55, 15969–15979. [Google Scholar] [CrossRef]
  47. Wang, J.; Ye, J.; Zhang, Q.; Zhao, J.; Wu, Y.; Li, J.; Liu, D.; Li, W.; Zhang, Y.; Wu, C.; et al. Aqueous production of secondary organic aerosol from fossil-fuel emissions in winter Beijing haze. Proc. Natl. Acad. Sci. USA 2021, 118, e2022179118. [Google Scholar] [CrossRef] [PubMed]
  48. Brodny, J.; Tutak, M. The analysis of similarities between the European Union countries in terms of the level and structure of the emissions of selected gases and air pollutants into the atmosphere. J. Clean. Prod. 2021, 279, 123641. [Google Scholar] [CrossRef] [PubMed]
  49. Taghvaee, S.; Sowlat, M.H.; Mousavi, A.; Hassanvand, M.S.; Yunesian, M.; Naddafi, K.; Sioutas, C. Source apportionment of ambient PM2.5 in two locations in central Tehran using the Positive Matrix Factorization (PMF) model. Sci. Total Environ. 2018, 628–629, 672–686. [Google Scholar] [CrossRef]
  50. Van Ryswyk, K.; Evans, G.J.; Kulka, R.; Sun, L.; Sabaliauskas, K.; Rouleau, M.; Anastasopolos, A.T.; Wallace, L.; Weichenthal, S. Personal exposures to traffic-related air pollution in three Canadian bus transit systems: The Urban Transportation Exposure Study. J. Expo. Sci. Environ. Epidemiol. 2021, 31, 628–640. [Google Scholar] [CrossRef] [PubMed]
  51. Zhang, Y.; Cetin, B.; Likos, W.J.; Edil, T.B. Impacts of PH on leaching potential of elements from msw incineration fly ash. Fuel 2016, 184, 815–825. [Google Scholar] [CrossRef]
  52. Qiao, S.; Tao, Y.; Shan, Q.; Wang, J.; Chai, T.; Gong, S.; Qiao, K. Physiological and Gene Expression Responses of Six Annual Ryegrass Cultivars to Cobalt, Lead, and Nickel Stresses. Int. J. Mol. Sci. 2021, 22, 3583. [Google Scholar] [CrossRef]
  53. Raveau, R.; Fontaine, J.; Hijri, M.; Lounès-Hadj Sahraoui, A. The Aromatic Plant Clary Sage Shaped Bacterial Communities in the Roots and in the Trace Element-Contaminated Soil More Than Mycorrhizal Inoculation—A Two-Year Monitoring Field Trial. Front. Microbiol. 2020, 11, 586050. [Google Scholar] [CrossRef]
  54. Cheng, K.; Wang, Y.; Tian, H.; Gao, X.; Zhang, Y.; Wu, X.; Zhu, C.; Gao, J. Atmospheric emission characteristics and control policies of five precedent-controlled toxic heavy metals from anthropogenic sources in China. Environ. Sci. Technol. 2015, 49, 1206–1214. [Google Scholar] [CrossRef]
  55. Li, Y.M.; Pan, Y.P.; Wang, Y.S.; Wang, Y.F.; Li, X.R. Chemical characteristics and sources of trace metals in precipitation collected from a typical industrial city in Northern China. Huan Jing Ke Xue 2012, 33, 3712–3717. [Google Scholar]
  56. Wu, J.; Chen, Y.; Ma, J.; Cao, J.; Jiang, Y. Sustainable Strategies for the Agricultural Development of Shaanxi Province Based on the Risk Assessment of Heavy Metal Pollution. Foods 2022, 11, 1409. [Google Scholar] [CrossRef]
  57. Gao, J.; Woodward, A.; Vardoulakis, S.; Kovats, S.; Wilkinson, P.; Li, L.; Xu, L.; Li, J.; Yang, J.; Li, J.; et al. Haze, public health and mitigation measures in China: A review of the current evidence for further policy response. Sci. Total Environ. 2017, 578, 148–157. [Google Scholar] [CrossRef] [PubMed]
  58. Gao, J.; Peng, X.; Chen, G.; Xu, J.; Shi, G.L.; Zhang, Y.C.; Feng, Y.C. Insights into the chemical characterization and sources of PM2.5 in Beijing at a 1-h time resolution. Sci. Total Environ. 2016, 542 Pt A, 162–171. [Google Scholar] [CrossRef]
  59. Huang, X.; Liu, Z.; Liu, J.; Hu, B.; Wen, T.; Tang, G.; Zhang, J.; Wu, F.; Ji, D.; Wang, L.; et al. Chemical characterization and source identification of PM2.5 at multiple sites in the Beijing- Tianjin-Hebei region, China. Atmos. Chem. Phys. 2017, 17, 12941–12962. [Google Scholar] [CrossRef]
  60. Liu, J.; Chen, Y.; Chao, S.; Cao, H.; Zhang, A. Levels and health risks of PM2.5-bound toxic metals from firework/firecracker burning during festival periods in response to management strategies. Ecotoxicol. Environ. Saf. 2019, 171, 406–413. [Google Scholar] [CrossRef]
  61. Manchanda, C.; Kumar, M.; Singh, V.; Faisal, M.; Hazarika, N.; Shukla, A.; Lalchandani, V.; Goel, V.; Thamban, N.; Ganguly, D.; et al. Variation in chemical composition and sources of PM2.5 during the COVID-19 lockdown in Delhi. Environ. Int. 2021, 153, 106541. [Google Scholar] [CrossRef] [PubMed]
  62. U.S. EPA Agency. Risk Assessment Guidance for Superfund (RAG S), Volume I: Human Health Evaluation Manual (Part F, Supplemental Guidance for Inhalation Risk Assessment); Office of Superfund Remediation and Technology Innovation: Washington, DC, USA, 2009.
  63. Liang, B.; Li, X.L.; Ma, K.; Liang, S.X. Pollution characteristics of metal pollutants in PM2.5 and comparison of risk on human health in heating and non-heating seasons in Baoding, China. Ecotoxicol. Environ. Saf. 2019, 170, 166–171. [Google Scholar] [CrossRef] [PubMed]
  64. Liu, K.K.; Ren, J. Characteristics, sources and health risks of PM2.5-bound potentially toxic elements in the northern rural China. Atmos. Pollut. Res. 2019, 10, 1621–1626. [Google Scholar] [CrossRef]
  65. McDaniel, D.K.; Ringel-Scaia, V.M.; Morrison, H.A.; Coutermarsh-Ott, S.; Council-Troche, M.; Angle, J.W.; Perry, J.B.; Davis, G.; Leng, W.; Minarchick, V.; et al. Pulmonary Exposure to Magnéli Phase Titanium Suboxides Results in Significant Macrophage Abnormalities and Decreased Lung Function. Front. Immunol. 2019, 10, 2714. [Google Scholar] [CrossRef]
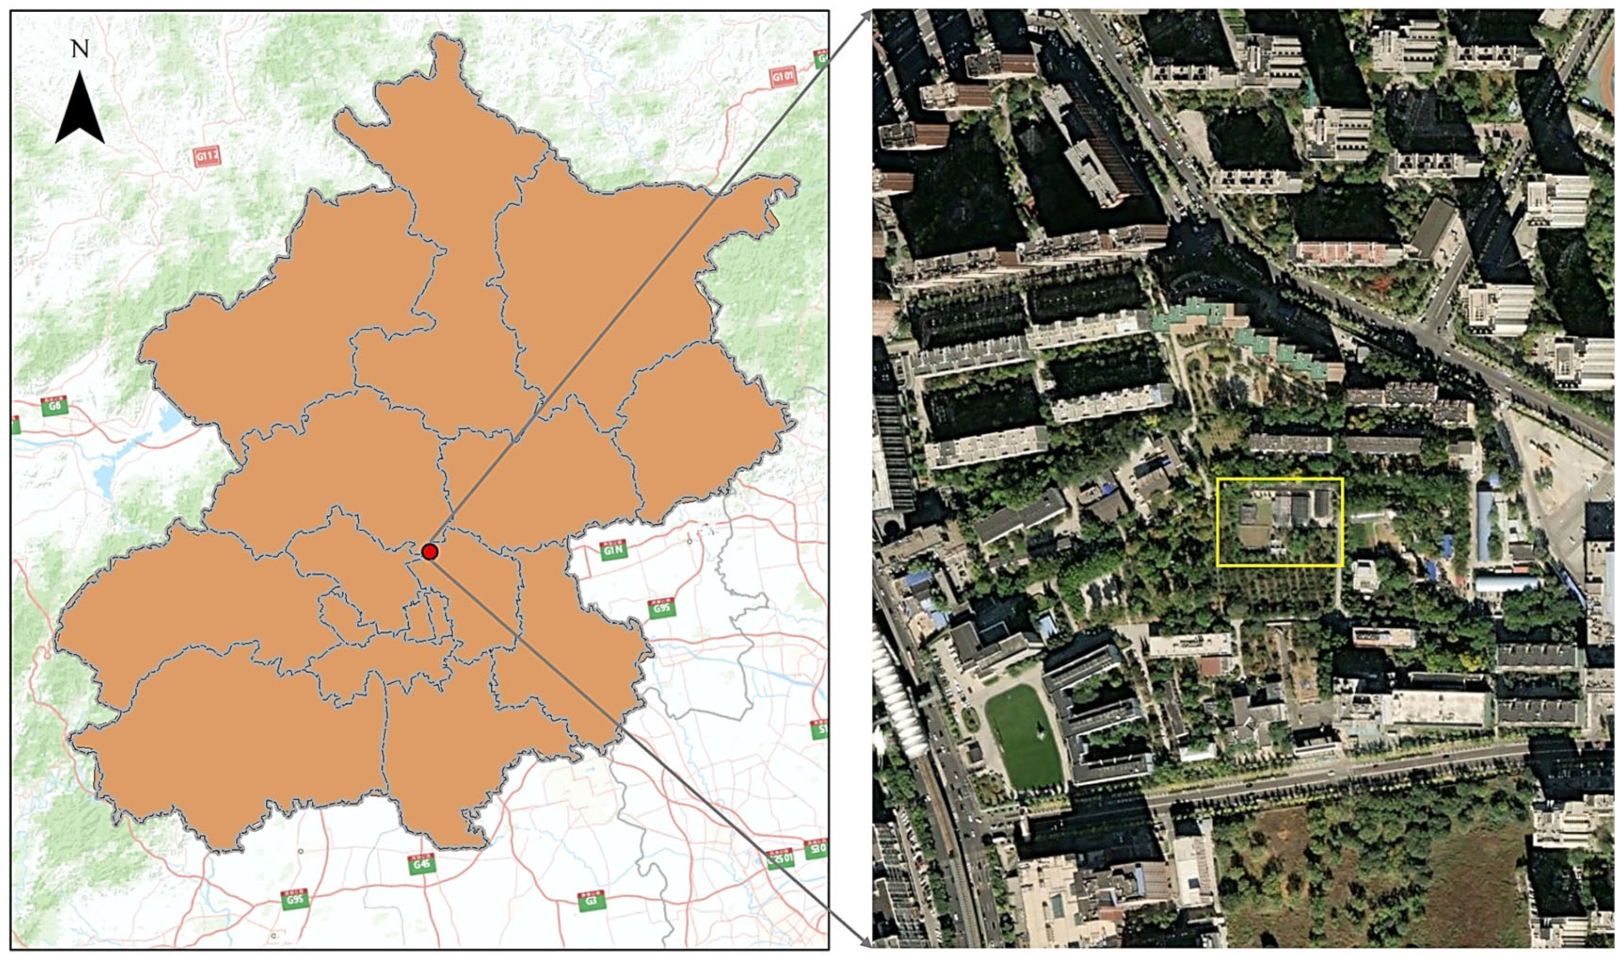
Figure 1. Sampling site location and surrounding environment.
Atmosphere 14 01060 g001
Figure 2. (a) Concentrations of (a) chemical constituents and (b) their contributions to PM2.5 mass in Beijing. A means autumn and W means winter.
Atmosphere 14 01060 g002
Figure 3. Concentrations of (a) elements and (b,c) trace elements in PM2.5 in Beijing. A means autumn, W means winter.
Atmosphere 14 01060 g003
Figure 4. Time series of wind speed (m s−1), wind direction (◦), relative humidity (%), temperature (°C), total concentrations of SO2 (μg m−3), NO2 (μg m−3), SO42− (μg m−3), NO3 (μg m−3), NH4+ (μg m−3), metals (ng m−3), and PM2.5 mass (μg m−3) in Beijing during the sampling period.
Atmosphere 14 01060 g004
Figure 5. PMF-derived source profiles (concentration and % of species apportioned to factor).
Atmosphere 14 01060 g005
Figure 6. (a) Absolute concentrations and (b) relative contributions of different emission sources to the total species measured during the sampling period. A means autumn, W means winter.
Atmosphere 14 01060 g006
Figure 7. The contribution of each source to the carcinogenic and noncarcinogenic hazards of metal elements during PM2.5 sampling in Beijing. A means autumn, W means winter.
Atmosphere 14 01060 g007
Table 1. The parameter meanings and values of Equations (3)–(5).
CRNCR
ChildrenAdultsChildrenAdults
ETExposure time (h/day)6
EFExposure frequency (days/year)180 days/year
EDExposure duration (year)624624
AT1Mean time (h)6.132 × 1055.256 × 1041.5768 × 105
SASkin surface area (cm2)2800570028005700
AFSkin adhesion coefficient (mg/cm2/day)0.20.70.20.7
ABSAbsorption fraction0.001 for Cd, 0.03 for As, and 1.0% for other elements
BWBody weight (kg)15701570
AT2Average time (days)2.555 × 10421908760
CFConversion factor (kg/mg)10−6
IngRIngestion rate (mg/day)2005020050
Table 2. Carcinogenic and noncarcinogenic risks of different PM2.5 toxic elements in Beijing during the sampling period.
Autumn
Toxic ElementsCarcinogenic Risk (CR)Noncarcinogenic Risk (NCR)
2019202020192020
ChildrenAdultsChildrenAdultsChildrenAdultsChildrenAdults
As5.43 × 10−53.70 × 10−54.20 × 10−52.84 × 10−51.43 × 1003.50 × 10−11.10 × 1002.39 × 10−1
Cd1.18 × 10−84.73 × 10−87.96 × 10−93.18 × 10−87.67 × 10−23.46 × 10−27.79 × 10−22.48 × 10⁻²
Cr4.62 × 10−64.31 × 10−69.13 × 10−66.88 × 10−63.14 × 10−26.80 × 10−36.49 × 10−21.13 × 10⁻²
Co2.22 × 10−88.88 × 10−83.75 × 10−81.50 × 10−79.23 × 10−22.74 × 10−22.39 × 10−15.40 × 10⁻²
Pb1.75 × 10−67.20 × 10−72.23 × 10−68.90 × 10⁻⁷
Mn 2.99 × 10−14.27 × 10−13.34 × 10−13.57 × 10−1
Total6.07 × 10−54.21 × 10−55.34 × 10−53.64 × 10−51.93 × 1008.46 × 10−11.82 × 1006.87 × 10−1
Winter
Toxic ElementsCarcinogenic Risk (CR)Noncarcinogenic Risk (NCR)
2019202020192020
ChildrenAdultsChildrenAdultsChildrenAdultsChildrenAdults
As7.91 × 10−55.39 × 10−55.19 × 10−53.52 × 10−52.09 × 1005.21 × 10−11.37 × 1003.17 × 10−1
Cd2.88 × 10−81.15 × 10−71.74 × 10−86.95 × 10−81.77 × 10−18.39 × 10−21.33 × 10−15.21 × 10⁻²
Cr3.62 × 10−63.49 × 10−67.99 × 10−66.79 × 10−62.44 × 10−25.47 × 10−35.55 × 10−21.09 × 10⁻²
Co2.43 × 10−89.73 × 10−82.66 × 10−81.06 × 10−79.79 × 10−22.97 × 10−21.34 × 10−13.50 × 10⁻²
Pb5.09 × 10−62.11 × 10−64.88 × 10−61.98 × 10⁻⁶
Mn 2.72 × 10−14.05 × 10−13.09 × 10−13.92 × 10−1
Total8.78 × 10−55.97 × 10−56.48 × 10−54.42 × 10−52.66 × 1001.05 × 1002.00 × 1008.07 × 10−1
Disclaimer/Publisher’s Note: The statements, opinions and data contained in all publications are solely those of the individual author(s) and contributor(s) and not of MDPI and/or the editor(s). MDPI and/or the editor(s) disclaim responsibility for any injury to people or property resulting from any ideas, methods, instructions or products referred to in the content.