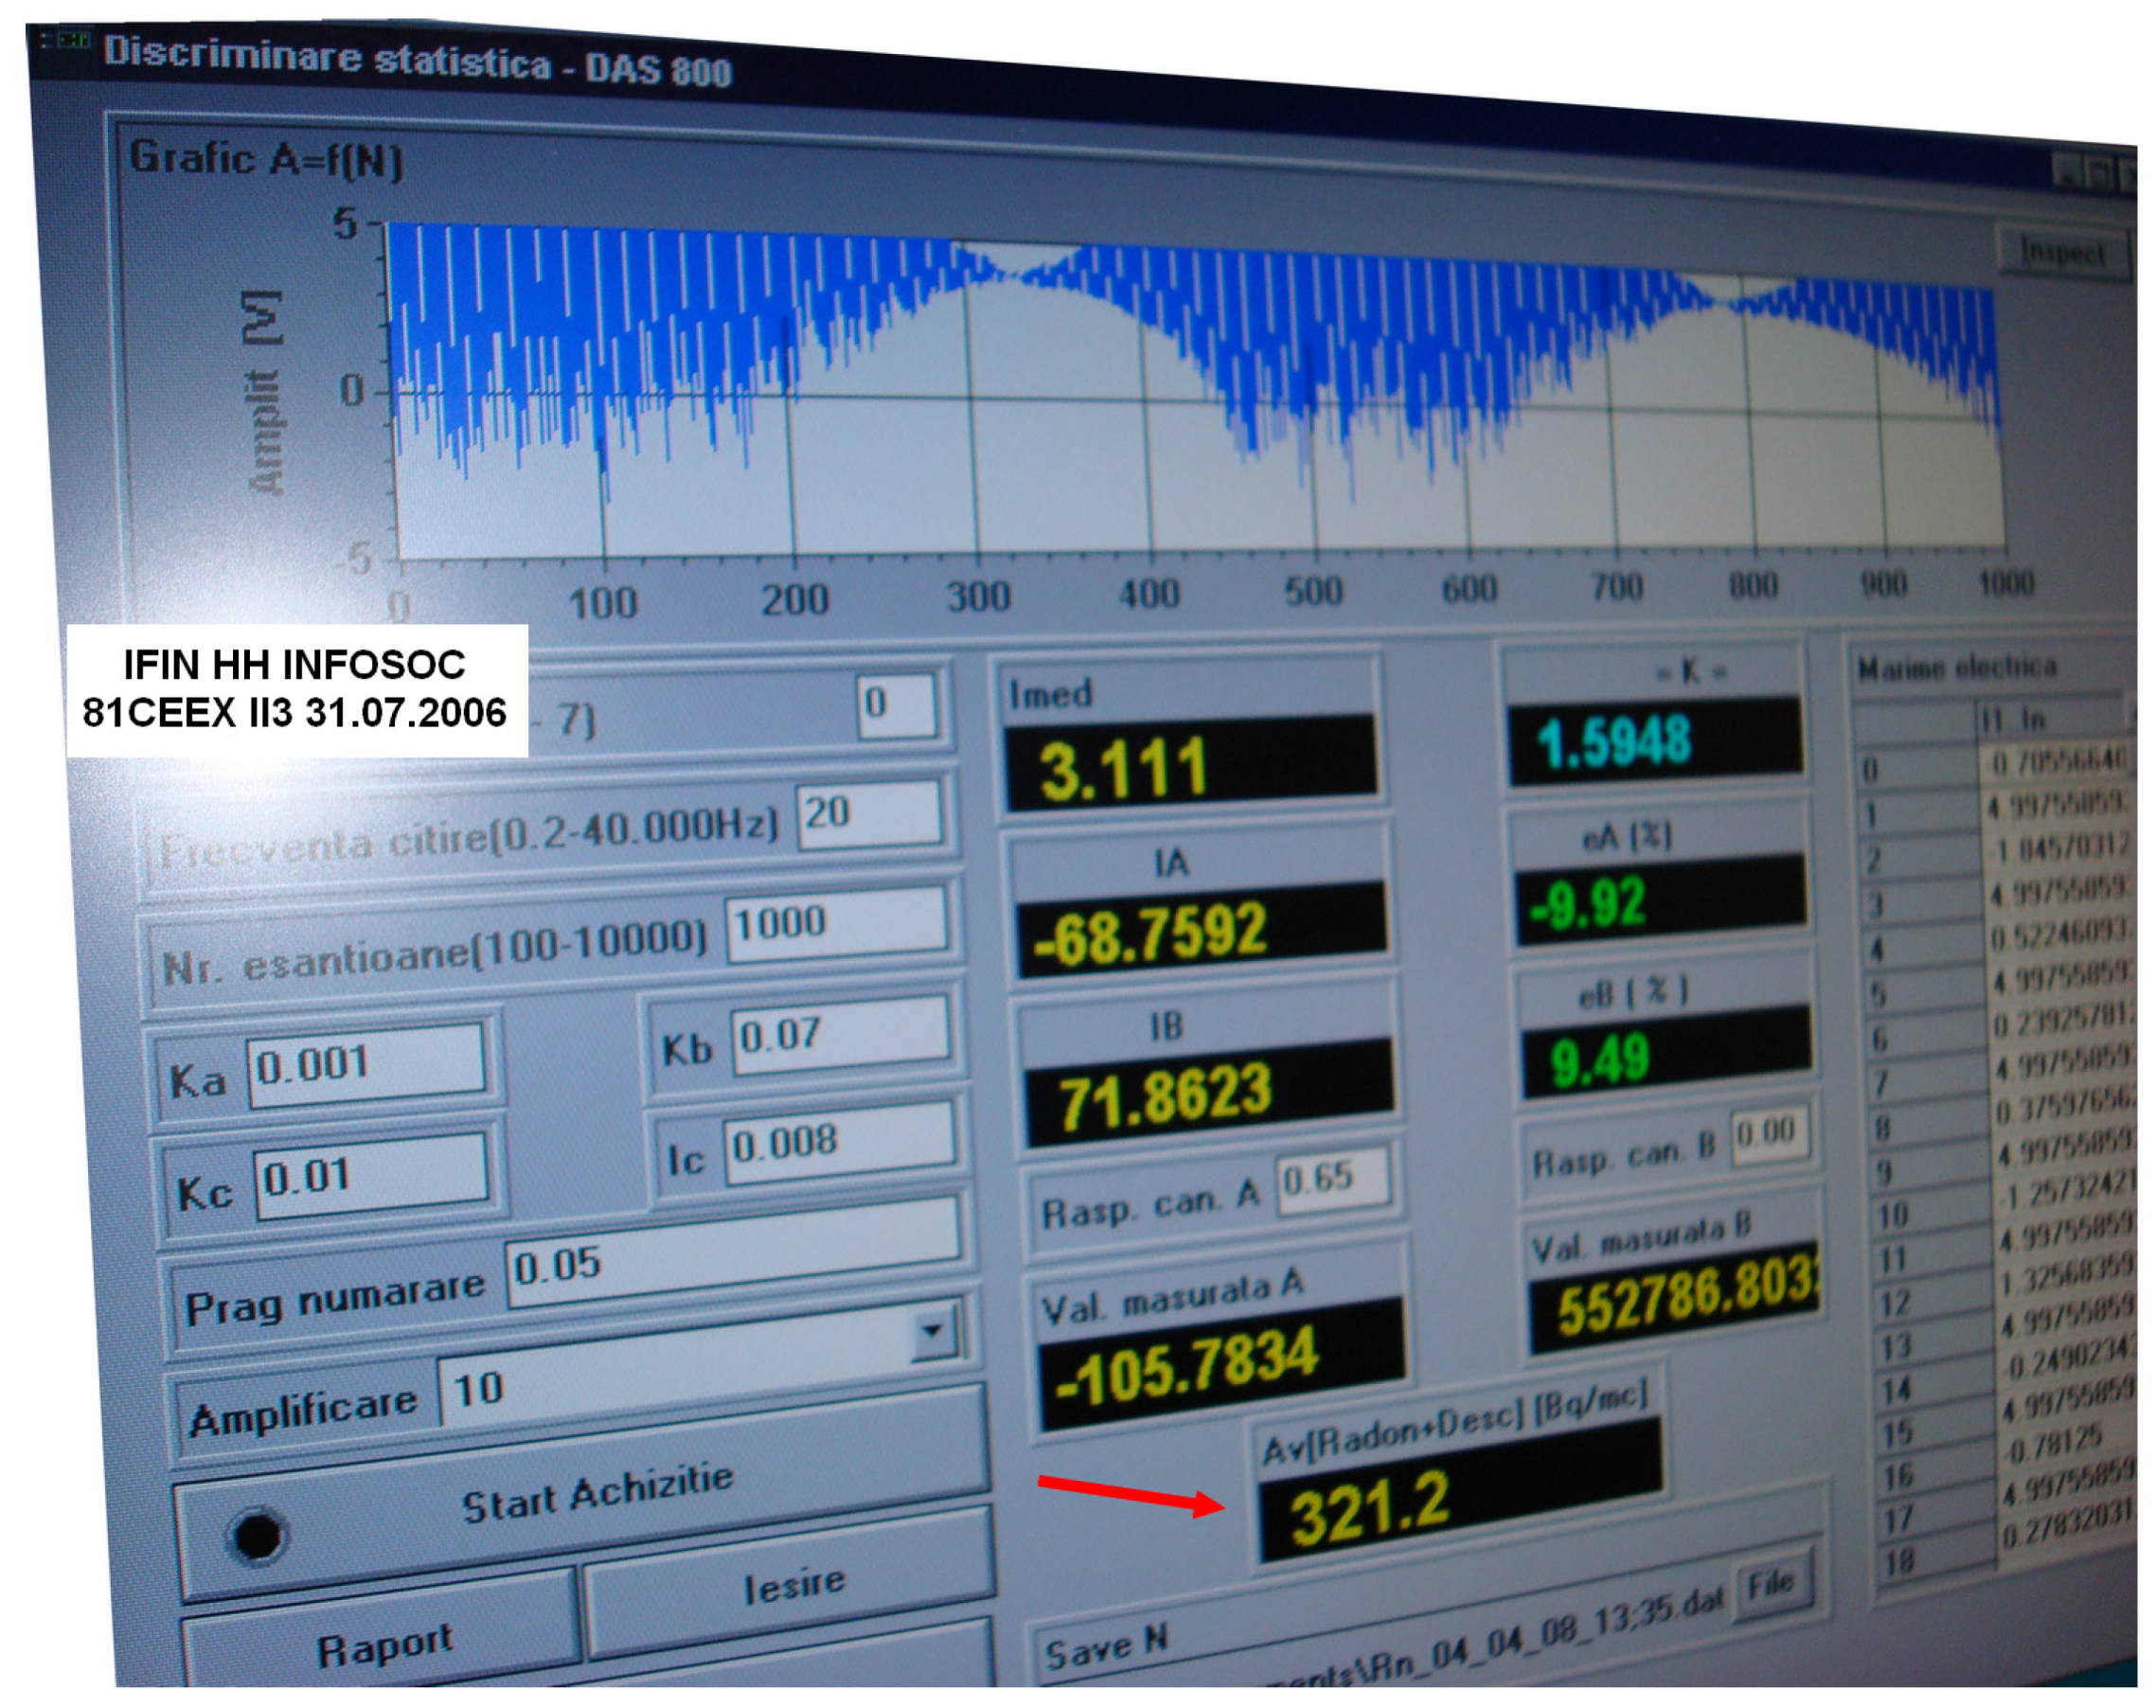
Figure 1.
The software for the first development of an experimental radon detection in a seismic zone was created by IFIN HH, 2006.
Figure 1.
The software for the first development of an experimental radon detection in a seismic zone was created by IFIN HH, 2006.
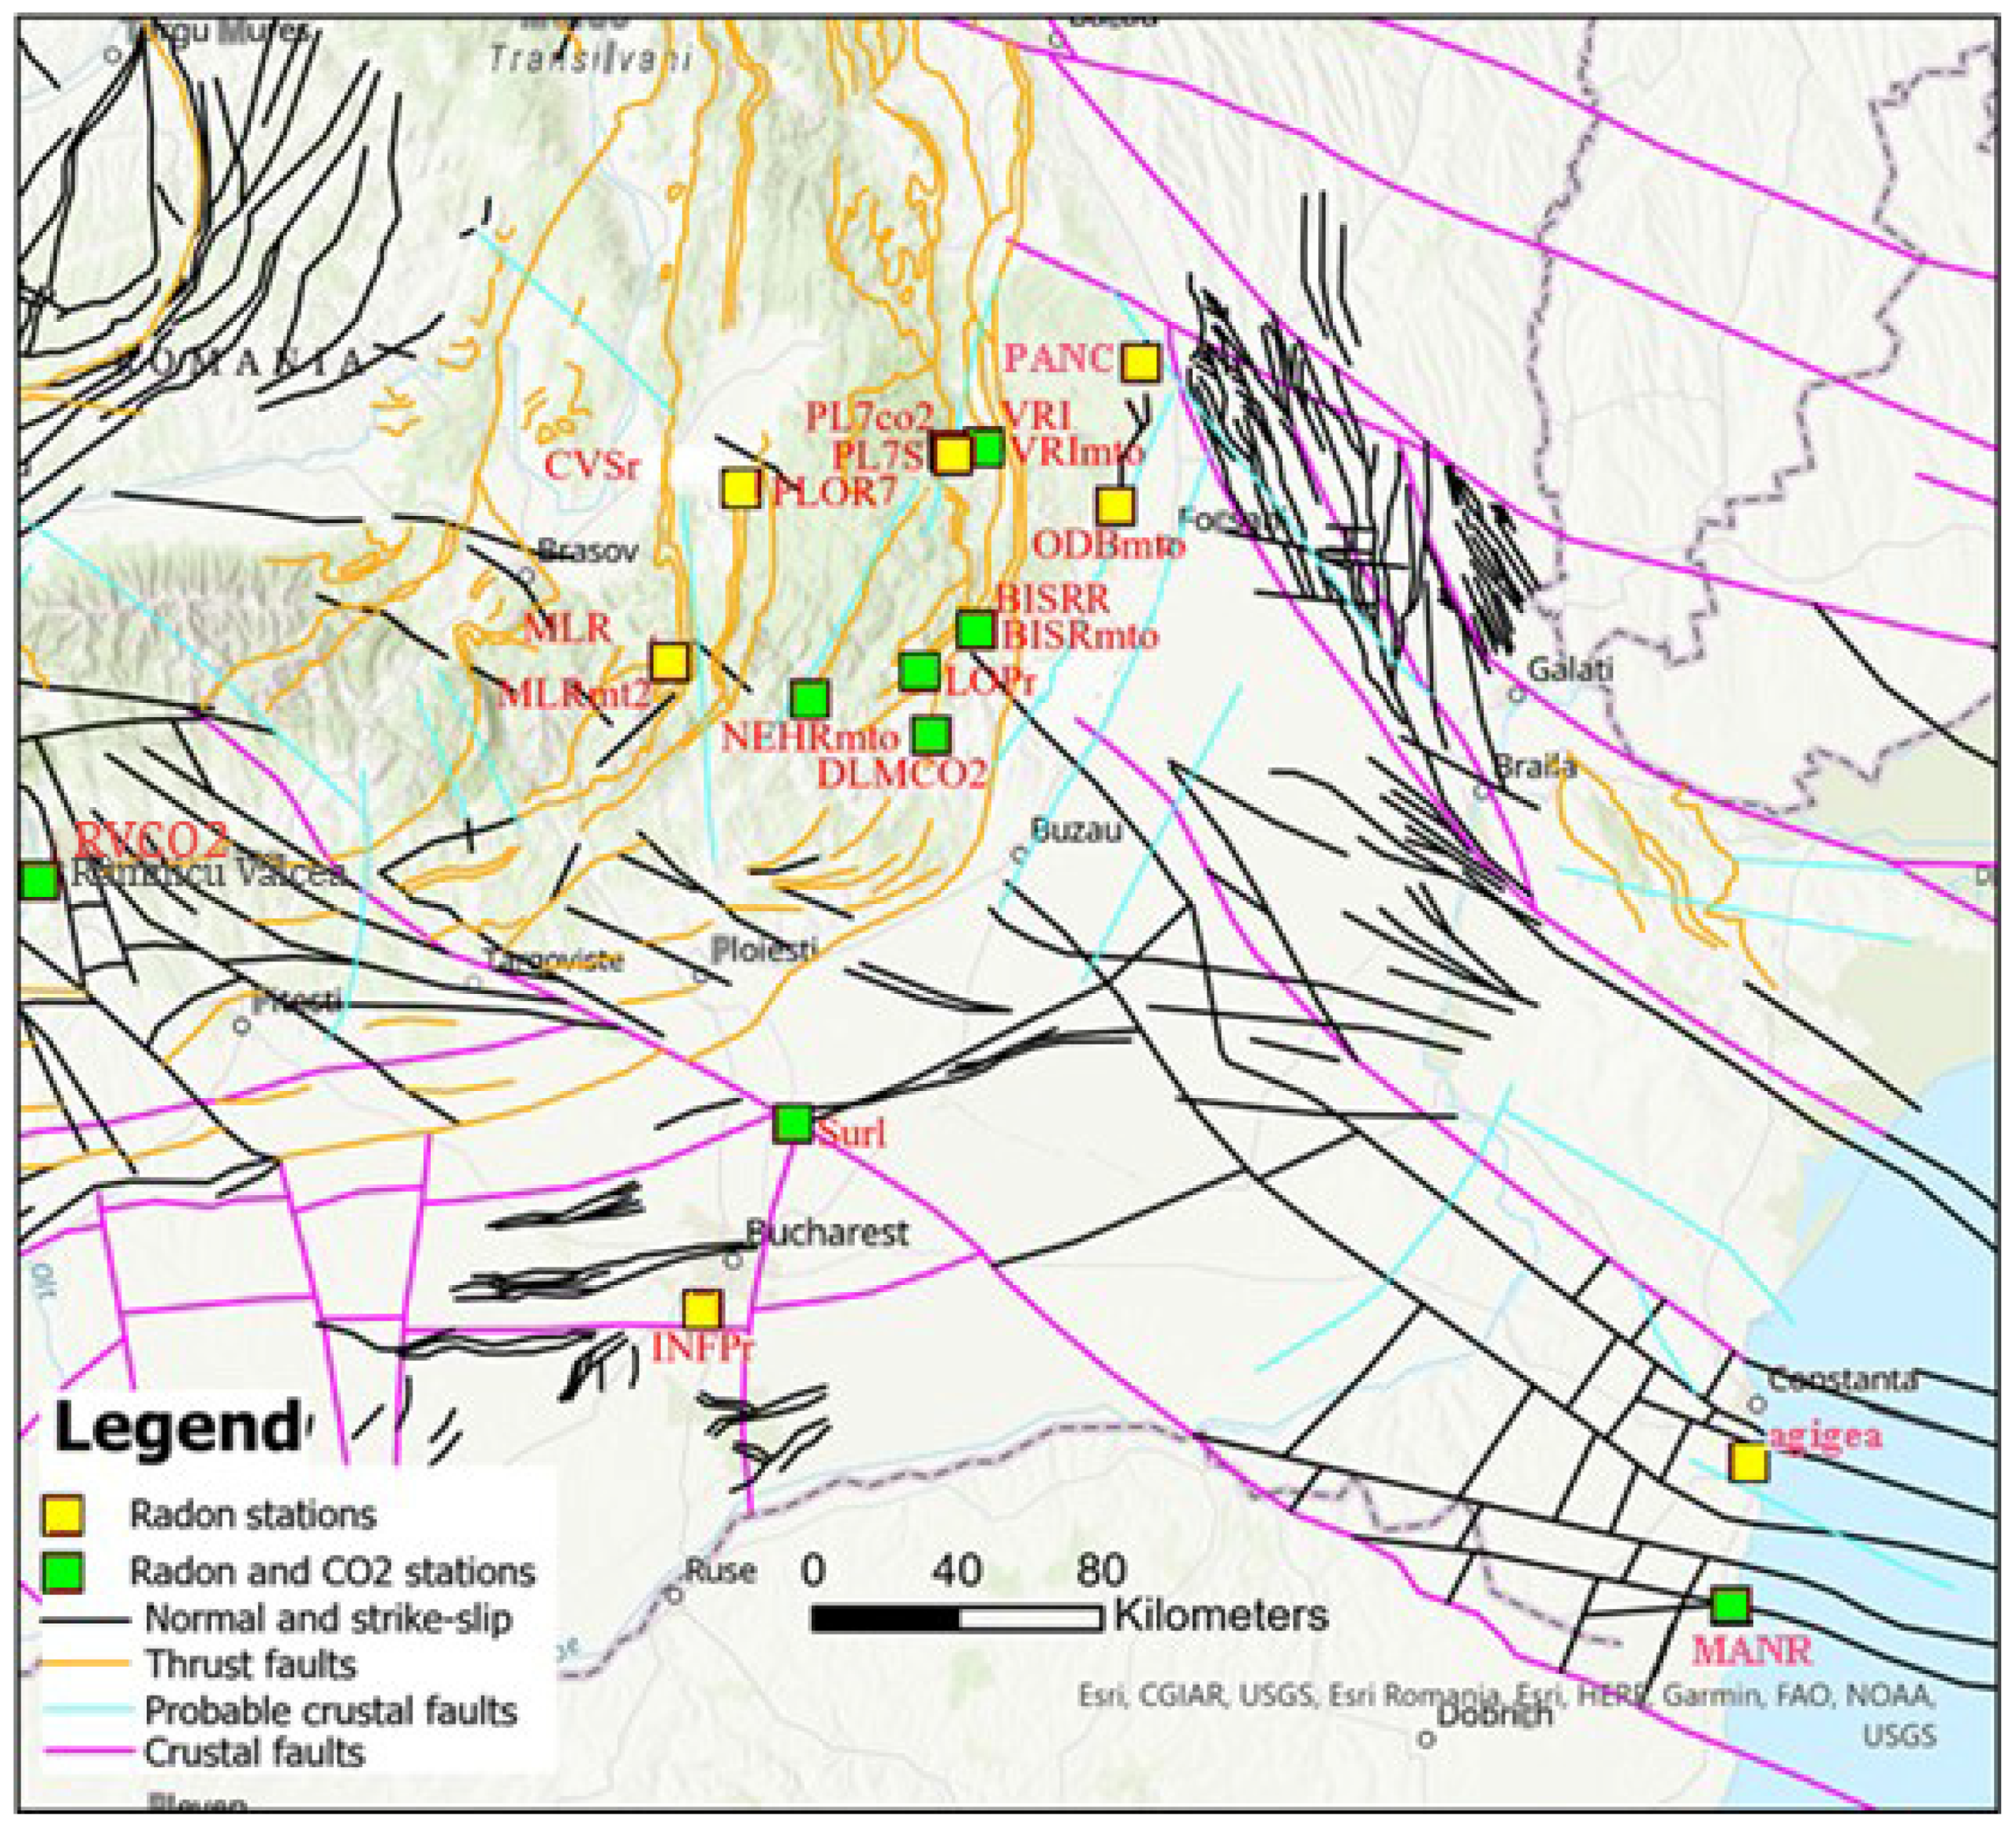
Figure 2.
Map of radon and CO2 monitoring locations; faults are according to Project CEEX NR.647/2005 CEEX 647 (C. Dinu, V. Răileanu et al.).
Figure 2.
Map of radon and CO2 monitoring locations; faults are according to Project CEEX NR.647/2005 CEEX 647 (C. Dinu, V. Răileanu et al.).
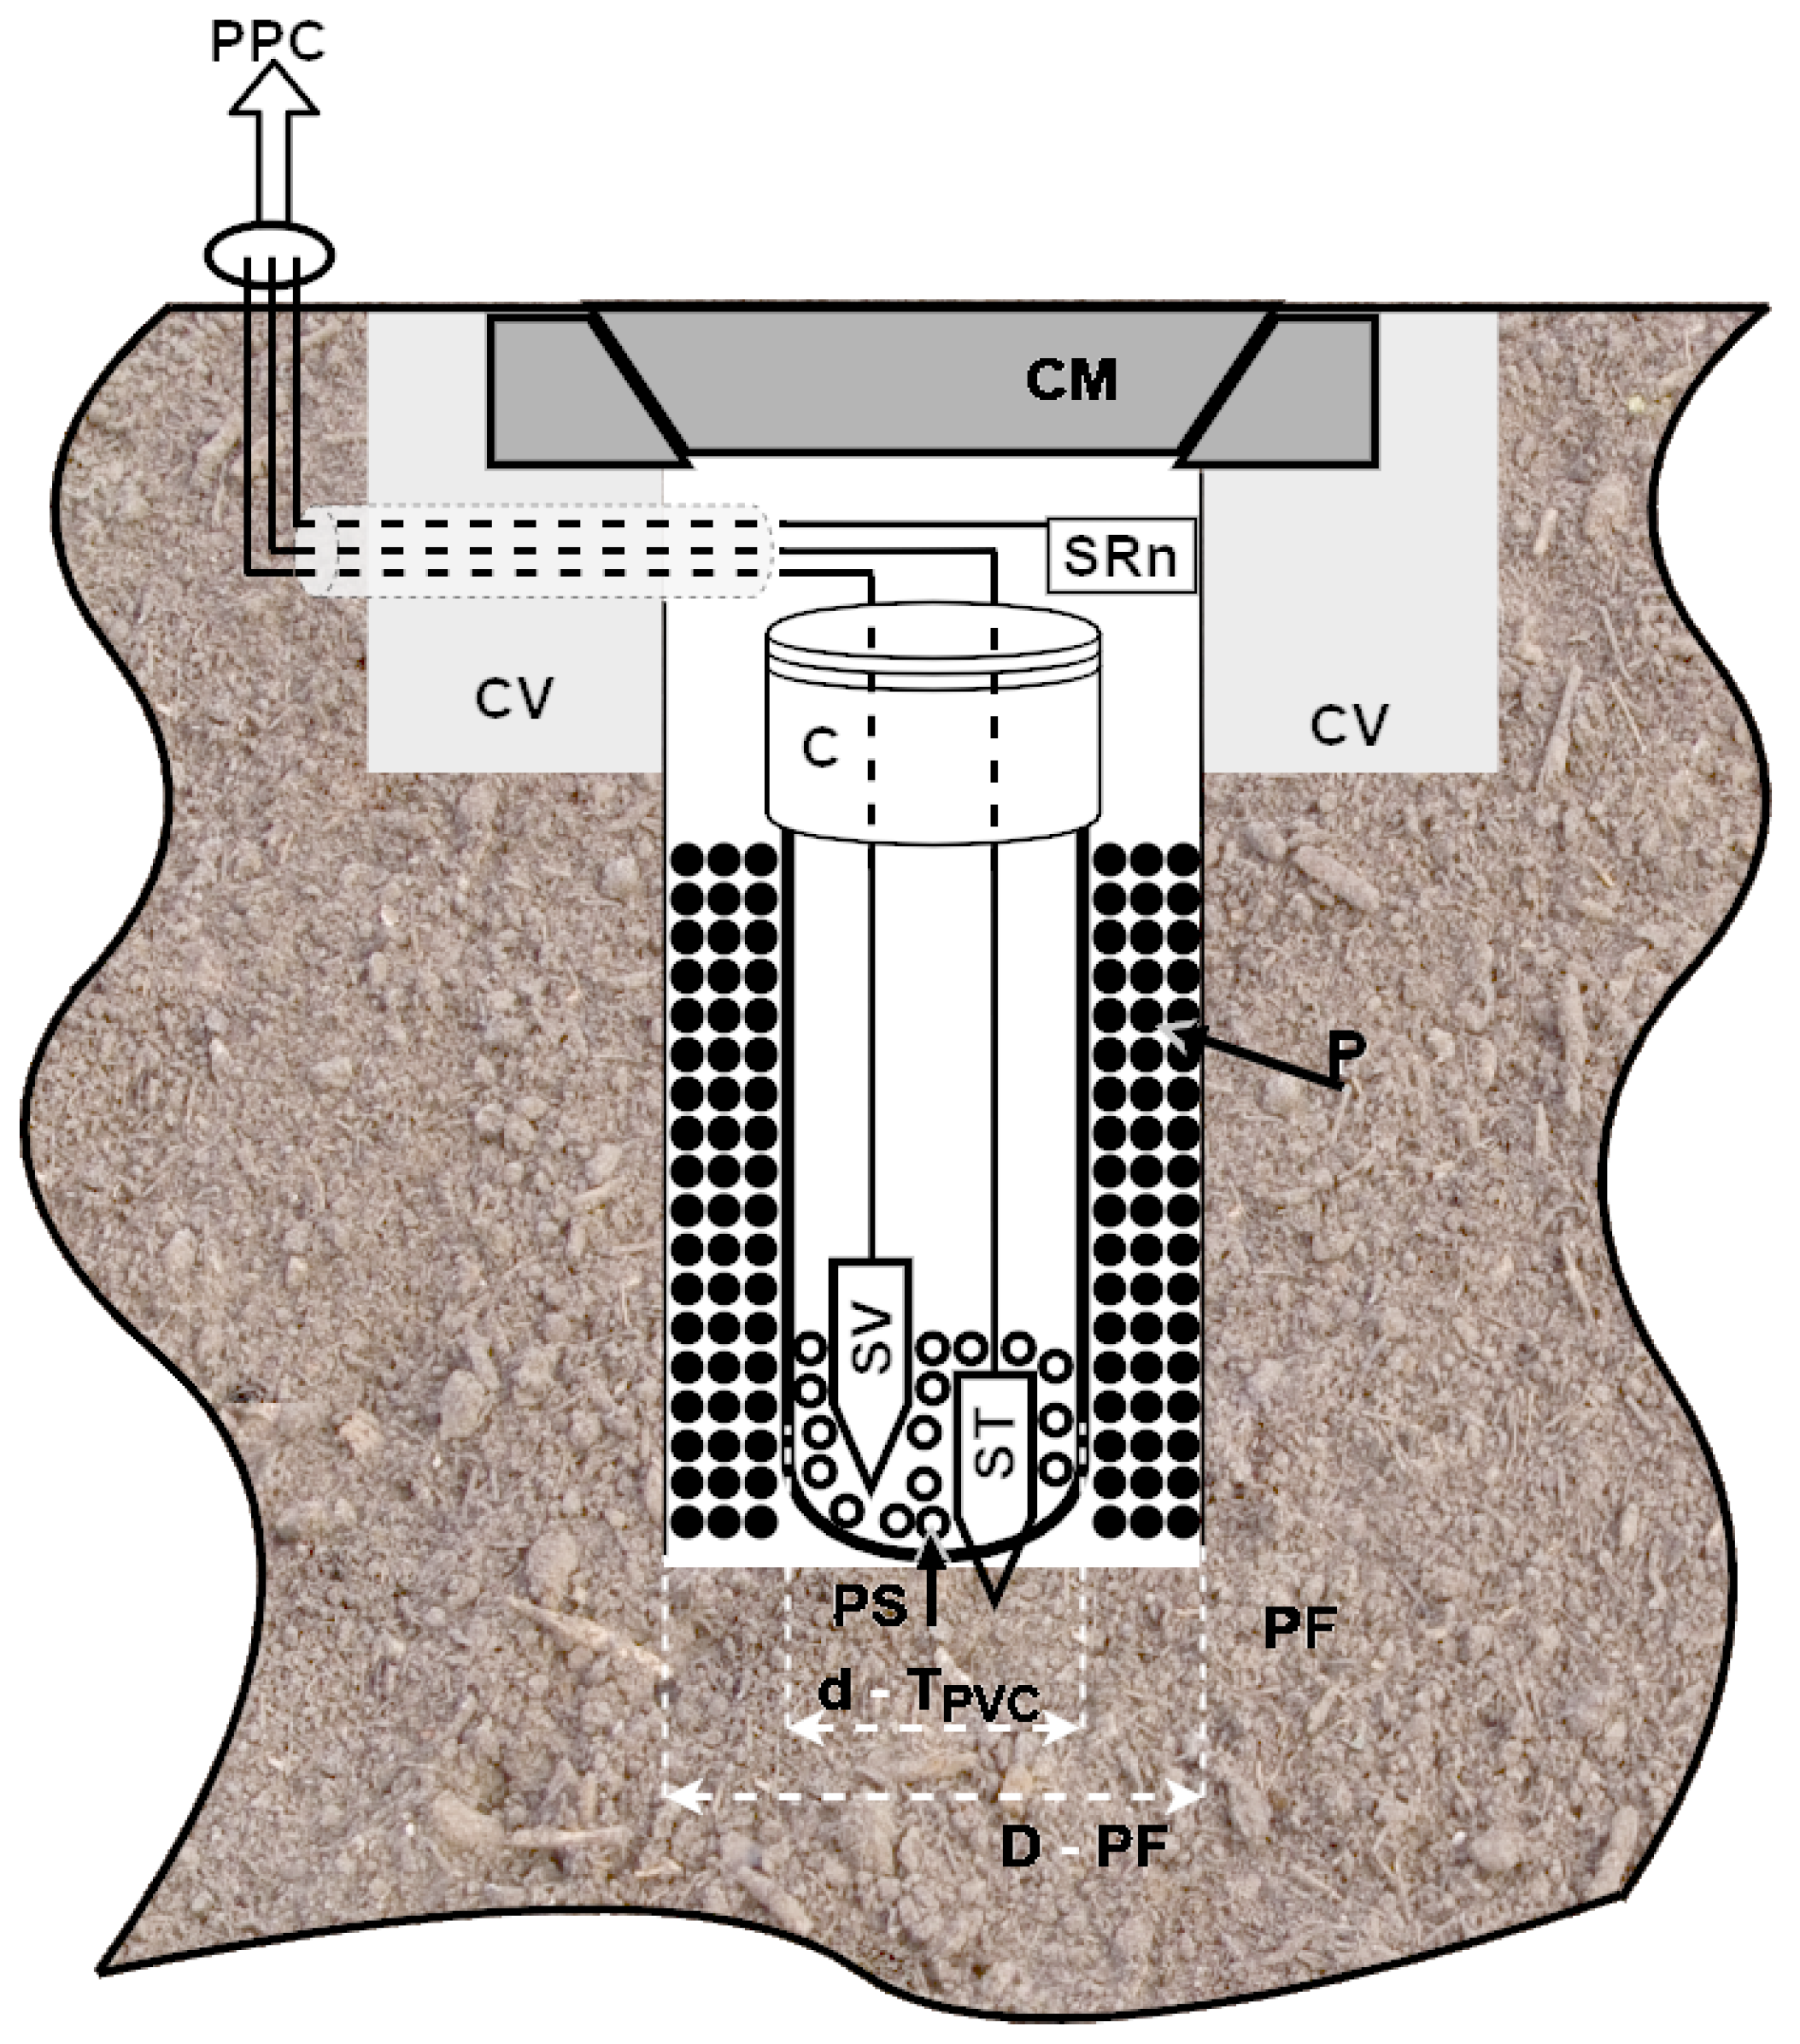
Figure 3.
Installation of radon and acceleration sensors in a 40 m deep borehole [
14].
Figure 3.
Installation of radon and acceleration sensors in a 40 m deep borehole [
14].
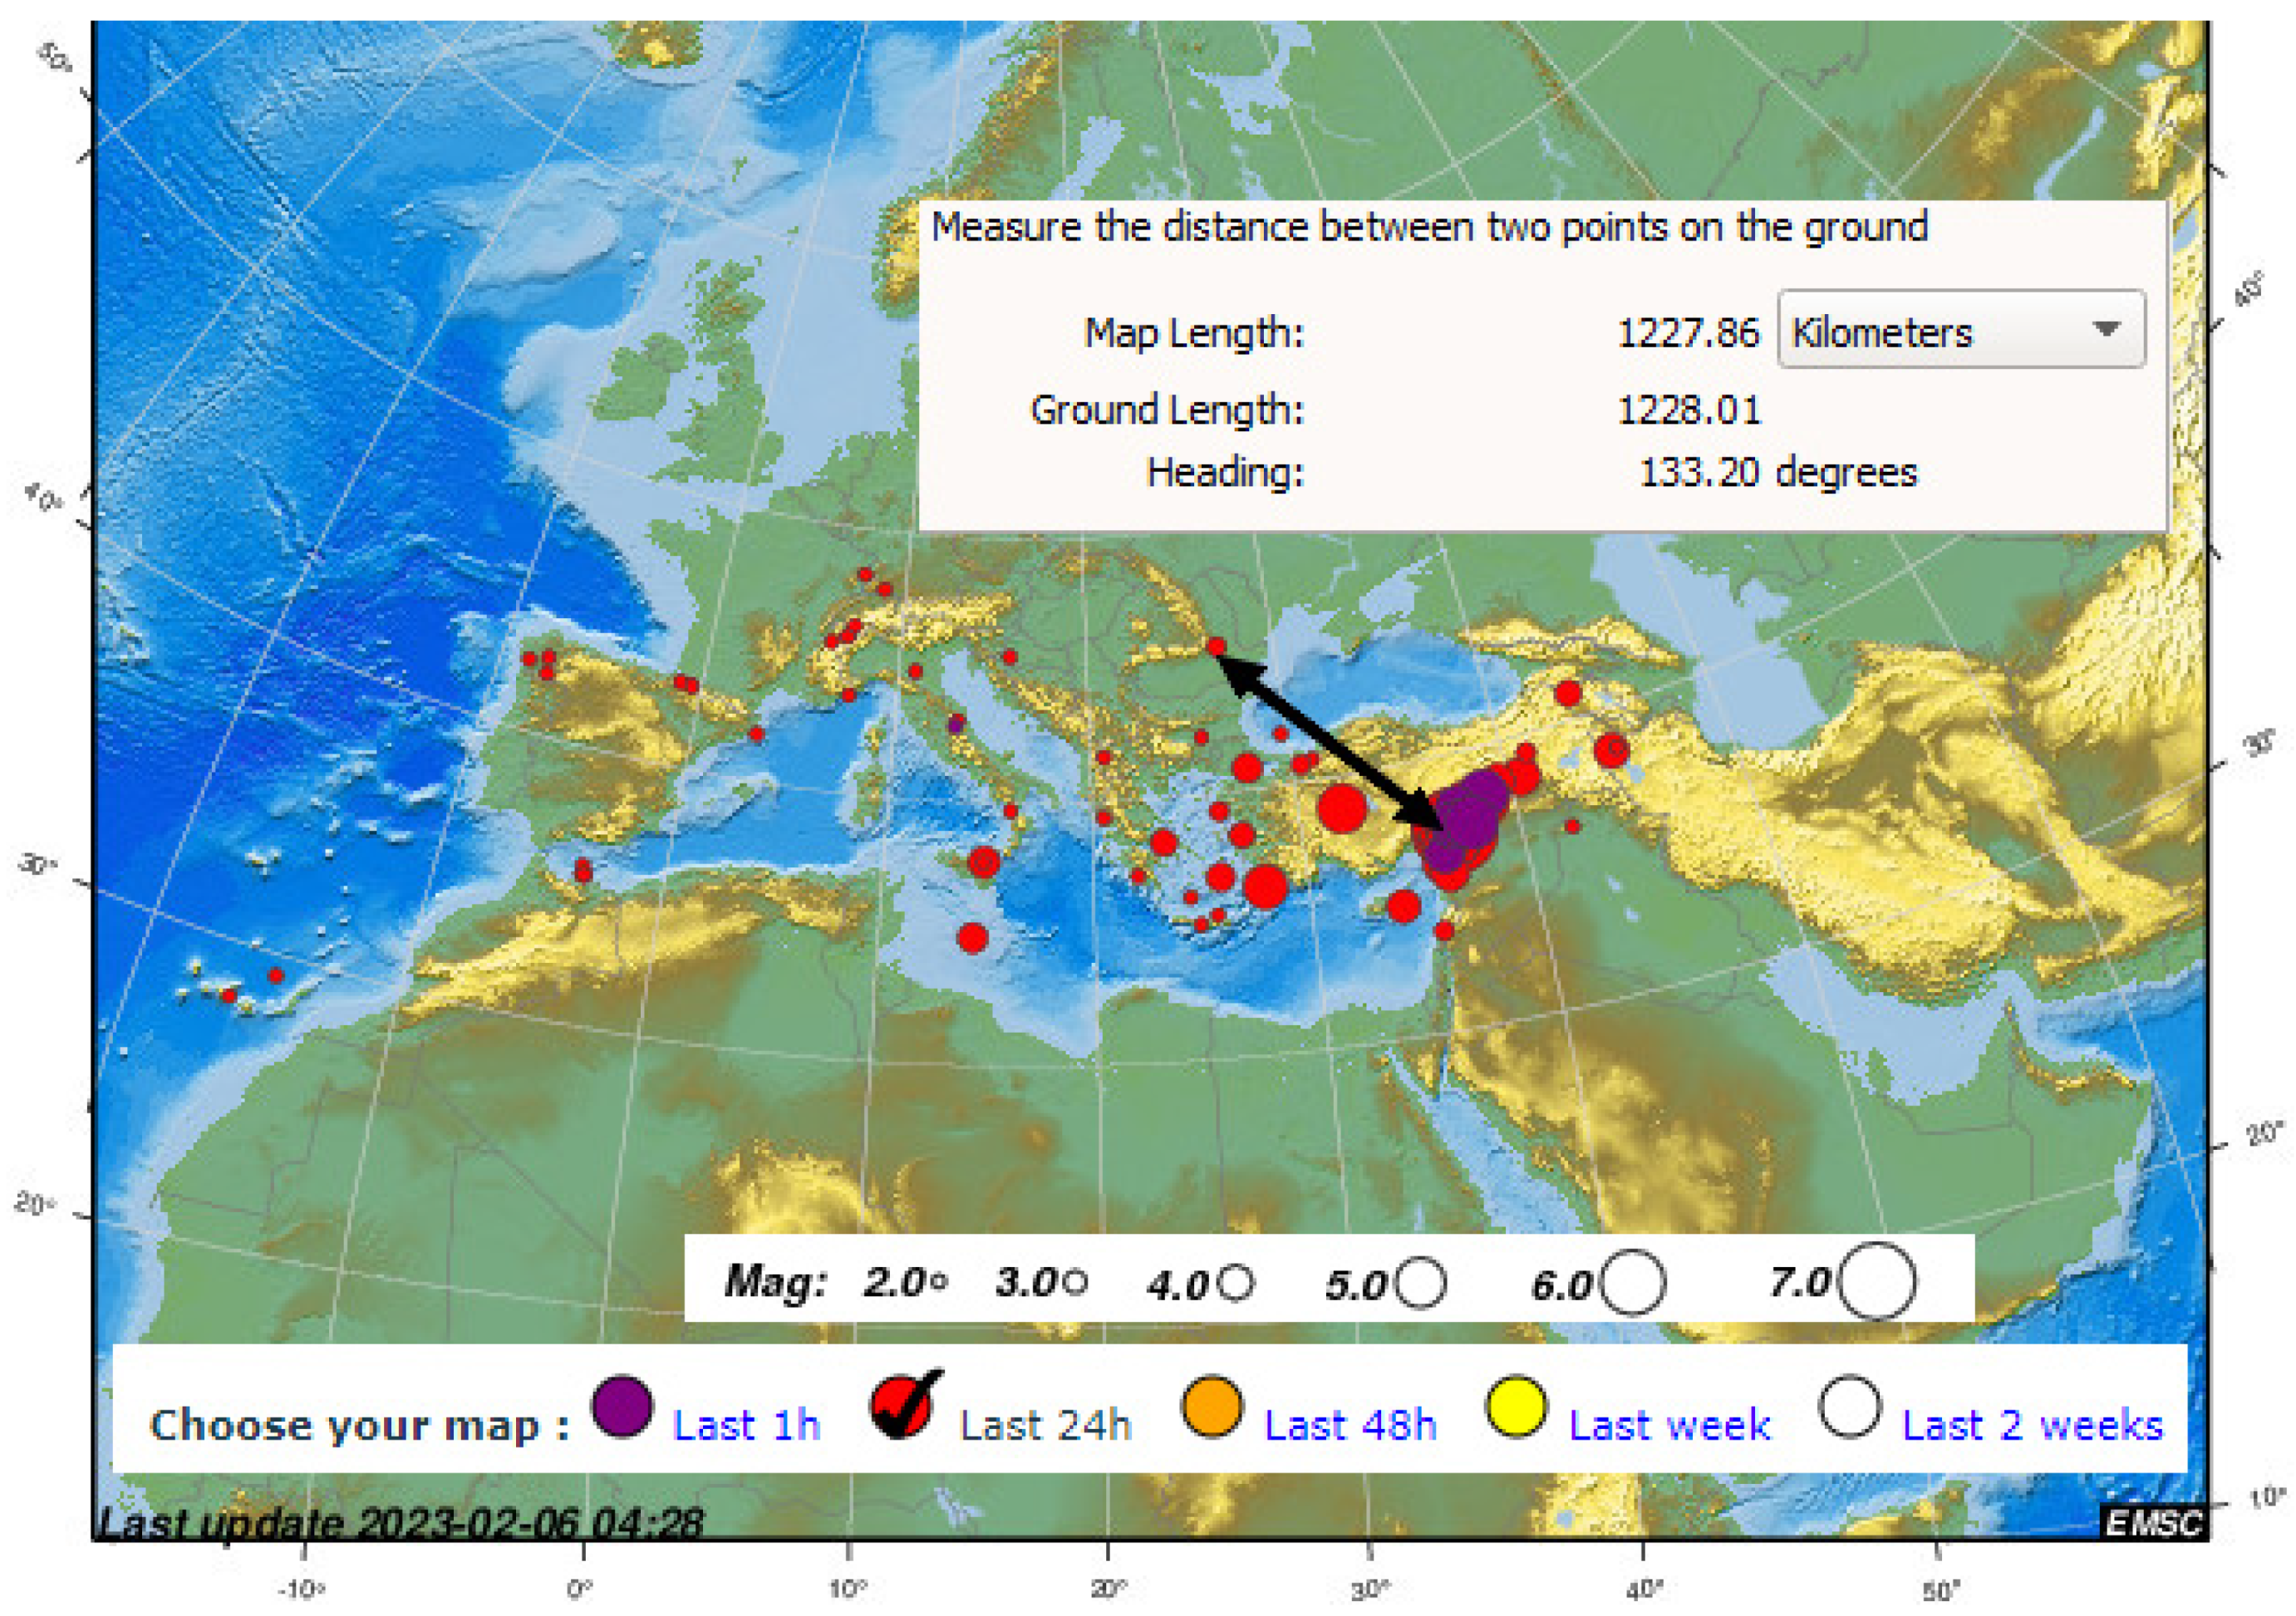
Figure 4.
Superposition of the earthquake swarm in Romania with the seismic events in Turkey (6 February 2023, 7.8 R and 7.5 R), picture EMSC/CSEM,
http://www.emsc-csem.org/, accessed on 6 February 2023.
Figure 4.
Superposition of the earthquake swarm in Romania with the seismic events in Turkey (6 February 2023, 7.8 R and 7.5 R), picture EMSC/CSEM,
http://www.emsc-csem.org/, accessed on 6 February 2023.
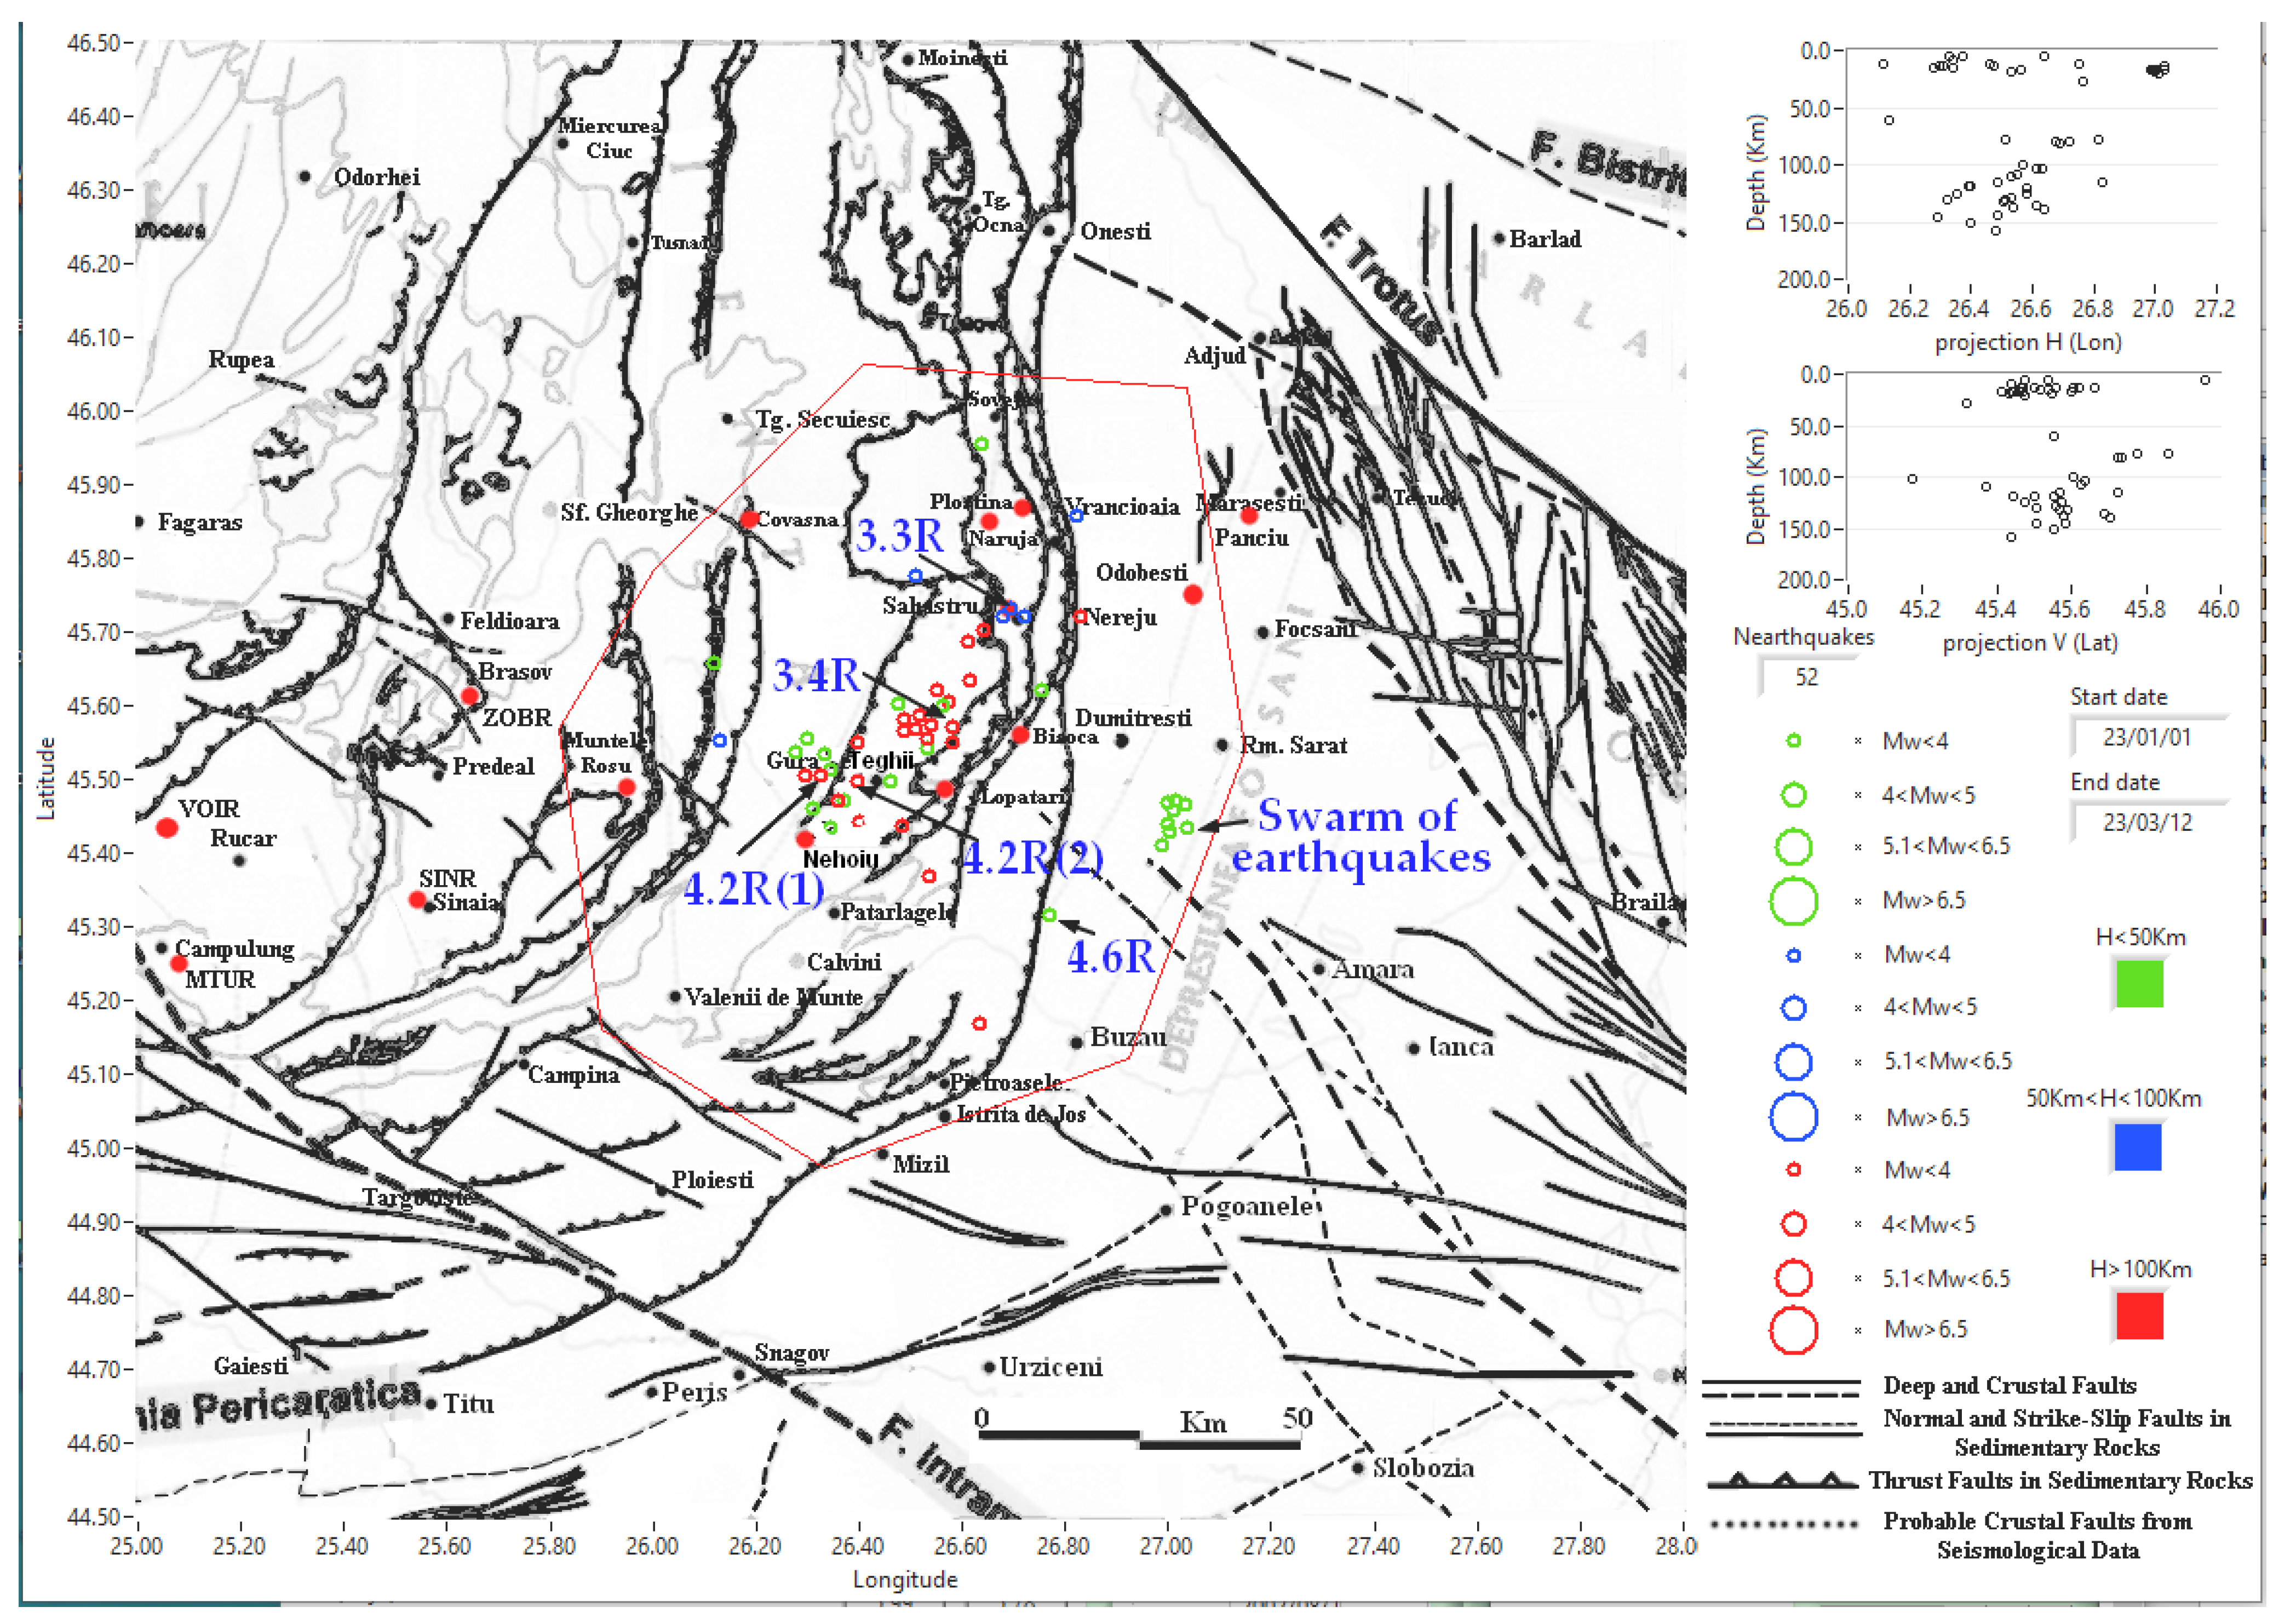
Figure 5.
Vrancea seismicity and the correlation of epicenters with geological faults, 1 January 2023–12 March 2023; swarm of Râmnicu Sărat earthquakes (green circles) and 4.2 R earthquakes sequence; faults are according Project CEEX NR.647/2005 CEEX 647 (C. Dinu, V. Răileanu et al.).
Figure 5.
Vrancea seismicity and the correlation of epicenters with geological faults, 1 January 2023–12 March 2023; swarm of Râmnicu Sărat earthquakes (green circles) and 4.2 R earthquakes sequence; faults are according Project CEEX NR.647/2005 CEEX 647 (C. Dinu, V. Răileanu et al.).
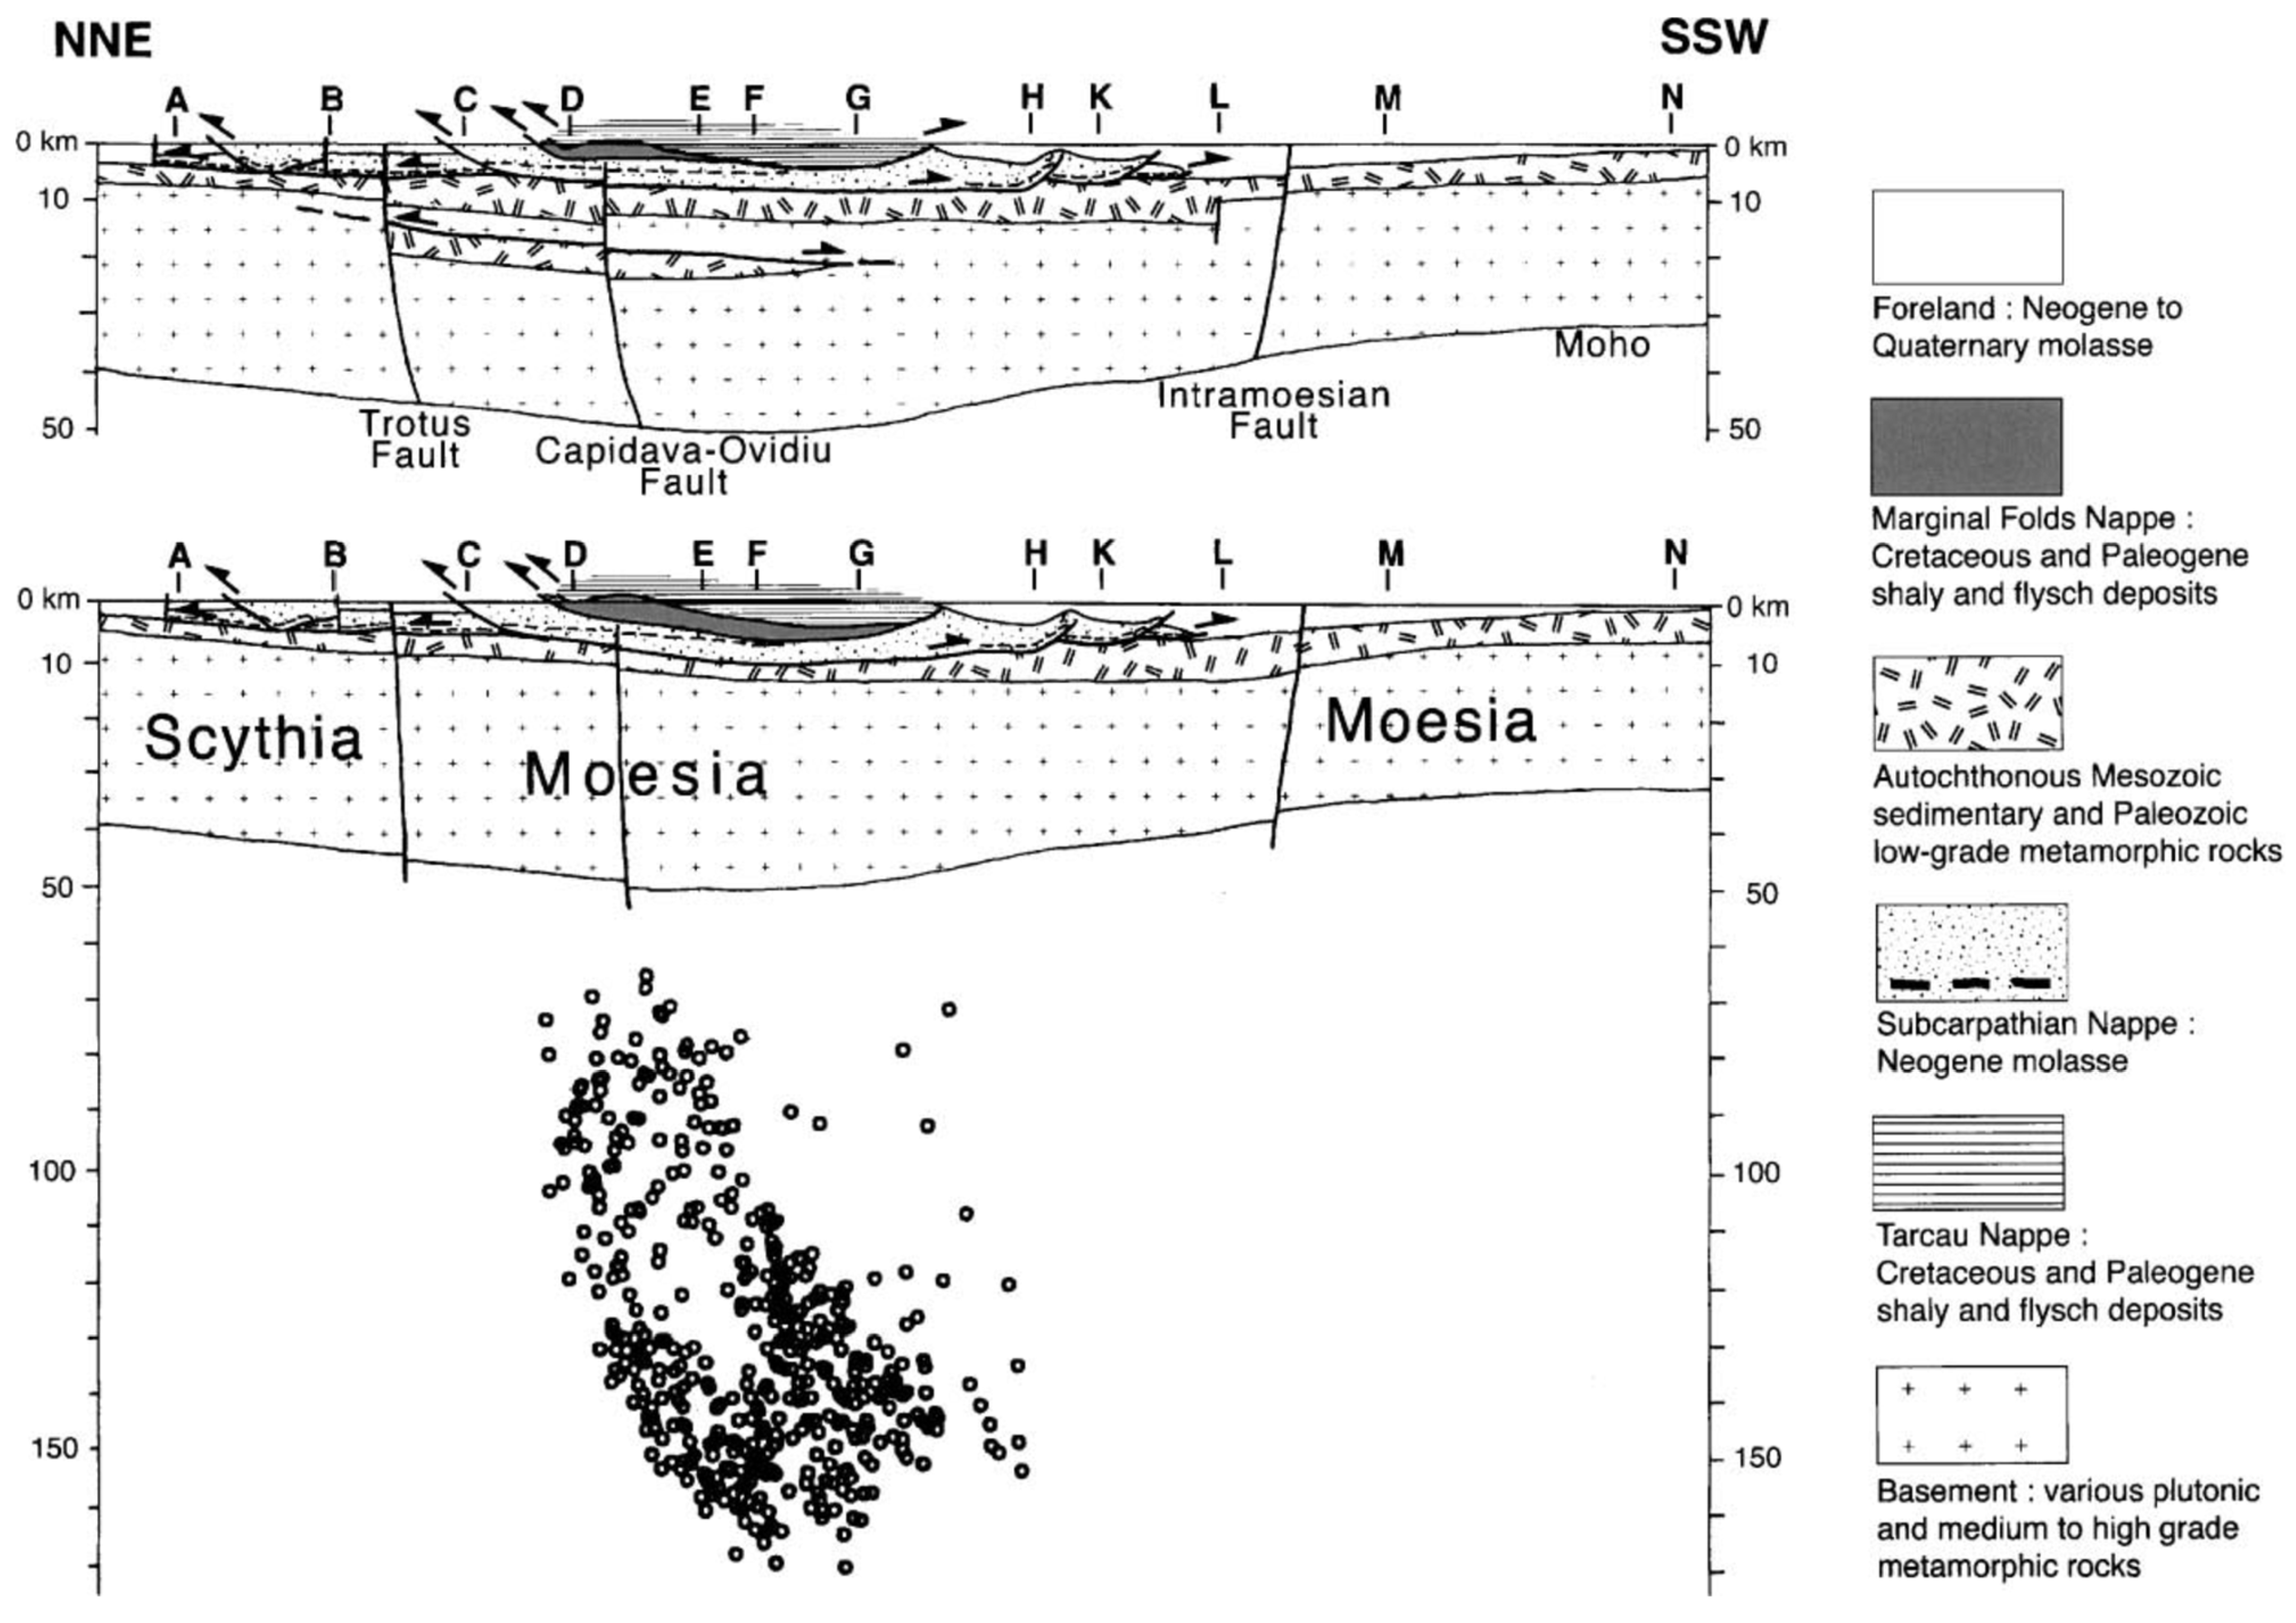
Figure 6.
Pre-1999 geological section along the main NNE–SSW VRANCEA99 [
40].
Figure 6.
Pre-1999 geological section along the main NNE–SSW VRANCEA99 [
40].
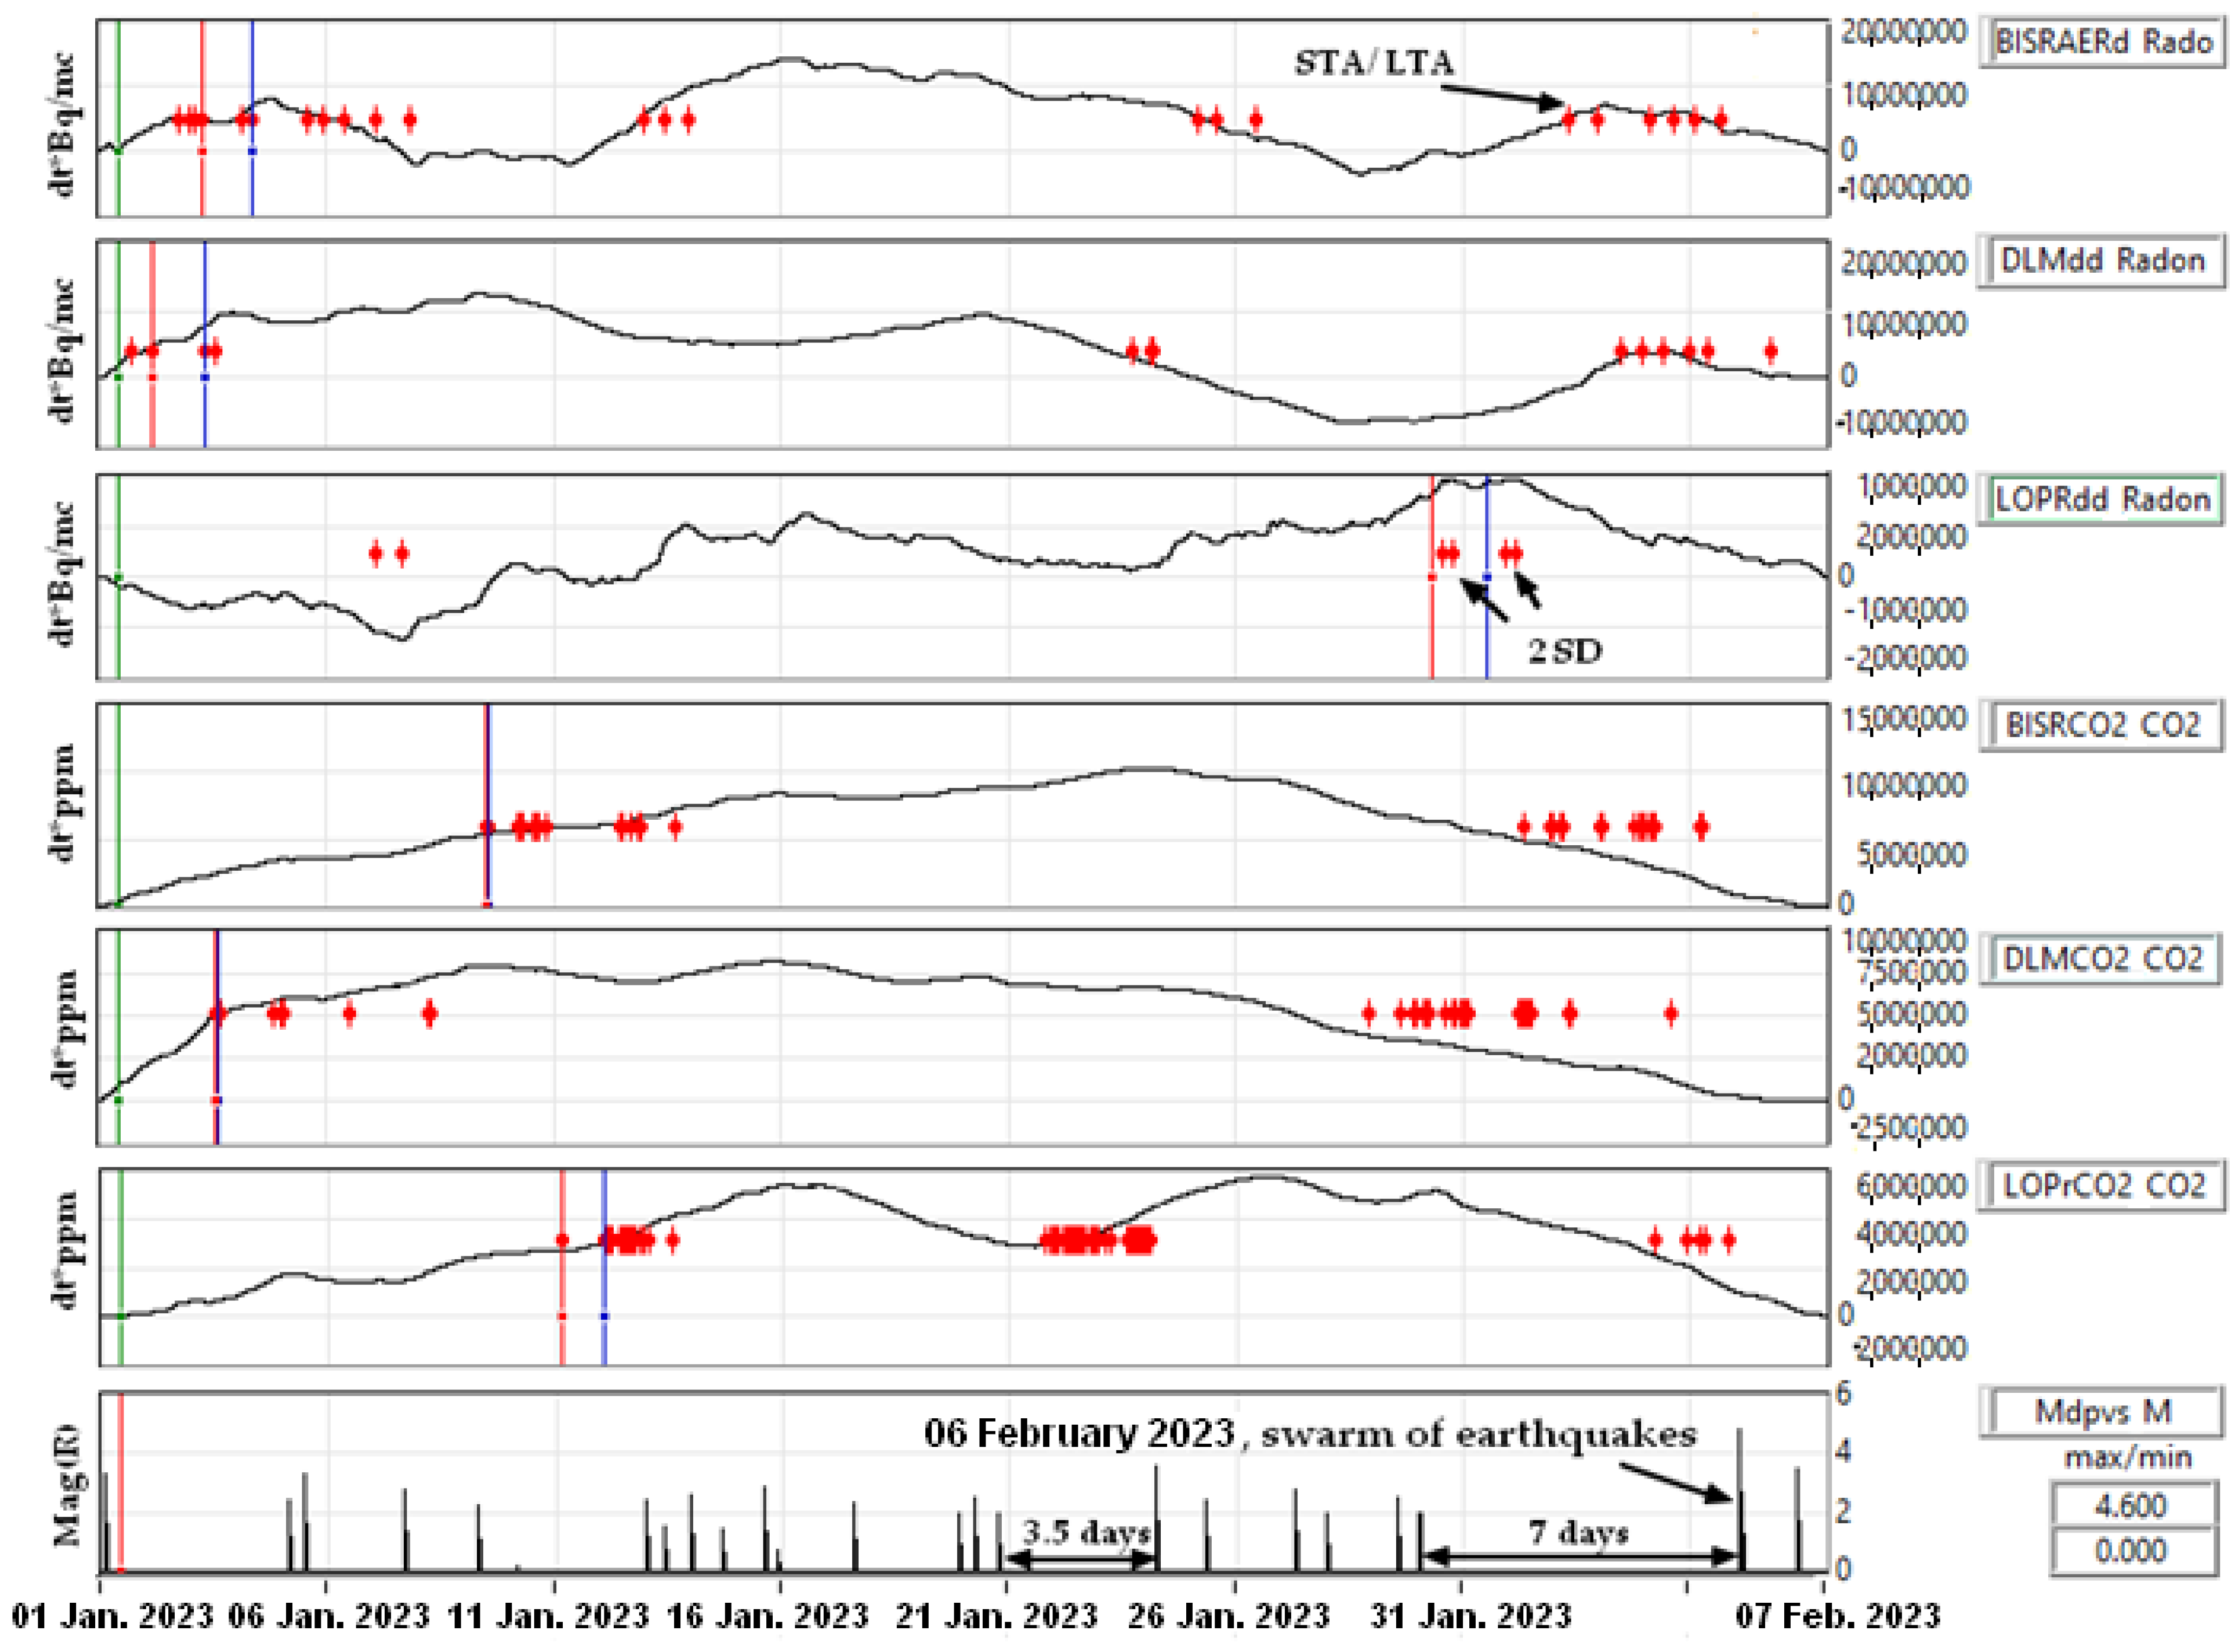
Figure 7.
The evolution of radon and CO2 preceding the earthquake sequence near Râmnicu Sărat, detections marked with red dots.
Figure 7.
The evolution of radon and CO2 preceding the earthquake sequence near Râmnicu Sărat, detections marked with red dots.
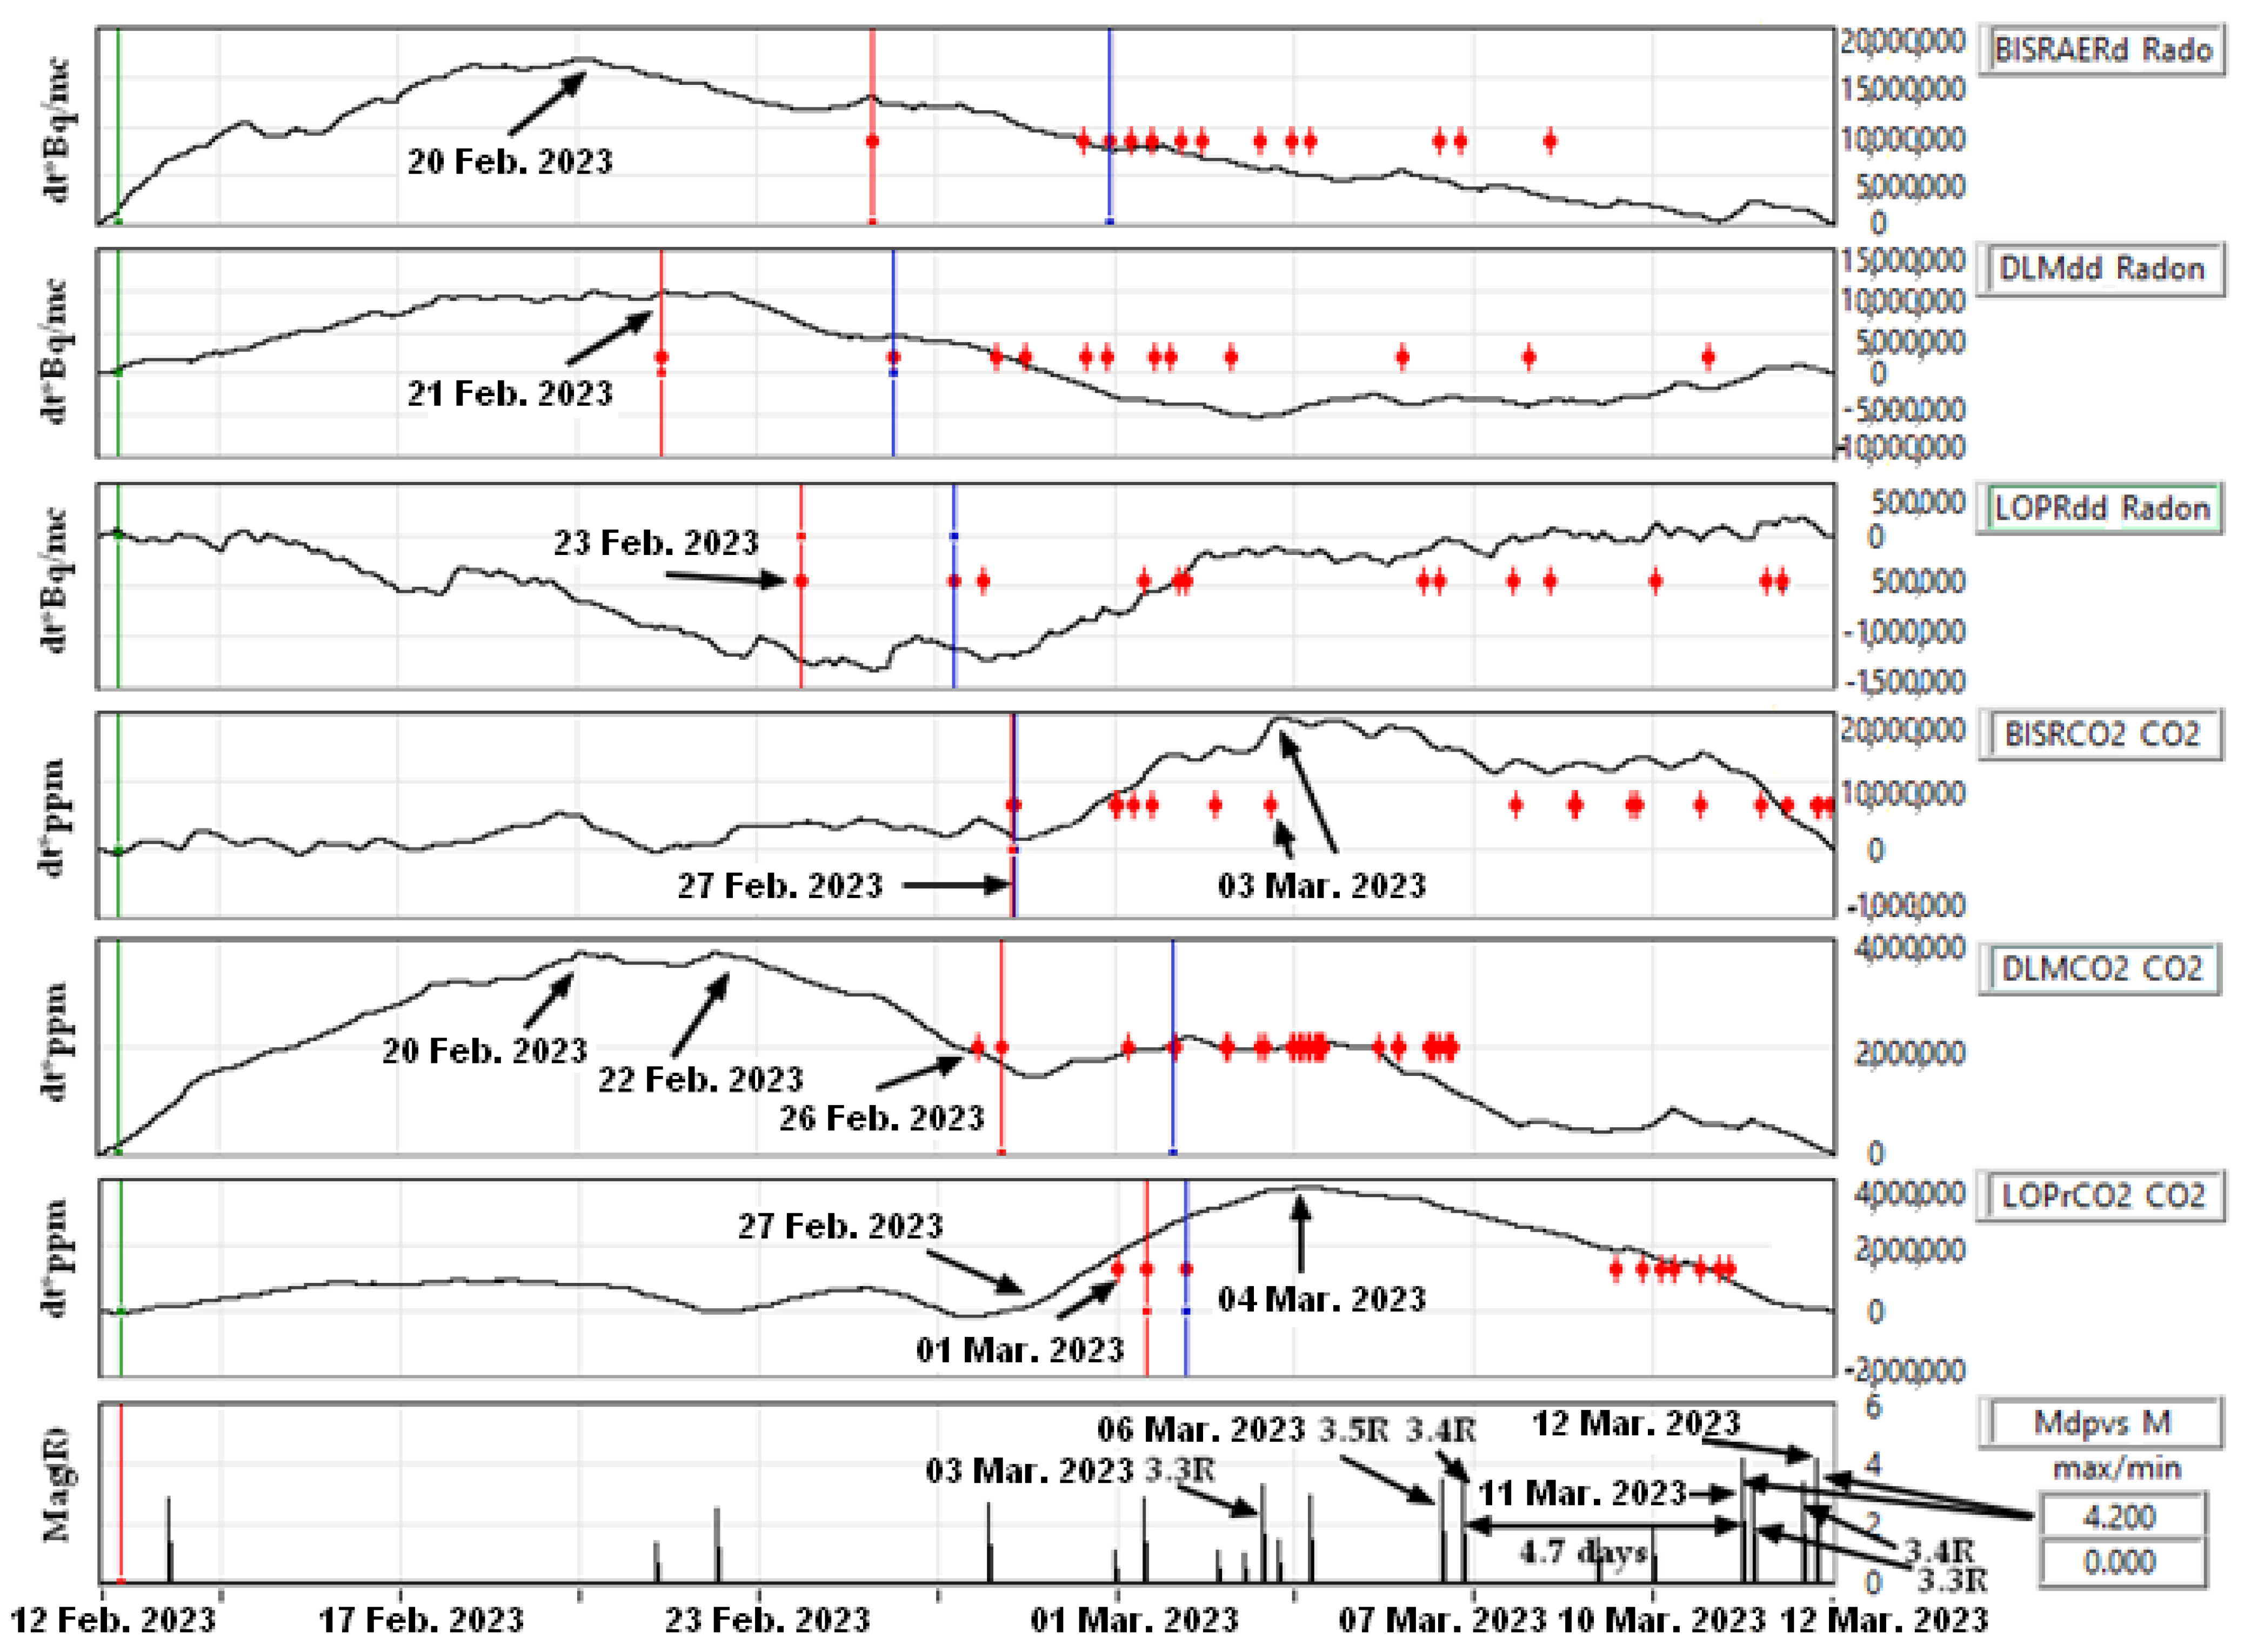
Figure 8.
The evolution of radon and CO2 for the 4.2 R earthquakes sequence, detections marked with red dots.
Figure 8.
The evolution of radon and CO2 for the 4.2 R earthquakes sequence, detections marked with red dots.
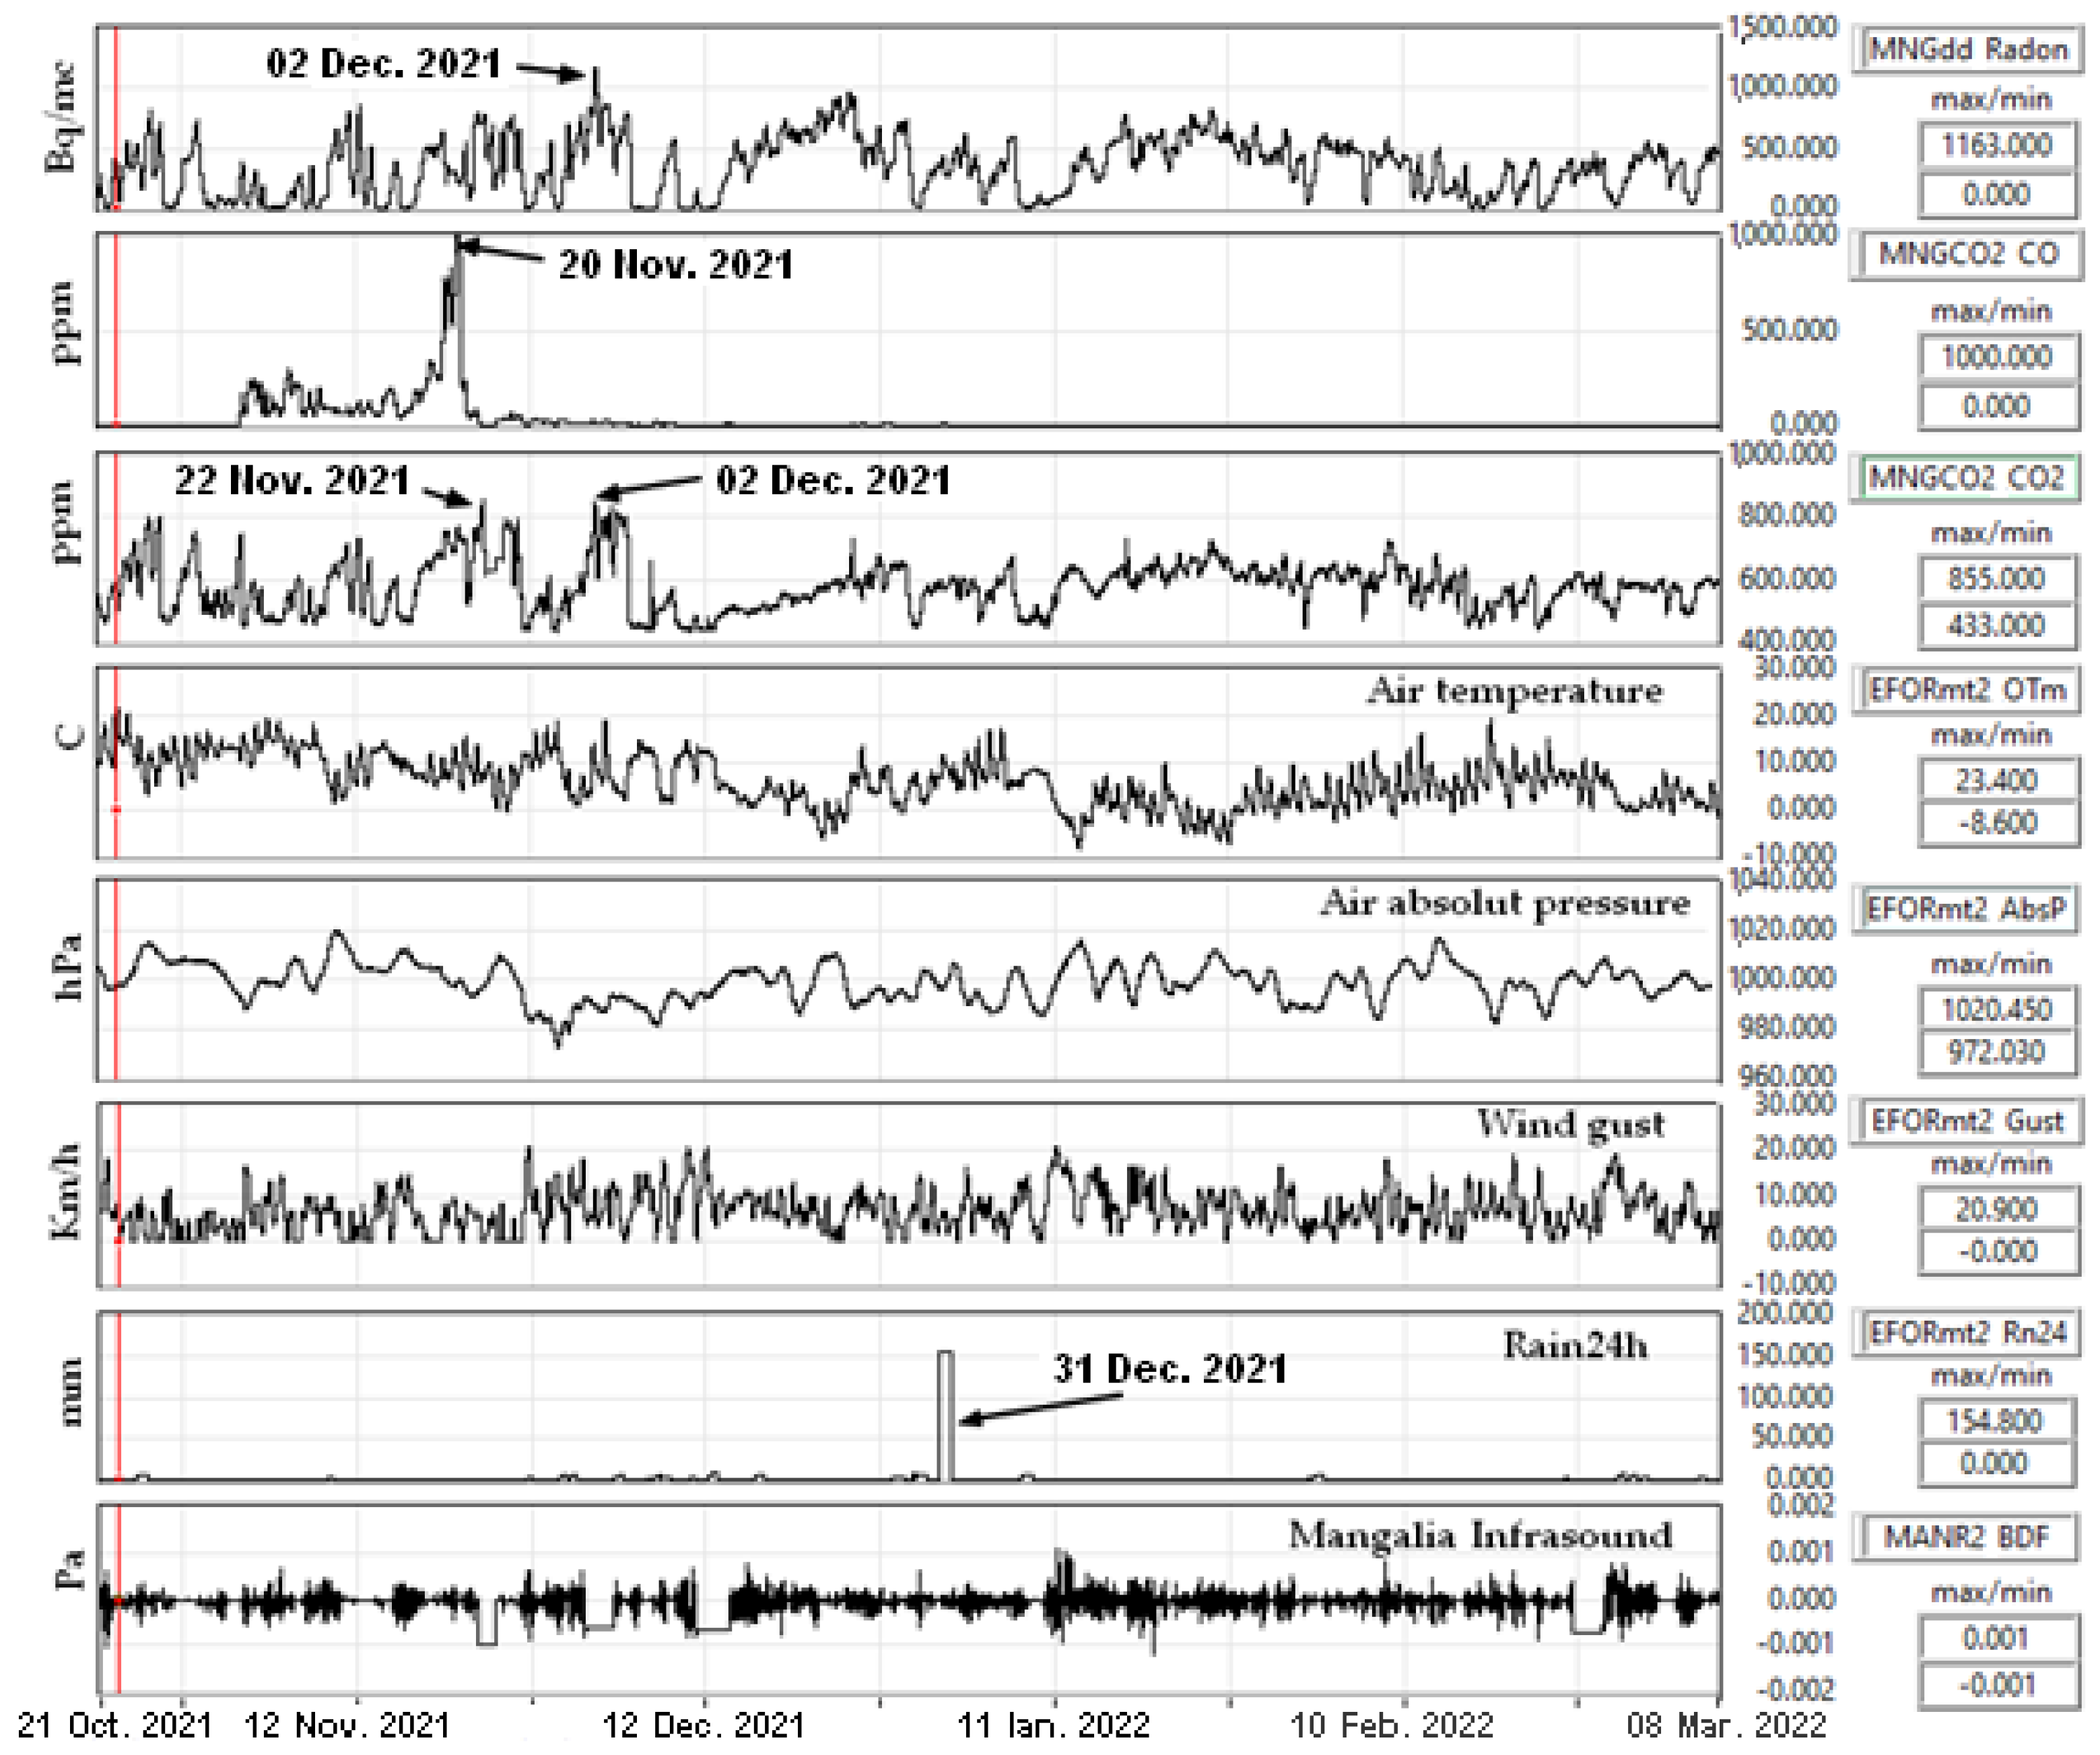
Figure 9.
The case of Mangalia: the evolution of radon, CO2, and atmospheric conditions.
Figure 9.
The case of Mangalia: the evolution of radon, CO2, and atmospheric conditions.
Figure 10.
Surlari monitoring station: (a) radon, CO2, and CO equipment; (b) the location is in a forest.
Figure 10.
Surlari monitoring station: (a) radon, CO2, and CO equipment; (b) the location is in a forest.
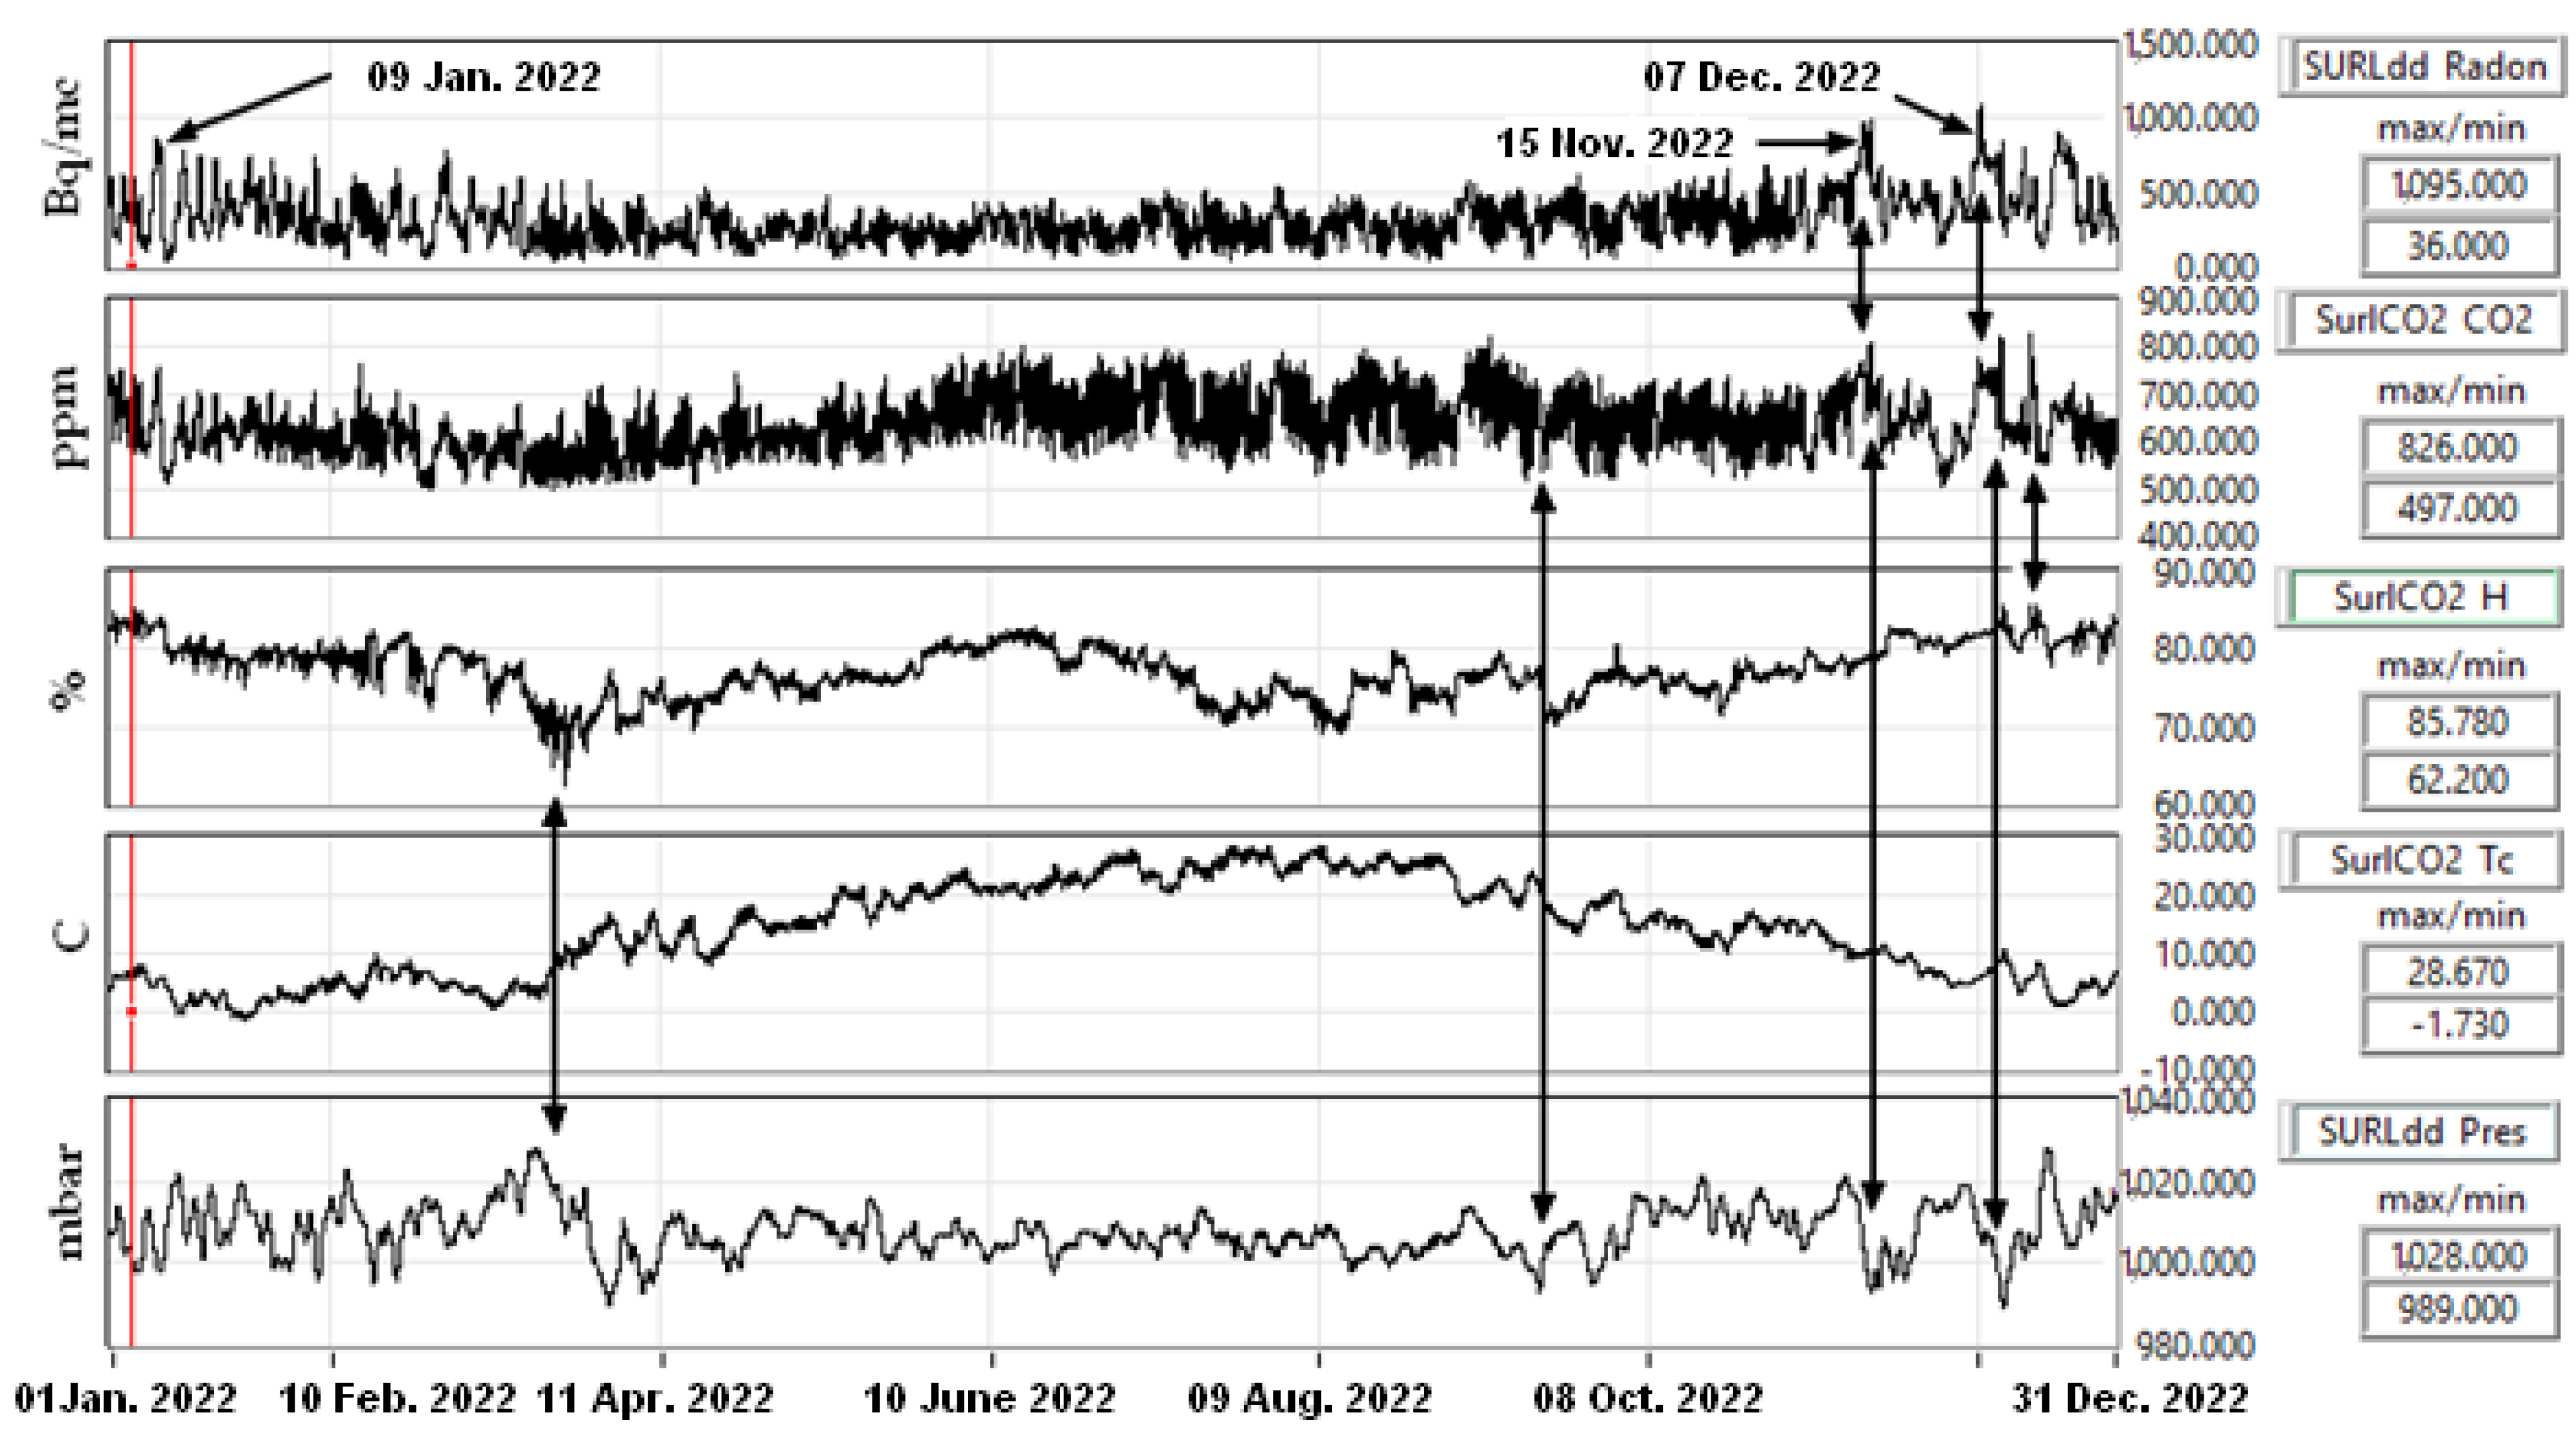
Figure 11.
Radon, CO2, temperature, and air pressure in Surlari station (SURLdd).
Figure 11.
Radon, CO2, temperature, and air pressure in Surlari station (SURLdd).
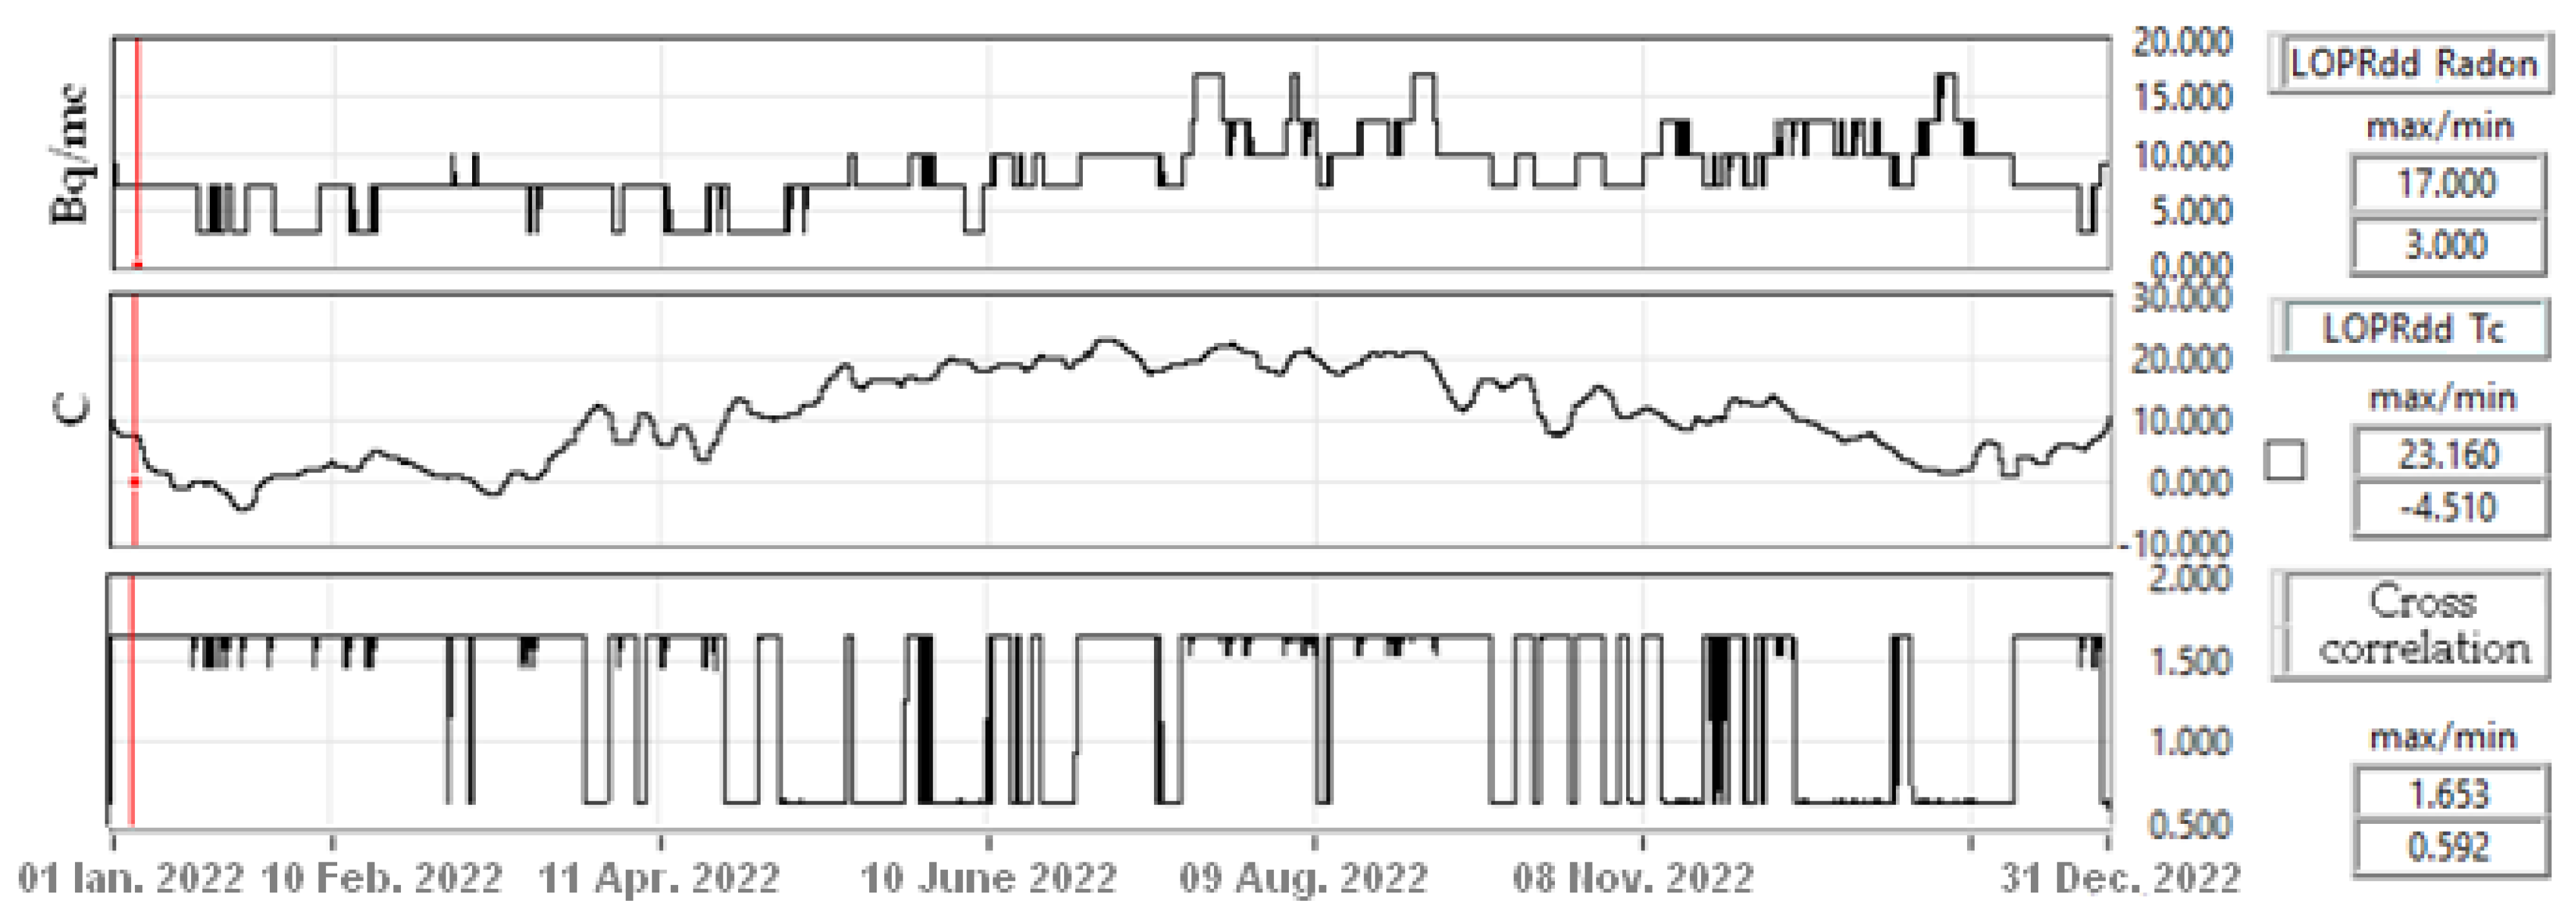
Figure 12.
Cross-correlation between radon and humidity in Lopatari station, 2022, 1 h intervals.
Figure 12.
Cross-correlation between radon and humidity in Lopatari station, 2022, 1 h intervals.
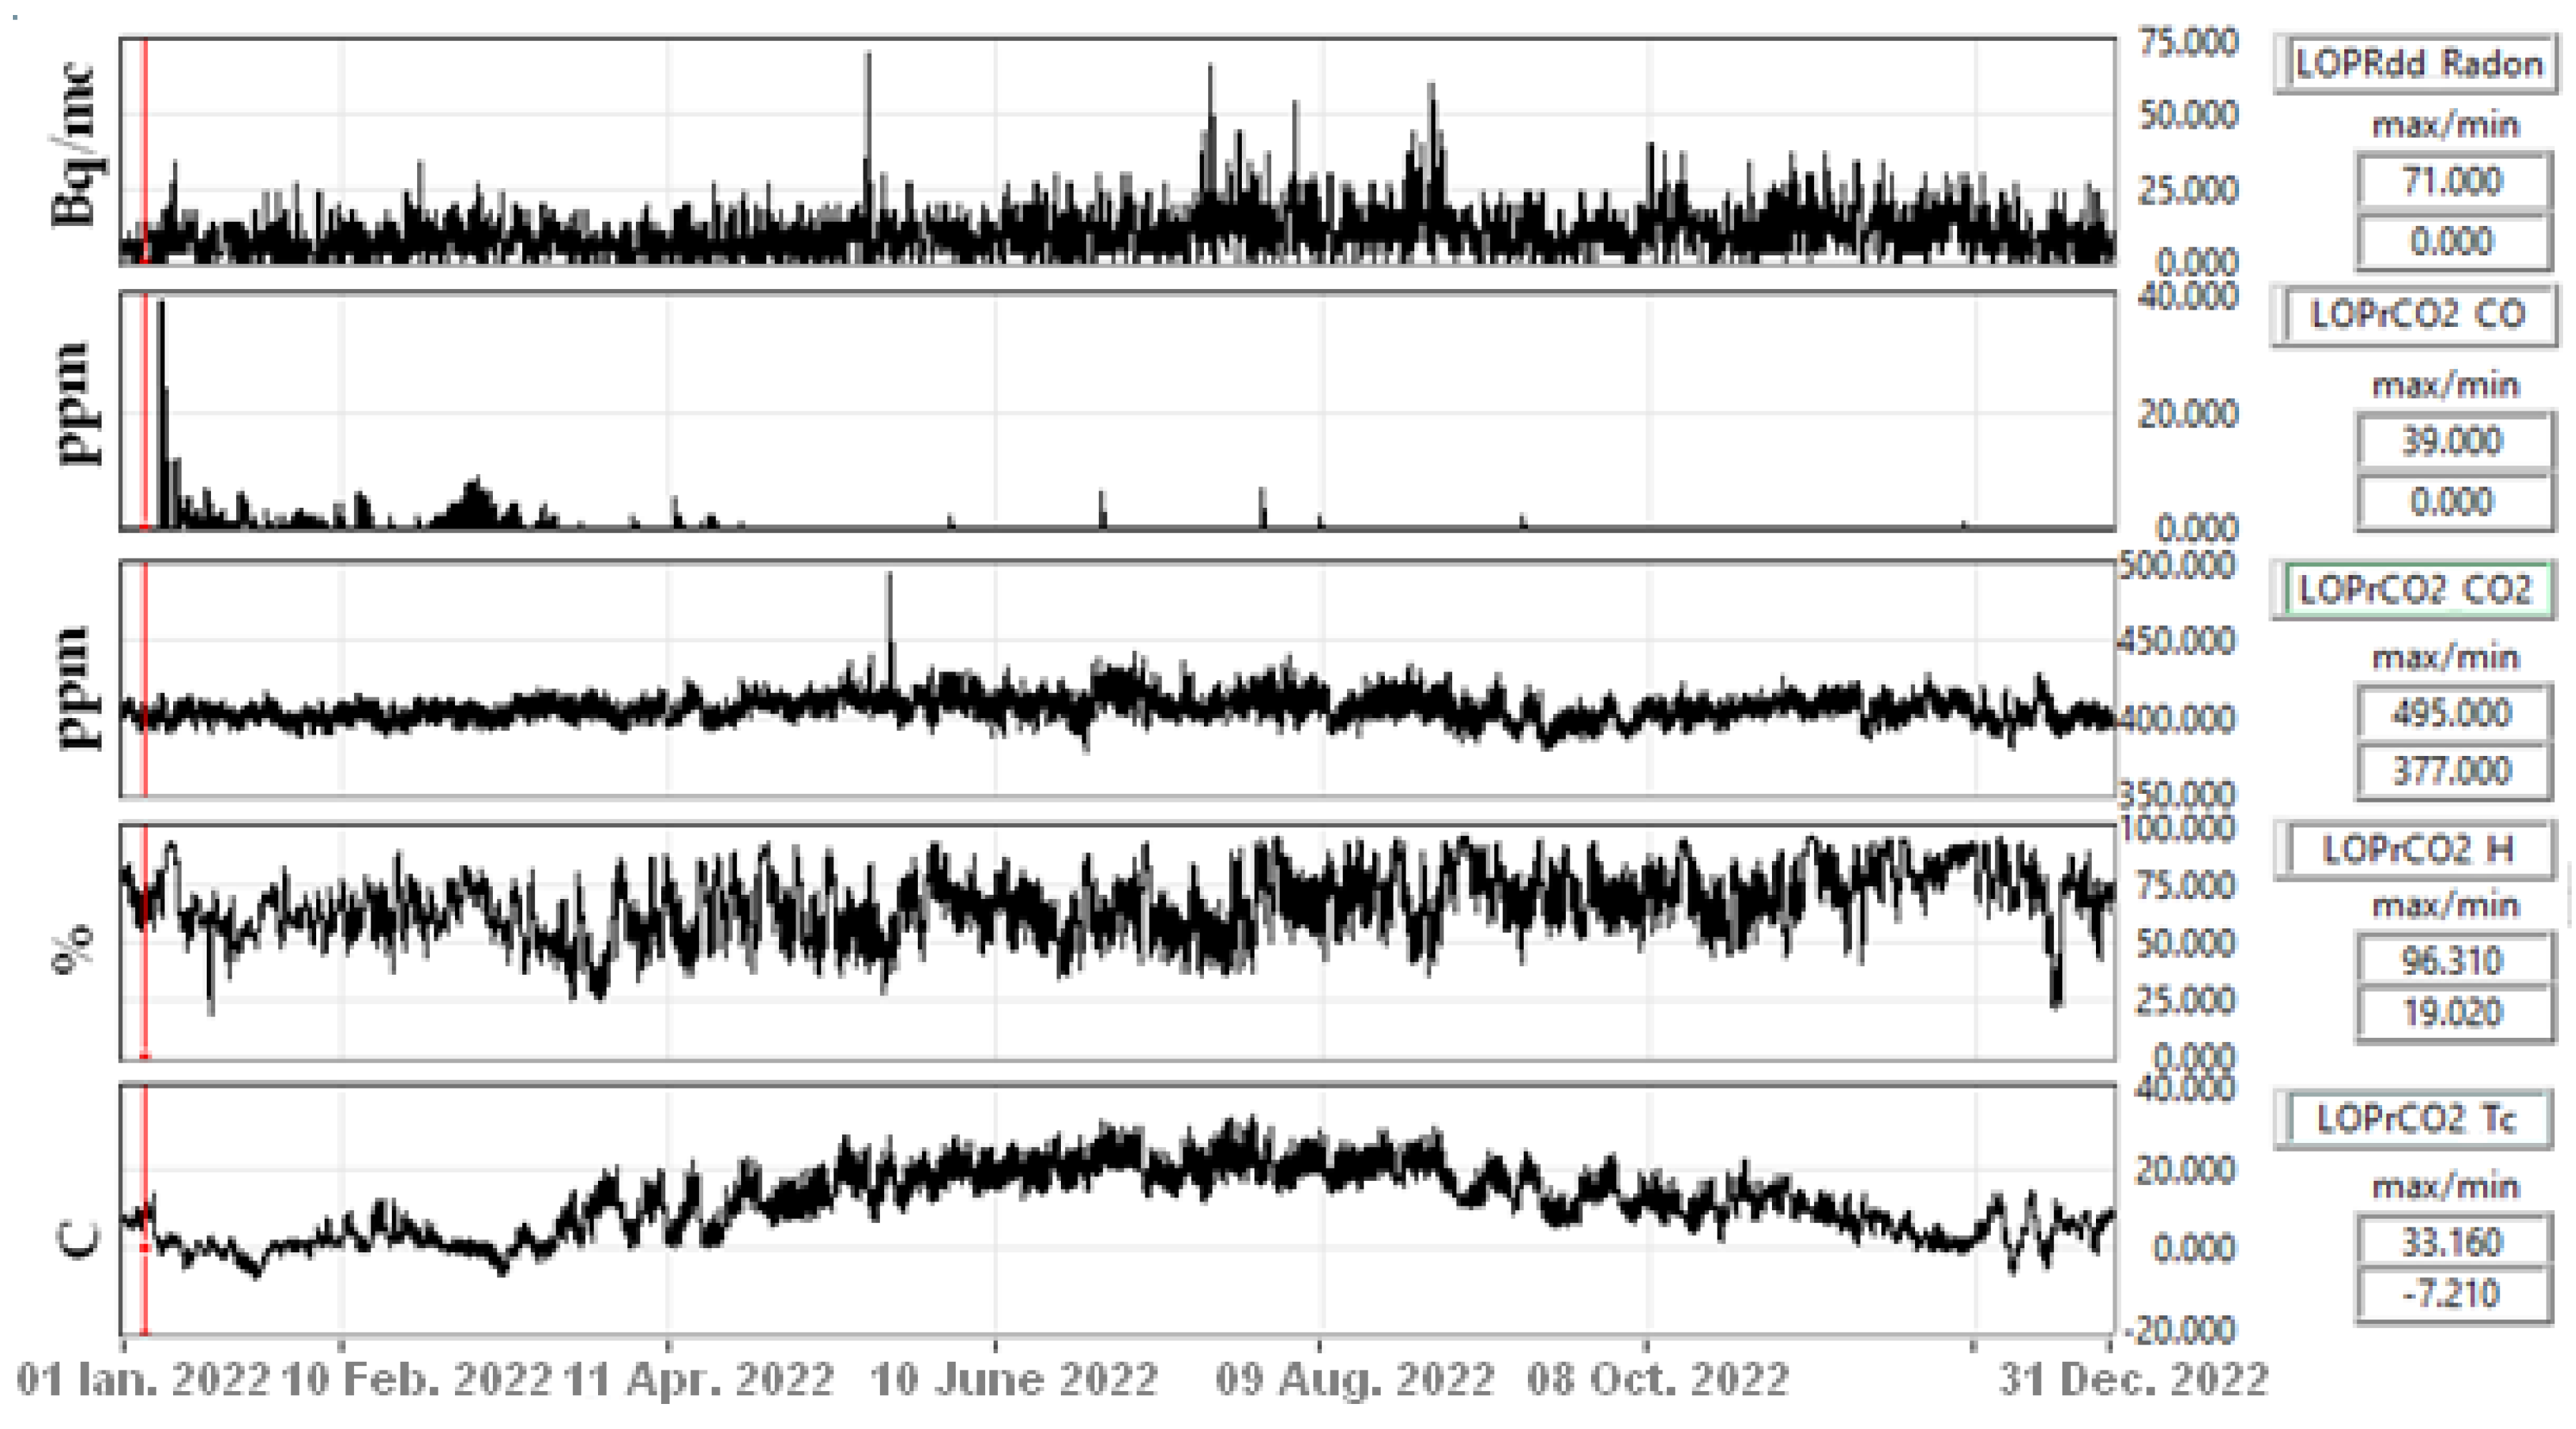
Figure 13.
Gas emissions in Lopatari, 2022.
Figure 13.
Gas emissions in Lopatari, 2022.
Figure 14.
Dependence of radon on atmospheric factors, 2022.
Figure 14.
Dependence of radon on atmospheric factors, 2022.
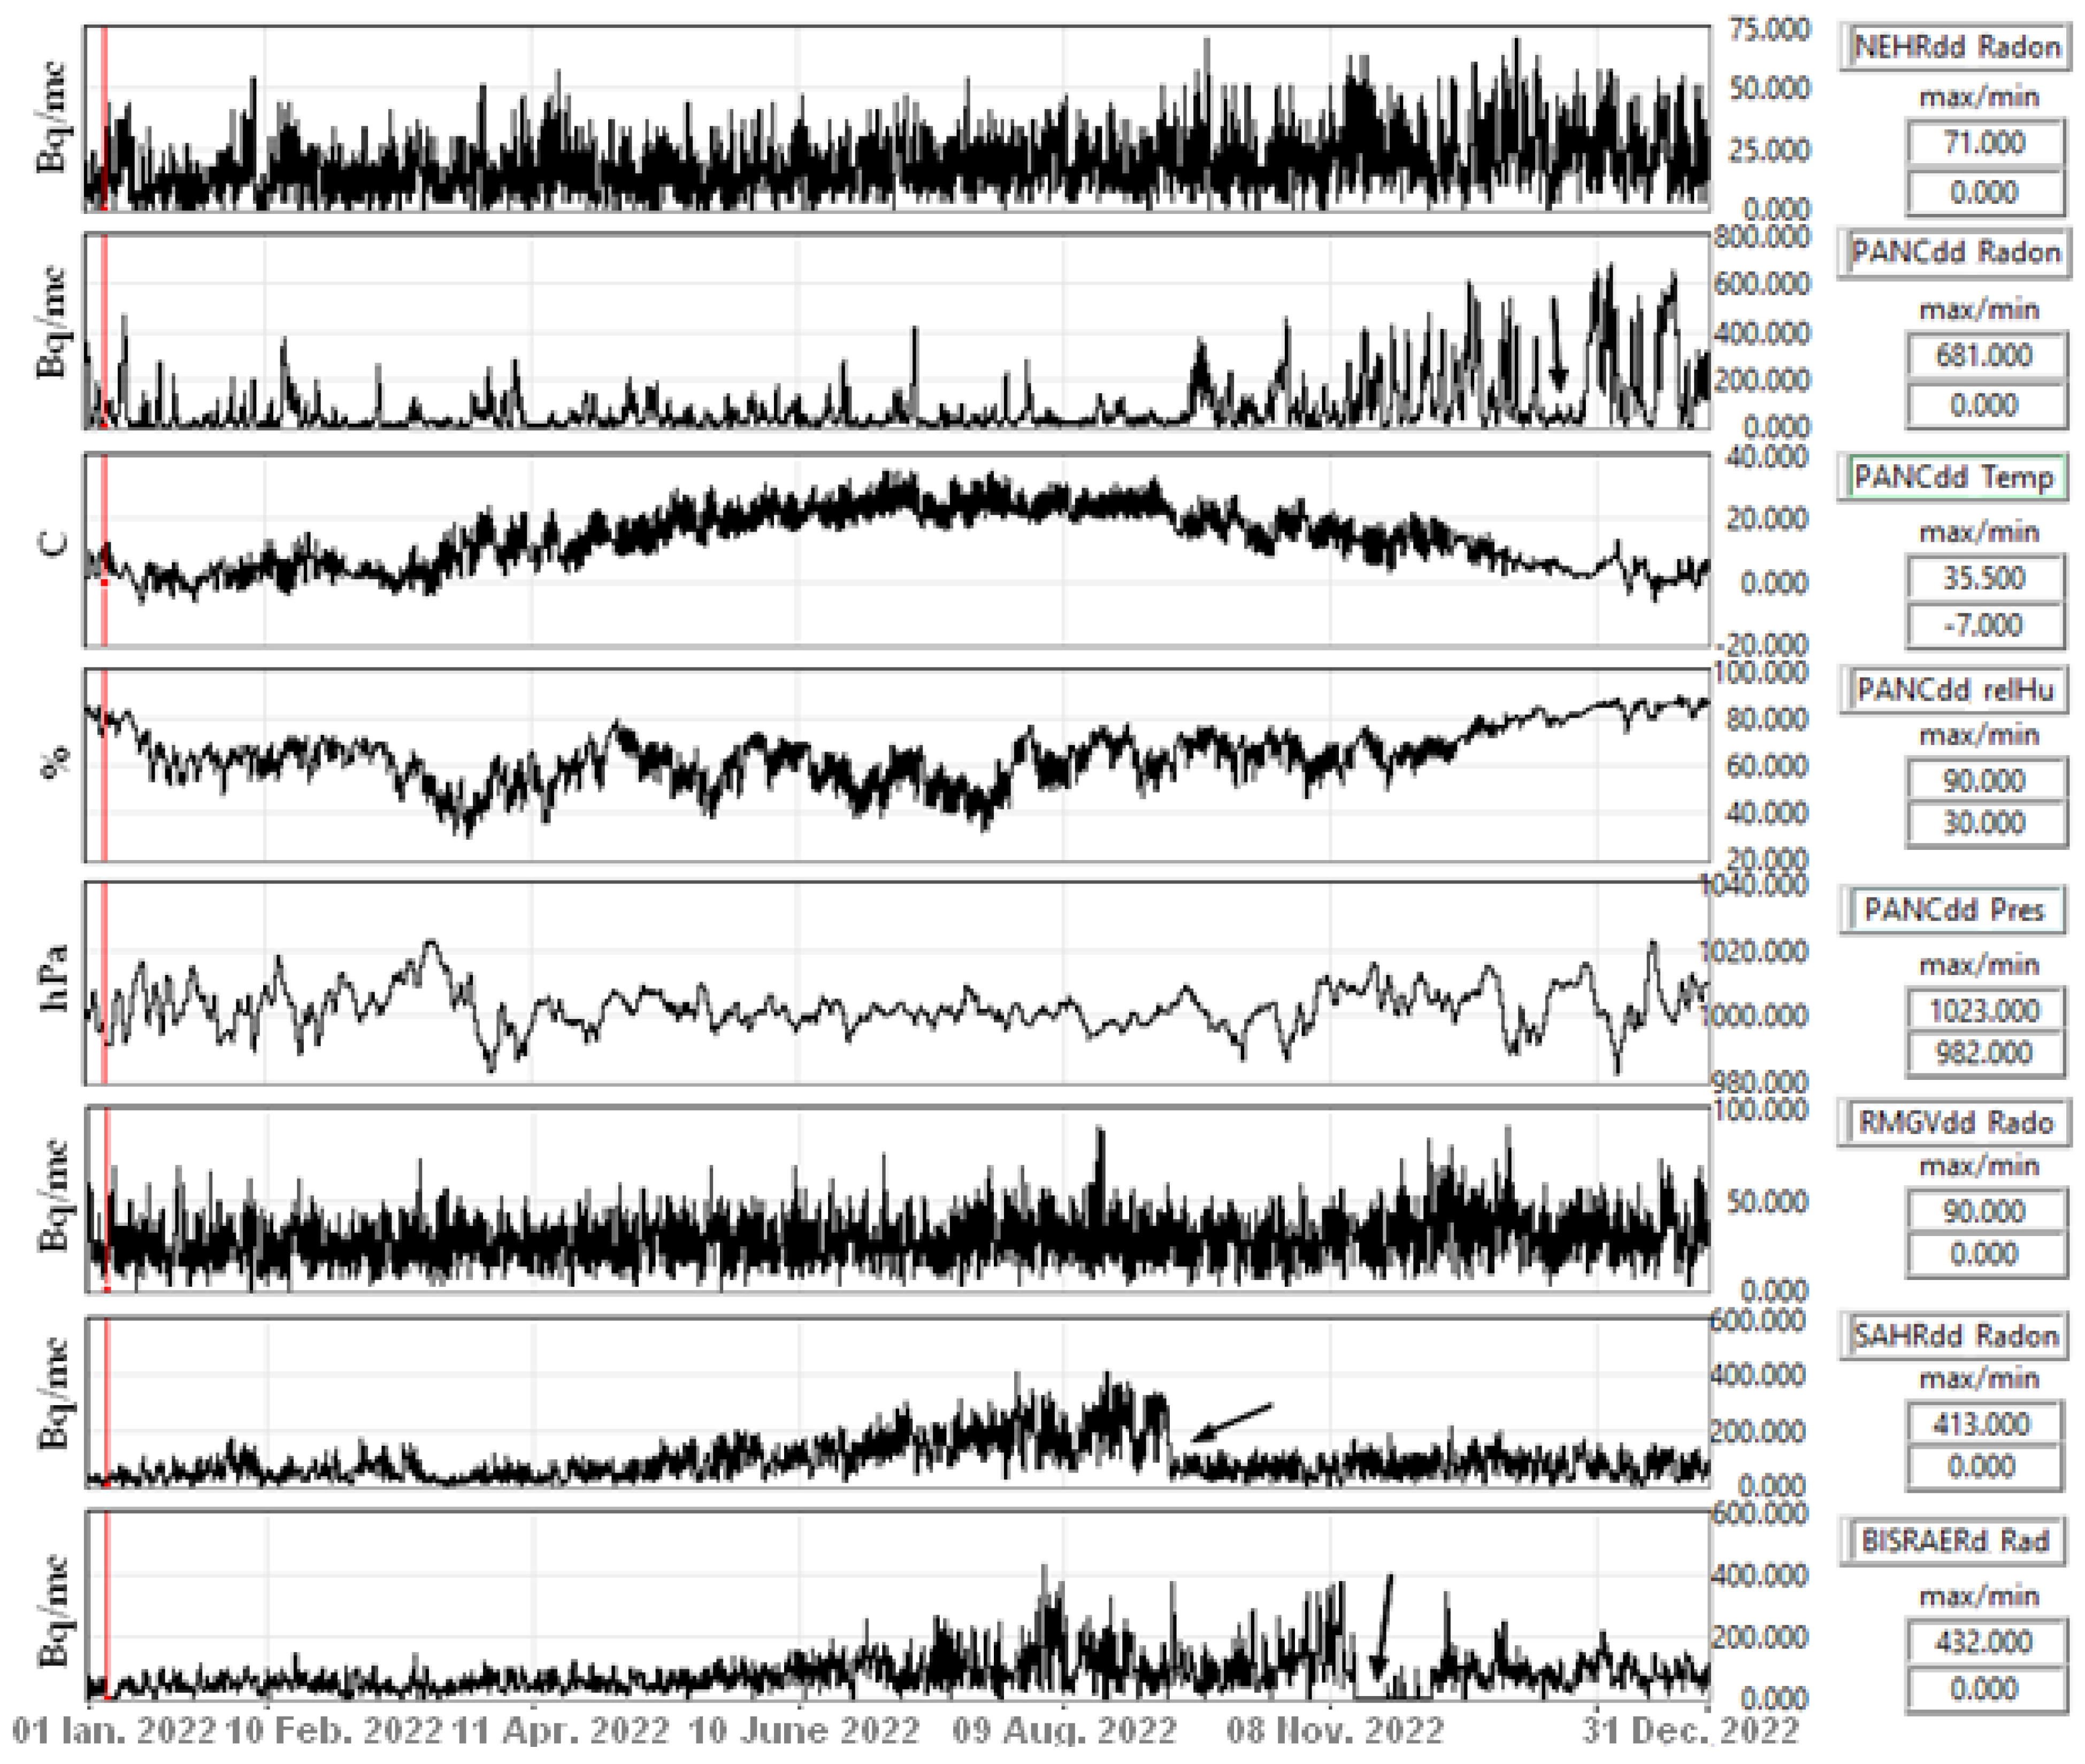
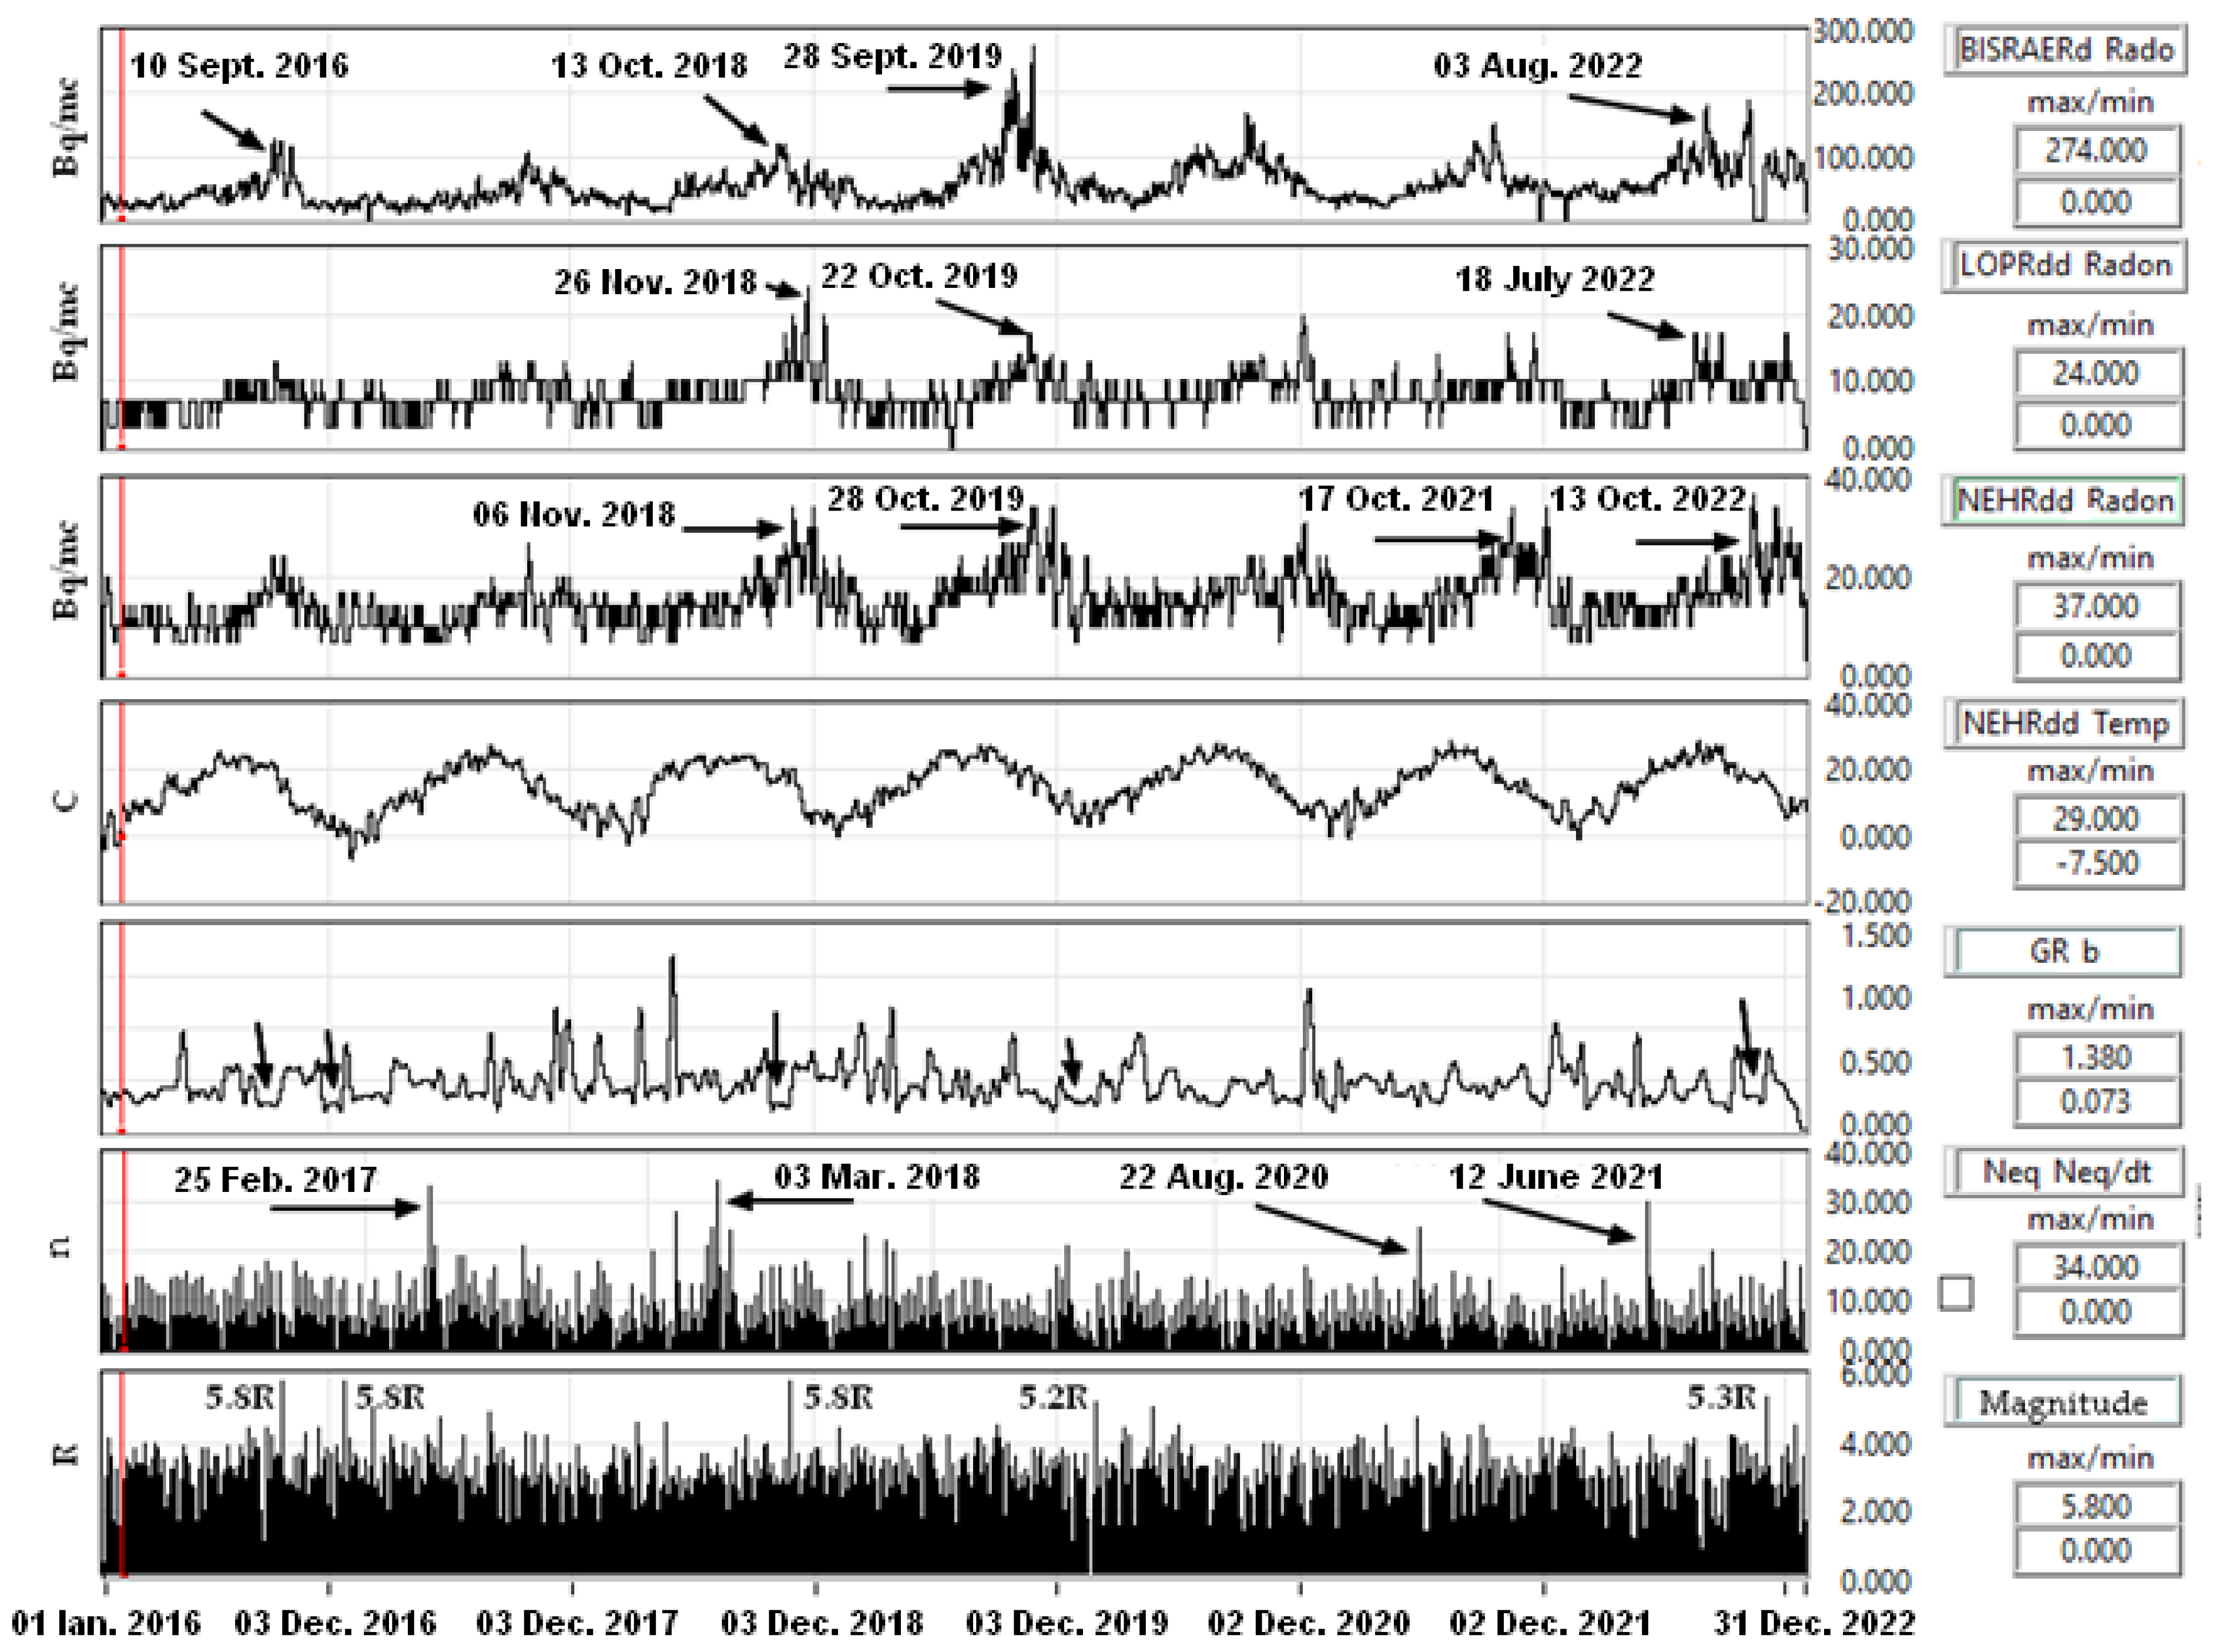
Figure 15.
The annual evolution of radon in Nehoiu (NEHRdd) and environmental factors.
Figure 15.
The annual evolution of radon in Nehoiu (NEHRdd) and environmental factors.
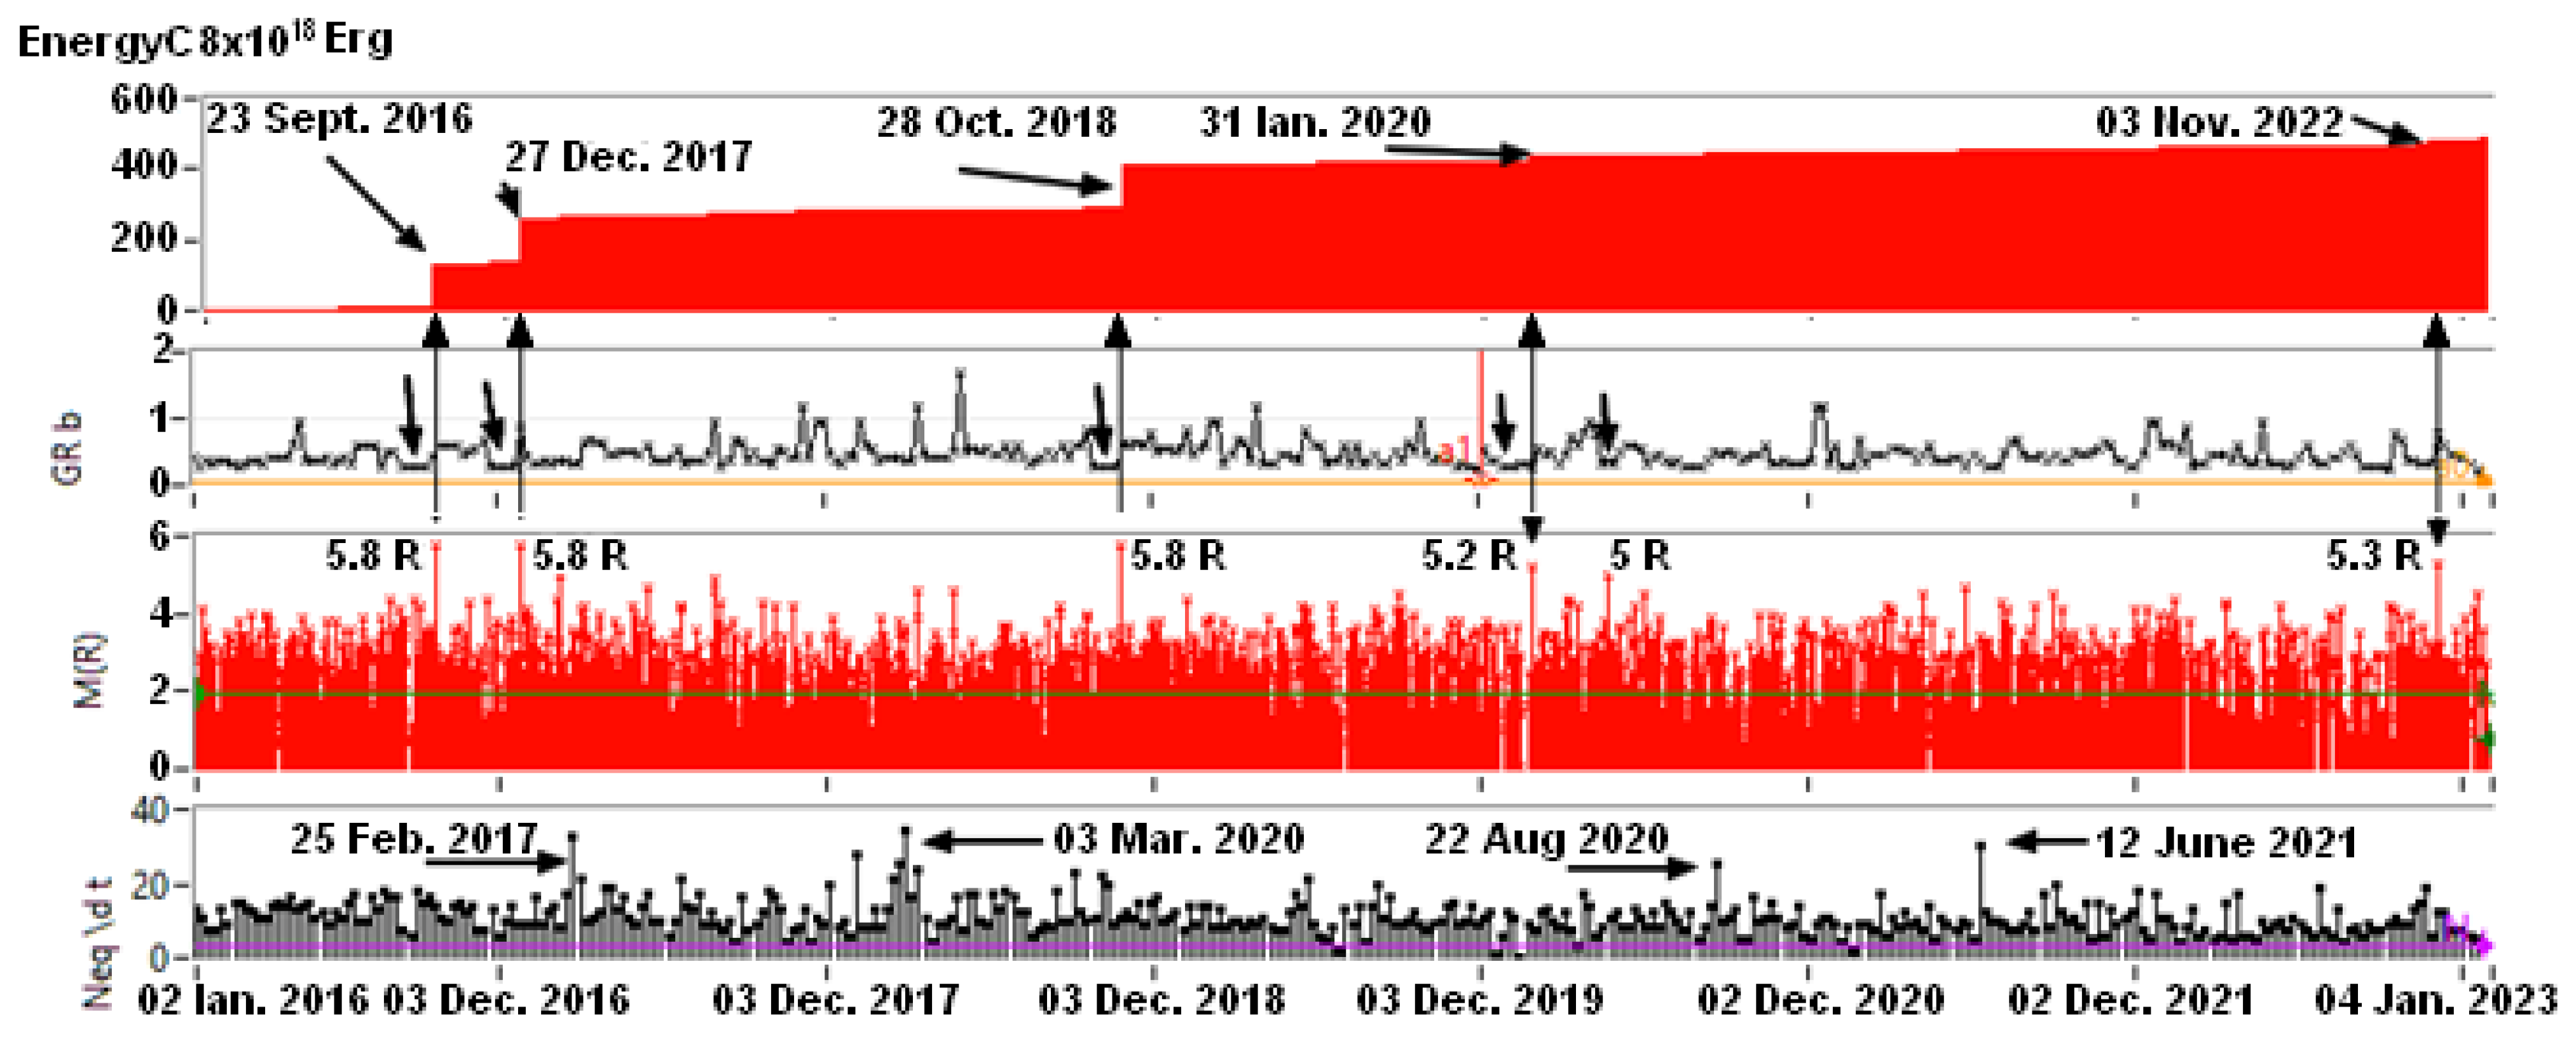
Figure 16.
Cumulative seismic energy, the Gutenberg–Richter parameter ‘b’, seismicity, and the number of earthquakes produced in a 7-day interval.
Figure 16.
Cumulative seismic energy, the Gutenberg–Richter parameter ‘b’, seismicity, and the number of earthquakes produced in a 7-day interval.
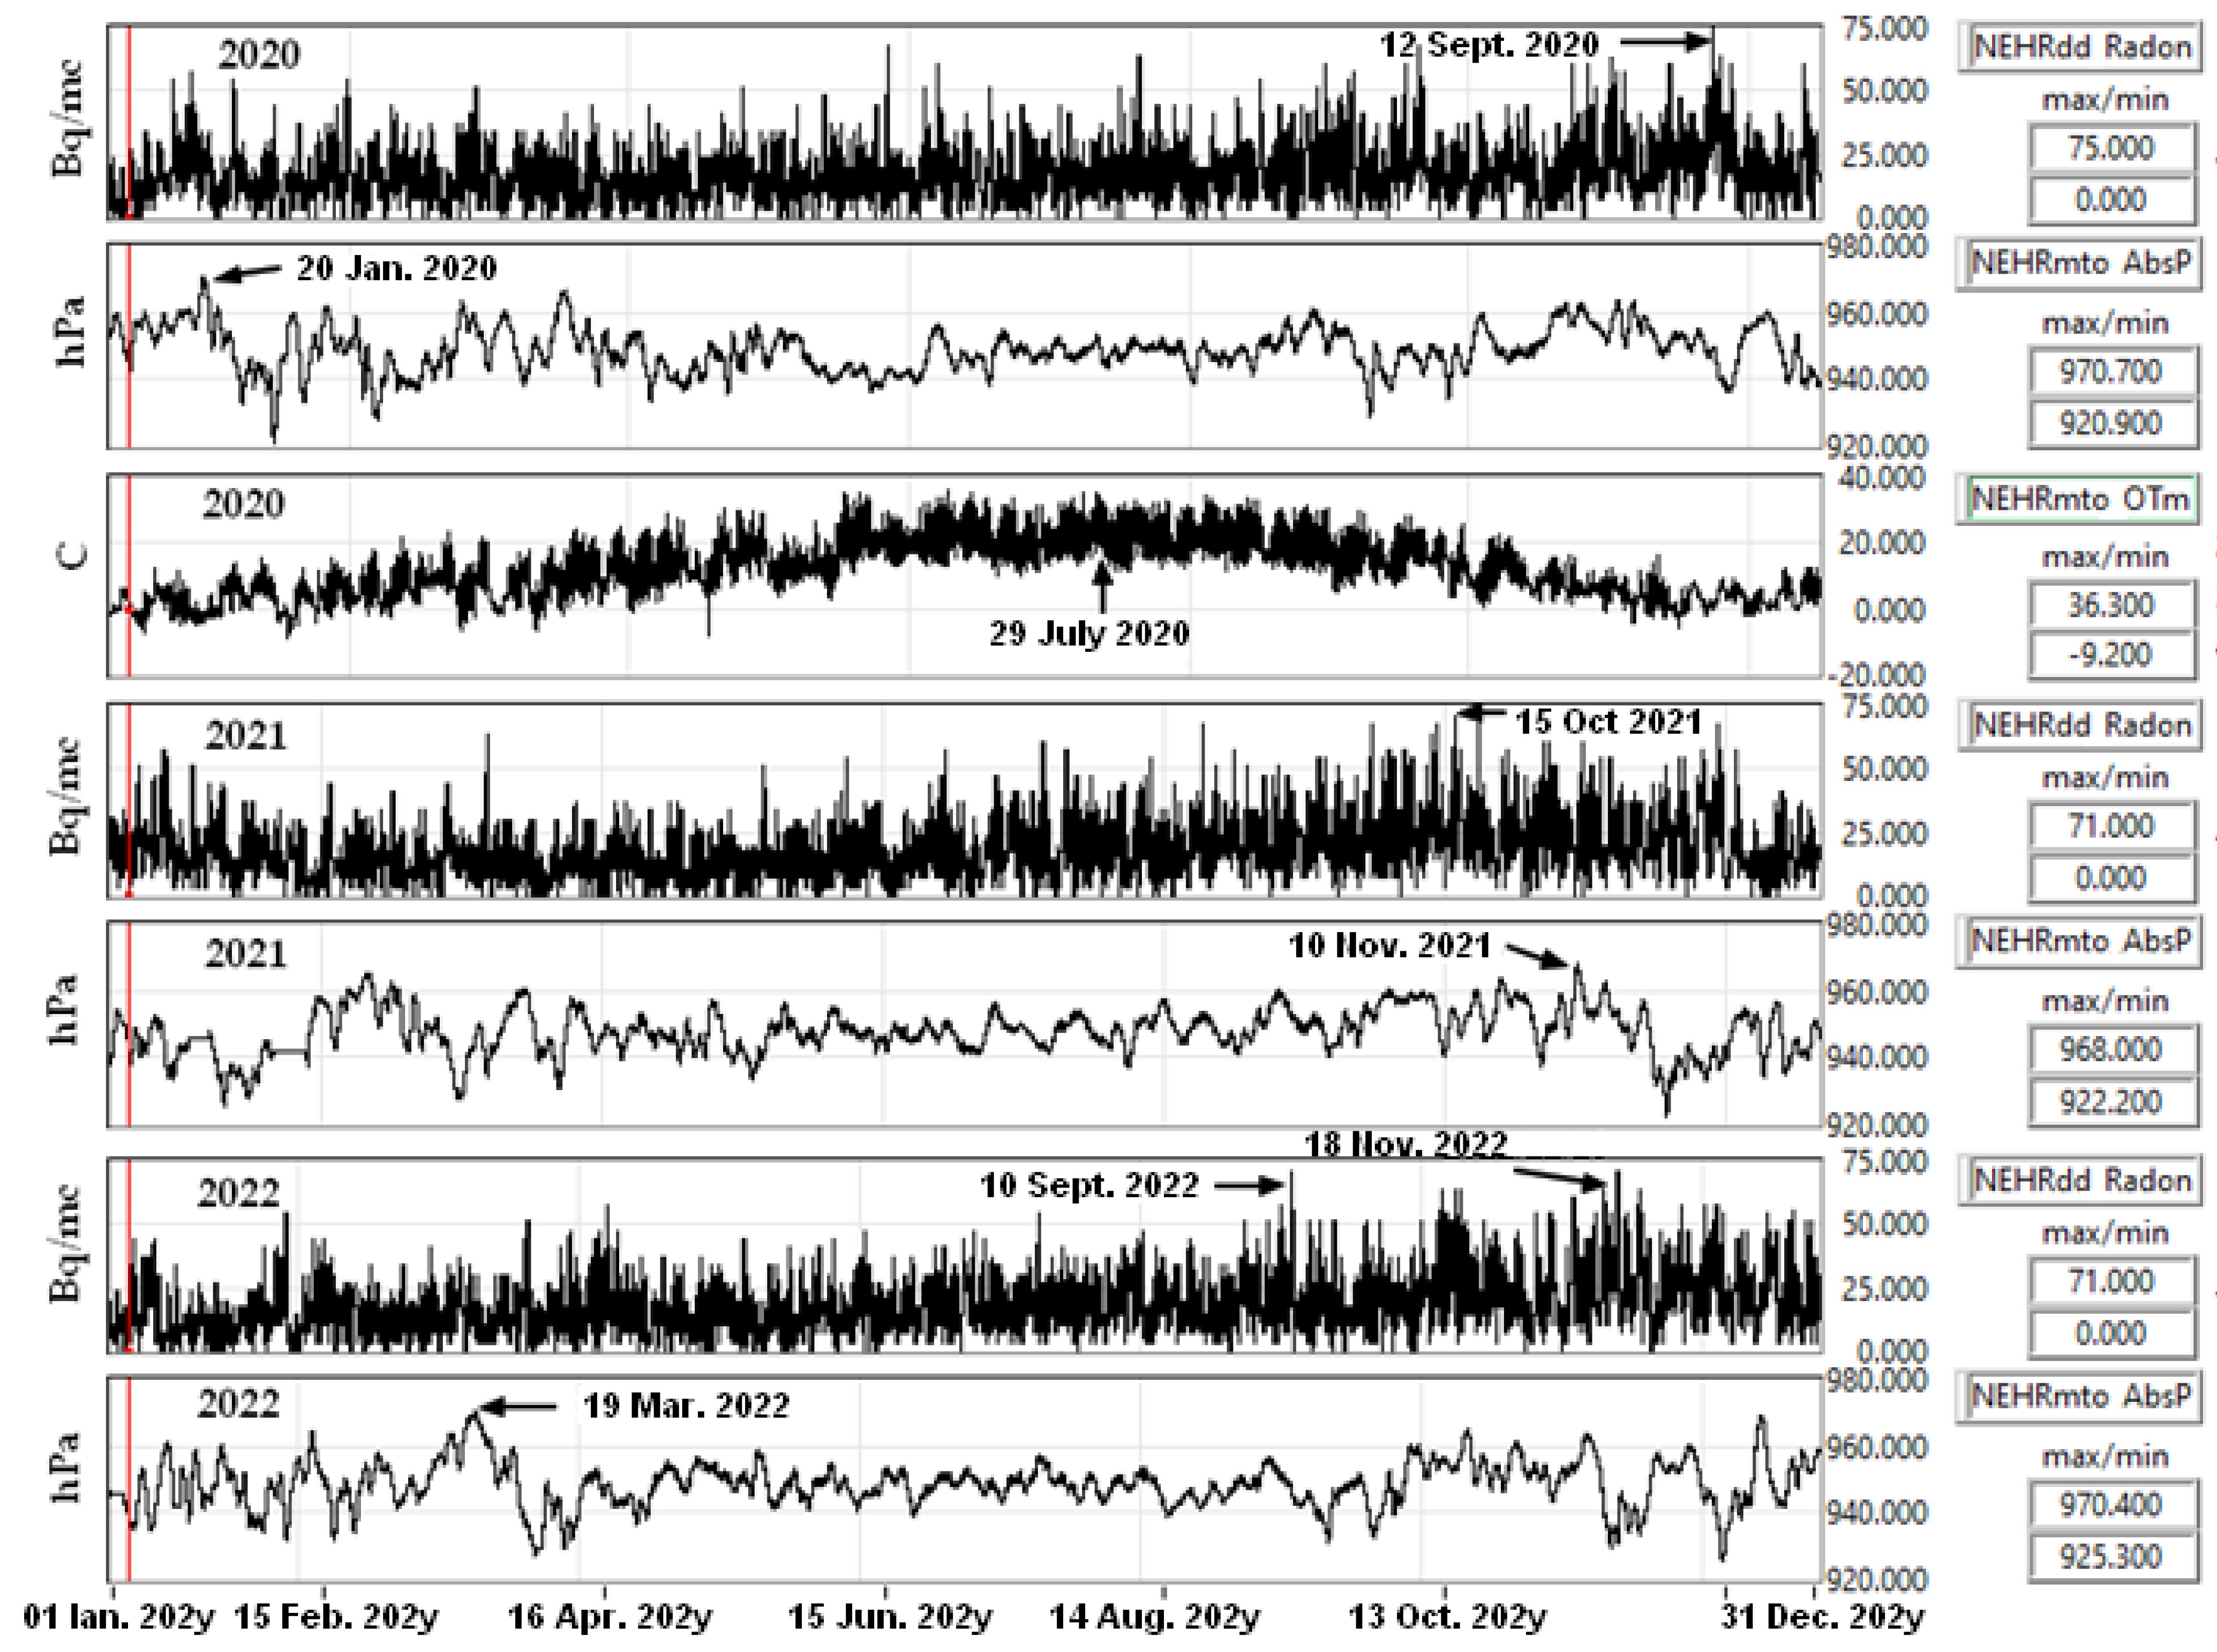
Figure 17.
Evolution of radon level, temperature, and seismicity in Vrancea; time windows of 7 days, 2016–2022.
Figure 17.
Evolution of radon level, temperature, and seismicity in Vrancea; time windows of 7 days, 2016–2022.
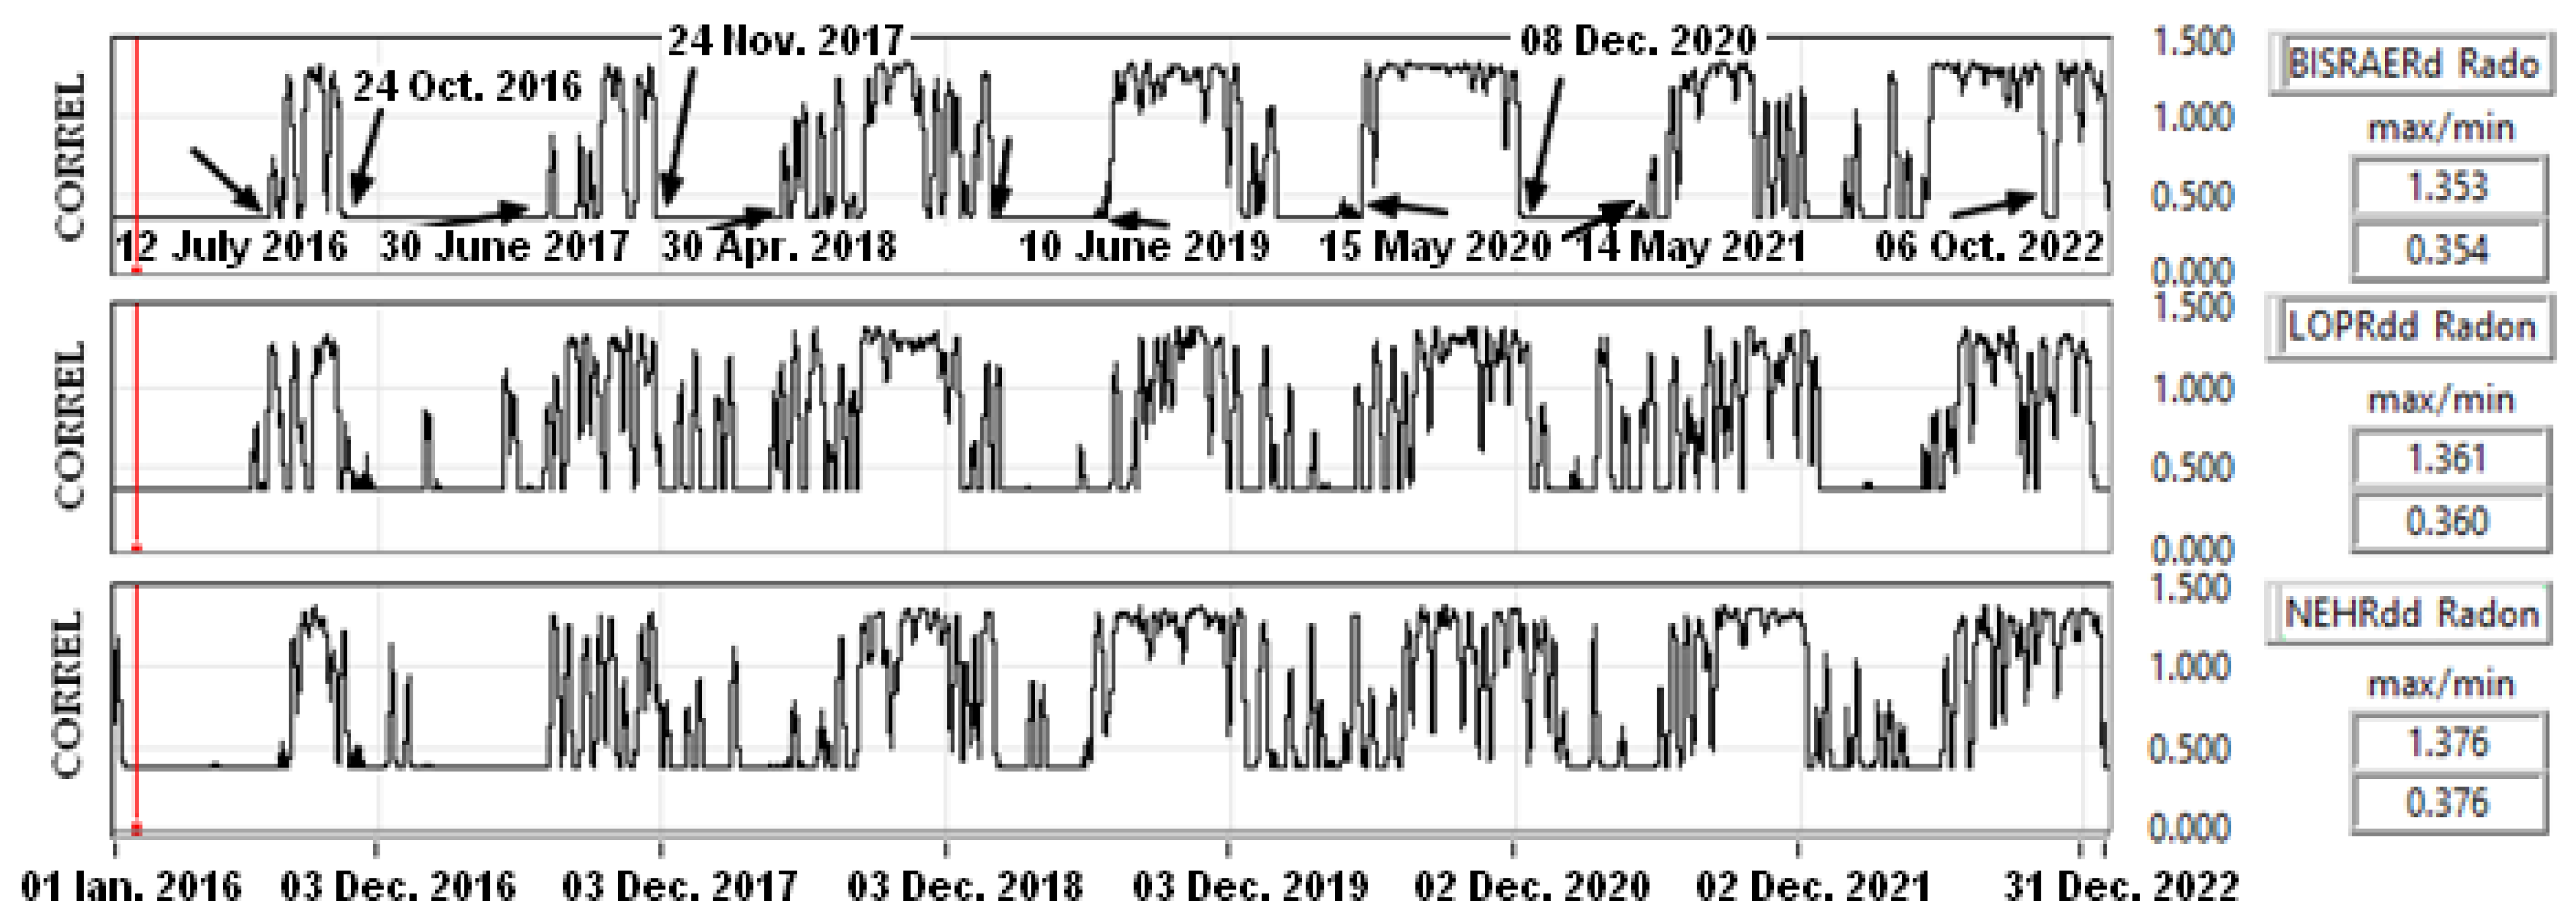
Figure 18.
CORREL between GR b (Gutenberg–Richter law) and radon BISRAERs, LOPRdd, and NEHERdd.
Figure 18.
CORREL between GR b (Gutenberg–Richter law) and radon BISRAERs, LOPRdd, and NEHERdd.
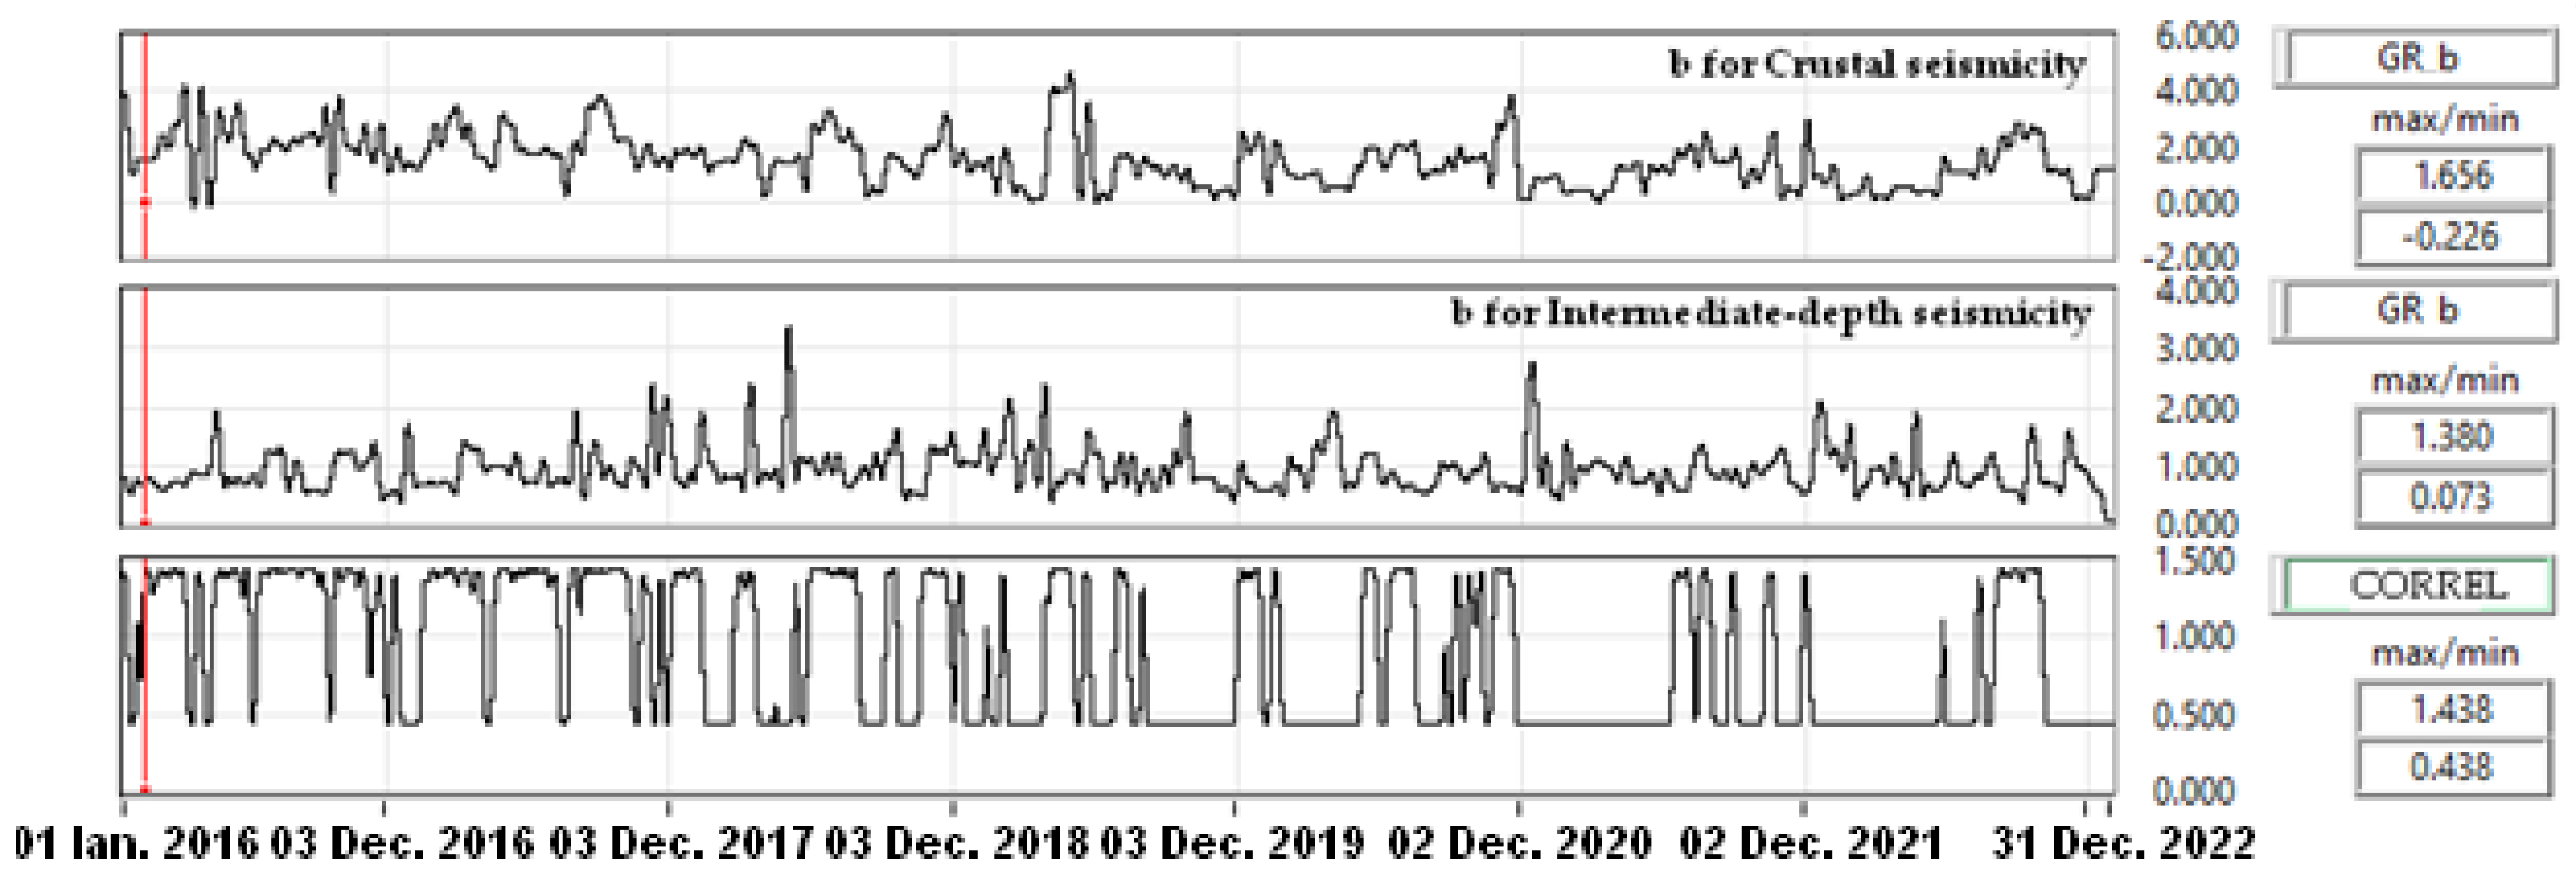
Figure 19.
Correlation between b from the Gutenberg–Richter law for Vrancea crustal and deep seismicity.
Figure 19.
Correlation between b from the Gutenberg–Richter law for Vrancea crustal and deep seismicity.
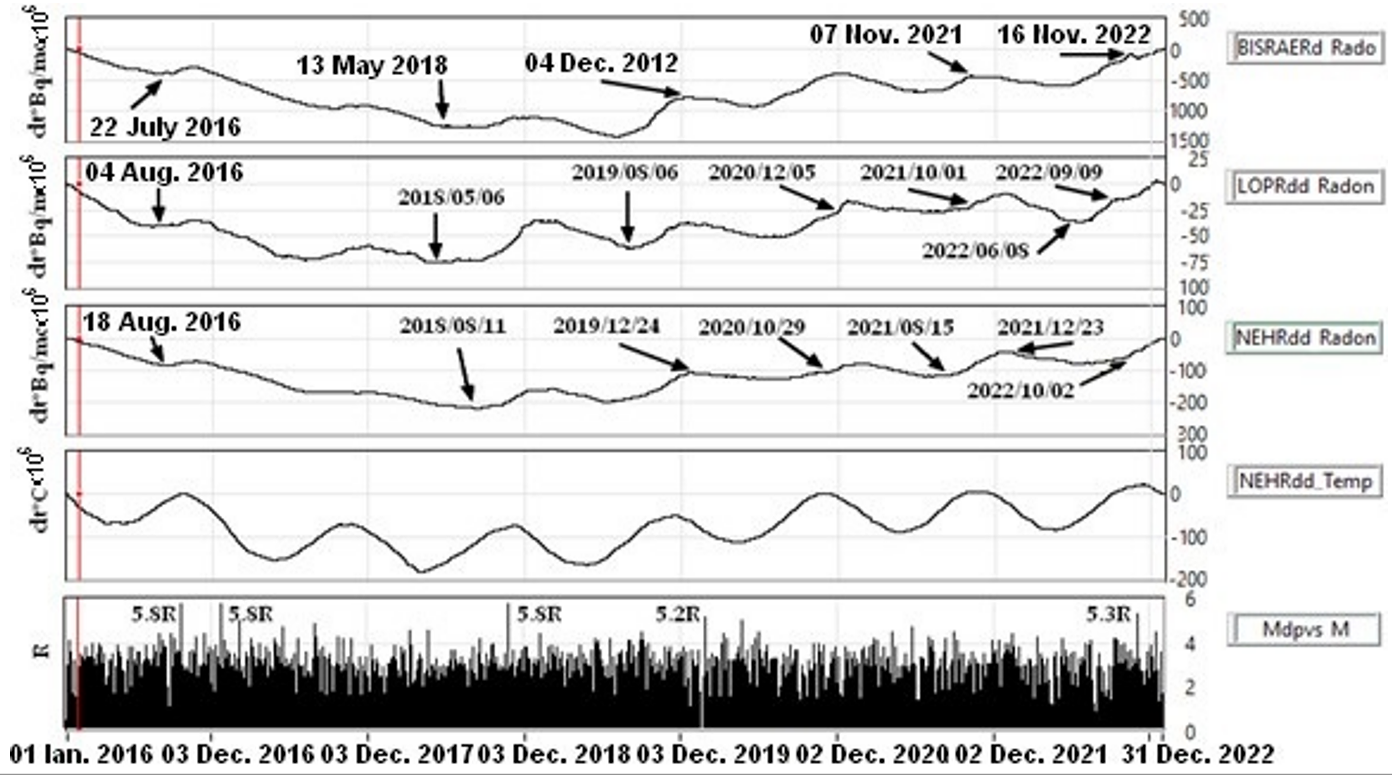
Figure 20.
Annual variations of radon integrated and Vrancea seismicity, 2016–2022.
Figure 20.
Annual variations of radon integrated and Vrancea seismicity, 2016–2022.
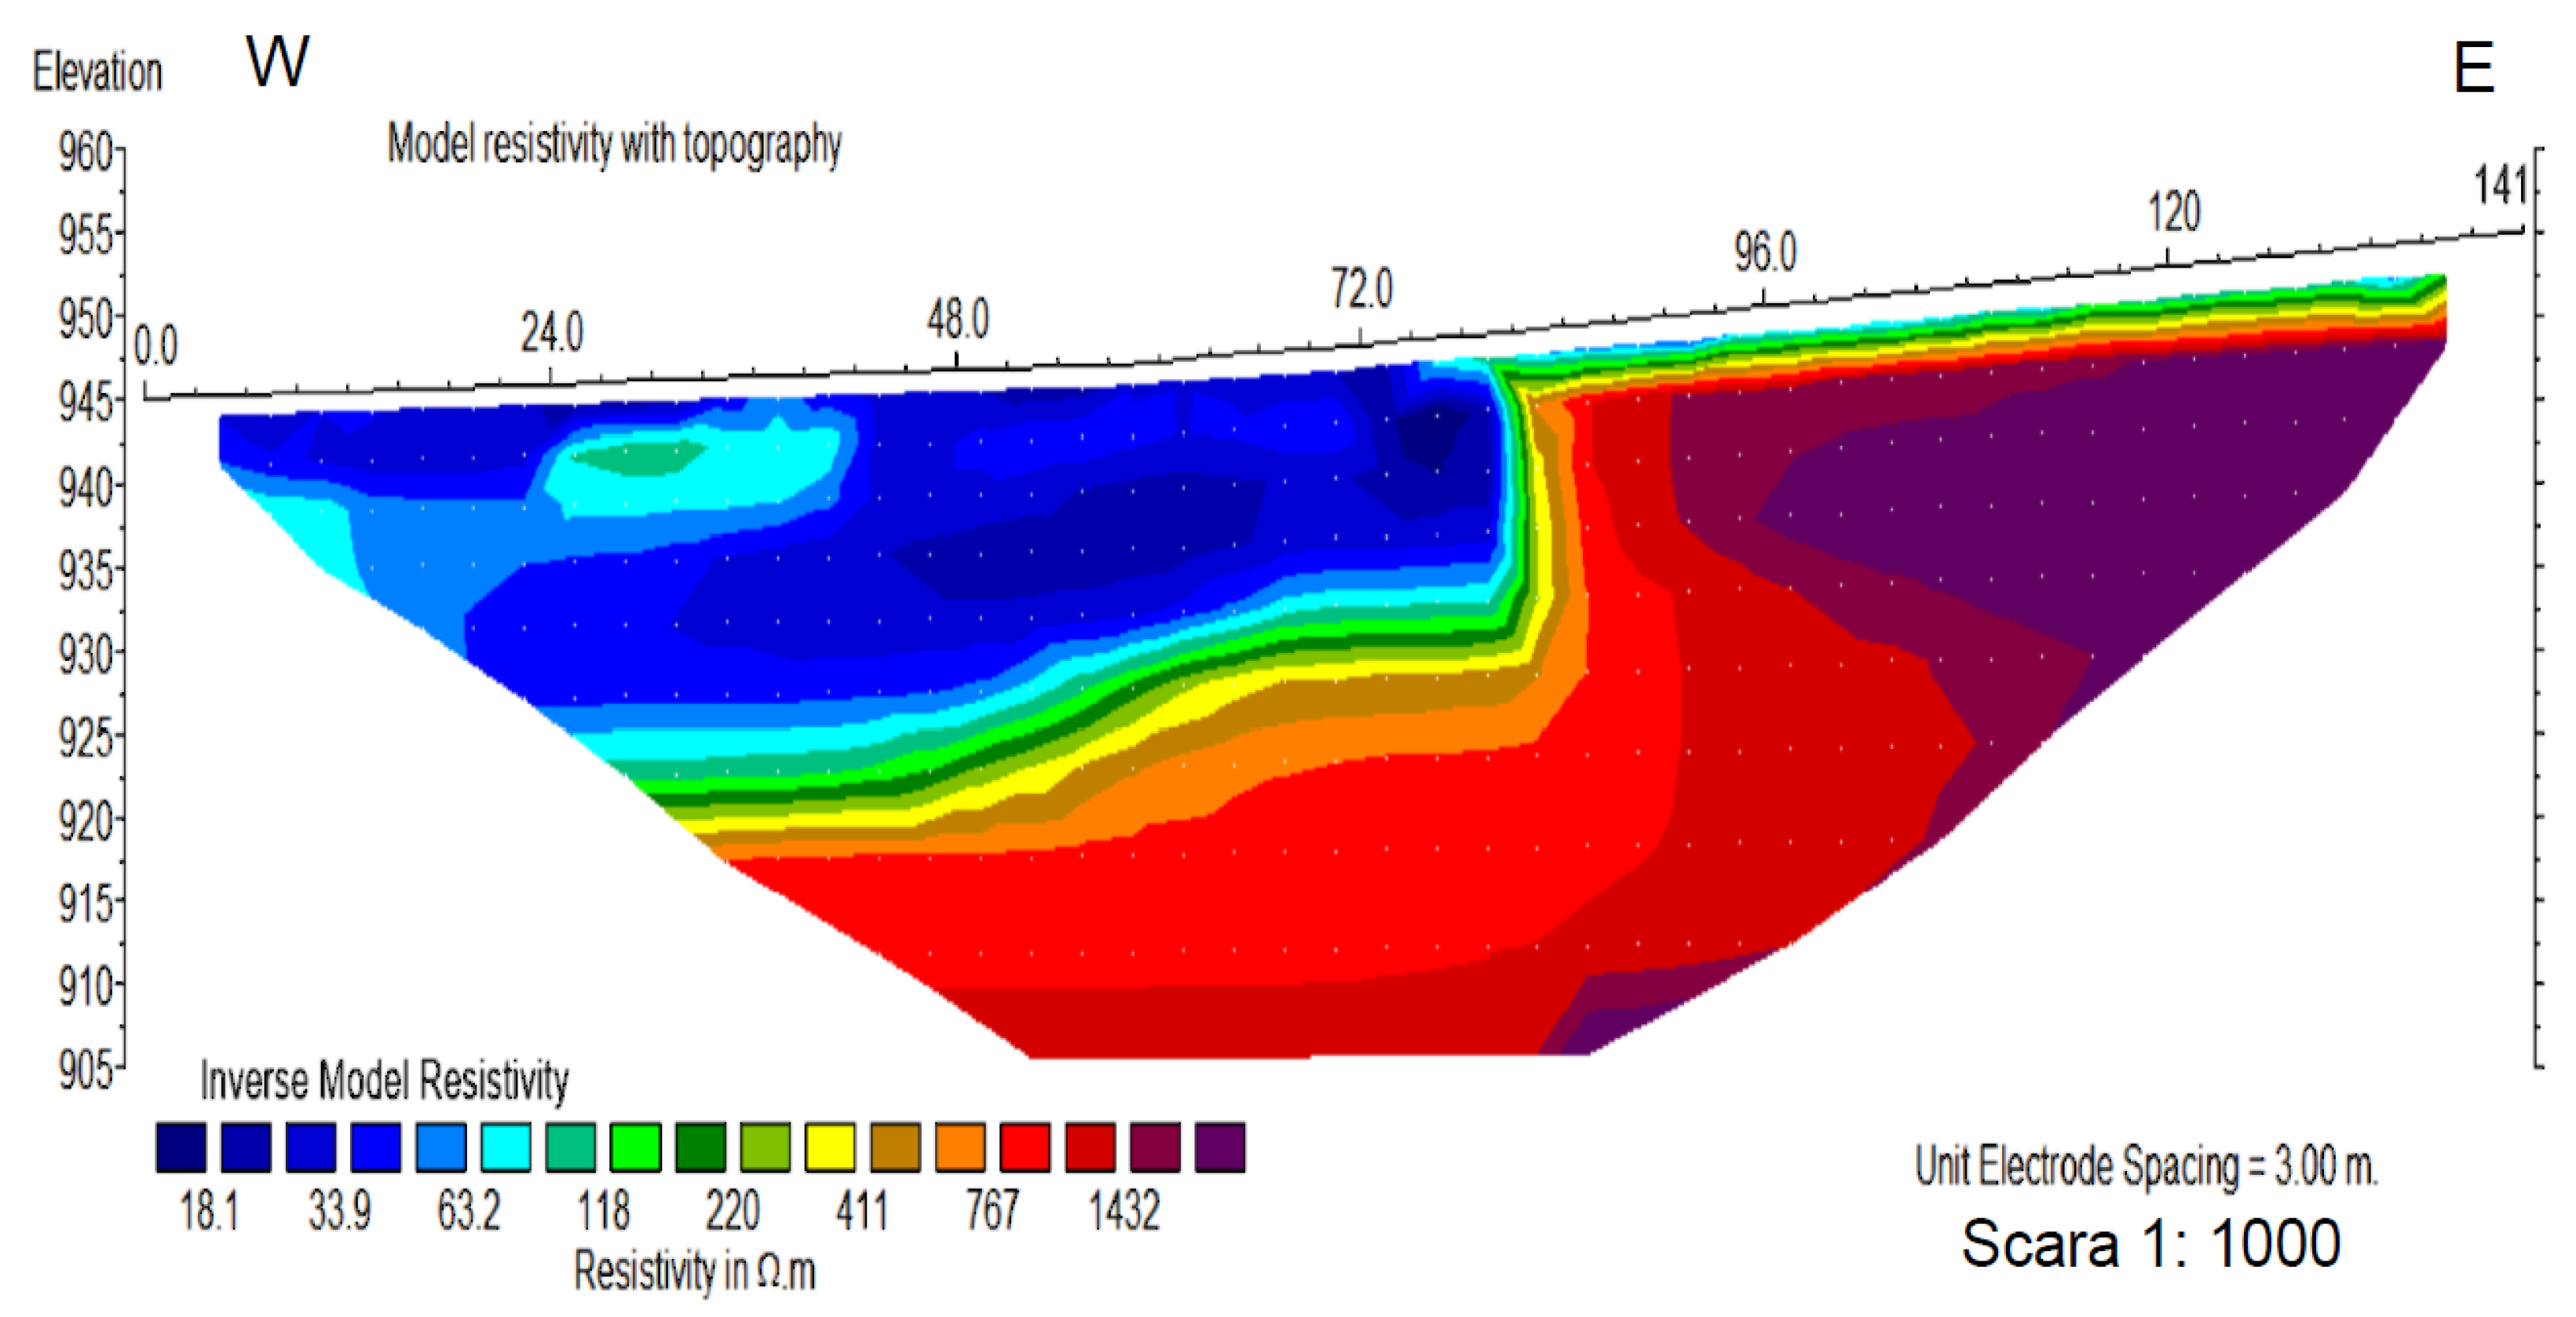
Figure 21.
Electrical resistivity tomography section in Bisoca station BISRAERd (project of the Romanian National Authority for Scientific Research, Programe STAR, project 84/2013, made by Getotec Consulting SRL).
Figure 21.
Electrical resistivity tomography section in Bisoca station BISRAERd (project of the Romanian National Authority for Scientific Research, Programe STAR, project 84/2013, made by Getotec Consulting SRL).
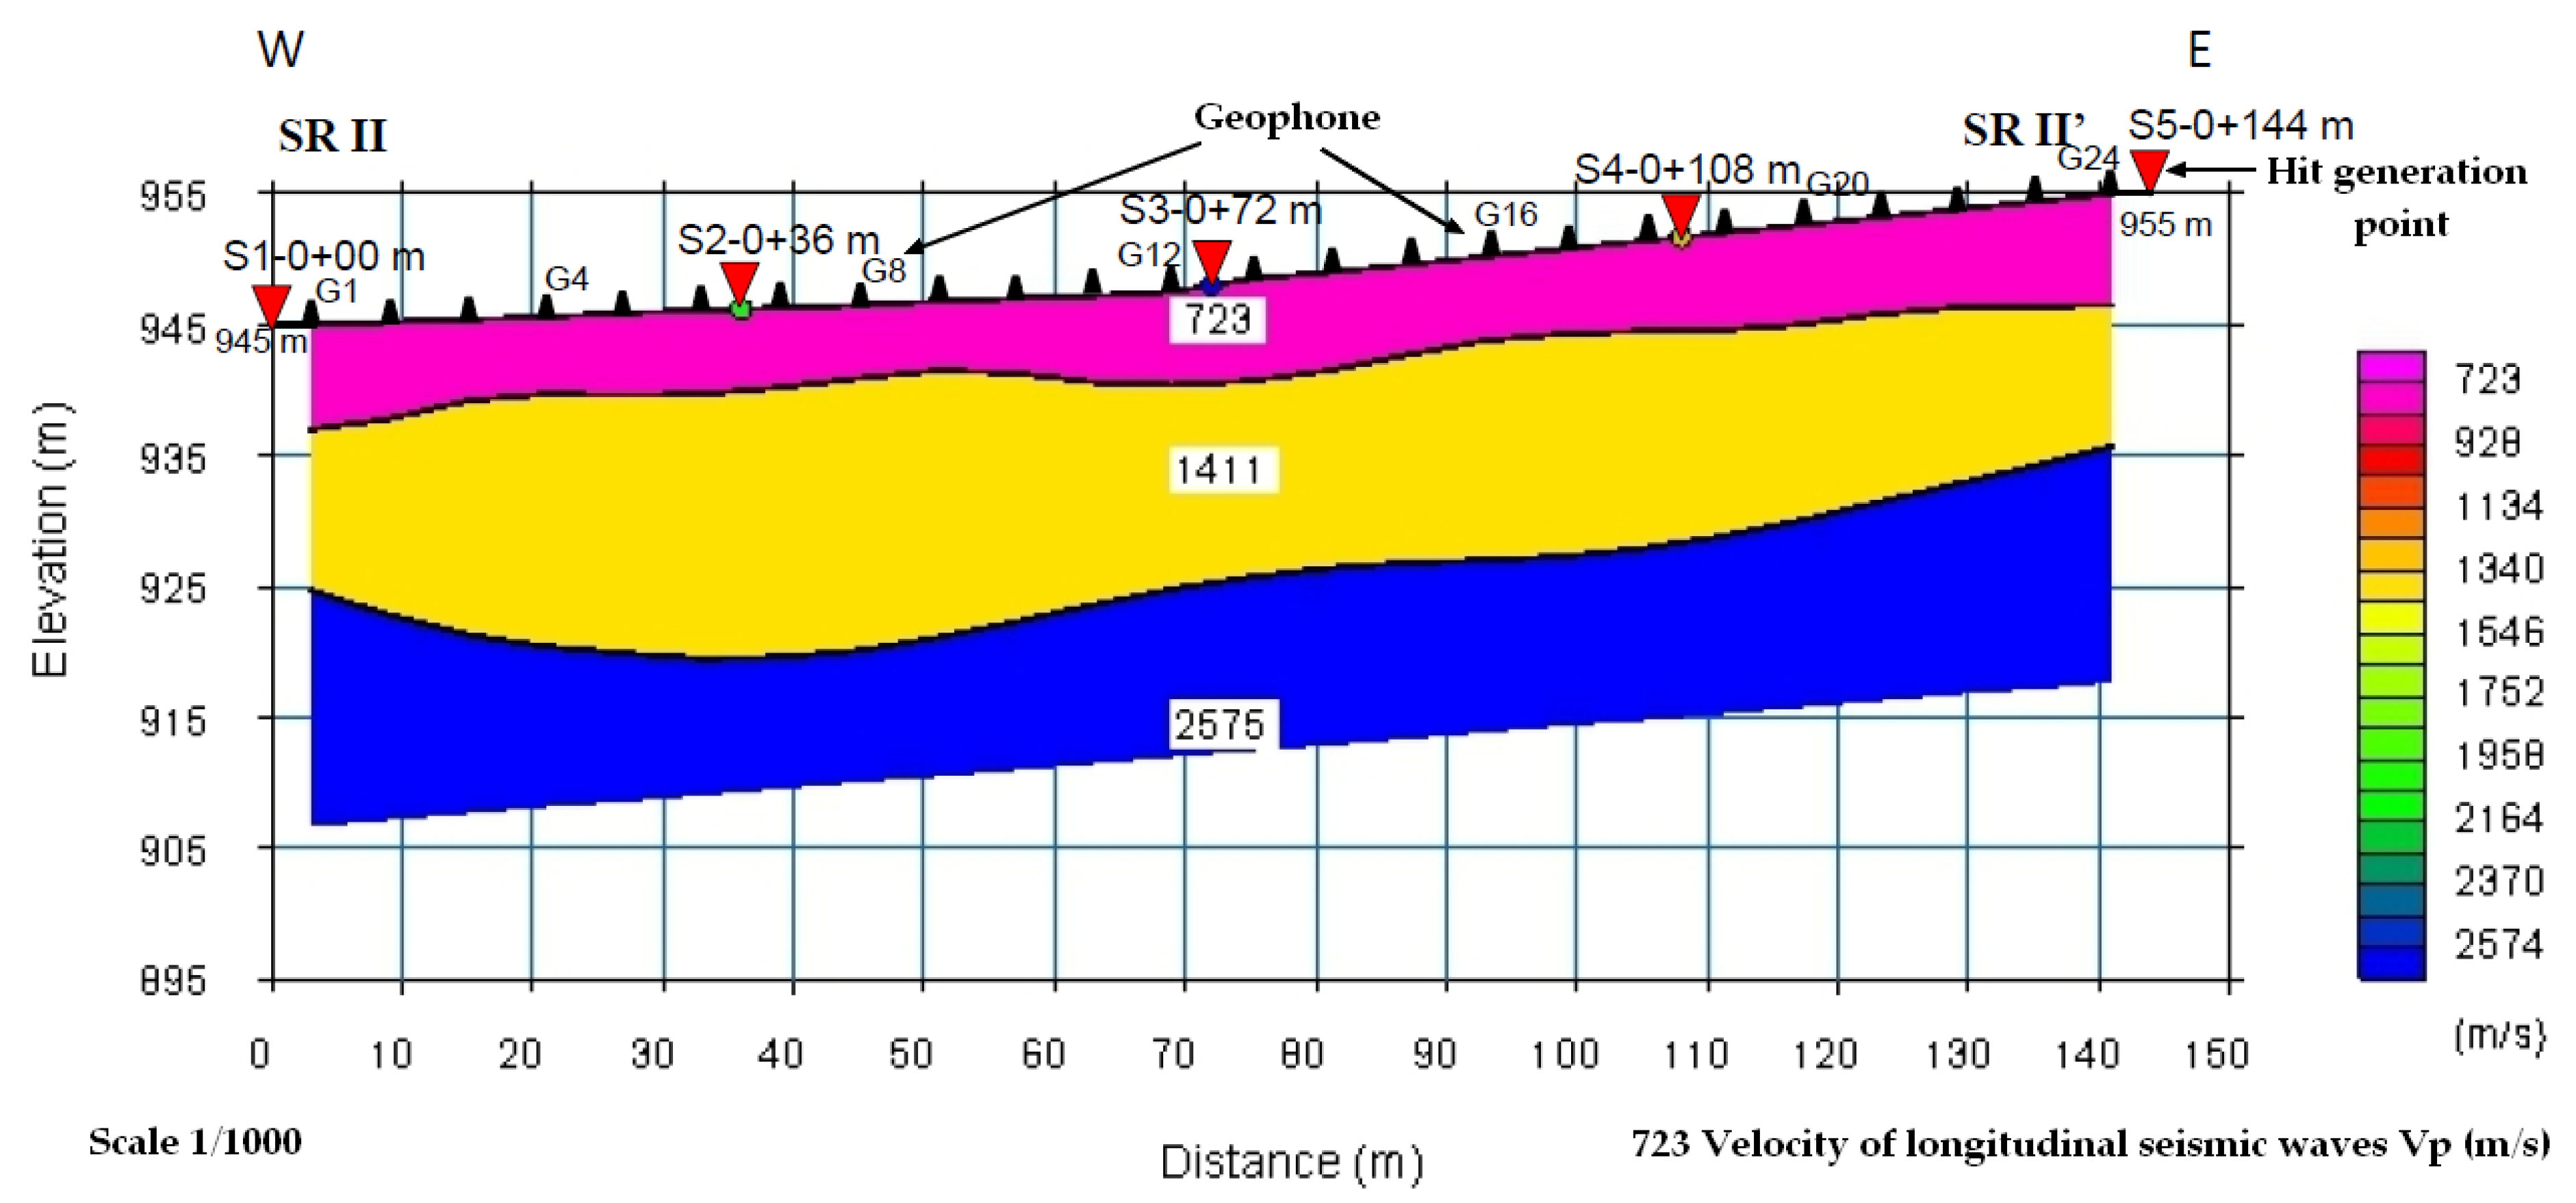
Figure 22.
SEISMIC REFRACTION SECTION S.R. II-II in Bisoca station BISRAERd (project of the Romanian National Authority for Scientific Research, Programe STAR, project 84/2013, made by Getotec Consulting SRL).
Figure 22.
SEISMIC REFRACTION SECTION S.R. II-II in Bisoca station BISRAERd (project of the Romanian National Authority for Scientific Research, Programe STAR, project 84/2013, made by Getotec Consulting SRL).
Table 1.
Radon network, locations, equipment, and period of operation.
Table 1.
Radon network, locations, equipment, and period of operation.
| Station Names | Location | Equipment | North | East | Description | Start Time | End Time |
|---|
| Agigea | Agigea | RADONSCOUT | 44.0838 | 28.6412 | Agigea, radon | 31 July 2014 | 5 September 2014 |
| Chiurus | Chiurus | RADONSCOUT | 45.8233 | 26.1646 | Chiurus, radon | 18 September 2014 | 18 September 2014 |
| INFPr | Magurele | RADONSCOUT | 44.3479 | 26.0281 | INFP radon | 12 September 2014 | 15 September 2014 |
| MLRdd | Muntele Rosu | RADONSCOUT | 45.4909 | 25.9450 | MLR, radon | 2 November 2015 | 22 March 2017 |
| ODBIdd | Odobesti | RADONSCOUT | 45.7633 | 27.0558 | Odbi, radon | 24 October 2014 | 4 August 2015 |
| PLRdd1 | Plostina 4 | RADONSCOUT | 45.8512 | 26.6498 | PLOR1, radon | 1 August 2017 | 28 November 2017 |
| PLRdd2 | Plostina 4 | RADONSCOUT | 45.8512 | 26.6498 | PLOR1, radon | 28 November 2017 | _ |
| BISRdd | Bisoca | RADONSCOUTp | 45.5481 | 26.7099 | Bisc, radon | 22 October 2014 | 20 May 2021 |
| BISRAERd | Bisoca | AERC | 45.5481 | 26.7099 | Biscoca, radon | 25 February 2021 | |
| DLMdd | Dalma | RADONSCOUTp | 45.3629 | 26.5965 | Dalma, radon | 4 July 2022 | _ |
| LOPRdd | Lopatari | RADONSCOUTp | 45.4738 | 26.5680 | Mocearu, radon | 6 August 2015 | _ |
| MNGdd | Mangalia | RADONSCOUTp | 43.8168 | 28.5876 | Mangalia, radon | 20 October 2021 | 14 April 2022 |
| NEHRdd | Nehoiu | RADONSCOUTp | 45.4272 | 26.2952 | NEHR, radon | 6 August 2015 | _ |
| PANCdd | Panciu | RADONSCOUTp | 45.8723 | 27.1477 | PANC, radon | 29 September 2021 | _ |
| RMGVdd | Râmnicu Vâlcea | RADONSCOUTp | 45.1075 | 24.3770 | Electrovalcea, radon | 22 August 2020 | _ |
| SAHRdd | Sahastru | RADONSCOUTp | 45.7266 | 26.6854 | SAHR, radon | 20 May 2021 | _ |
| SURLdd | Surlari | RADONSCOUTp | 44.6777 | 26.2526 | Surlari, radon | 10 November 2021 | _ |
| VRIdd | Vrancioaia | RADONSCOUTp | 45.8657 | 26.7277 | Vri, radon | 23 October 2014 | 21 July 2020 |
Table 2.
Equipment that is part of the multidisciplinary monitoring of seismic areas.
Table 2.
Equipment that is part of the multidisciplinary monitoring of seismic areas.
| Station Names | Location | Equipment | North | East | Per (s) | Description | Start Time | End Time |
|---|
| MLRttu | Muntele Rosu | DL100 | 45.4909 | 25.945 | 1 | Tunnel MLR temperature and humidity | 5 November 2019 | _ |
| LOPrCO2 | Lopatari | DL303 | 45.4738 | 26.568 | 1 | Lopatari Mocearu CO2/CO | 26 June 2019 | _ |
| VRIco2 | Vrancioaia | DL303 | 45.8657 | 26.7277 | 1 | Vrancioaia CO2/CO | 10 July 2019 | 21 July 2020 |
| DLMCO2 | Dalma | DL303 | 45.3629 | 26.5965 | 1 | Dalma CO2/CO | 4 July 2022 | _ |
| SurlCO2 | Surlari | DL303 | 44.6777 | 26.2526 | 1 | Surlari CO2/CO | 10 November 2021 | _ |
| CVSrCO2 | Covasna | DL303 | 45.7944 | 26.1239 | 1 | Covasna CO2/CO | 6 July 2022 | _ |
| RVCO2 | Râmnicu Vâlcea | DL303 | 45.1075 | 24.3770 | 1 | Râmnicu Vâlcea borehole CO2/CO | 18 August 2021 | 13 April 2022 |
| PL7co2 | Plostina 7 | DL303 | 45.8603 | 26.6405 | 1 | PLOR7 CO2/CO | 21 July 2020 | _ |
| MNGCO2 | Mangalia | DL303 | 43.8168 | 28.5876 | 1 | Mangalia CO2/CO | 2 0October 2021 | 9 March 2022 |
| BISRCO2 | Bisoca | DL303 | 45.5481 | 26.7099 | 1 | Bisoca CO2/CO | 9 July 2019 | _ |
| PL7S | Plostina 7 | PL7S | 45.8603 | 26.6405 | 1 | PLOR7 solar radiation, K2 | 14 November 2019 | _ |
| BURmto | Bucovina | VANTAGE_PRO2p | 47.644 | 25.2002 | 60 | Bucovina Meteo Vantage | 31 October 2018 | _ |
| EFORmt2 | Eforie Nord | VANTAGE_PRO2p | 44.075 | 28.6323 | 60 | Eforie Meteo Vantage Pro2 | 2 August 2018 | _ |
| INFPmt2 | Magurele | VANTAGE_PRO2p | 44.3479 | 26.0281 | 60 | INFP Magurele Meteo DAVIS Vantage Pro2 | 12 July 2018 | _ |
| MetMr2 | Marisel | VANTAGE_PRO2p | 46.676 | 23.1189 | 60 | Meteo Davis Marisel | 20 July 2018 | _ |
| MLRmt2 | Muntele Rosu | VANTAGE_PRO2p | 45.4909 | 25.945 | 60 | MLR Meteo DAVIS PRO2+ | 15 November 2019 | _ |
| VRImto | Vrancioaia | WS2355 | 45.8657 | 26.7277 | 60 | VRI Meteo, La Crosse 2.0 | 7 February 2014 | _ |
| BISRmto | Bisoca | WS2355 | 45.5481 | 26.7099 | 60 | Bisoca, Meteo La Crosse 2.0 | 25 July 2017 | _ |
| NEHRmto | Nehoiu | WS2355 | 45.4272 | 26.2952 | 60 | Nehoiu, Meteo La Crosse 20 | 28 May 2014 | _ |
| ODBmto | Odobesti | WS2355 | 45.7633 | 27.0558 | 60 | Odobesti, Meteo | 21 July 2014 | _ |
| PLORmto | Plostina 4 | WS2355 | 45.8512 | 26.6498 | 60 | PLOR4 Meteo | 1 December 2001 | _ |
Table 3.
Radon equipment used in Bisoca station (BISRAERd), produced by ALGADE (discontinued).
Table 3.
Radon equipment used in Bisoca station (BISRAERd), produced by ALGADE (discontinued).
| Equipment_AERC |
|---|
| ID | Field 1 | Field 2 | Field 3 | Field 4 |
|---|
| 1 | Radon | Temperature (°C) | Humidity (%) | Status |
| 2 | Bq/m3 | °C | % | _ |
| 3 | %d | %0.1f | %d | %d |
| 4 | radon, Radon, temperature in the equipment—Temperature (°C), relative humidity in the equipment—Humidity (%), Sigfox network connection status—Status. | | | |
Table 4.
Radon equipment produced by SARAD.
Table 4.
Radon equipment produced by SARAD.
| Equipment _RADONSCOUTp |
|---|
| ID | Field1 | Field 2 | Field 3 | Field 4 | Field 5 | Field 6 | Field 7 |
|---|
| 1 | Radon | Error | Temp | relHum | Pres | Tilt | ROI1 |
| 2 | Bq/m3 | % | °C | % | mbar | _ | cts |
| 3 | %d | %d | %0.1f | %d | %d | %d | %d |
| 4 | radon, Radon, error—Error, temperature in the equipment—Temp, relative humidity in the equipment—relHum, atmospheric pressure—Press, inclination—Tilt, region of interest 1—ROI1. | | | | | | |
Table 5.
Synthesized results of radon monitoring, the 2SD reference parameter, and its dependence on temperature.
Table 5.
Synthesized results of radon monitoring, the 2SD reference parameter, and its dependence on temperature.
| Station Names | Mean Bq/mc | 2SD | Max
Bq/mc | Radon—Max Time | Mean T (C) | Max/Min T (C) | Time Interval |
|---|
| BISRAERd | 70.1835 | 104.1120 | 500 | 28 September 2020 | 17.0133 | 29.0/−1.5 | 1 January 2020 | 31 December 2020 |
| BISRAERd | 55.4286 | 86.2253 | 498 | 21 September 2021 | 15.5043 | 29.0/+1.5 | 1 January 2021 | 31 December 2021 |
| BISRAERd | 74.3684 | 114.6245 | 432 | 4 August 2022 | 16.1838 | 29.0/−0.5 | 1 January 2022 | 31 December 2022 |
| DLMdd | 50.1785 | 82.1935 | 321 | 18 October 2022 | 15.1580 | 26.5/+1.0 | 4 July 2022 | 12 March 2023 |
| LOPRdd | 9.5060 | 14.3086 | 51 | 2 October 2020 | 16.9339 | 39.5/−3.0 | 1 January 2020 | 31 December 2020 |
| LOPRdd | 8.6471 | 12.3745 | 40 | 26 June 2021 | 16.2484 | 43.5/−1.0 | 1 January 2021 | 31 December 2021 |
| LOPRdd | 9.1671 | 15.1524 | 71 | 17 May 2022 | 14.7775 | 36.5/−1.0 | 1 January 2022 | 31 December 2022 |
| PLRdd2 | 54.0582 | 66.8106 | 607 | 18 June 2020 | 11.5113 | 26.5/−1.0 | 1 January 2020 | 31 December 2020 |
| PLRdd2 | 51.3739 | 84.3485 | 1068 | 12 December 2021 | 10.4853 | 26.5/−2.5 | 21/01/01 | 31 December 2021 |
| PLRdd2 | 57.0862 | 135.1785 | 1077 | 4 September 2022, 5 September 2022 | 11.2713 | 26.5/−1.0 | 1 January 2022 | 31 December 2022 |
| MLRdd | 518.3502 | 1090.3606 | 3230 | 20 July 2016 | 7.0435 | 8.5/+5.5 | 1 January 2016 | 31 December 2016 |
| NEHRdd | 17.1800 | 22.7589 | 75 | 8 December 2020 | 16.7921 | 37.5/−0.5 | 1 January 2020 | 31 December 2020 |
| NEHRdd | 17.9657 | 24.0877 | 71 | 15 October 2021 | 15.5227 | 36.5/−0.5 | 1 January 2021 | 31 December 2021 |
| NEHRdd | 18.0120 | 23.9987 | 71 | 9 September 2022 | 16.1370 | 38.5/−4.5 | 1 January 2022 | 31 December 2022 |
| PANCdd | 73.5889 | 216.1618 | 681 | 10 December2022 | 13.2224 | 35.5/−7.0 | 1 January 2022 | 31 December 2022 |
| RMGVdd | 25.1879 | 26.0728 | 122 | 18 June 2021 | 12.3352 | 35.0/−6.5 | 20 October 2021 | 14 April 2022 |
| RMGVdd | 28.0030 | 25.2148 | 90 | 16 August 2022, 17 August 2022 | 12.8718 | 35.0/−7.0 | 1 January 2022 | 31 December 2022 |
| SAHRdd | 87.4349 | 137.4242 | 413 | 29 July 2022, 18 August 2022 | 20.4269 | 41.0/+2.5 | 1 January 2022 | 31 December 2022 |
| SURLdd | 316.9367 | 320.4041 | 1095 | 7 December 2022 | 13.8398 | 28.0/−1.5 | 1 January 2022 | 31 December 2022 |
| VRIdd | 148.8226 | 157.1080 | 413 | 25 January 2018 | 14.7503 | 26.0/−3.0 | 1 January 2018 | 31 December 2018 |
| VRIdd | 165.6702 | 219.5496 | 622 | 5 December 2019 | 15.7668 | 29.5/+0.5 | 1 January 2019 | 31 December 2019 |
| VRIdd | 202.7971 | 240.1850 | 642 | 7 January 2020 | 15.3096 | 28.5/+3.0 | 1 January 2020 | 21 July 2020 |
| agigea | 55.3043 | 51.5058 | 115 | 1 September 2014 | 21.2522 | 22.5/21.0 | 31 August 2014 | 5 September 2014 |
| MNGdd | 313.7032 | 451.5302 | 1163 | 2 December 2021 | 10.1699 | 25.0/−3.0 | 20 October 2021 | 14 April 2022 |
Table 6.
Overlap of earthquakes in Turkey and Romania (
http://www.infp.ro/, accessed on 21 May 2023).
Table 6.
Overlap of earthquakes in Turkey and Romania (
http://www.infp.ro/, accessed on 21 May 2023).
| Data (UTC) | Mag. | Reg. | h (km) |
|---|
| 6 February 2023, 10:51:41 | 5.6 mL | CENTRAL TURKEY | 10 km |
| 6 February 2023, 10:24:53 | 7.5 mL | CENTRAL TURKEY | 10 km |
| 6 February 2023, 06:55:14 | 5.0 mL | CENTRAL TURKEY | 10 km |
| 6 February 2023, 03:26:19 | 2.0 mL | VRANCEA SEISMIC ZONE, BUZAU | 21 km |
| 6 February 2023, 03:01:58 | 2.7 mL | VRANCEA SEISMIC ZONE, BUZAU | 17 km |
| 6 February 2023, 02:40:31 | 2.1 mL | VRANCEA SEISMIC ZONE, BUZAU | 13 km |
| 6 February 2023, 02:13:10 | 2.9 mL | VRANCEA SEISMIC ZONE, BUZAU | 17 km |
| 6 February 2023, 02:09:54 | 2.6 mL | VRANCEA SEISMIC ZONE, BUZAU | 17 km |
| 6 February 2023, 01:26:20 | 4.6 mL | VRANCEA SEISMIC ZONE, BUZAU | 22 km |
| 6 February 2023, 01:17:36 | 7.8 mL | CENTRAL TURKEY | 10 km |
Table 7.
Seismic sequence in the Vrancea area, maximum M 4.2 R, swarm of earthquakes in Oltenia, Gorj.
Table 7.
Seismic sequence in the Vrancea area, maximum M 4.2 R, swarm of earthquakes in Oltenia, Gorj.
| Data (UTC) | Mag. | Reg. | h (km) |
|---|
| 12 March 2023, 19:12:12 | 2.5 mL | OLTENIA, GORJ | 13 km |
| 12 March 2023, 17:44:22 | 4.2 mL | SEISMIC AREA VRANCEA, BUZAU | 131 km |
| 12 March 2023, 12:15:09 | 3.6 mL | OLTENIA, GORJL | 16 km |
| 12 March 2023, 11:49:23 | 3.4 mL | SEISMIC AREA VRANCEA, BUZAU | 125 km |
| 11 March 2023, 20:12:55 | 2.2 mL | OLTENIA, GORJ | 15 km |
| 11 March 2023, 17:51:56 | 2.6 mL | OLTENIA, GORJ | 14 km |
| 11 March 2023, 15:53:22 | 3.3 mL | SEISMIC AREA VRANCEA, BUZAU | 82 km |
| 11 March 2023, 14:17:06 | 3.5 mL | OLTENIA, GORJ | 17 km |
| 11 March 2023, 13:28:57 | 2.5 mL | OLTENIA, GORJ | 16 km |
| 11 March 2023, 13:25:46 | 2.4 mL | OLTENIA, GORJ | 15 km |
| 11 March 2023, 12:09:20 | 4.2 mL | SEISMIC AREA VRANCEA, BUZAU | 118 km |
Table 8.
Cross-correlation coefficients.
Table 8.
Cross-correlation coefficients.
| Radon/2022 | Station Code |
|---|
| Mean Cross-Correlation | SURLdd | LOPRdd | NEHRdd | PANCdd | RMGVdd | SAHRdd | BISRAERd |
|---|
| CO2 | 0.3354 | 0.2758 | −0.1701 | - | - | - | 0.1789 |
| Humidity | 0.4430 | 0.3696 | 0.2531 | 0.5708 | 0.1814 | −0.2932 | 0.2504 |
| Temperature | −0.4181 | 0.3900 | 0.1370 | −0.2294 | 0.1467 | 0.7436 | 0.4714 |
| Atmospheric pressure | 0.0797 | 0.2313 | −0.0152 | 0.0088 | −0.0343 | −0.1636 | −0.0946 |
Table 9.
Cross-correlation for time windows of 1 h.
Table 9.
Cross-correlation for time windows of 1 h.
Radon/2022
1 h | Station Code |
|---|
| Mean Cross-Correlation | SURLdd | LOPRdd | NEHRdd | PANCdd | RMGVdd | SAHRdd | BISRAERd |
|---|
| CO2 | 0.5257 | 0.6222 | 0.3742 | - | - | - | 0.5791 |
| Humidity | 0.6385 | 0.6959 | 0.6321 | 0.7216 | 0.5371 | 0.3966 | 0.6902 |
| Temperature | 0.3048 | 0.6529 | 0.5702 | 0.3742 | 0.5663 | 0.7545 | 0.6999 |
| Atmospheric pressure | 0.5753 | 0.5892 | 0.4674 | 0.5691 | 0.4569 | 0.3818 | 0.4807 |
Table 10.
Vrancea seismicity for earthquakes greater than 4.5 R, 2016–2022.
Table 10.
Vrancea seismicity for earthquakes greater than 4.5 R, 2016–2022.
| N | Time | Ml > 4.5 | Depth | Longitude | Latitude | Mw | P Zone |
|---|
| Richter | km | Degrees | Degrees | | km |
|---|
| 1 | 23 September 2016 23:11:20 | 5.8 | 92.0 | 26.6181 | 45.7148 | 5.52 | 236.8 |
| 2 | 27 December 2016 23:20:56 | 5.8 | 96.9 | 26.5987 | 45.7139 | 5.52 | 236.8 |
| 3 | 8 February 2017 15:08:21 | 5.0 | 124 | 26.2886 | 45.4791 | 4.6 | 95.3 |
| 4 | 19 May 2017 20:02:45 | 4.7 | 120.6 | 26.7581 | 45.7249 | 4.32 | 72.3 |
| 5 | 1 August 2017 10:27:52 | 4.6 | 96.6 | 26.4681 | 45.5146 | 4.24 | 66.3 |
| 6 | 2 August 2017 02:32:13 | 4.9 | 132.5 | 26.4014 | 45.5267 | 4.51 | 86.7 |
| 7 | 14 March 2018 10:24:49 | 4.6 | 139.1 | 26.5850 | 45.6759 | 4.24 | 66.3 |
| 8 | 25 April 2018 17:15:49 | 4.6 | 147.3 | 26.4216 | 45.6002 | 4.24 | 66.3 |
| 9 | 28 October 2018 00:38:11 | 5.8 | 151.3 | 26.3986 | 45.6049 | 5.52 | 236.8 |
| 10 | 3 September 2019 11:52:53 | 4.5 | 116.7 | 26.2896 | 45.4712 | 4.15 | 61.0 |
| 11 | 31 January 2020 01:26:48 | 5.2 | 120.6 | 26.7033 | 45.7106 | 4.80 | 116.4 |
| 12 | 24 April 2020 22:04:19 | 5.0 | 21.6 | 27.4651 | 45.8951 | 3.79 | 42.8 |
| 13 | 2 June 2020 11:12:58 | 4.5 | 101.2 | 26.5548 | 45.6239 | 4.15 | 61.0 |
| 14 | 9 April 2021 18:36:47 | 4.5 | 77.1 | 26.6292 | 45.7916 | 4.15 | 61.0 |
| 15 | 25 May 2021 21:30:37 | 4.7 | 130.9 | 26.5226 | 45.5321 | 4.32 | 72.3 |
| 16 | 1 September 2021 10:32:12 | 4.5 | 145.0 | 26.4474 | 45.6413 | 4.15 | 61.0 |
| 17 | 3 November 2022 04:50:26 | 5.3 | 148.8 | 26.5166 | 45.4949 | 4.91 | 129.4 |
| 18 | 17 December 2022 05:42:59 | 4.5 | 140.0 | 26.4668 | 45.6359 | 4.15 | 61.0 |
Table 11.
Correlation factor between ‘b’ parameter and radon in BISRAERd, LOPRdd, and NEHERdd, 2016–2022; time windows of 7 days.
Table 11.
Correlation factor between ‘b’ parameter and radon in BISRAERd, LOPRdd, and NEHERdd, 2016–2022; time windows of 7 days.
| Station, 2016–2022 | Mean | Standard Deviation | Mean | Standard Deviation SD |
|---|
| H > 20 km | H < 20 km |
|---|
| BISRAERd | 0.3541 | 30.9621 | 0.3562 | 30.9617 |
| LOPRdd | 0.3707 | 2.7410 | 0.3703 | 2.7410 |
| NEHRdd | 0.3766 | 5.1496 | 0.3751 | 5.1495 |


 ,
, 


