1. Introduction
The Vrancea zone is located at the bending of the South-Eastern Carpathians and represents one of the most active seismic zones in Europe. The seismic activity in this area is generated both in the crust with moderate earthquakes (Mw < 6) and in the mantle at intermediate depth with strong earthquakes (Mw > 7). The zone is characterized by a high occurrence of intermediate-depth earthquakes, which are in a confined, high-velocity lithospheric volume in the depth range of 60–200 km. The major shocks (Mw > 6.5) tend to occur in two active segments: the upper one located around 90–100 km in depth (major events of March 1977 and May 1990) and the lower one with a depth of around 130–150 km (major events of November 1940 and August 1986) [
1].
There have been numerous investigations of geomagnetic variations as possible earthquake precursors [
2,
3,
4,
5]. Starting from the 1990s, the first seismic-magnetic anomalies in Romania were brought to attention by several researchers [
6,
7,
8,
9]. The recorded magnetic variations had periods of the order of seconds to the order of tens of days. The anthropogenic activities, weather phenomena, and magnetospheric noise produced frequent low-frequency magnetic variations [0.01–0.2 Hz]. For this reason, the correlation of these variations with seismic activity is strongly debated and questionable. Additionally, the geomagnetic variations that took place over long periods are questionable. For example, the geomagnetic anomaly that occurred over a period of three months before the two earthquakes that affected the Molise area of Italy in 2002, observed by [
5], was caused by a thermal variation that affected the instrument [
10].
In this research, we considered the geomagnetic data recorded from September 2002 to May 2008 at two stations, one in the Vrancea epicentral area (Muntele Rosu, MLR), and the other outside this area (Surlari, SUA). Each identified geomagnetic anomaly was plotted alongside daily seismic energy release, seismicity, and Kp indices. To establish the relationship between the magnitude of the geomagnetic anomaly measured at the Muntele Rosu seismic observatory and seismic activity, the standard deviation recorded on the By component of the magnetic field was calculated for each anomaly and compared to the total seismic energy released.
2. Geological and Seismotectonic Characterization of the Area
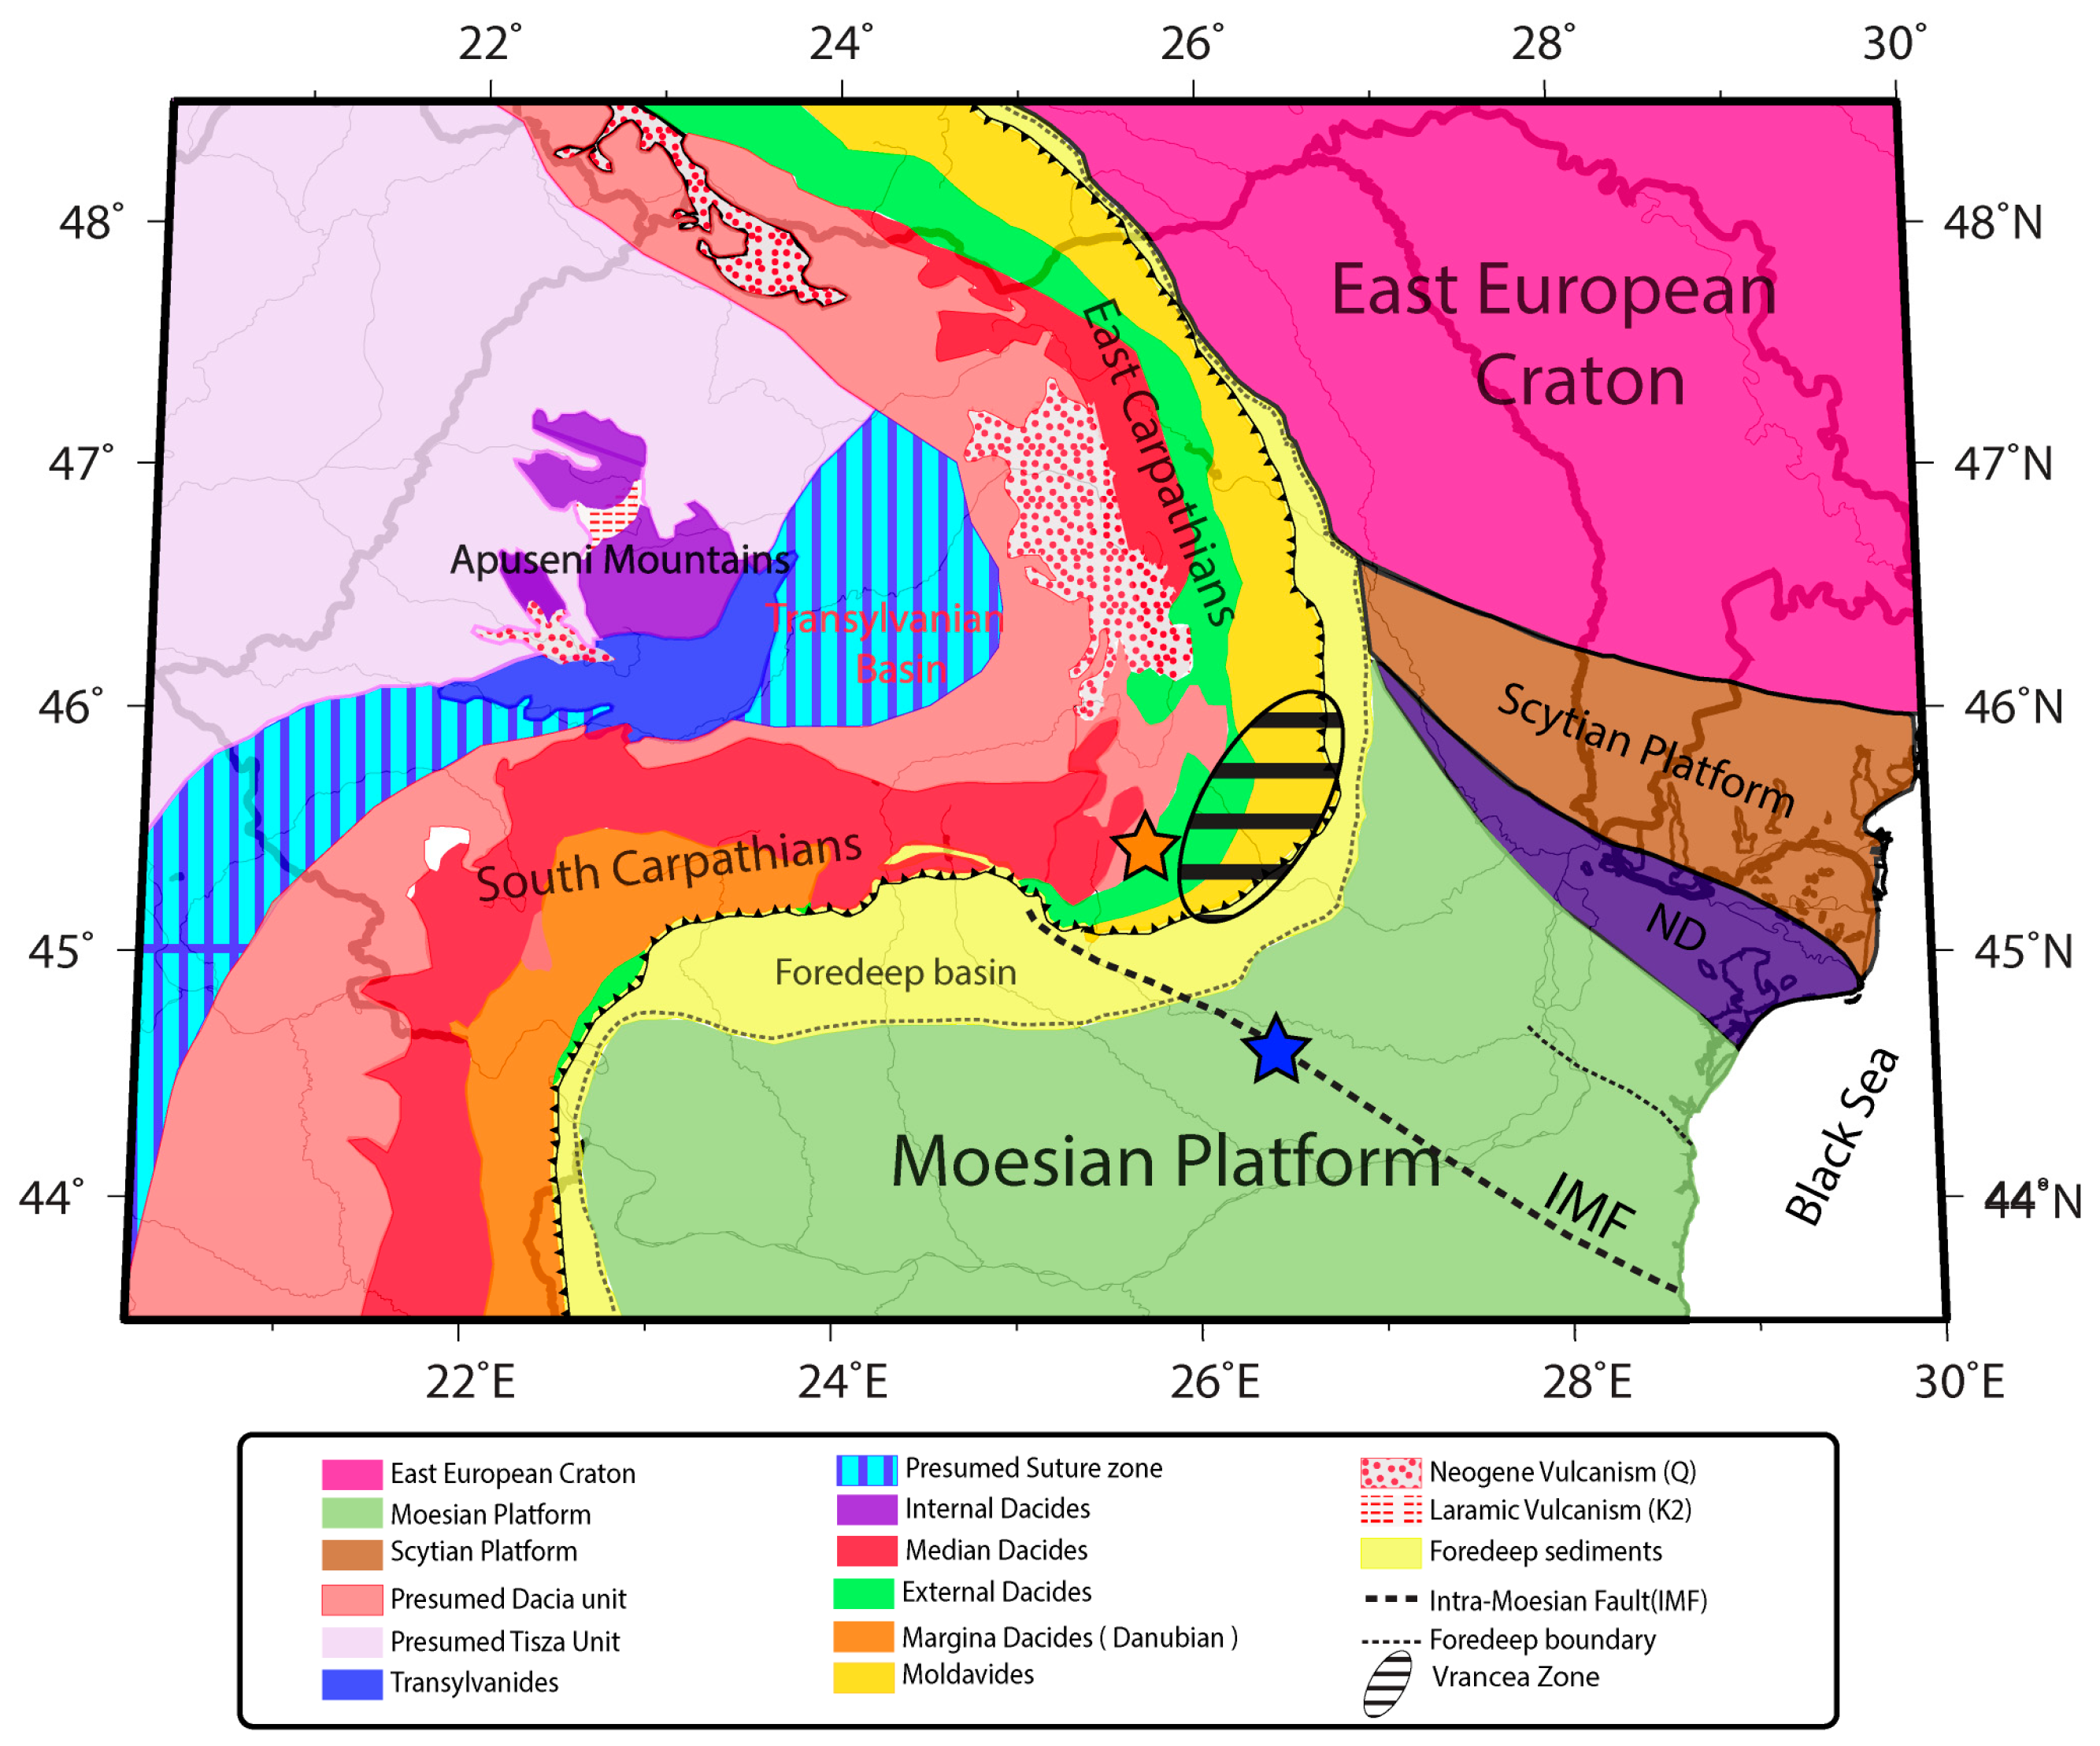
The peculiarity of the Vrancea intermediate-depth seismogenic region(
Figure 1) is closely linked to a particular tectonic history. The geodynamic evolution of the area is dictated by a mosaic of tectonic units with contrasting rheology. The evolution of the Vrancea seismic zone is related to the evolution of the Carpathian orogen. Carpathian orogen was formed during the many tectogeneses that affected the continental and oceanic units in the Triassic–Tertiary period. Continental tectonic units that emerged in the interior of the Carpathian chain are represented by the Tisza–Dacia and ALCAPA microplates [
11,
12]. Outside, we find the foreland of the Carpathian orogen formed on the platform units (Eastern European, Scythian, and Moesian Platform) that are bent at the front of the Carpathian collisional belt [
13].
The intra-slab stress estimated from the earthquake focal mechanism shows a compressive regime, with reverse faulting and extension in the vertical direction [
14]. Crustal earthquakes, otherwise, are affected by an extensional regime with normal and strike–slip faulting [
15,
16]. A weak coupling or initiation of decoupling was suggested between the sinking slab and the overriding crust. A striking decrease in stress ratio with increasing earthquake magnitude shows that small earthquakes are dominantly thrust–fault types associated with vertical elongation. For larger earthquake generation, mineralogical phase changes or dehydration embrittlement mechanisms are suggested [
16]. Intermediate-depth (60–300 km) earthquakes occur along convergent plate margins, but their causes remain unclear. Because of the high pressure at depth, brittle failure is unlikely at high depths, so these mechanisms alone are implausible explanations for earthquakes occurring significantly deeper than crustal earthquakes. Therefore, a theoretical study shows that material failure can occur below Frenkel’s ultimate limit as a result of thermal runaway [
17]. Earthquake generation at high depths and high pressure is fundamentally dependent on phase transformation, which generates a self-healing pulse mechanism with rapid strength recovery [
18]. Plio–quaternary magmatic activity near the Vrancea zone shows a shift from normal calc-alkaline to much more diverse compositions (adakite-like calc-alkaline, K-alkalic, mafic Na-alkalic, and ultrapotassic). The tectonic setting timing, petrology, and geochemistry show that calc-alkaline volcanism (5.3–3.9 Ma) marks the end of normal subduction-related magmatism along the post-collisional Călimani–Gurghiu–Harghita volcanic chain in front of the European convergent plate margin [
19]. Meanwhile, west of Vrancea zone, the diverse composition of magma generation in front of the Moesia platform is linked by two main geodynamic events: (1) slab–pull and steepening with an opening of a tear window (adakite-like calc-alkaline magmas) and (2) renewed contraction associated with deep mantle processes such as slab steepening during post-collisional times (Na and K-alkalic magmas) [
19].
3. Data and Method
Starting in 1996, the Romanian Seismic Network was improved and extended with a multidisciplinary network designed for geophysical/geochemical and atmospheric field parameter monitoring and event detection. This network includes recordings of magneto–telluric and electric–electrostatic fields, ULF waves, air ionization, infrasound, radon, and CO
2 [
20,
21].
The Muntele Rosu seismic observatory (MLR) is situated at the western edge of the Vrancea seismogenic area (
Figure 1), providing a valuable opportunity to investigate the behavior of the local geomagnetic field. The 1-min geomagnetic data collected at MLR were compared to the 1-min data collected at Surlari (SUA) Magnetic Observatory(
Figure 1), which is located outside of the Vrancea seismic zone. This comparison enabled the differentiation of global anomalies from local/regional ones. However, the Surlari observatory had a period of approximately two years during which its data acquisition was deficient, and the reference observatory was subsequently changed to the Tihany (THY) observatory in Hungary. According to the Dobrovolsky [
22] relationship (R = 10
0.43xM), the SUA station can easily fall within the preparation zone for earthquakes with Mw > 5. The earthquake that occurred on 27 October 2004, with Mw = 6, provided an ideal opportunity to test this relationship. However, no precursor signals were observed before this earthquake, leading us to deduce that this relationship is somewhat optimistic or may yield better results for crustal earthquakes. Using the Hayakawa [
23] relationship (Rmax = (M − 4.5)/0.025), the preparation zone (Rmax) is determined to be 60 km, placing the SUA station far outside the preparation zone.
The missing data packets from the MLR station were added using a program developed in Lab VIEW, adding the last value correctly read. The missing data packets from Surlari (SUA were analyzed using the Python programming language and its libraries, such as Pandas and NumPy. The data from INTERMAGNET (
http://intermagnet.org accessed on 3 February 2023 ) were unzipped and merged. Furthermore, the headers that appeared after each day were removed, and the values of “99999” that marked instrument failures were replaced with “NaN” (Non-numerical values), to eliminate the effect of spraying and scaling the representations of geomagnetic data.
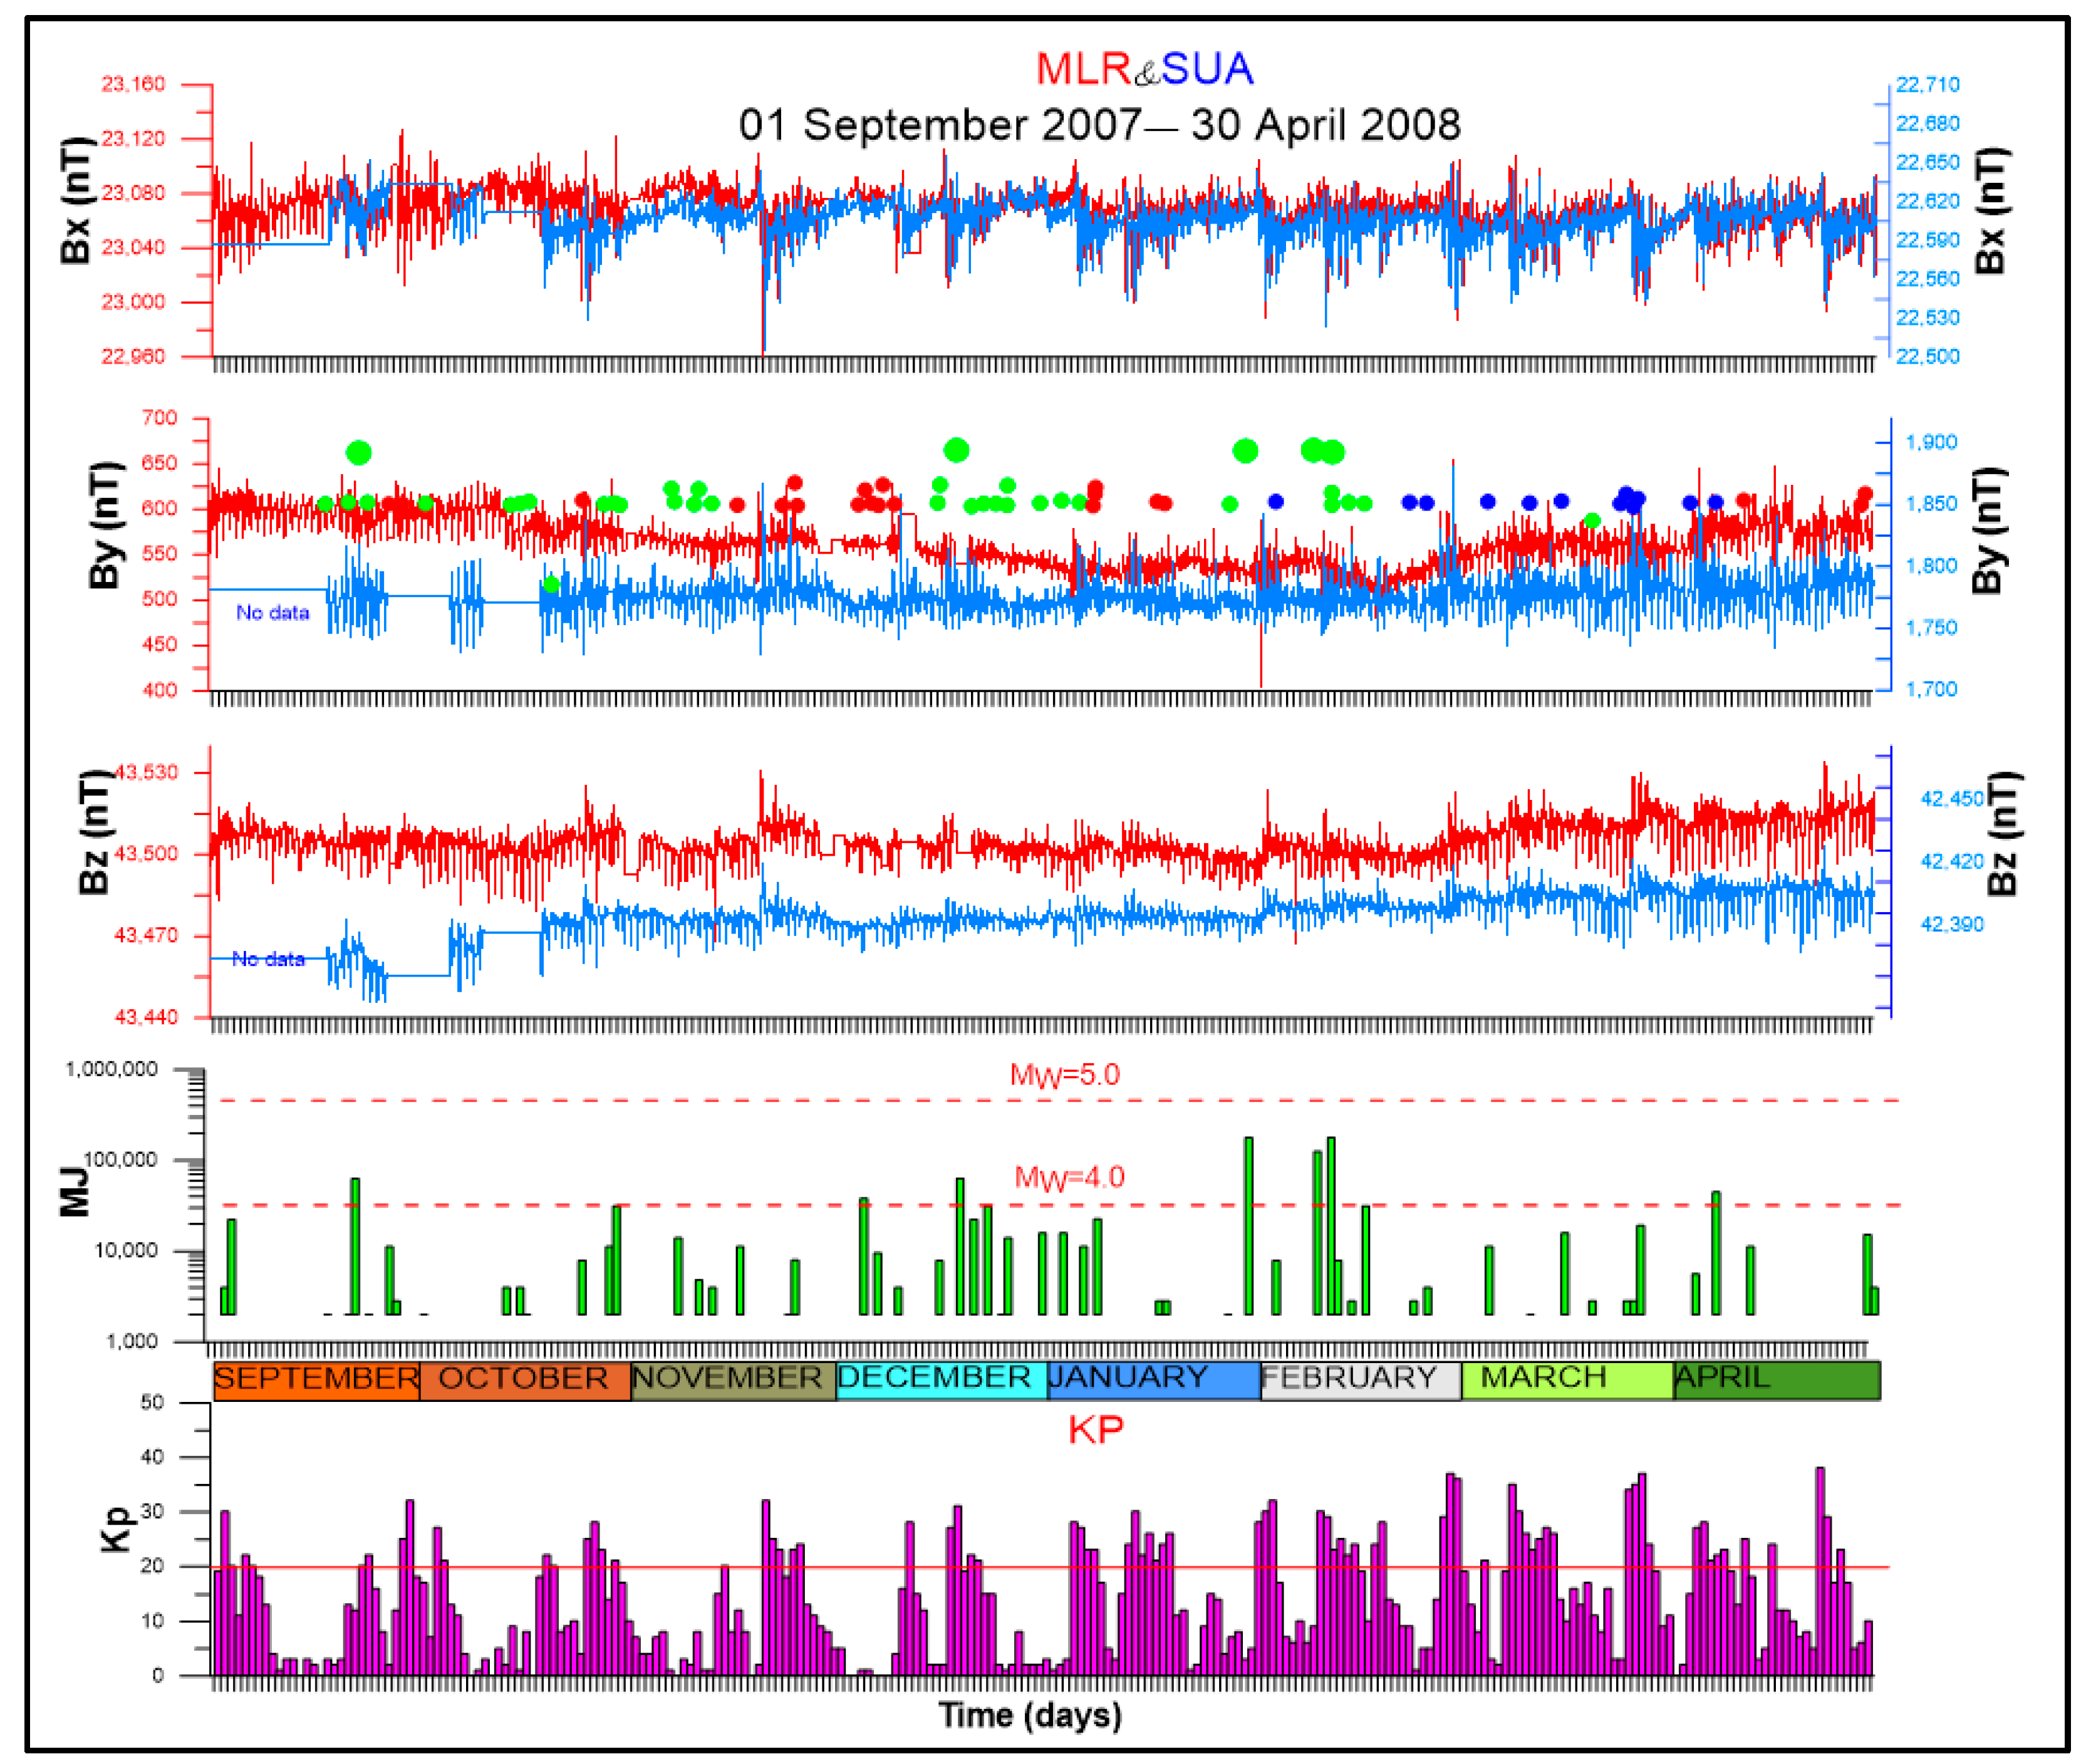
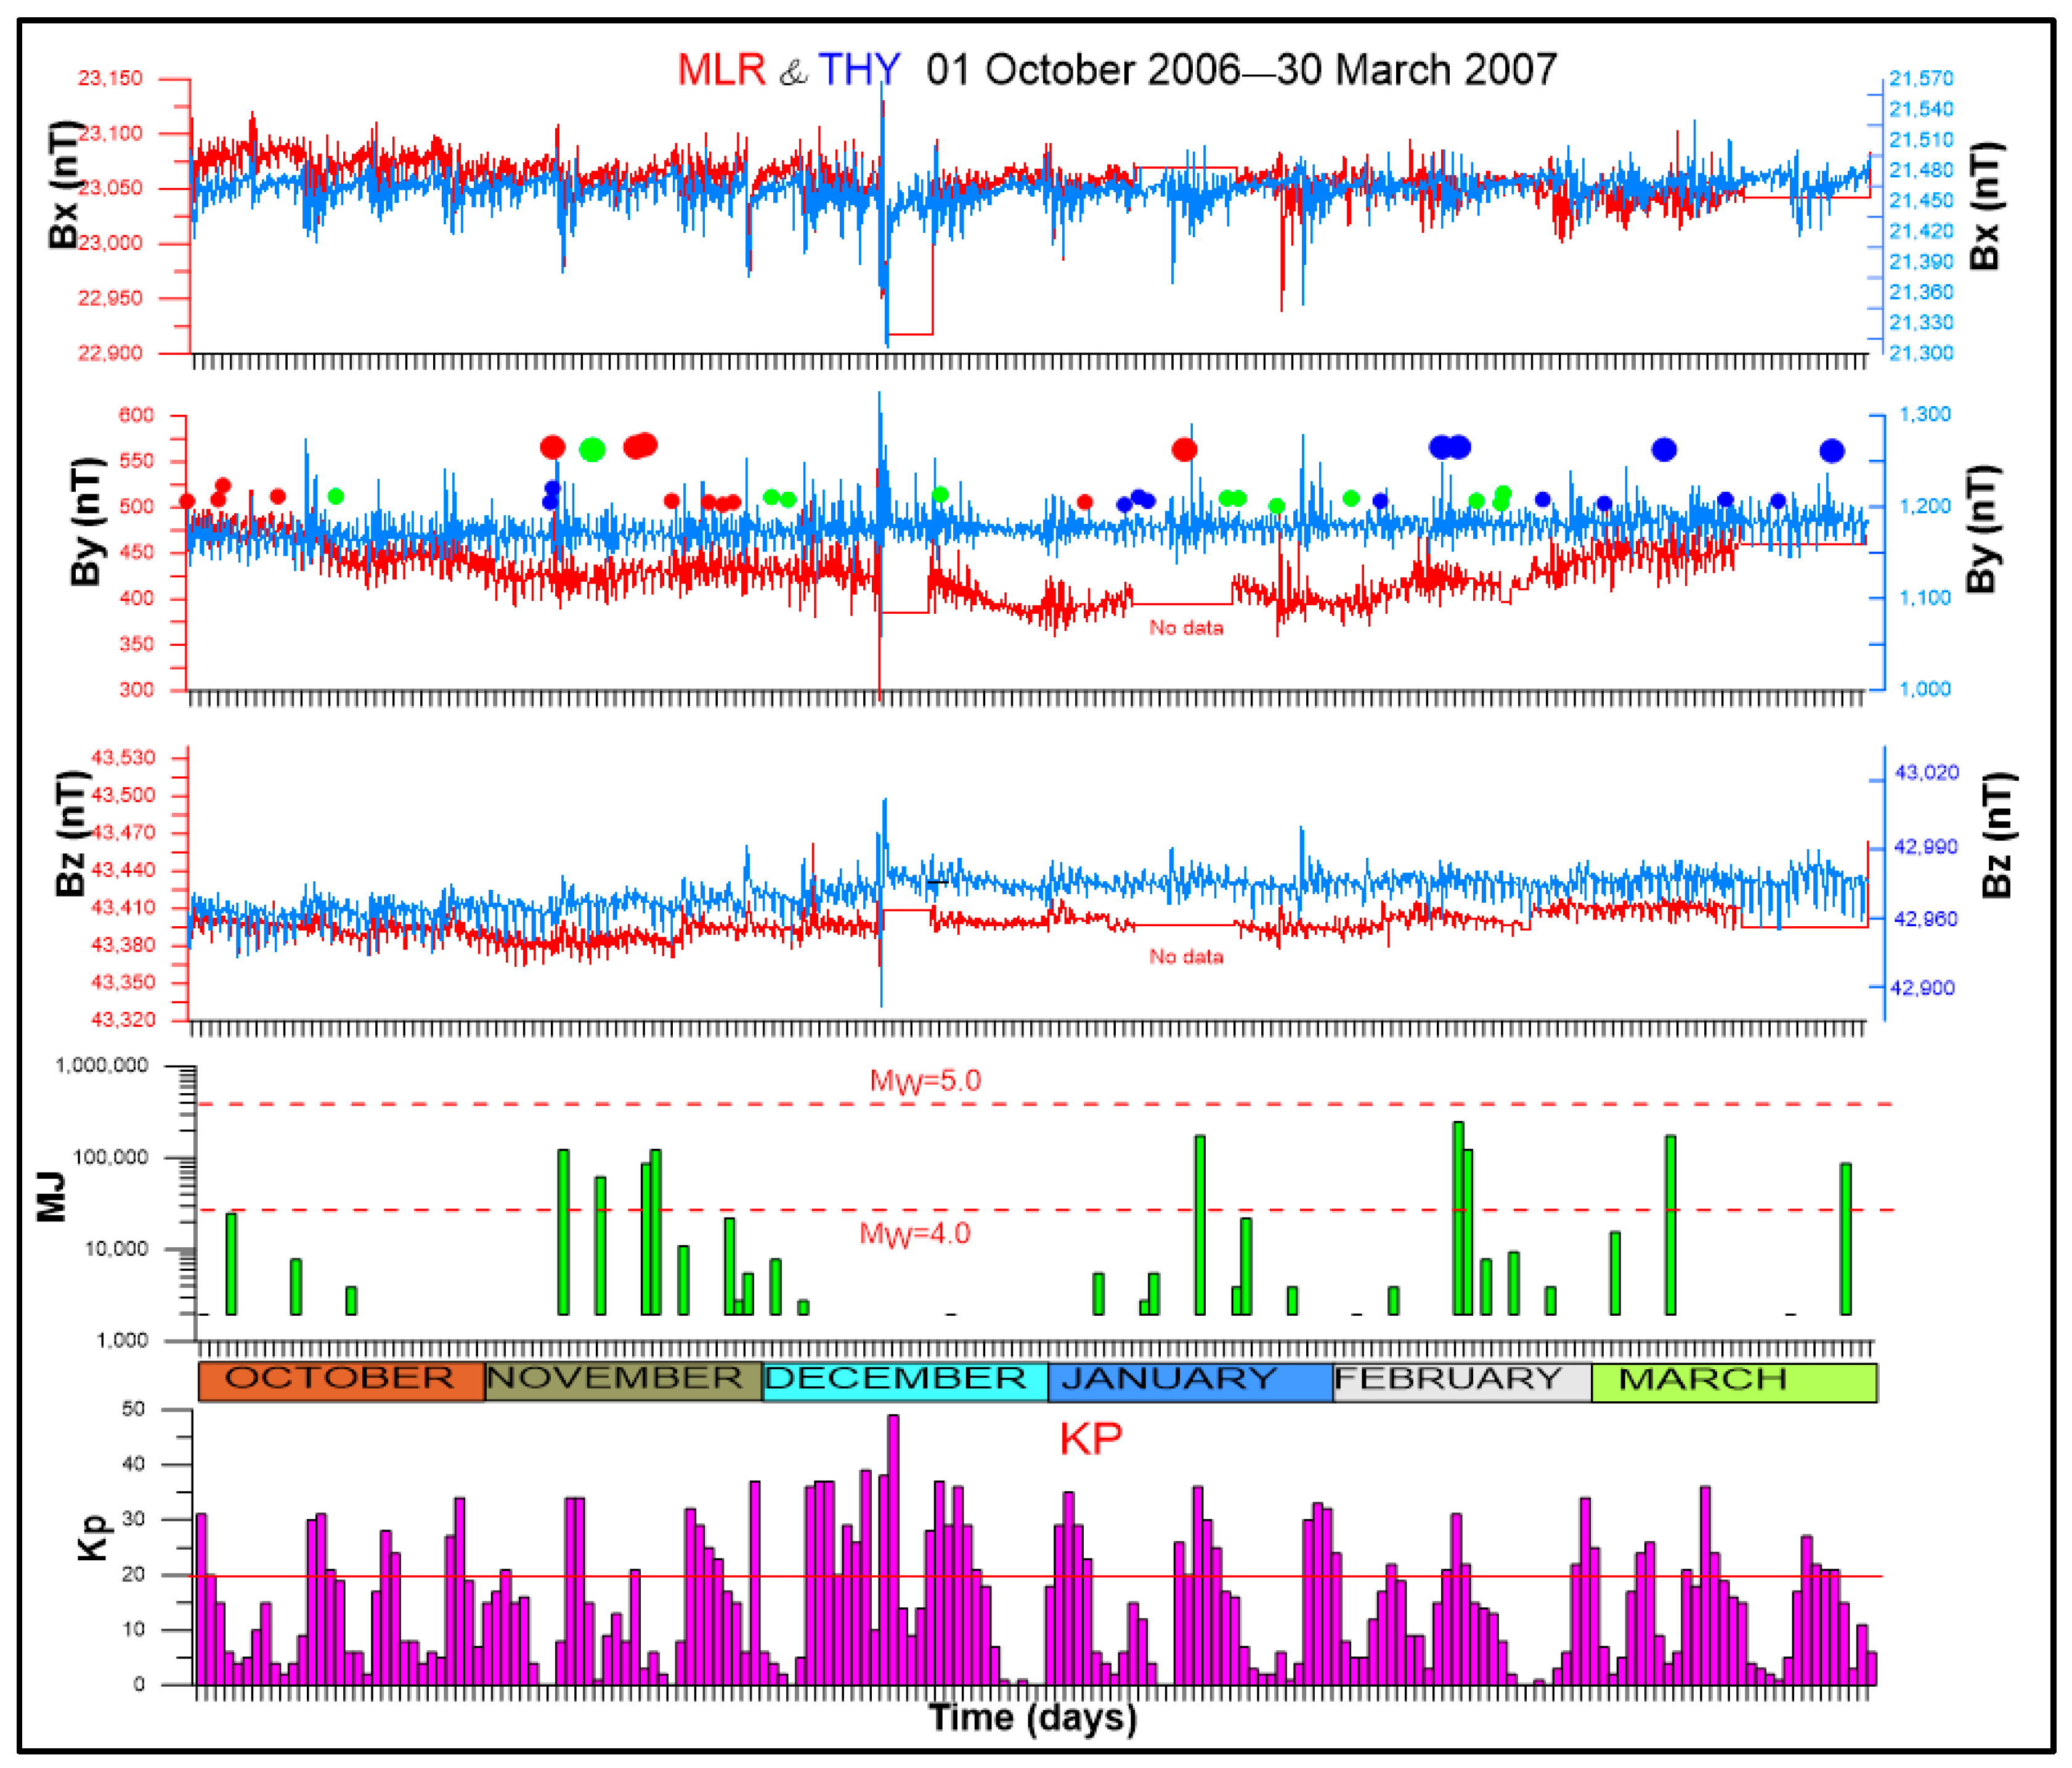
The main phenomena that disrupt magnetic measurements at fixed locations are global magnetic variations. Solar storms increase the amplitude and frequency of magnetic representations, and they are the main phenomena that disturb the magnetic field. To avoid false identification of these anomalies as seismic–magnetic anomalies, the representation of the magnetic field is made together with the daily sum of the Kp indices. Kp indices measured every 3 h are represented as a daily sum for graphical reasons. Solar storms are easy to observe on geomagnetic representations when the sum of Kp indices exceeds 20.
Overlapping the data recorded in the reference observatory (SUA or THY) with sets of geomagnetic data recorded at the MLR observatory, located near the Vrancea seismogenic zone, makes it possible the identification of local anomalies. After identifying the local anomalies, the seismicity related to each anomaly was plotted using the seismic bulletins from the Romplus catalog, which was developed by the National Institute for Earth Physics [
24]. Earthquakes were plotted with green dots(
Table 1). that were generated when a decrease was observed in the horizontal component of the magnetic field (B
y) (Head-Earthquakes). The geomagnetic anomalies recorded on the B
y component had periods that exceeded 200 days, during which periods of stagnation were observed. Earthquakes produced during these periods of stagnation were marked with red dots (Steady_B
y-earthquakes). The beginning of each anomaly begins with a decrease and ends with an increase. Earthquakes produced when the horizontal component B
y increases were marked with blue dots (Tail-Earthquakes). The size of the dots plotted on each anomaly is proportional to the earthquake magnitude, where small dots represent earthquakes with 3 < Mw < 4, average dots represent earthquakes with 4 < Mw < 5, and large dots represent earthquakes with Mw ≥ 5(
Table 1).
The seismic energy release was calculated using all intermediate-depth earthquakes with a magnitude greater than 3. The small earthquakes (Mw < 3) are considered to be background seismicity that releases constant stress.
To calculate the energy released daily, we used the Gutenberg–Richter magnitude–energy relation (1956) “E = 1.5 M + 11.8”. At the very beginning, the surface-wave magnitude (Ms), and body-wave magnitude (mB) were used to calculate the seismic energy release (Equations (1) and (2)).
The surface-wave magnitude (Ms) and body-wave magnitude (mB) saturate at large earthquakes and lead to an inaccurate estimate of energy released in great earthquakes. To solve this problem, the authors in [
25] used the Gutenberg–Richter magnitude–energy relationship a new magnitude scale (Mw) resulting from the seismic moment (Mo) parameter, which measures the overall deformation in the source (Equation (3)).
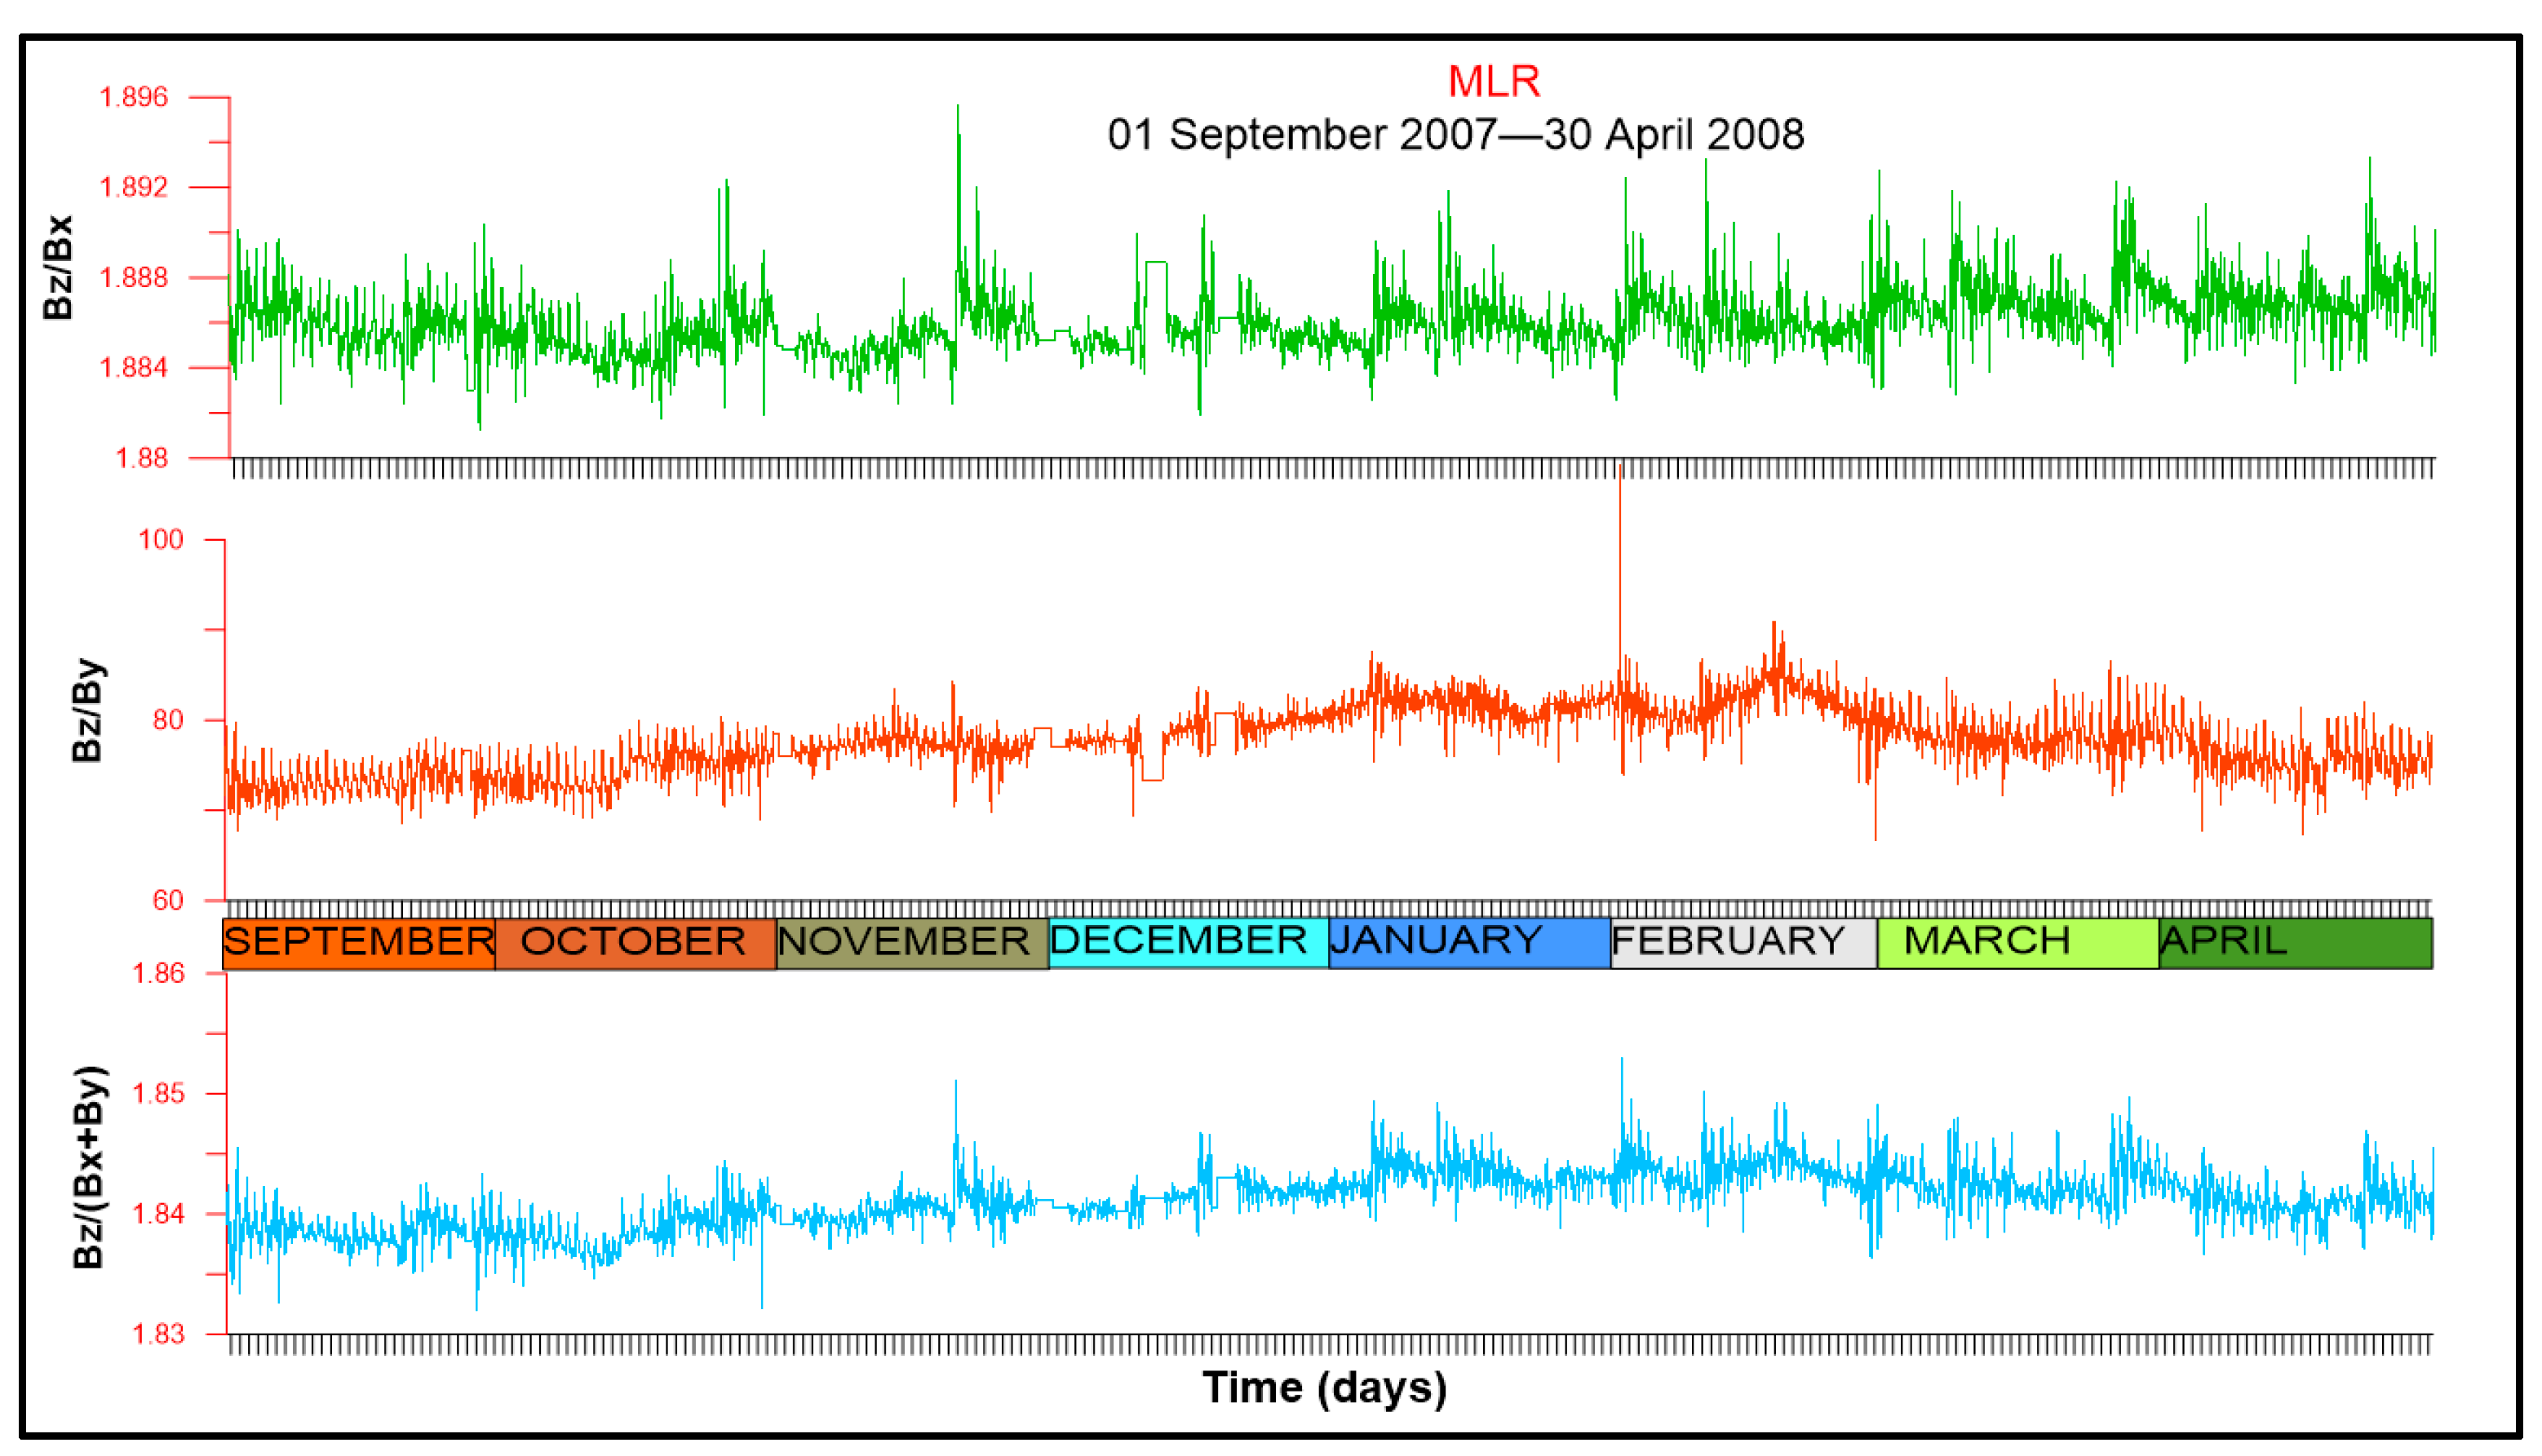
Anomalies recorded on the B
y component can be explained by the setup of the instrument that gives low values on the B
y component (600 nT). To identify if these anomalies are also found on the other components of the magnetic field, the following ratios were analyzed: B
z/B
x, B
z/B
y, and B
z/B
H (
Figure 2).
In the previous study, for each anomaly, the total seismic energy was calculated, which was correlated with the magnitude of the decrease recorded on the B
y component of the local magnetic field. For a better determination of the B
y decrease, the standard deviation on the horizontal component of the magnetic field B
y (SD
By) was calculated. Thus, the variability measured on the B
y component (Equation (5)) was correlated with the total seismic energy. Most data series have a bell-shaped distribution that centers around a central value (Gaussian distribution). The central tendency of a dataset can be expressed by the arithmetic mean of the values in the dataset, the determination of the median, and the determination of the modal class. To determine the standard deviation, we chose as central tendency the arithmetic mean
of all values recorded on the horizontal component (Equation (4)).
4. Local Geomagnetic Behavior and Seismic Energy Release
This article concludes the study of the behavior of the local geomagnetic field measured at Muntele Rosu over a period of 20 years. The geomagnetic data used in this study cover the period 2000–2008 and were also analyzed by Moldovan et al., 2012 [
26], which highlighted the geomagnetic anomaly that accompanied the intermediate earthquake with Mw = 6.0 produced on 27 October 2004. Unlike the graphical representations of Moldovan et al., 2012, which extended over a period of one month, in this study, the representations of the magnetic field were made over a longer period (6–8 months). In this way, the seasonal character of these variations was observed at Muntele Rosu Observatory which has been observed in previous works [
6]. Additionally, the seismic energy released daily and the total seismic energy for each anomaly were calculated. It has been observed that the magnitude of these geomagnetic anomalies varies from year to year and so does the seismicity. Thus, the variability measured on the B
y component was highlighted by calculating the standard deviation for each anomaly recorded on the horizontal B
y component of the geomagnetic field.
Figure 2 shows the ratios B
z/B
x, B
z/B
y, and B
z/B
H. We notice that the ratio between the vertical component (B
z) and the eastern component (B
y) of the horizontal geomagnetic field is similar to the anomaly recorded on the B
y component of the magnetic field. However, the ratio between the vertical component (B
z) and the northern component (B
x) of the horizontal geomagnetic field indicates that there is no variation in this component of the local magnetic field. The graphical representation of the ratio between the vertical magnetic field (B
z) and the horizontal magnetic field formed by the sum of the two horizontal components (B
x and B
y) is influenced only by the variation recorded on the B
y component (
Figure 2).
The anomaly recorded between September 2007 and May 2008 (
Figure 3) is visible only on the B
y component and has a typical morphology for periods with low seismicity. The anomaly does not show a decrease in steps with large positive or negative variations over time periods. The decrease recorded by B
y is smooth. The seismic activity related to this anomaly is low. During this anomaly, four events occurred with Mw between 4 and 4.9.
The next anomaly started on 1 October and ended at the end of April 2007 (
Figure 4). During this time interval, the magnetometer was moved and the distribution of the magnetic field on all three components was changed. The jump resulting from this repositioning was removed and the magnetic distribution before the move was restored. Unlike the previous anomaly, this anomaly shows decreases in steps recorded on the B
y component. The seismicity manifested during this anomaly is significantly higher than the previously registered anomaly, being accompanied by nine earthquakes with Mw> 4 compared to only four between 1 September 2007 and 30 April 2008. In the representation of the ratios between the three components of the magnetic field, we also observe no variation between B
z and B
z. The ratio B
z/B
y and B
z/B
H shows a similar variation dictated by the variation recorded on the B
y component.
The anomalous variation recorded on B
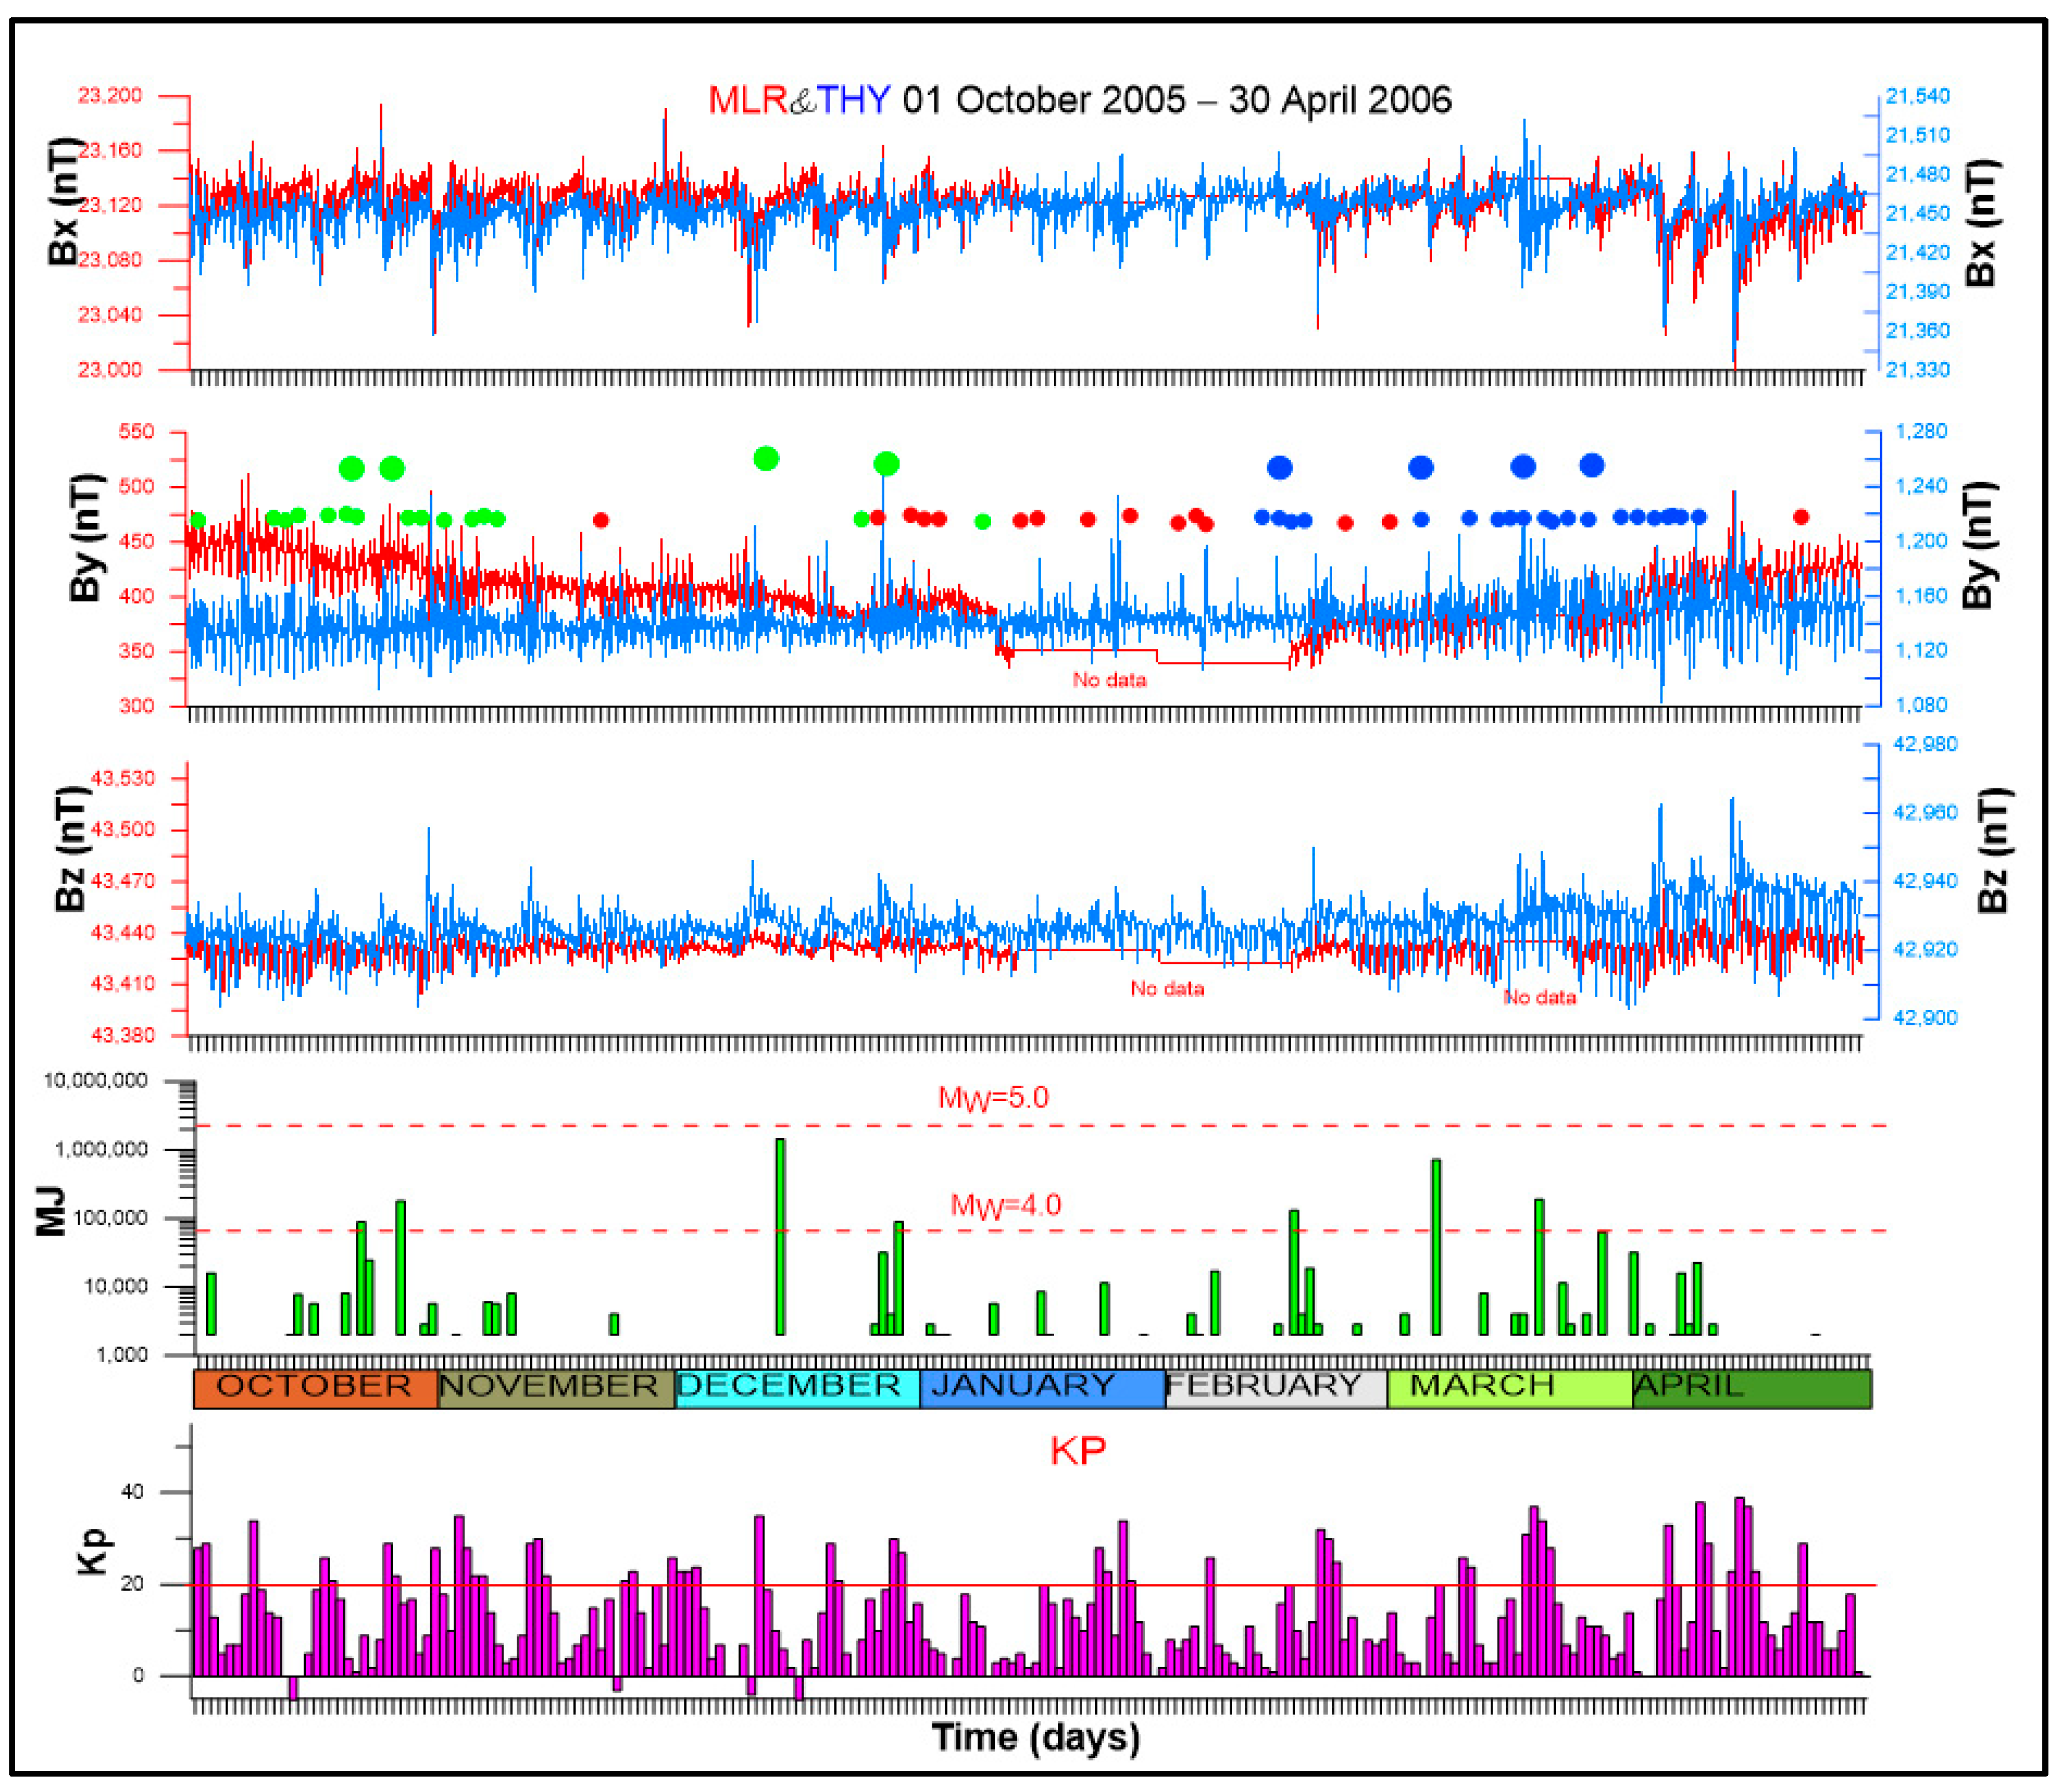
y, one of the horizontal components of the magnetic field from October 2005 to May 2006 is similar to the variation recorded in the period 2006–2007 (
Figure 5). As can be seen in the middle part of the anomaly, the data acquisition did not work for about a month, but even so, its morphology is similar to the anomaly presented above. Even if this variation presents a lack of one month of data, the variation morphology is still similar to the variation recorded in September 2006–May 2007. During this anomaly, eight earthquakes with Mw greater than 4 occurred, compared to nine earthquakes produced in the previous anomaly.
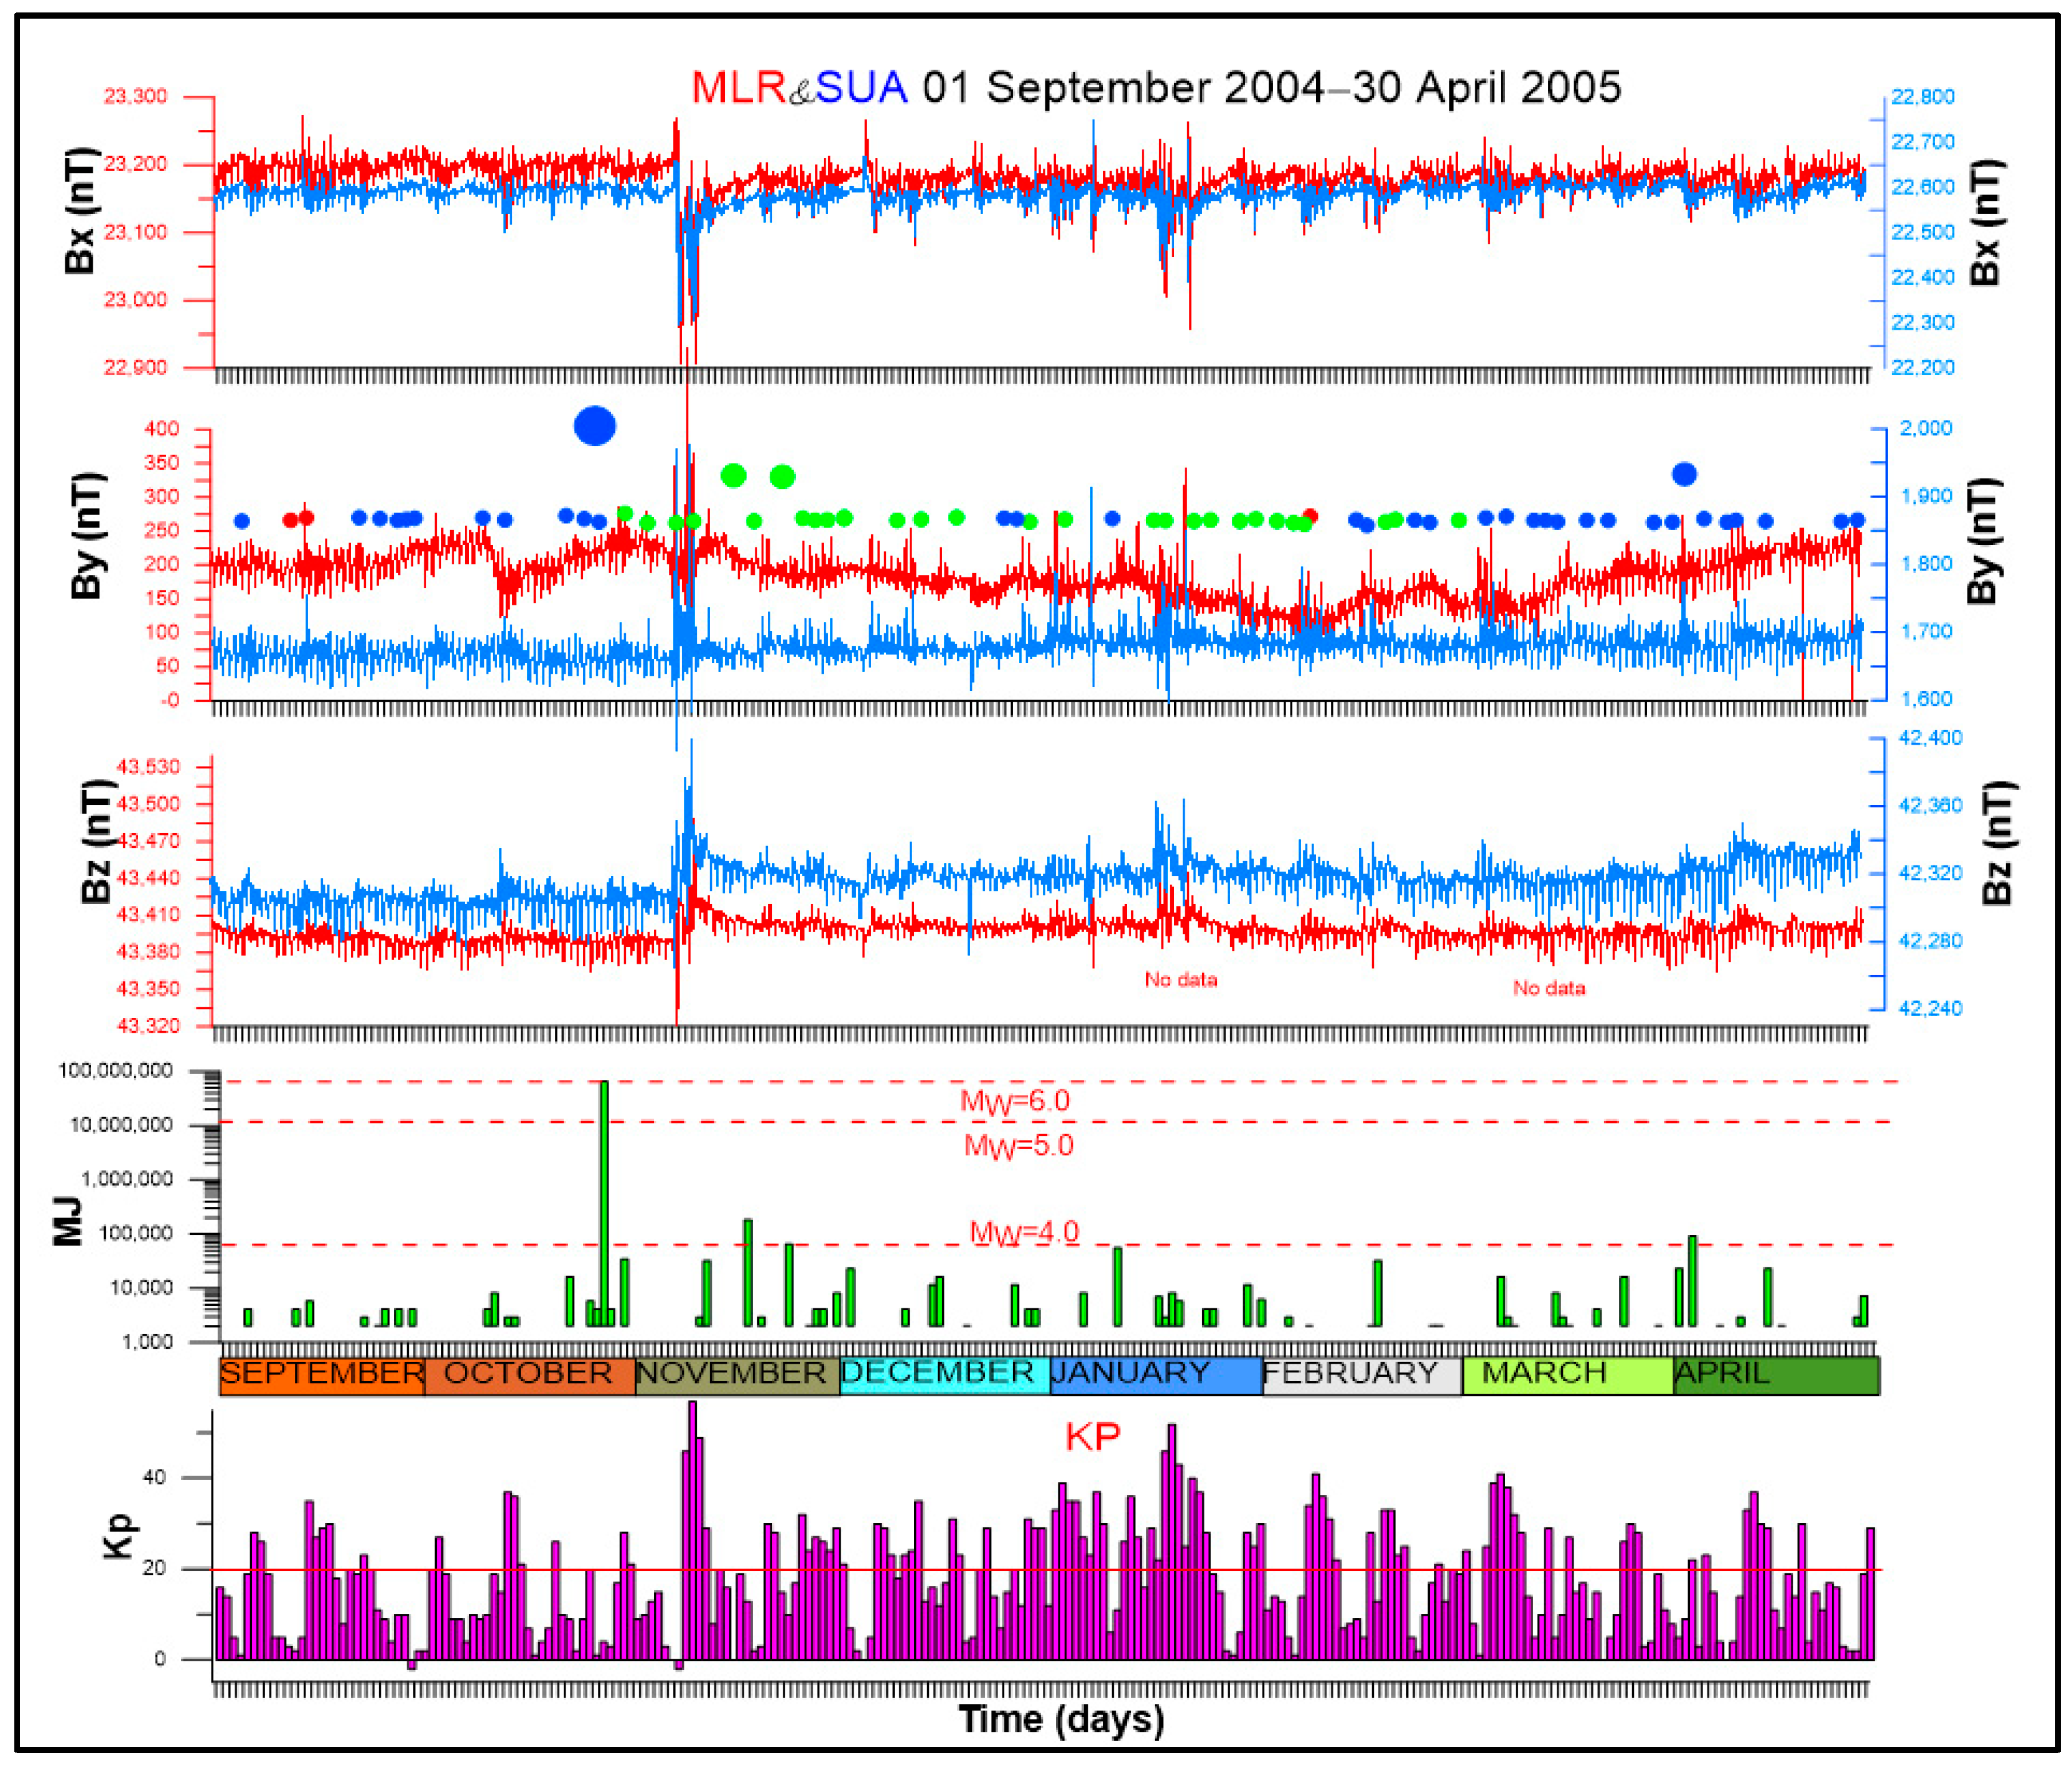
The anomaly registered at Muntele Rosu from 1 October 2004 to 30 April 2005 was marked by the occurrence of an intermediate earthquake with Mw = 6.0. The authors in [
27] highlighted part of this anomaly through a graphical representation that spanned one month. The anomaly observed by the authors in [
26] is also visible in
Figure 6, representing the first part of an anomaly that lasted for 7 months. This anomaly has a different morphology, which is differentiated by a strong variation of the B
y component (60 nT) encountered in the first part of it. The morphology described by the B
y component decrease fits periods with high seismicity, where the B
y component decreases very much over a short period and the overall B
y is not so smooth.
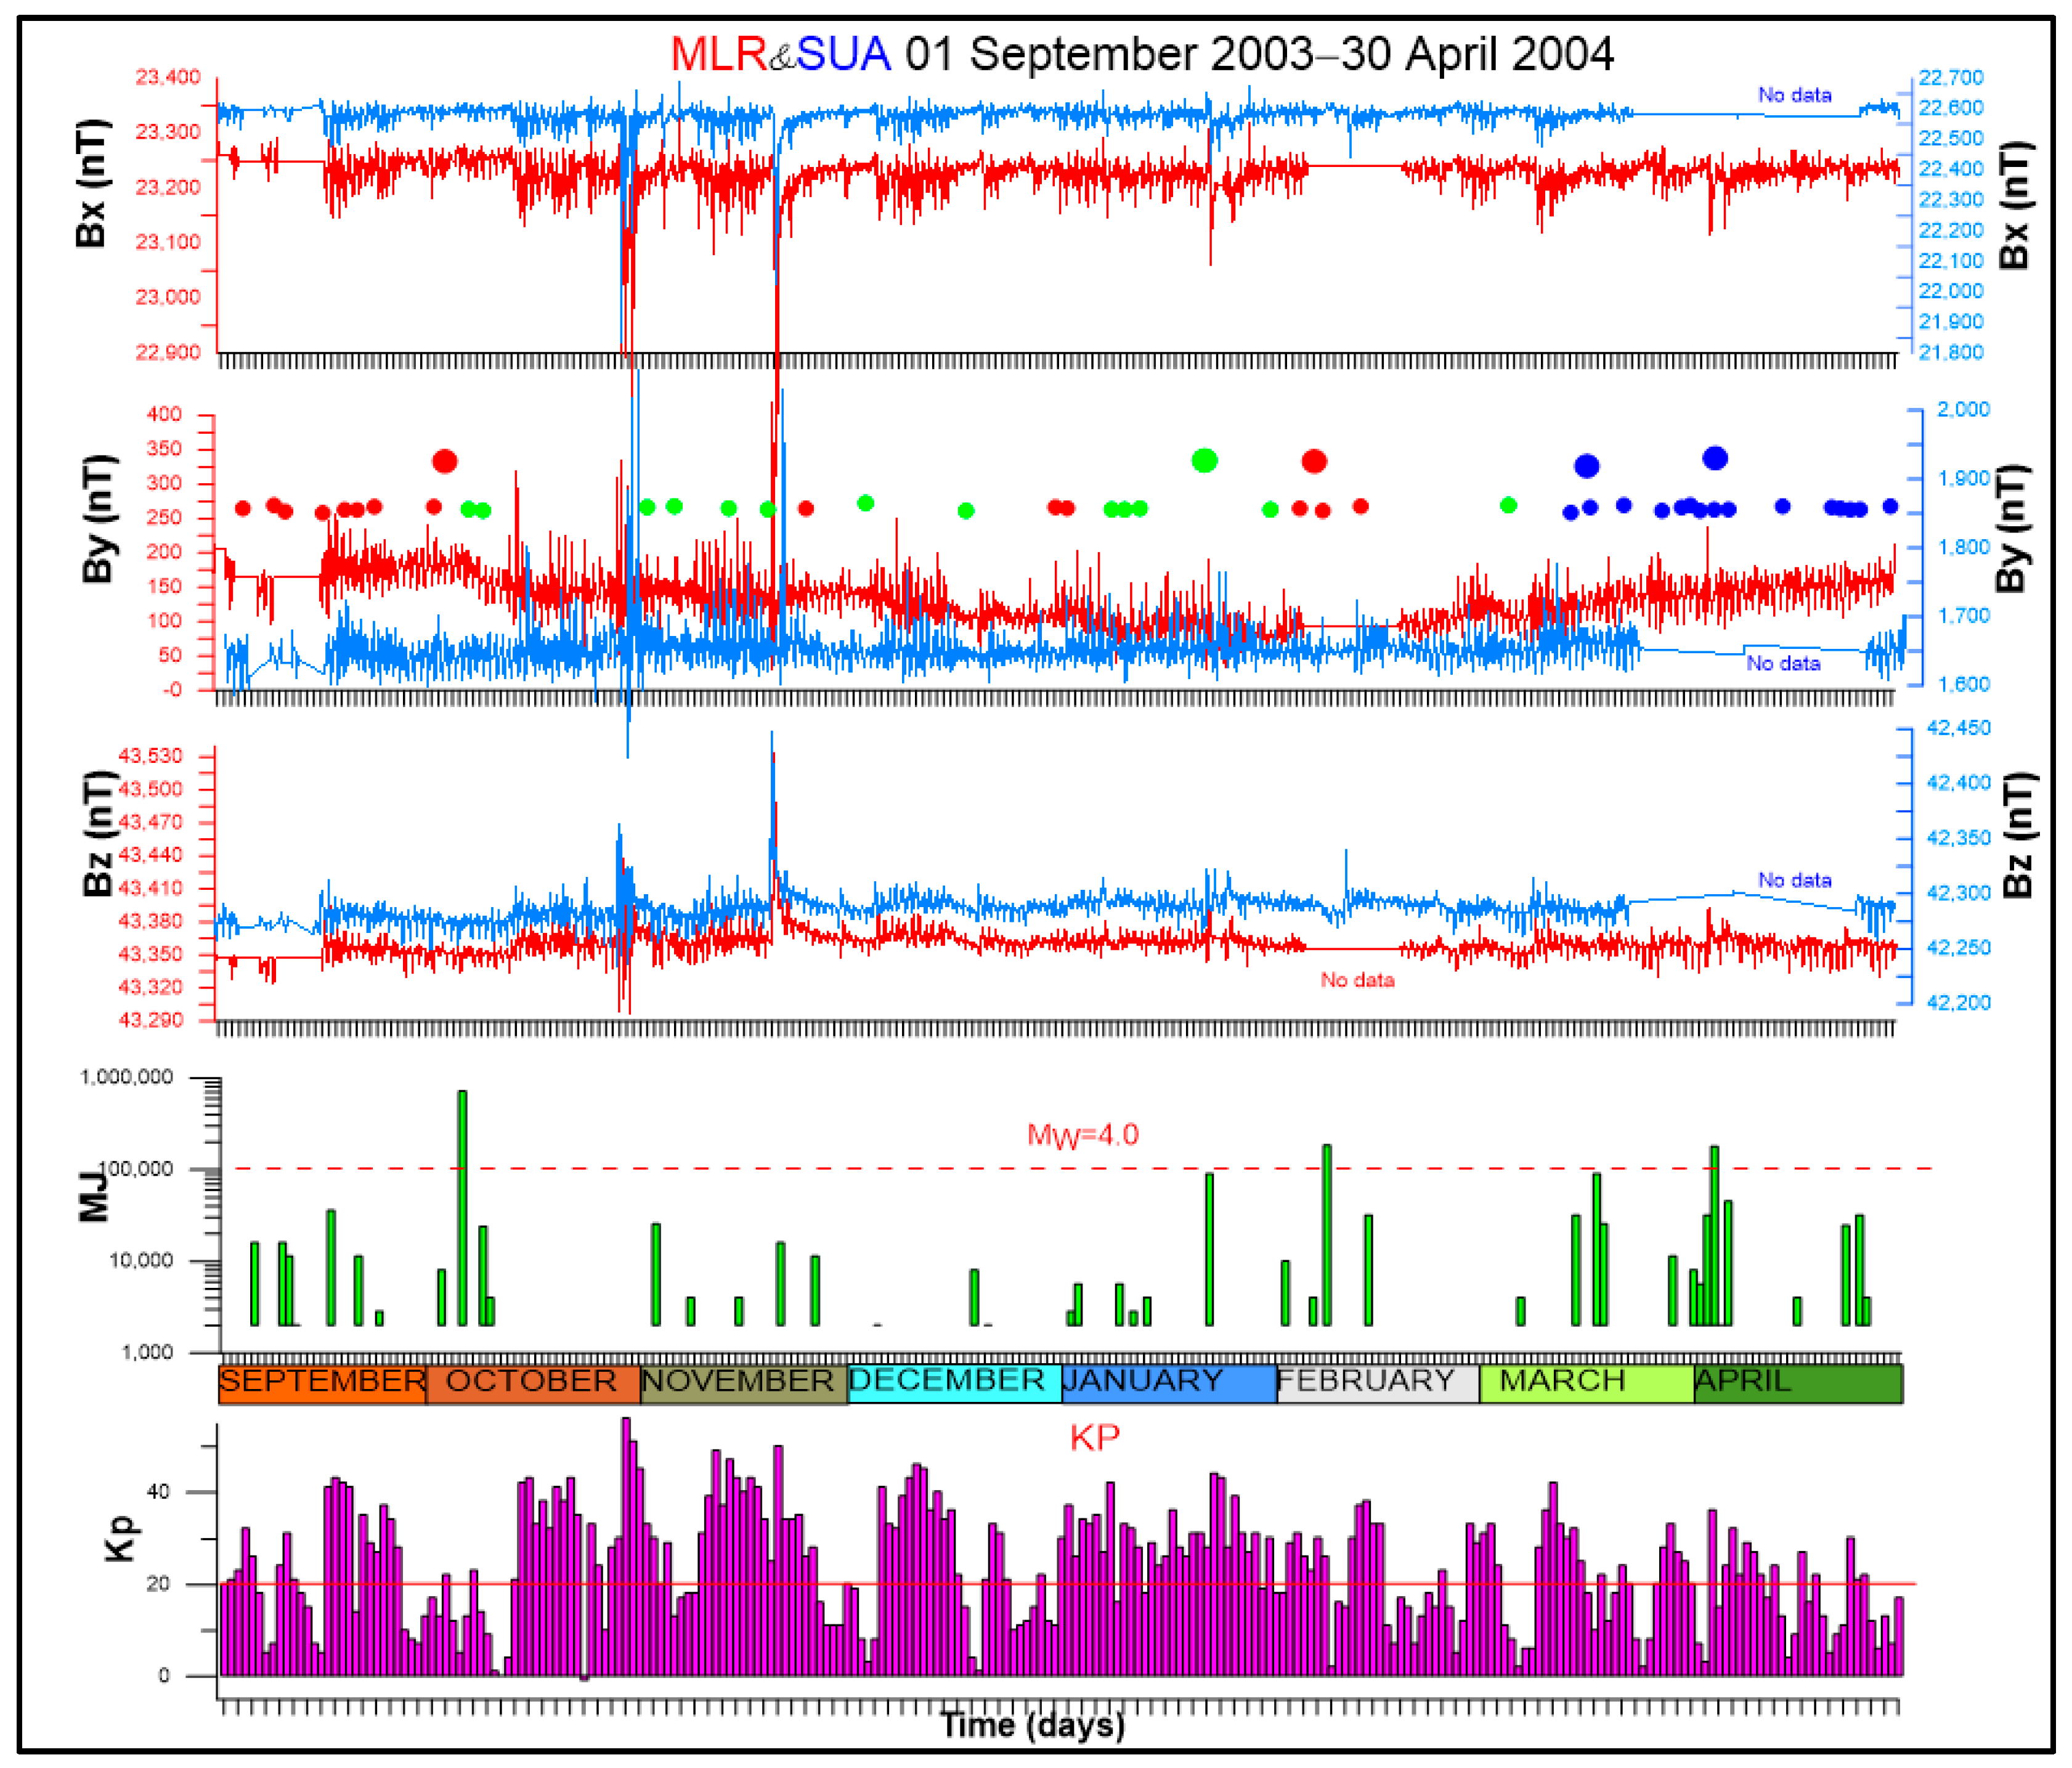
Figure 7 shows a smooth variation registered on the B
y component, similar to the anomaly registered between 1 September 2007 and 30 April 2008. Solar activity during this period was the strongest observed during the entire study period, with the sum of K
p indices frequently exceeding 20. However, the seismicity during this period was feeble, and there was no correlation observed between the number and magnitude of solar storms and seismic activity. Solar activity does not seem to follow a pattern, as strong solar activity was observed during both types of B
y decreases.
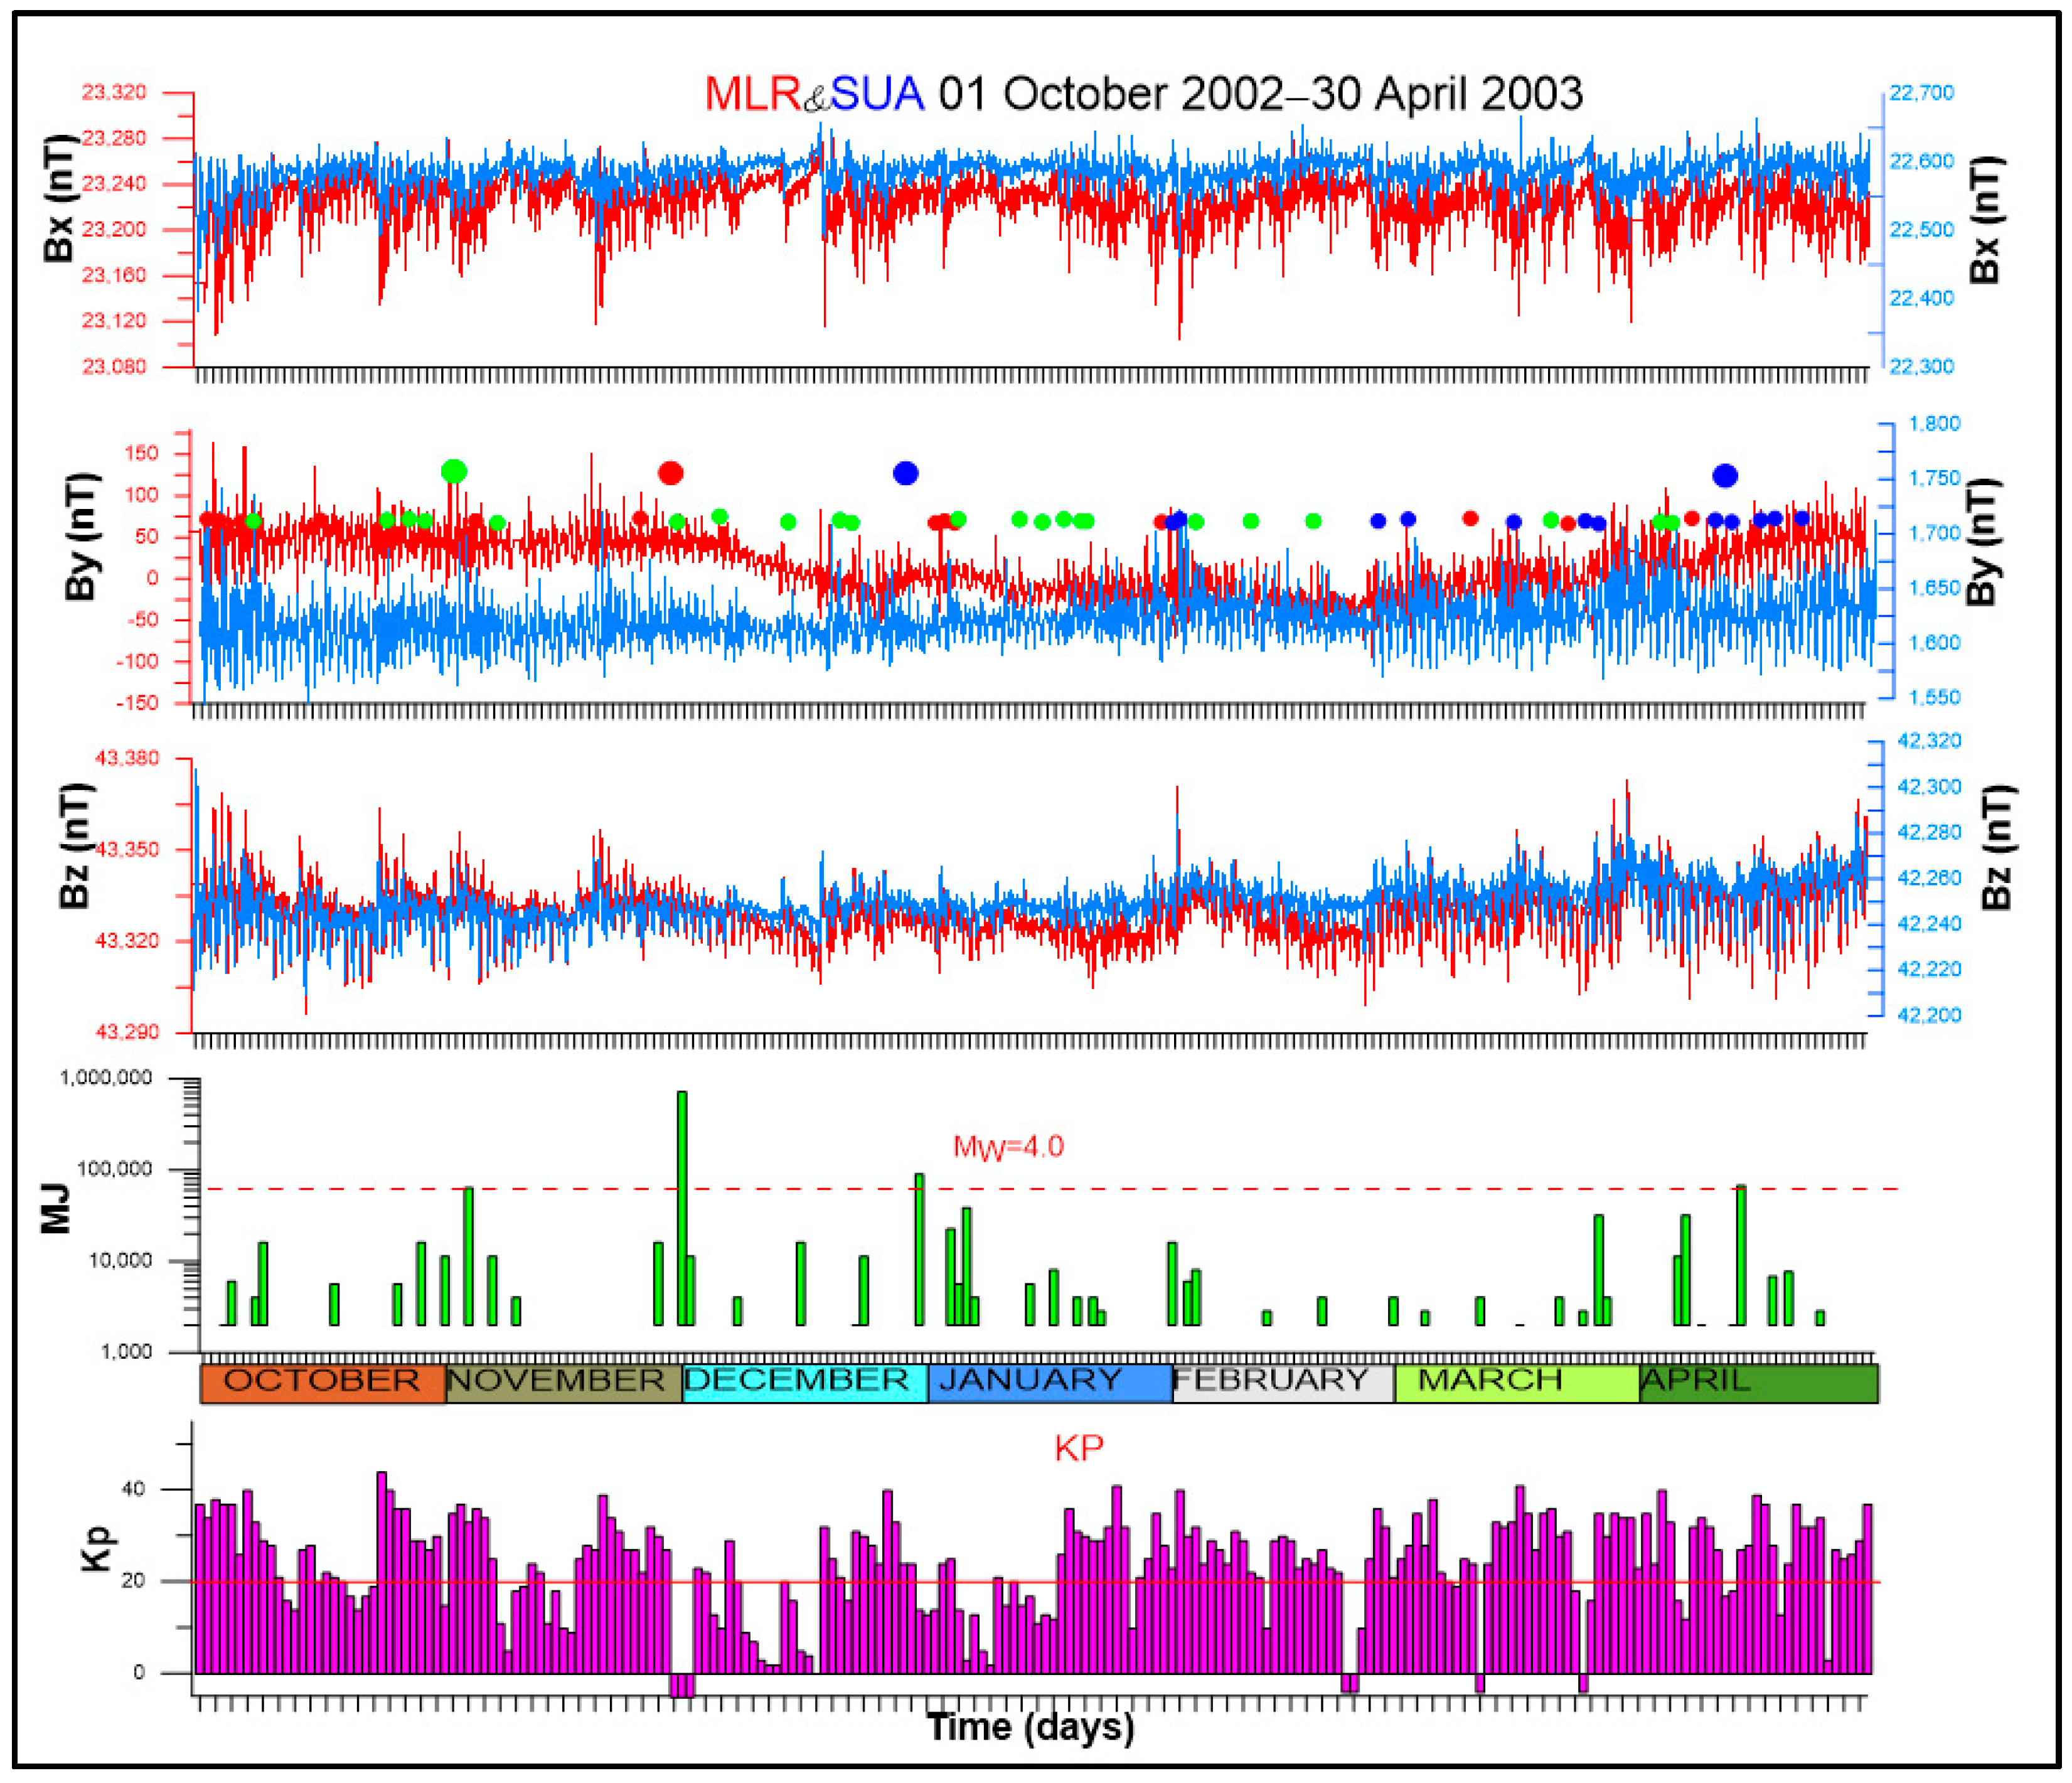
The anomaly recorded between October 2002 and May 2003 (
Figure 8) is visible only on the B
y component, and has a typical morphology for periods with low seismicity. The anomaly does not show a decrease in steps with large positive or negative variations over short periods, but instead shows a smooth decrease. This anomaly is similar to the anomaly observed from 2007 to 2008, and the seismicity during both periods was also similar.
As can be seen from the graphical representations above of the ratio between the vertical component of the magnetic field (B
z) and the northern component (B
x) (
Figure 2), the result of this ratio varies between 1.84 and 1.88. However, the value of these ratios is strongly influenced by the presence of solar storms, and any correlation with seismicity in the Vrancea area is doubtful.
Seasonal variations of By component were identified over the period 2002–2008. Alongside each seasonal variation, the seismic distribution of intermediate earthquakes with Mw ≥ 3 was plotted, which helped us to identify patterns of seismic energy release that fit a specific decrease model of the eastern component of the magnetic field (By) recorded at Muntele Rosu station. The dispersion of datasets relative to their mean is calculated as the square root of the variance for each variance of the By component, which is calculated in the next section. The results of SDBy (standard deviation of By component) are correlated with total seismic energy release during each variance.
5. Exploring the Link between By Variance and Total Seismic Energy Release
Solar activity, particularly solar flares, and coronal mass ejections (CMEs) can have a significant impact on the Earth’s geomagnetic field. A great way to quantify these variations recorded on the B
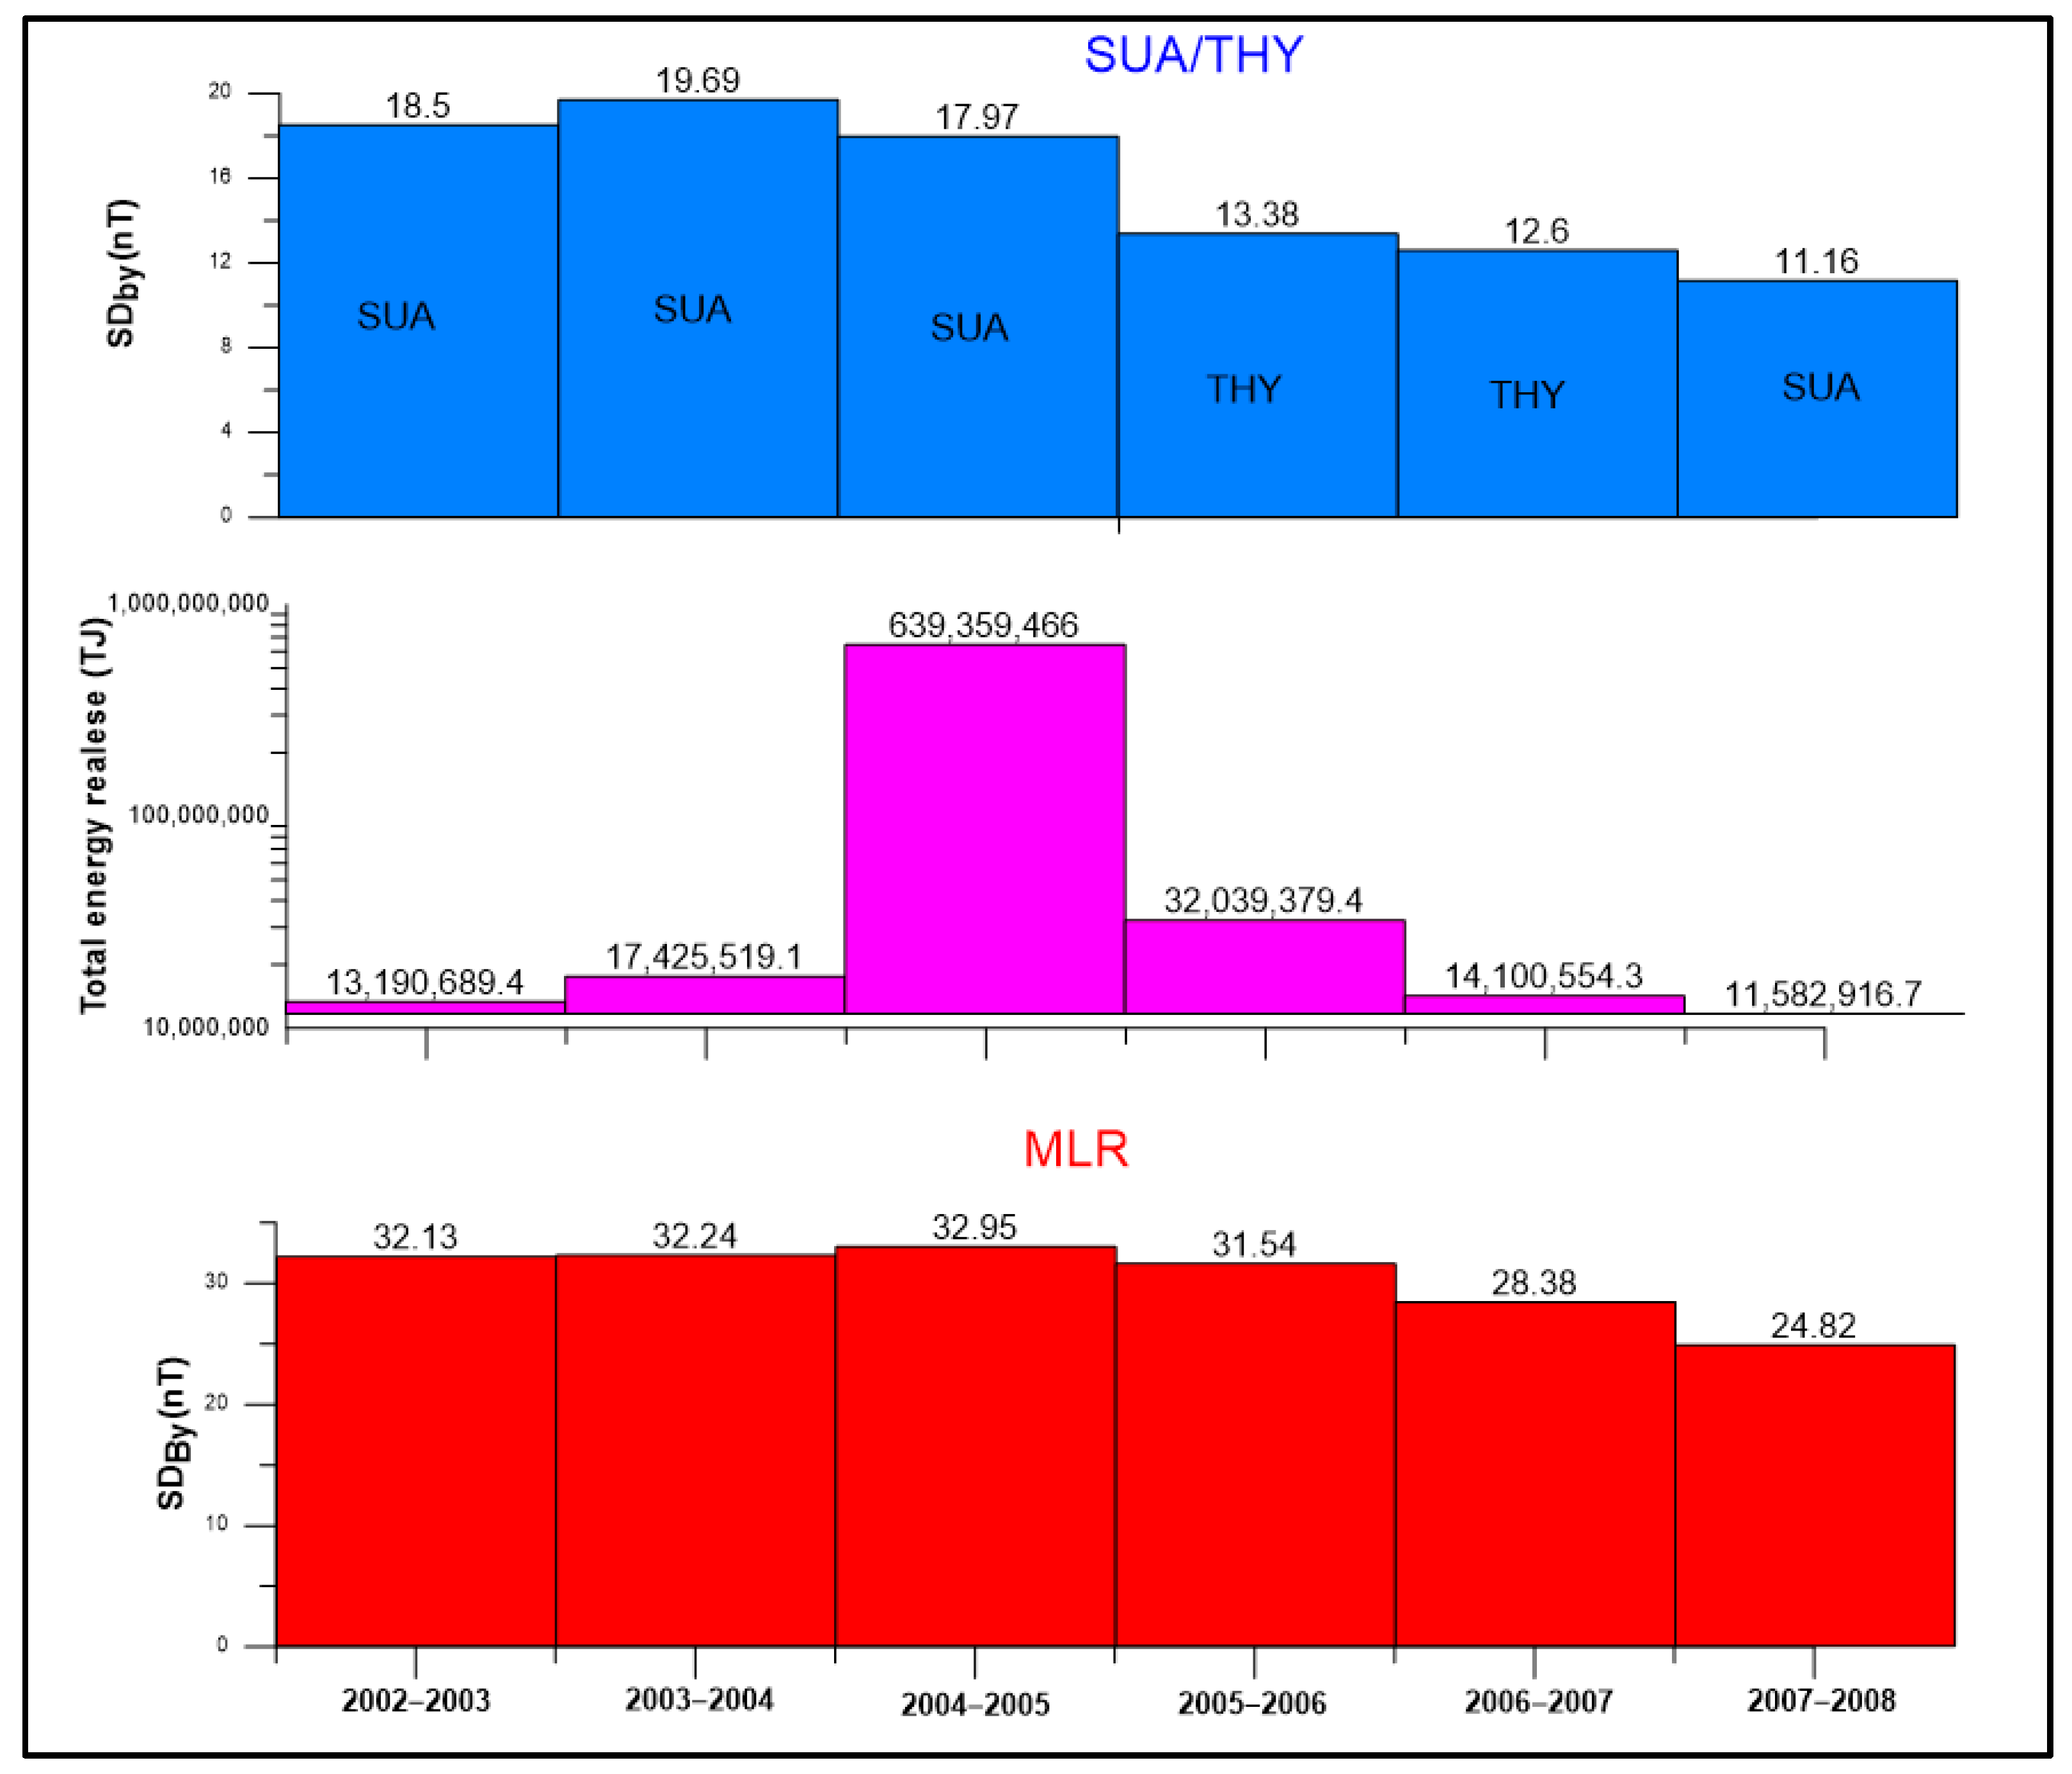
y component is to calculate the standard deviation on geomagnetic datasets. This method was applied on the MLR (Muntele Rosu) and on the SUA (Surlari) stations, the latter of which is used as a reference station. The standard deviation measured on the B
y component at the SUA station is more significant during the period 2002–2003, and smaller in the next three years (
Figure 9). Comparing the results obtained with the solar activity expressed by the K
p indices, we noted that solar activity influences the standard deviation results. The standard deviation measured during the period 2002–2005 is higher and so is the solar activity. Under ideal conditions, the standard deviation measured at Muntele Rosu station should be similar to that of Surlari (SUA), but it is larger and does not fit with the standard deviation measured at the reference station. Therefore, it is obvious that the standard deviation of the Muntele Rosu station (SD
By) is larger than what would be expected based on solar activity alone.
As shown in
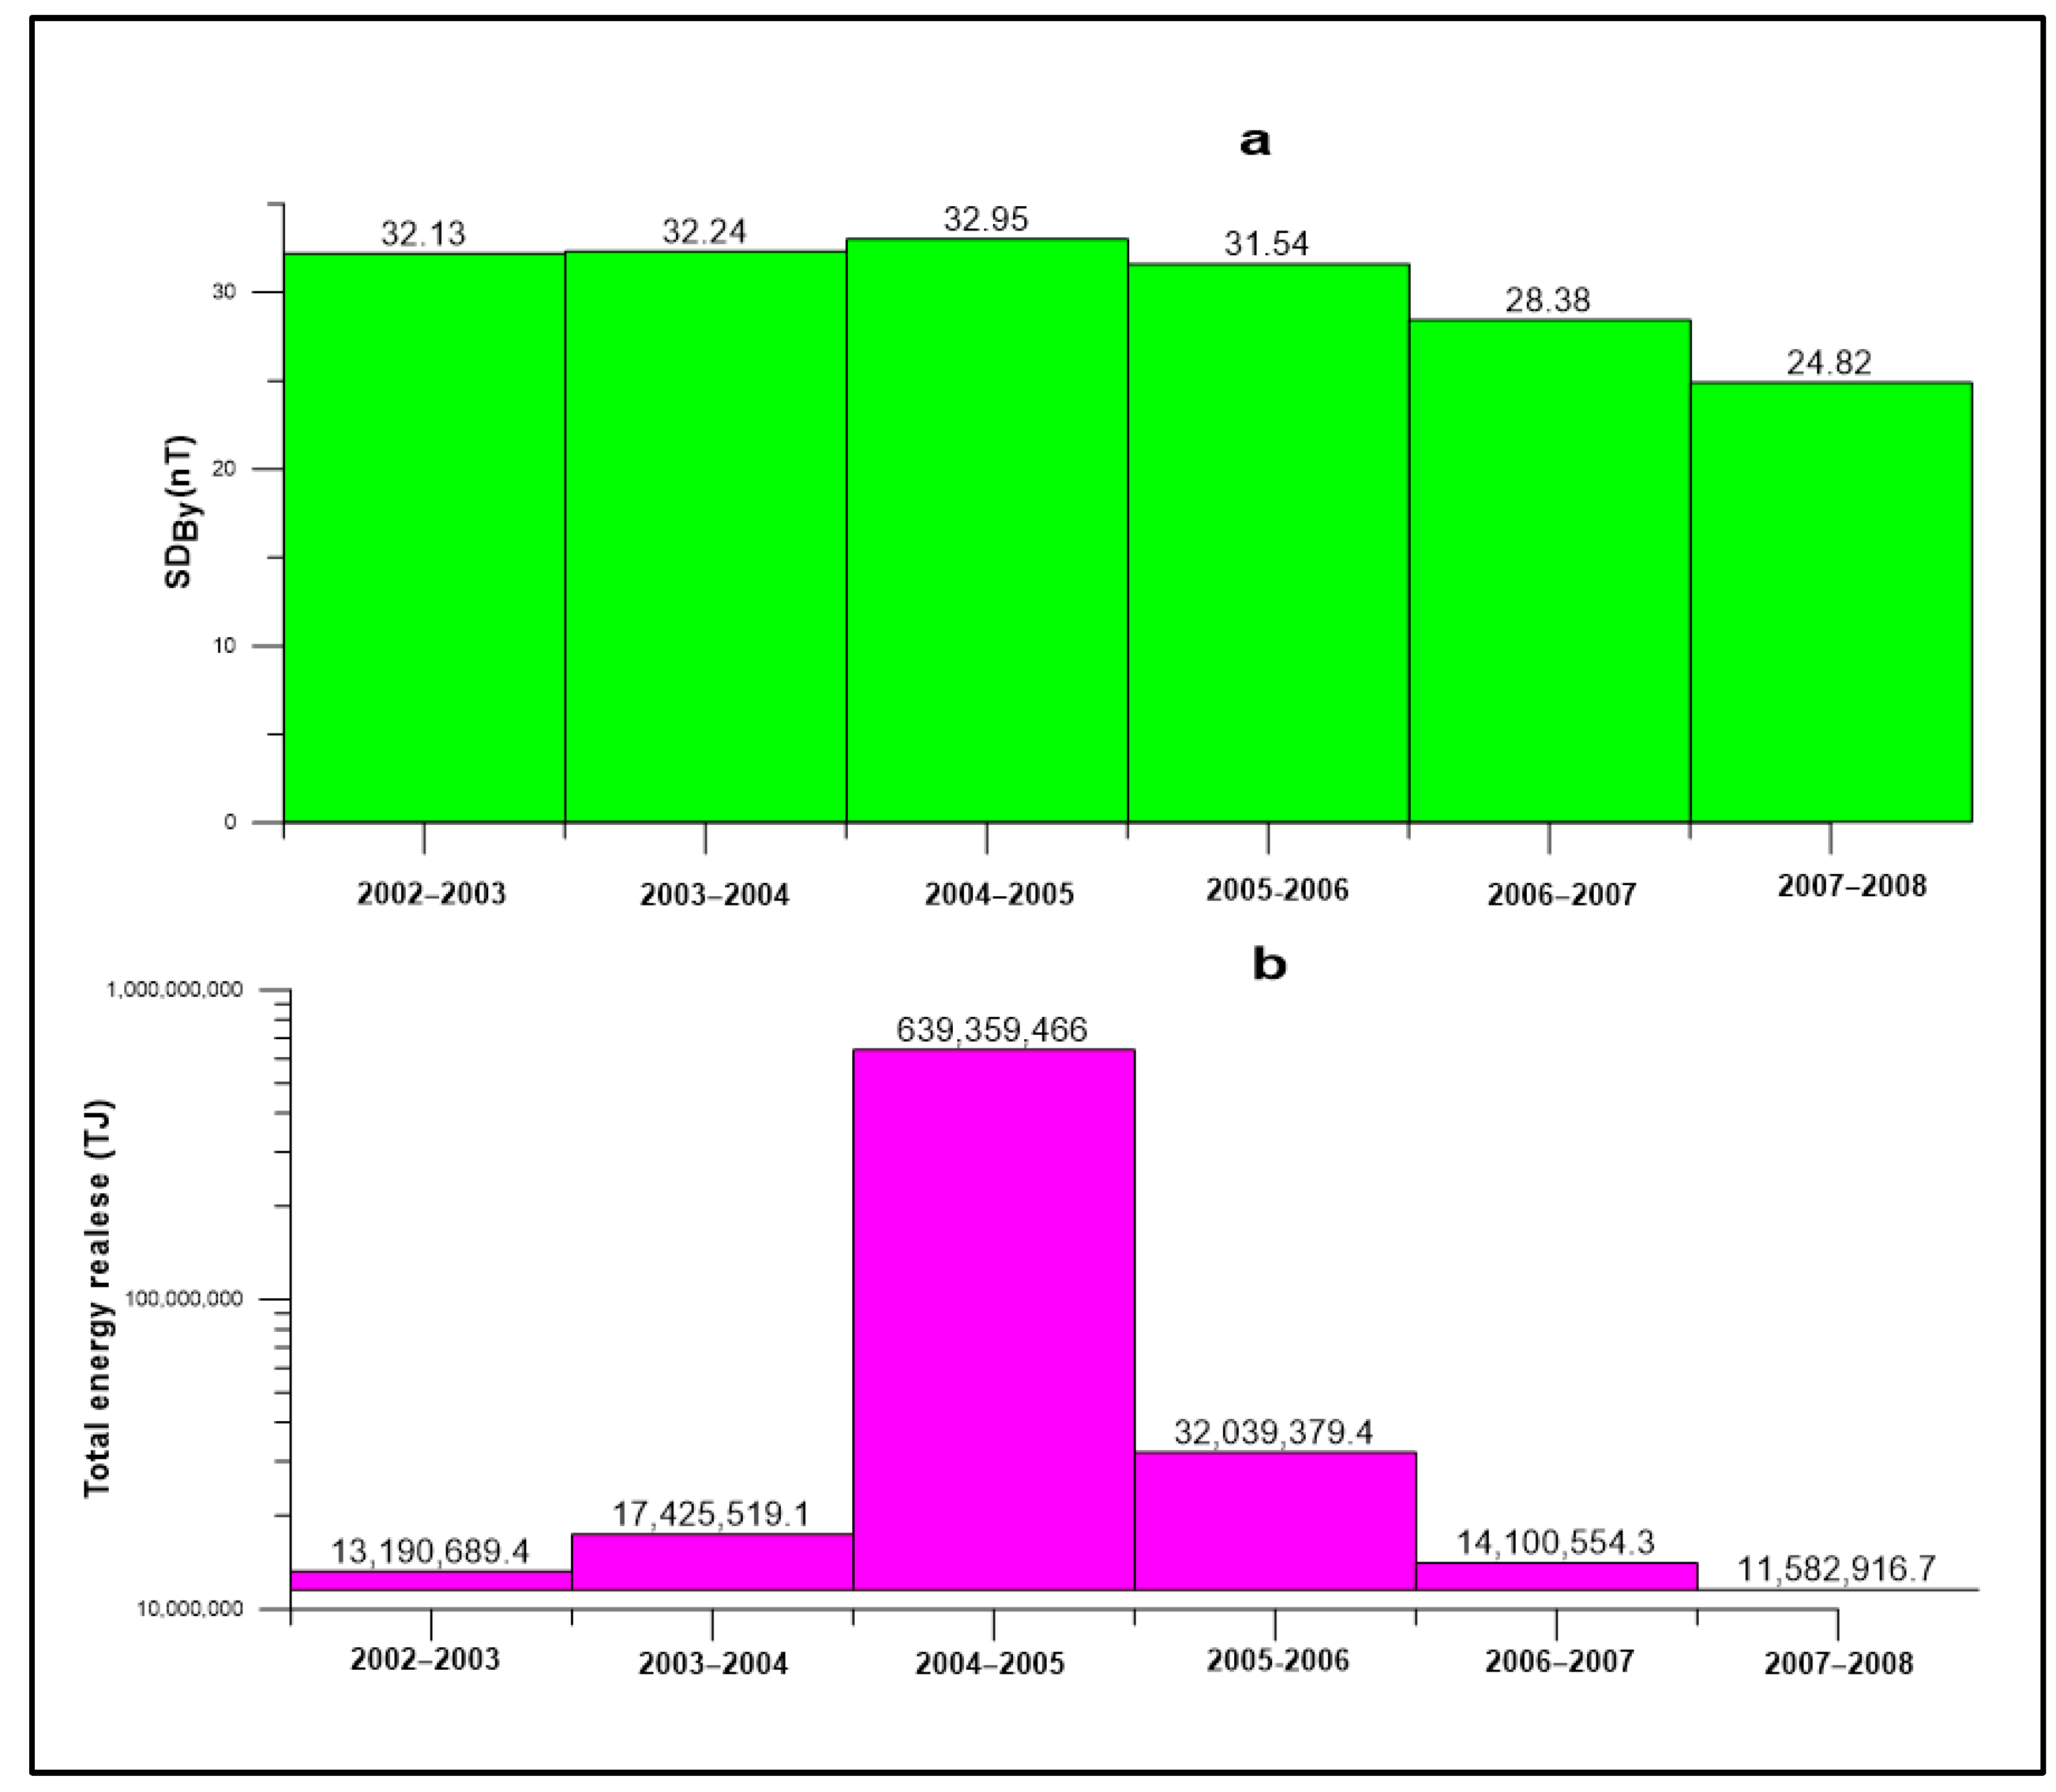
Figure 10, the increase in seismic energy released is followed by an increase in the standard deviation calculated for the B
y component of the magnetic field. The behavior of the local magnetic field highlighted by the standard deviation (SD
By) follows certain patterns that correlate with seismicity in this area. The calculation of the standard deviation for the B
y component of the magnetic field is useful in identifying these patterns as accurately as possible. To confirm these patterns, it is necessary to calculate the standard deviation for the period between 2008 and 2020 as well.
We observe that the lowest seismic energy released was recorded during the 2007–2008 anomaly. The variation on the By component is also the smallest and is highlighted by a standard deviation of 24.82 nT. The highest amount of seismic energy released was recorded in the period 2004–2005 when we had the highest calculated standard deviation (32.95 nT), but the proportionality between seismic energy release and the standard deviation (SDBy) is not respected.
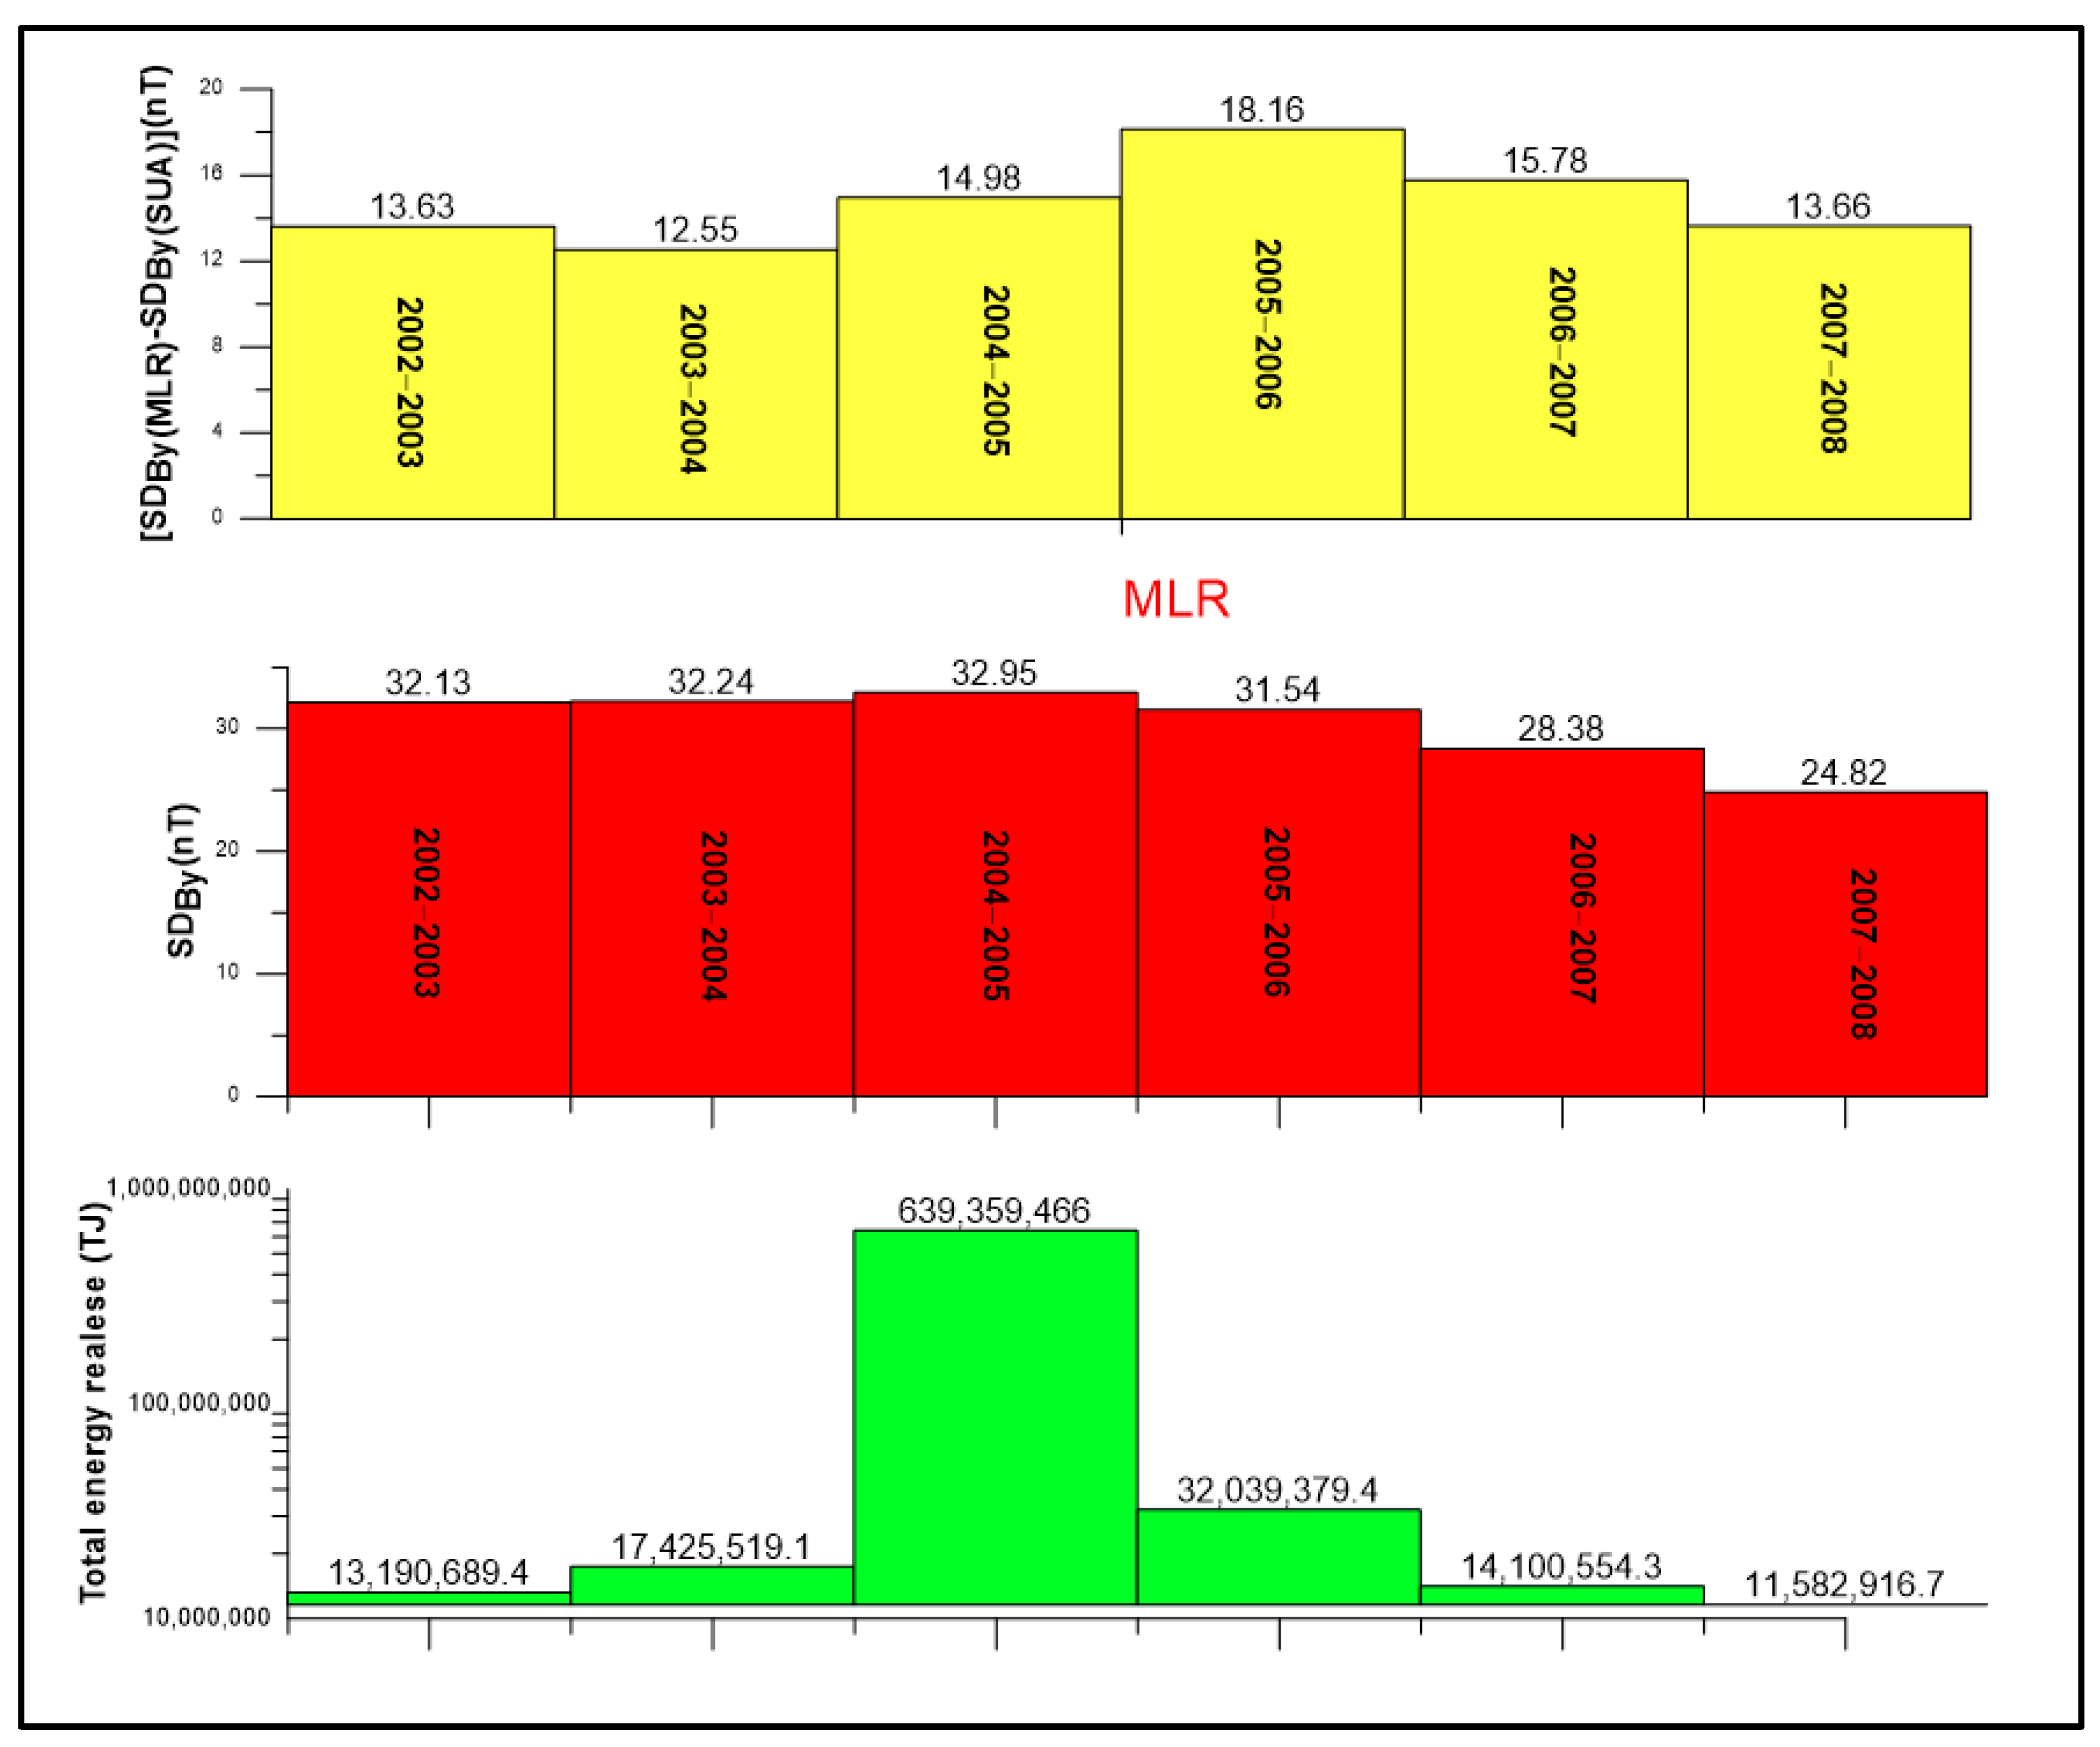
To accurately measure the effect of solar storm activity on standard deviation at the Muntele Rosu station, it is necessary to account for other factors that might also influence the measurement, such as seismotectonic variations, thermal drift, or instrument malfunction. If these other factors are not accounted for, the calculated standard deviation at the Muntele Rosu station (SD
By) may be larger than expected, which would make it difficult to compare to the standard deviation measured at the reference station (Surlari). To address this issue, we propose that one way to discriminate the effect of solar storm activity from other factors is to compare the difference between SD
By measured at Muntele Rosu and SD
By measured at Surlari. By subtracting the latter from the former, we can effectively isolate the contribution of solar storm activity to the standard deviation (
Figure 11).
After reducing the influence caused by solar–magnetospheric interaction, we observed an even weaker correlation with seismic energy. Looking at
Figure 11, we can observe that the highest value of standard deviation measured at the MLR (red graph) corresponds to the highest released seismic energy (green graph). However, when we discriminate between the influence caused by solar–magnetospheric interaction in the calculation of the standard deviation (yellow graph), we observe a one-year delay/shift. The main reason for this delay is due to the change in the reference station, which may have different values of standard deviation primarily because of its different geographic position. We made this substitution out of necessity, and clearly, the results would have been better if we had not needed to change the reference station. Using a different reference station helps us to spot anomalous variations measured on MLR, but in standard deviation calculations, it shows some limitations.
This long-term variation observed in MLR can be attributed to thermal processes that may occur at intermediate depths, causing certain ferromagnetic minerals to lose their magnetism when they reach the Curie temperature. This phenomenon has also been observed in laboratory settings [
28]. The pressure and temperature conditions required for such processes can easily be met in the presence of the subducted Vrancea lithospheric fragment. Minerals tend to maintain their magnetic stability at shallow depths in regions with high heat flow, while at greater depths in areas with low heat flow [
27]. The authors in [
27] proposed that certain magnetic anomalies may arise from partially serpentinized ultramafic bodies, which contain metal alloys as the source material for magnetism, exhibiting a Curie temperature ranging from 620 °C to 1100 °C. By utilizing P-wave tomography, the authors in [
29] developed a temperature model beneath the SE-Carpathians, identifying a hotter region west of the Vrancea slab starting at a depth of 75 km. Some authors have interpreted geomagnetic anomalies as a result of stress accumulation, which leads to an enhancement of the conductivity structure of the lithosphere [
30,
31]. Additionally, it must be noted that geomagnetic anomalies can be generated by anthropogenic activities or thermal variations that affect the instrument.
6. Conclusions
The main objective of this study was to investigate the link between the behavior of the geomagnetic field measured in a seismic area, and the seismic energy released. The study period included geomagnetic datasets from October 2002 to May 2008.
The variations of the horizontal component By exhibit a seasonal character, but the morphology of these variations differs from year to year. The anomalies recorded on the By component follow two distinct patterns: (a) anomalies where the variations on the By component agree with small decreases/increases observed over long periods, and (b) anomalies where By varies significantly over short periods, generating decreases/increases in steps. The seismic activity that accompanies these anomalies is significantly higher for the model of anomalies described in point (b).
To investigate whether similar variations are present in other components of the magnetic field, we calculated the ratios of Bx/Bz, By/Bx, and BH/By for all datasets in this study. The results of these ratios showed that the only component affected by variations in the By component is also observed in the plot between Bz and BH (Bx + By).
The size of the anomalies resulting from the standard deviation measured on the By component (SDBy) partially validates the relationship between the size of the anomalies and the seismic energy release during the anomaly. The relationship between the standard deviation measured on By and the released seismic energy is vaguely respected because the value of the standard deviation is also influenced by solar activity. Discriminating between these influences is negatively affected by the need to change the reference station. It should be noted that the backup reference station (THY) has different background magnetic field values. For future analyses, it is planned to calculate the standard deviation over a longer period to investigate whether the identified patterns persist over time.
