Article

Emission Ratios and Diurnal Variability of Volatile Organic Compounds and Influence of Industrial Emissions in Two Texas Cities

1
Department of Environmental Science, Baylor University, Waco, TX 76706, USA
2
Department of Earth and Atmospheric Sciences, University of Houston, Houston, TX 77204, USA
*
Author to whom correspondence should be addressed.
Atmosphere 2023, 14(6), 1006; https://doi.org/10.3390/atmos14061006
Submission received: 20 April 2023 / Revised: 31 May 2023 / Accepted: 6 June 2023 / Published: 10 June 2023
(This article belongs to the Section Air Quality)

Abstract

:
Changing urban emission landscapes and increasing population make it imperative to understand the driving forces for air quality in growing urban areas. Recent field studies in an industrial area in Houston and a semiurban area in San Antonio reveal unique emission signatures for these two growing Texas cities. A comparison of benzene, toluene, xylenes, isoprene, and methyl ethyl ketone (MEK) was conducted for these two Texas locations and previous studies in other megacities. It was found that San Antonio had similar emission ratios as these megacities for benzene, toluene, and xylenes (1.10, 4.57, and 3.60 pptv ppbv−1 of CO, respectively), likely indicating a similar traffic emission source. Isoprene and MEK were of biogenic origin in San Antonio. However, analysis of emission ratios, diurnal trends, and comparison with emission inventories indicated that benzene, toluene, and MEK were likely associated with fugitive and stack emissions in the industrial corridor in Houston. Isoprene in Houston appeared to have mixed fugitive and biogenic sources in Houston, based on diurnal trends and emission ratio. The peak nighttime concentrations for benzene, toluene, xylene, isoprene, and MEK observed during the campaign were 66, 533, 21, 138, and 731 ppbv, respectively, in the Houston site. The emission ratio for xylenes (3.37 pptv ppbv−1 of CO) for the Houston site was similar to Paris, London, and Mexico City, despite emission inventories indicating high fugitive and stack emissions. The conditional probability function (CPF) analysis closely matched the direction of the industrial sources with the highest recorded emission levels as listed in the emission inventory for the Houston site. The estimated ozone production efficiency (OPE) for the industrial area in Houston indicated volatile organic compound (VOC)–limited conditions in the morning, which transitioned to nitrogen oxide (NOx)–limited conditions in the afternoon. Texas cities have complex emission scenarios, and future efforts to mitigate ozone and particulate matter may have to consider a variety of emission reduction strategies.

Graphical Abstract

1. Introduction

The sources and emission ratios of aromatic hydrocarbons are relevant in urban areas to understand both direct human exposure and health effects as well as indirect impacts associated with the atmospheric production of ozone (O3) and secondary organic aerosol (SOA) [1,2,3,4,5,6]. Urban areas in Texas, such as San Antonio and Houston, are growing at a rapid rate. San Antonio witnessed a population increase of 16.7%, while Houston experienced a growth of 10.7% in the last decade [7]. Benzene, toluene, and xylenes (BTX) are commonly studied aromatic hydrocarbons in urban areas [8,9,10,11]. Depending on local anthropogenic activities, urban sources can include traffic emissions (e.g., gasoline- and diesel-powered motor vehicles) and industrial sources (e.g., fugitive and stack emissions). BTX in Texas cities have likely been impacted by increasing population and changes in local industry and vehicle emission technology [12]. The Texas Commission on Environmental Quality (TCEQ) has recently funded a series of urban field campaigns to evaluate O3 precursors, including volatile organic compounds (VOCs), such as BTX in Corpus Christi, San Antonio, and Houston, Texas [13,14,15]. However, each city will have its signature blend of emission sources and regional transport of pollutants. For example, Harris County (i.e., the Houston metropolitan area) includes petrochemical plants, refineries, chemical manufacturing, terminal and pipeline services for petrochemical transport, and wastewater treatment plants that can contribute fugitive and stack emissions to the baseline traffic emissions of BTX [16,17,18]. Some of these industrial sources can also emit VOCs such as isoprene and methyl ethyl ketone (MEK), which would commonly be considered biogenic VOCs [19,20,21,22]. Understanding the emissions and chemistry of these key pollutants is of high interest in growing urban centers in Texas, USA.
Recent studies have utilized ambient measurements and calculated ratios of anthropogenic VOCs and carbon monoxide (CO) to calculate emission ratios and to discuss potential sources and urban-scale chemistry [23,24,25,26,27,28,29]. Borbon et al. [23] and de Gouw et al. [24] reported emission ratios for urban locations in Los Angeles (LA) and Paris (2010 and 2009, respectively) with high contributions from traffic emissions evident at each of these megacity locations. Emission ratios can be used to compare fleet emissions across cities, while diurnal trends in select VOCs and comparisons with models and emission inventories can better constrain source contributions to traffic, industrial, and biogenic sources [30,31,32,33,34]. McDonald et al. [35] suggested that volatile chemical products (VCPs), including fugitive emissions, would become increasingly important in urban VOC balances, and this needs to be evaluated in Texas urban areas where O3 exceedances are emerging and ongoing issues [13].
The linear regression fit (LRF) method reported by Borbon et al. [23] is applied in the current manuscript to Texas datasets to calculate emission ratios of benzene, toluene, xylenes, isoprene, MEK, and select additional VOCs. The trace gas and VOC measurements from the TCEQ-funded San Antonio Field Study (SAFS) in May 2021 are used to estimate emission ratios for San Antonio, a rapidly growing city in Texas with a population of over 2.6 million and emerging air quality issues. SAFS 2021 is a follow-up field study to the SAFS 2017, which identified the importance of regional sources and mixed urban sources for VOCs in San Antonio in 2017 [14]. The Tracking Aerosol Convection Interactions ExpeRiment—Air Quality (TRACER-AQ), a multiagency field campaign (https://www-air.larc.nasa.gov/missions/tracer-aq/, accessed on 15 April 2023), was centered in Houston, Texas, in August–September 2021. TRACER-AQ1 was the TCEQ-funded field campaign that provided key trace gas and VOC measurements from September 2021 for the current manuscript. The Houston study site in the current project is located adjacent to the Houston Ship Channel (HSC), which is an industrial port area within the Houston metropolitan area that is both an international shipping hub and a center for petroleum refining in Houston. Thus, the two Texas cities represent two different types of urban emission scenarios.
The goal of the current manuscript is to use diurnal trends, emission ratios, and emission inventories to characterize sources of select VOCs in two Texas cities. BTX in San Antonio and Houston are compared with other urban locations worldwide (Los Angeles (LA), Paris, Moscow, Mexico City, São Paulo, London, and Ahmedabad) to evaluate potential differences in emission sources (e.g., traffic, fugitive, and stack emissions). By incorporating field measurements of VOCs and trace gases, a regression-based O3 production efficiency (OPE) [36,37,38] was calculated to characterize the O3 formation regime in the industrial site in Houston. The investigation of the O3 formation regime is important to determine the effectiveness of O3 control policies.

2. Materials and Methods

The flow diagram (Figure 1) presents the overall technique employed in this study, and the following sections provide a brief explanation of each component.

2.1. Texas Study Sites

The San Antonio measurements were collected at an urban location, Traveler’s World Recreational Vehicle (RV) Resort (TW; 29.374° N, 98.482° W), situated southeast of downtown San Antonio. This site was also used during SAFS 2017, and additional site information has been reported in previous manuscripts [14]. Several major interstate highways were near the TW site: I-37 at ~1.5 km to the east, I-35 at ~3 km to the west, and I-10 at ~2 km to the north. Major sources of VOCs at TW include traffic and biogenic emissions and aged air mass transported from further upwind locations [14]. The measurements were made during the San Antonio Field Study (SAFS) from 23 April through 19 May 2021. SAFS 2021 was a mobile and stationary field campaign, but this study focuses on stationary periods at TW only (2–13 May 2021).
The Houston measurements were collected at the San Jacinto Battleground State Historic Site (29.752° N, 95.091° W), which is situated on the Houston Ship Channel ~25 km east of downtown Houston. This site is surrounded by petroleum, refinery, chemical manufacturing, shipping, and rail terminals, and pipeline services for petrochemical transportation. Several major highways are near the San Jacinto site: I-10 at ~4 km to the north; Highways 225 and 8 at ~5 km to the south and west, respectively; and Highways 330 and 146 at ~6 km to the east. The measurements were made during the TRACER-AQ field study from 1 September through 30 September 2021. We will refer to this site as the Houston site hereafter in this manuscript. However, we acknowledge that San Jacinto is in the industrial region of the Houston metropolitan area, and this site may not represent emission conditions across the entire city.

2.2. Mobile Air Quality Laboratory (MAQL2)

The instrumentations were housed in a Baylor University/University of Houston/Rice University–operated mobile air quality lab (MAQL2) during both campaigns. MAQL2 is a 35 m3 insulated air-conditioned trailer with a ~10 m telescoping tower and inlet box that extends above the trailer during stationary measurements [15]. A heated sampling line set at 70 °C (Atmo-Seal Engineering Inc., Troy, MI, USA) was used for VOC measurements.

2.3. Instrumentation

A quadrupole proton transfer reaction–mass spectrometer (PTR-MS Q300; Ionicon Analytik, Innsbruck, Austria) was used to measure select VOCs. Details of the PTR-MS and its operation are discussed elsewhere [39,40]. Briefly, target gas molecules are ionized by proton transfer from protonated water (H3O+), and the ionized material is then detected and quantified using a quadrupole mass spectrometer. The ambient air is continuously drawn through a perfluoroalkoxy (PFA) Teflon-lined manifold at a flow rate of 8 lpm from which a subsample of 100 sccm is drawn by the PTR-MS. A sample drying system similar to that used by Jobson and McCoskey [41] was implemented to reduce any effects of water vapor that can occur while operating the drift tube of the PTR-MS at a lower E/N (i.e., 100 Td). Data were collected with approximately 30 s scan times, but these data were averaged to longer time scales, typically 2 min, in order to match the final averaged data from other instruments and to improve detection limits. Single-point calibrations and zeros were run daily. Additionally, several multipoint calibrations were performed during the campaign as well as pre- and post-campaign. Zero air was generated by passing laboratory air through a heated catalyst (alumina on palladium at 350 °C). The PTR-MS measurements reported in this study are obtained from the measured sensitivity using the daily calibration of the individual masses against the known concentration of the calibration mixture of VOCs. Greater details on the PTR-MS operation, calibration, and data curation are presented in our previous publication [14]. CO was measured using off-axis integrated cavity output spectroscopy (Los Gatos Research, Inc., Mountain View, CA, USA, Li-7000). O3 was measured using a 2B Technologies Model 205 dual beam ultraviolet photometric gas analyzer. The nitric oxide (NO), nitrogen dioxide (NO2), and oxides of nitrogen (NOx = NO + NO2) measurements were made with a Thermo Scientific Model 42C chemiluminescence analyzer (Thermo Scientific, Waltham, MA, USA). Total reactive nitrogen (NOy) measurements were conducted using a modified Thermo Scientific Model 42C chemiluminescence analyzer with a 300 °C molybdenum converter at the sample inlet. Greater details about these measurements are presented in our previous publications [13,14,15]. The Baylor PTR-MS is operated in select ion mode; the PTR-MS data reported in this study are only for a select list of VOCs: isoprene (m/z 69), methyl vinyl ketone (m/z 73), benzene (m/z 79), toluene (m/z 93), and xylenes (m/z 107), measured in the H3O+ mode.

2.4. Emission Ratio Using Linear Regression Fitting (LRF) Method

The air mass in urban areas typically constitutes combined emissions from nearby sources and those transported from distant locations. Hydrocarbons may undergo a chemical transformation or removal between the time of their emission and the sampling. In order to distinguish between the contributions of emissions and chemical transformations, various strategies have been employed. One approach involves utilizing measurements conducted during the morning period, as it is assumed that emissions from morning rush-hour traffic dominate at that time and chemical reactions are relatively inefficient [42]. Alternatively, nighttime measurements have been utilized to infer the composition of emissions due to the stability of the atmospheric boundary layer and the prevalence of local sources during that period [23]. In addition, hydrocarbon ratios have been employed by some researchers to estimate the exposure of sampled air masses to hydroxyl (OH) radicals [34,43].
In this study, the nighttime linear regression fit (LRF) emission ratio was used for deriving the VOC-to-CO emission ratio, assuming that the effect of photochemistry or nighttime removal of BTX by OH is insignificant [23,34,44]. This method has been widely employed in studies conducted worldwide [23,26,27,28,29] and can provide valuable insights into the variability of VOC emissions from combustion sources, including on-road vehicles, gasoline evaporation, and oil and gas operations. However, it is important to acknowledge the limitations of the LRF method. For several highly reactive alkenes, the nighttime removal by O3 and nitrate (NO3) radicals is significant, which can lead to the underestimation of emission ratios based on this method [24]. Hence, in order to estimate anthropogenic hydrocarbon emissions based on ambient measurements, it becomes necessary to account for the chemical elimination or loss of reactive compounds. However, such an issue is less of a concern for aromatic VOCs. In the LRF method, the coefficient of determination (r2) serves as an indicator of the goodness of fit. As the r2 value decreases, the uncertainty associated with the LRF is anticipated to increase [23].

2.5. Emission Inventory

Point source emissions were taken from the speciated emissions inventory prepared by the Texas Commission on Environmental Quality (TCEQ) (obtained from personal contact). The inventory includes the description, location, and emission rates of different VOCs in tons per year from all the individual production units in Harris County (including the Houston Ship Channel area) and Bexar County (San Antonio).
On-road emission inventory for Harris and Bexar counties was obtained from the TCEQ website (https://www.tceq.texas.gov) [45]. This on-road mobile source portion of the 2020 periodic emissions inventory report was prepared by the Texas A&M Transportation Institute (TTI) for the State of Texas as a requirement under the Air Emissions Reporting Requirements (AERR) to support the EPA’s comprehensive 3-year cycle National Emissions Inventory (NEI). This emission inventory report consists of the annual on-road VOC emissions in tons per year for all counties in Texas.
In this study, the point source and on-road emission inventories in Bexar and Harris counties were used to understand the extent of fugitive and stack emissions and total on-road mobile VOC emissions’ influence in each site. However, the correlation between concentration at receptor points and the emission inventory cannot be directly established without taking into account meteorological conditions and dispersion effects.

2.6. Conditional Probability Function (CPF)

The CPF approach is a receptor modeling method used to identify and characterize emission sources. CPF is a widely used tool to identify the physical location of emission sources. It uses surface wind speed and direction and a time series of ambient data [46,47]. Briefly, CPF is calculated as the ratio of the fraction of samples in a specific wind sector (Δθ) that have higher source contribution ( m Δ θ ) than a user-defined threshold criterion to the total number of observations in the same wind sector ( n Δ θ ). The criterion value is generally set as the 75th percentile of the observation data and the specific wind sector as 22.5°. In this study, we chose the higher end of m Δ θ (i.e., 95th percentile) in order to avoid lower concentrations of VOCs while finding the direction of the source.
CPF = m Δ θ n Δ θ

2.7. O3 Production Efficiency (OPE)

The OPE is a parameter calculated as the slope of Ox (O3 + NO2 versus NOz), and it serves as one of the several ways to determine O3 generation as a function of NOx elimination from the system [48,49]. The OPE is a useful diagnostic tool to identify VOC-limited or NOx-limited O3 formation regimes [50]. An OPE value less than 7 indicates VOC-limited O3 production, while an OPE greater than 7 indicates NOx-limited O3 formation chemistry [36,37,38]. The OPE during the morning period (6:00 to 10:00 CDT) and that during the daytime period (10:00 to 15:00) were derived separately.
It is important to note that this regression-based OPE calculation has a few limitations, as it does not account for background O3 levels, boundary layer mixing, loss of nitric acid (HNO3) through dry deposition, and gas-to-particle conversion and regeneration of NO2 from peroxyacetyl nitrate (PAN) [50]. Nevertheless, despite these limitations, the OPE calculation has been widely used in field experiments to determine the upper bound for OPE calculations [14,36,37,38,50]. Although the OPE was successfully calculated for Houston in the current study, we were not able to calculate the OPE by this method for San Antonio as it requires NOx and NOz (NOy − NOx) to be greater than one. With the low concentrations at times in San Antonio, we were not able to always satisfy these conditions.

3. Results and Discussion

3.1. Daily Trends in BTX and Select VOC

The Texas field experiments in San Antonio (SAFS 2021) and Houston (TRACER-AQ) each had a wide suite of instrumentation operated by these authors to measure VOCs, trace gas, aerosol composition, optical properties, and meteorological parameters. Detailed discussions of O3 and aerosol chemistry and additional VOCs will be included in future manuscripts. Benzene, toluene, xylenes, isoprene, and MEK will be specifically discussed here to highlight differences in the influence of traffic emissions and other anthropogenic sources on VOCs in two growing Texas cities.
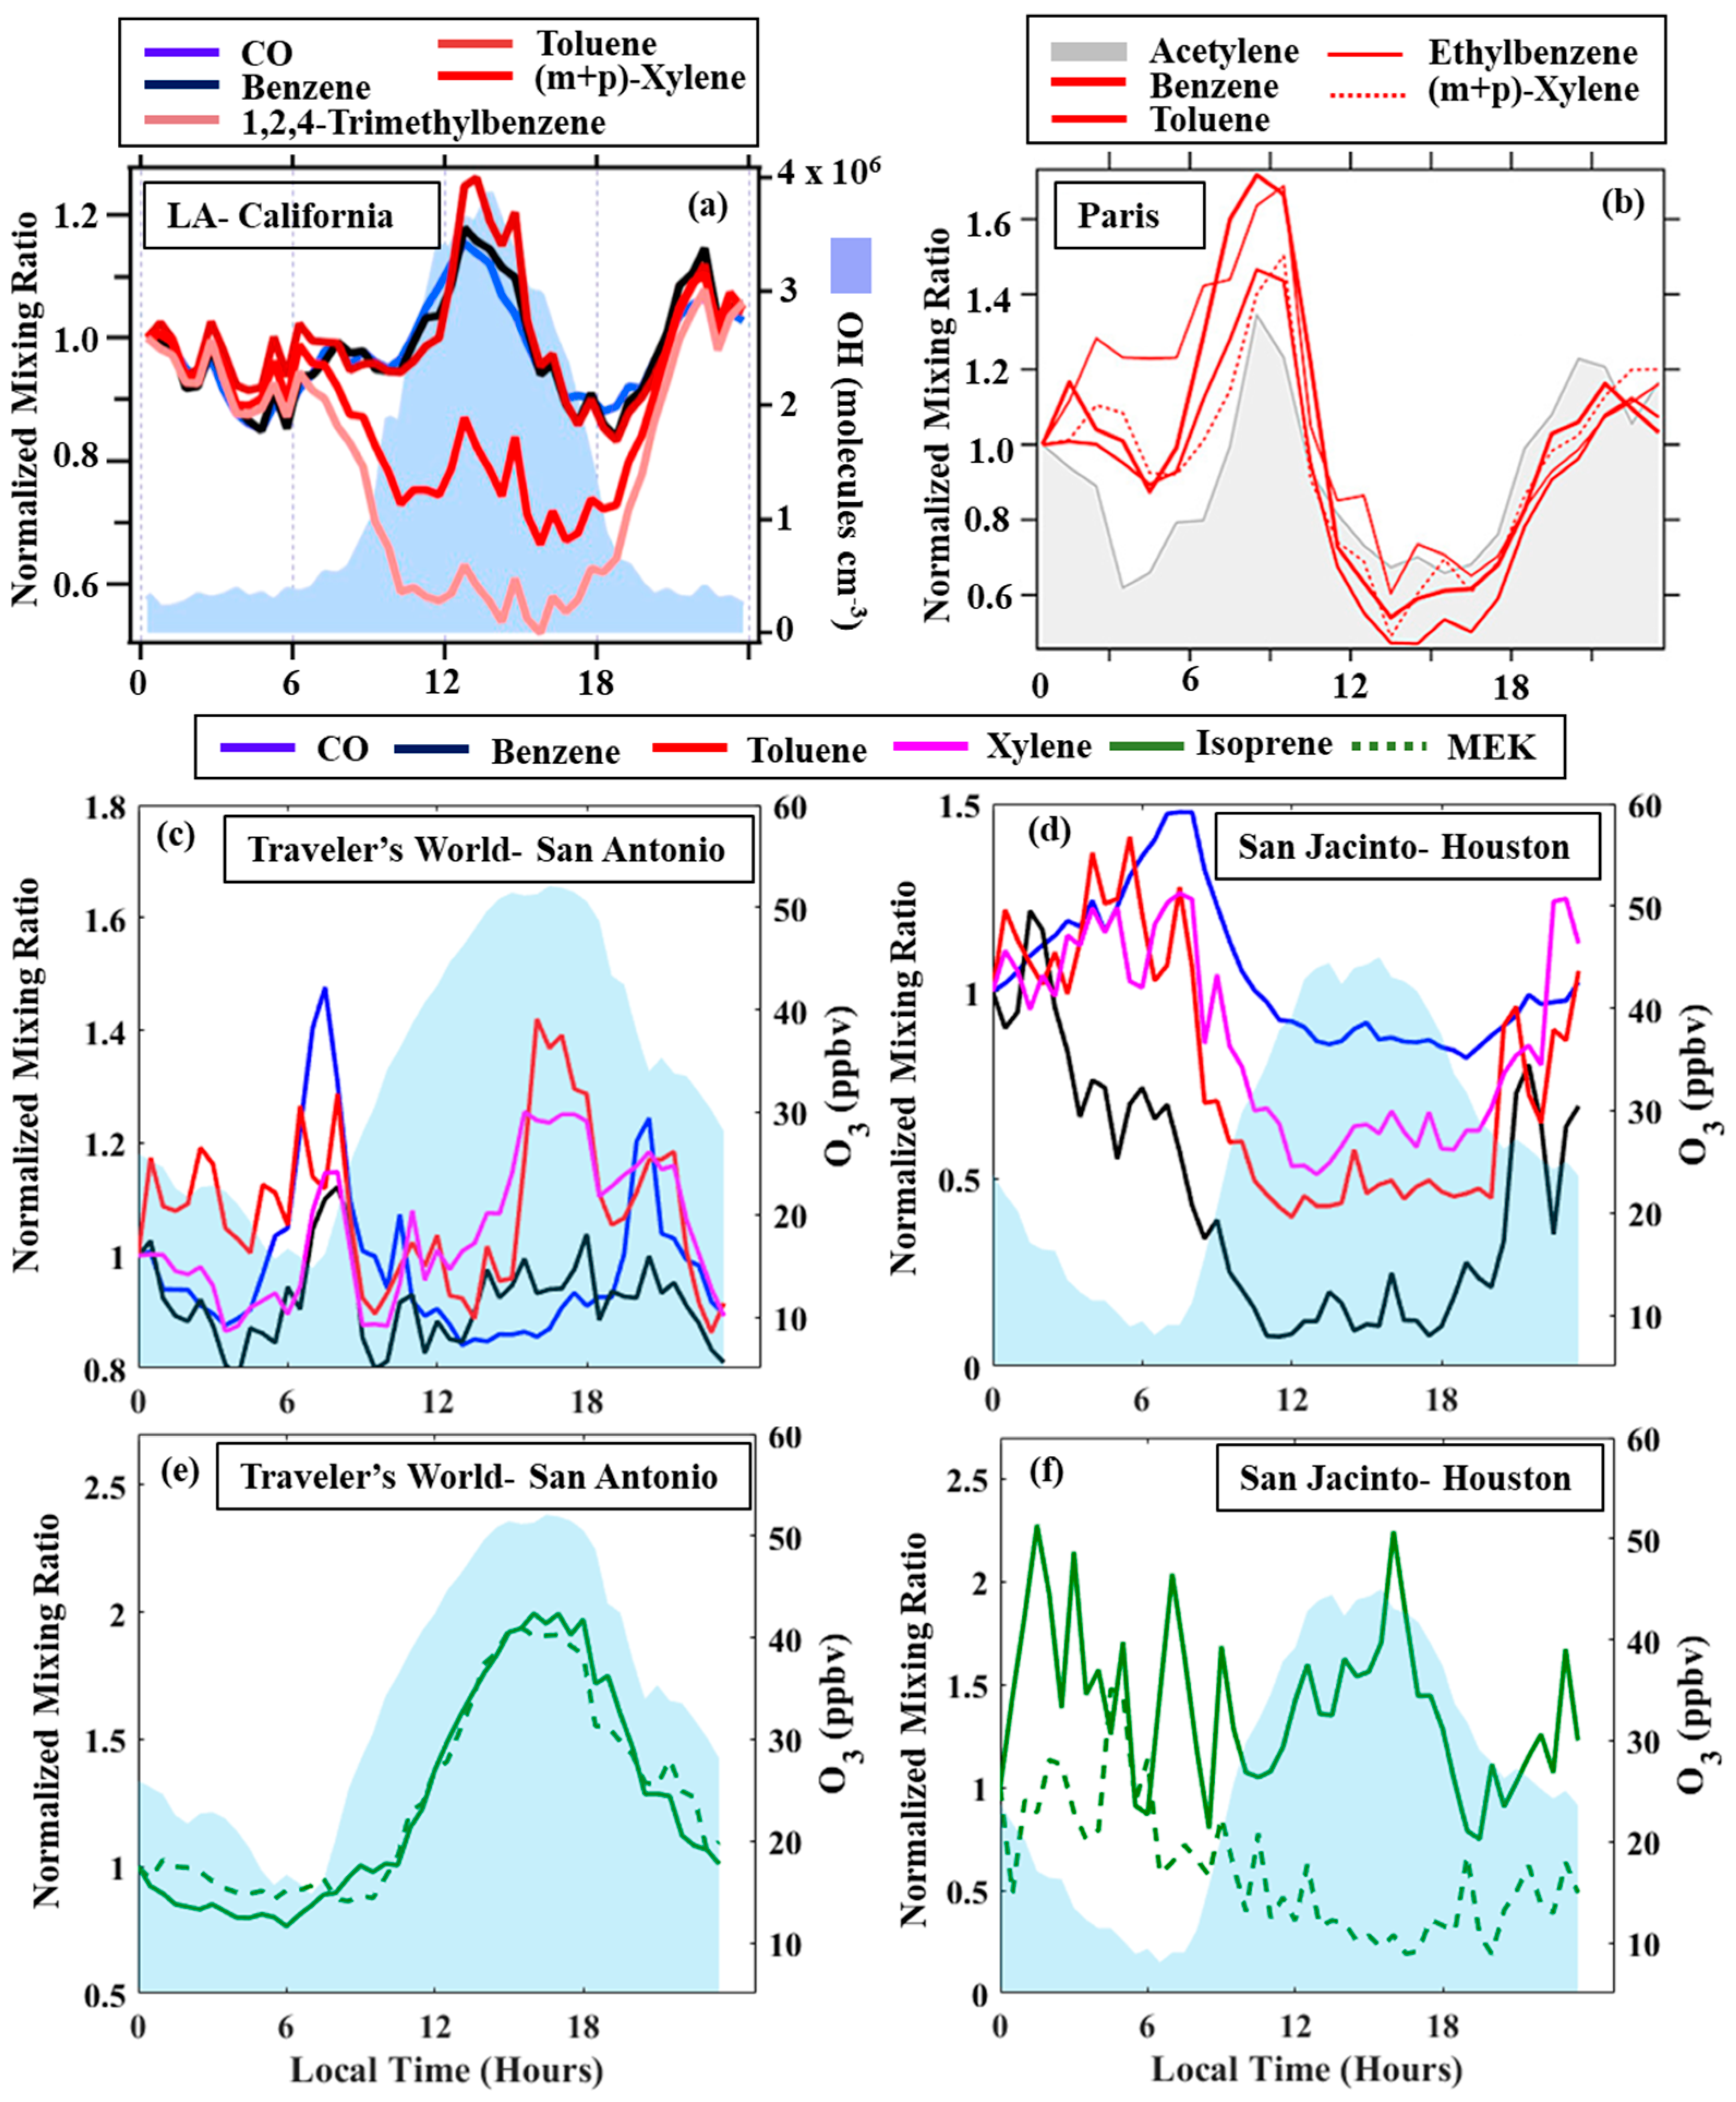
The daily trends in BTX and select VOC concentrations, normalized to one at midnight, allow intercomparison between the two Texas cities and previously reported measurements in LA and Paris [23,24]. As mentioned previously, each city has its unique mixture of sources and meteorology; however, these plots can enable the assessment of similarities in the influence of traffic emissions, transport, and photochemical aging on these compounds. In Figure 2a,b, previously published figures for LA and Paris reveal two different diurnal profiles, both highlighting the ongoing importance of motor vehicle emissions to these two cities [23,24]. For the San Antonio and Houston plots (Figure 2c–f), O3 is included in the background as a proxy for diurnal trends in photochemical activity as OH radical measurements are not available. The diurnal normalized mixing ratio in San Antonio reveals a morning rush-hour peak in both CO and benzene, while there is limited hourly variability for toluene and xylene (Figure 2c). CO and benzene most closely emulate the Paris diurnal trends, with a small decrease during the daytime. As in Paris, this likely indicates the influence of traffic emissions on both CO and benzene at this site. The rise in O3 in the background directly mirrors the sudden drop in BTX and CO; this inflection is likely an indication of the initial mixing and chemistry of the morning primary emissions. The morning rush-hour peak in San Antonio is also narrower than that in Paris, and early in the day, centered at 7:00 a.m.
For the Houston site, CO has a similar early-morning peak as Paris and San Antonio, while the diurnal trends for BTX are very different from the other cities (Figure 2d). The midnight normalization highlights the hours of peak emissions. As mentioned previously, the Houston site is located near the Houston Ship Channel, with local industrial, shipping, and traffic emissions to consider. Benzene has a unique profile with peak concentration overnight, no discernable rush-hour signal, and very low normalized concentration during the midday; this midday low is likely neither associated with oxidation nor solely related to an increase in mixing height as CO does not demonstrate the same magnitude of decrease. Xylene and toluene lie between the CO and benzene diurnal profiles, with a marginal enhancement in the morning and lower magnitude depression during the midday.
To highlight the differences between the urban site in San Antonio and the metro-industrial nature of the Houston site, we also assessed the diurnal variability of isoprene and MEK, an isoprene oxidation product. Figure 2e–f represents two very different emission/production scenarios for these compounds. In San Antonio, these two compounds clearly demonstrate the expected smooth daytime profiles, which parallel the O3 daily curve; isoprene represents daytime biogenic emission, while MEK represents expected daytime production via photo-oxidation. In contrast, there is no smooth isoprene curve in Houston. The average measurements reveal an initial nighttime peak and then a second, smaller daytime peak, but it seems that the Houston isoprene is impacted by intermittent plumes (Figure 2f). The MEK profile is inconsistent with daytime photochemical production as it has a late-night/early-morning peak and a midday depression that most parallel the benzene in Houston. It is clear at this industrial site in Houston that anthropogenic sources likely contribute to these VOCs, which are commonly assumed to have biogenic origins. These results highlight the need to consider the impact of nontraffic, anthropogenic VOC sources in urban environments when assessing the urban O3 and SOA precursors, as discussed by McDonald et al. [35].

3.2. Determination of VOC Emission Ratios

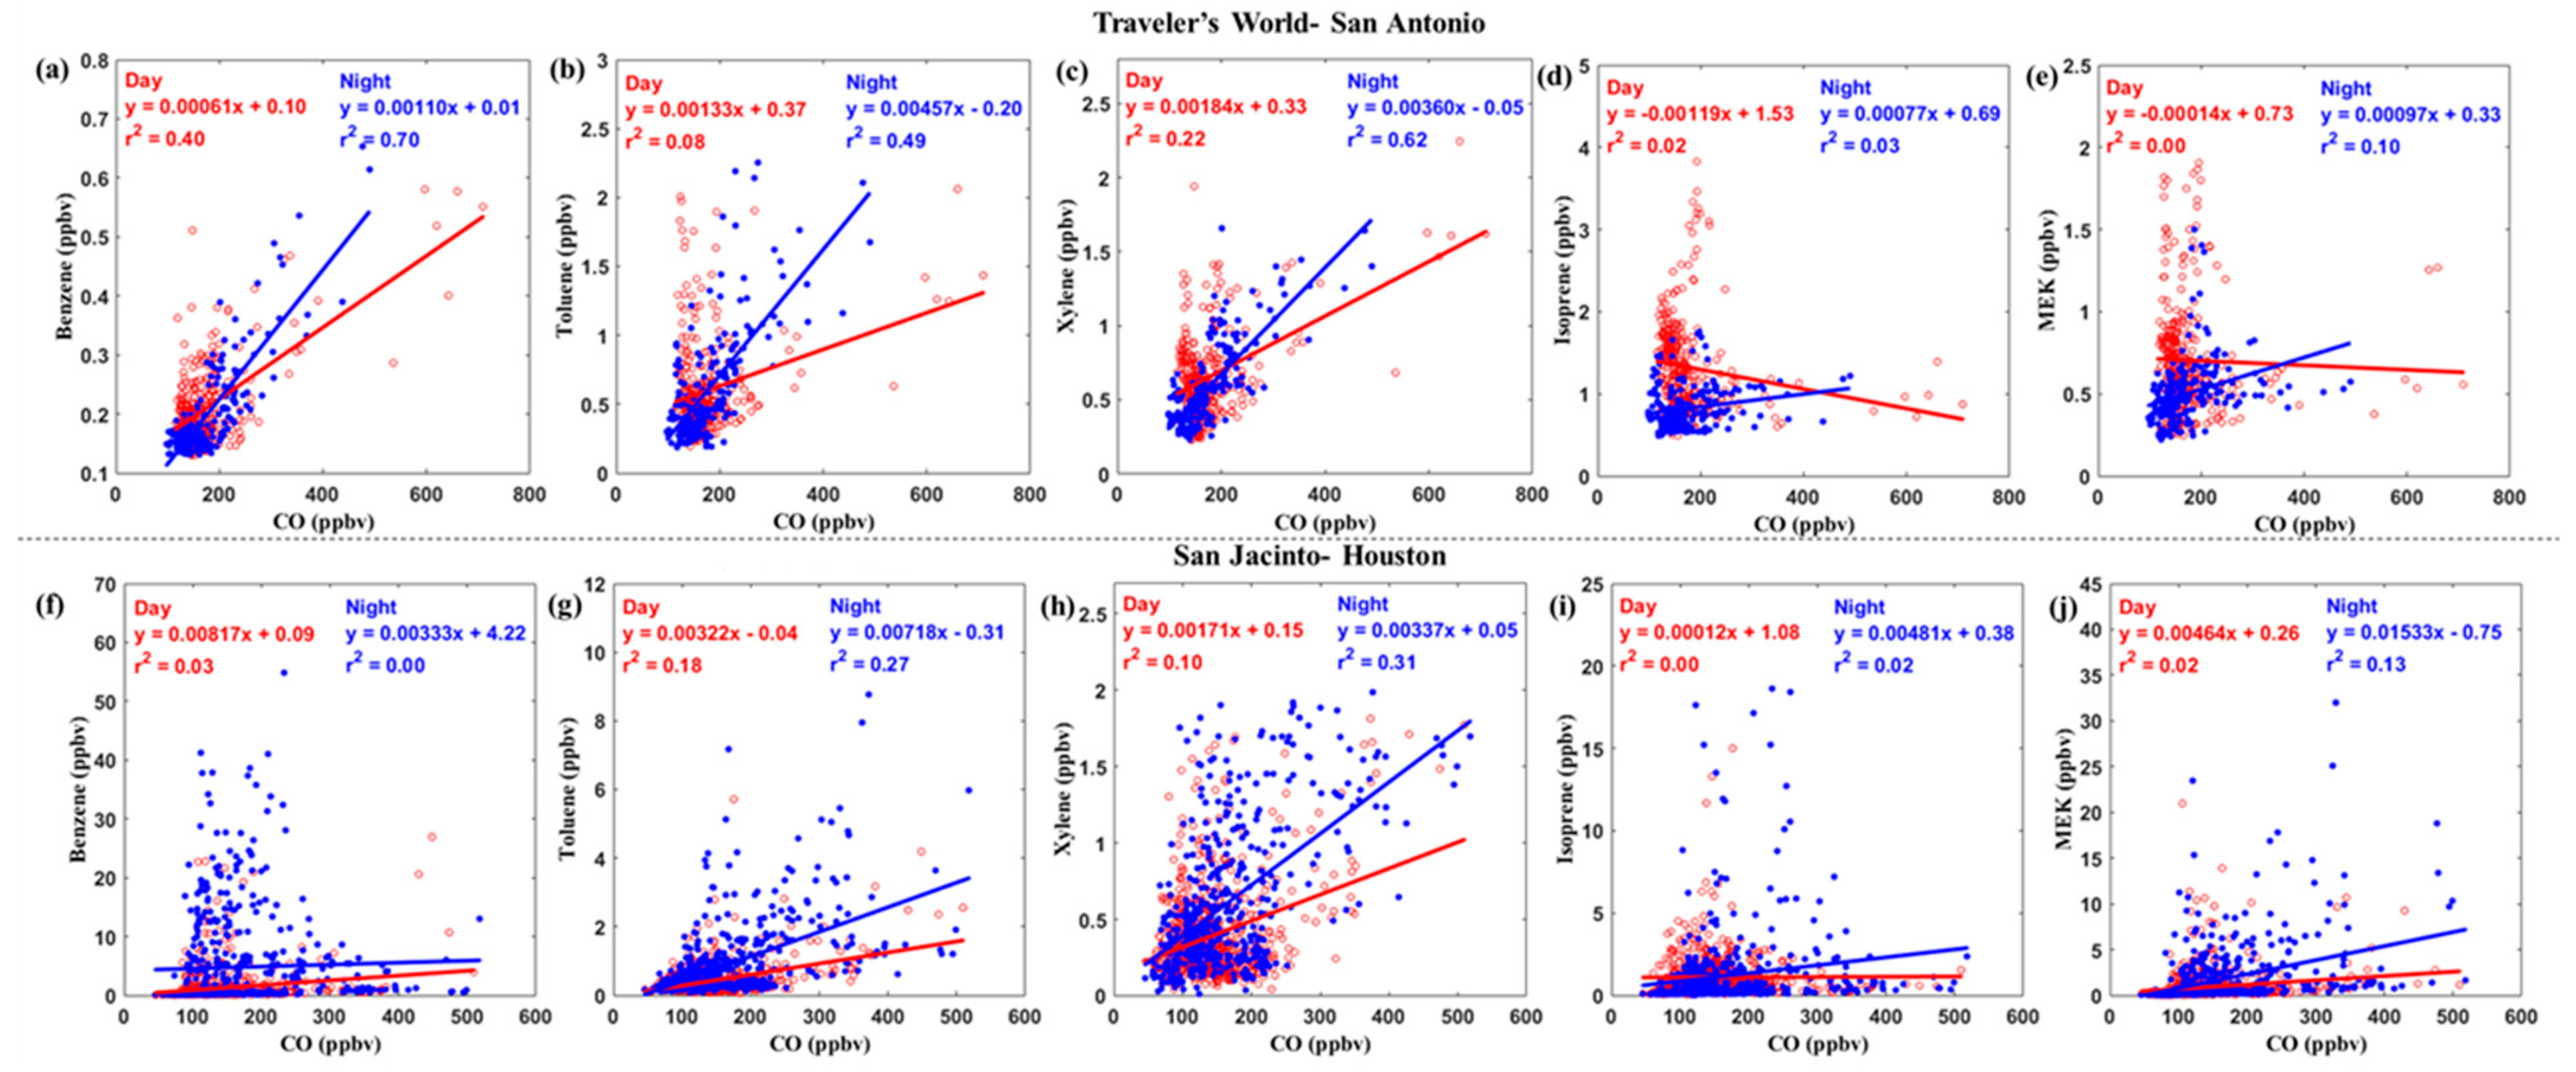
For the current study, emission ratios were calculated using the LRF model, which uses the nighttime correlations between BTX and CO to estimate emission ratios [23]. It is assumed for this model that both BTX and CO are dominated by traffic emissions and that the nighttime correlation is less impacted by photo-oxidation. An indication of the efficacy of the LRF model is the nighttime coefficient of determination (r2). For San Antonio, the r2 for BTX are all significantly higher at night, with a better correlation for benzene and xylene than toluene (Figure 3). As benzene has a longer lifetime, it is not surprising that it has a reasonable correlation with CO even during the daytime.
Houston again demonstrates very different results with no correlation between benzene and CO during either the day or at night (Figure 3f). Since the CO is similar between Houston and San Antonio, we could consider peak concentrations to be an indication of whether non-combustion sources are impacting the Houston site. In this plot of 30 min mixing ratios, benzene has peak concentrations greater than 40 ppbv, compared with ~0.6 ppbv in San Antonio. These peak mixing ratios are primarily in the nighttime data and likely indicate non-combustion sources. The range in concentration is very similar between the two Texas sites for xylenes, and the nighttime correlation is weak but present in Houston. This may indicate fewer nontraffic sources impacting xylenes at the Houston site. For toluene, the peak mixing ratios are still significantly higher in Houston than in San Antonio, and the r2 indicates only a weak correlation.
The emission ratios (ERs) of BTX in the two Texas cities are calculated here using the LRF method (Table 1). We compared these results with the ERs reported for other urban locations—LA, Paris, Moscow, Mexico City, São Paulo, London, and Ahmedabad—using the same method [23]. Both the ER, or slope value, and the r2 are relevant for this comparison as the r2 gives confidence in the ER. The ER for benzene is very similar for San Antonio and other megacities listed in Table 1, which strongly suggests a common traffic source. Houston has a very different ER, but as the r2 was very low, there is very little confidence in this value. Toluene is similar for San Antonio to LA, Mexico City, São Paulo, London, and Ahmedabad, but the ERs for both Paris and Houston are significantly higher. In contrast, the ERs for xylenes are most similar for San Antonio, Houston, Paris, Mexico City, and London with LA, São Paulo, and Moscow being lower likely due to the transported nature of the traffic emissions at that site. These results confirm the previous discussion that BTX are dominated by traffic in San Antonio, confirmed by the similar ER, while only xylenes in Houston reflect a traffic source. The ERs of isoprene and MEK for the Houston site are significantly higher than those for other megacities listed in Table 1, likely indicating higher anthropogenic sources of these VOCs at this metro-industrial site.
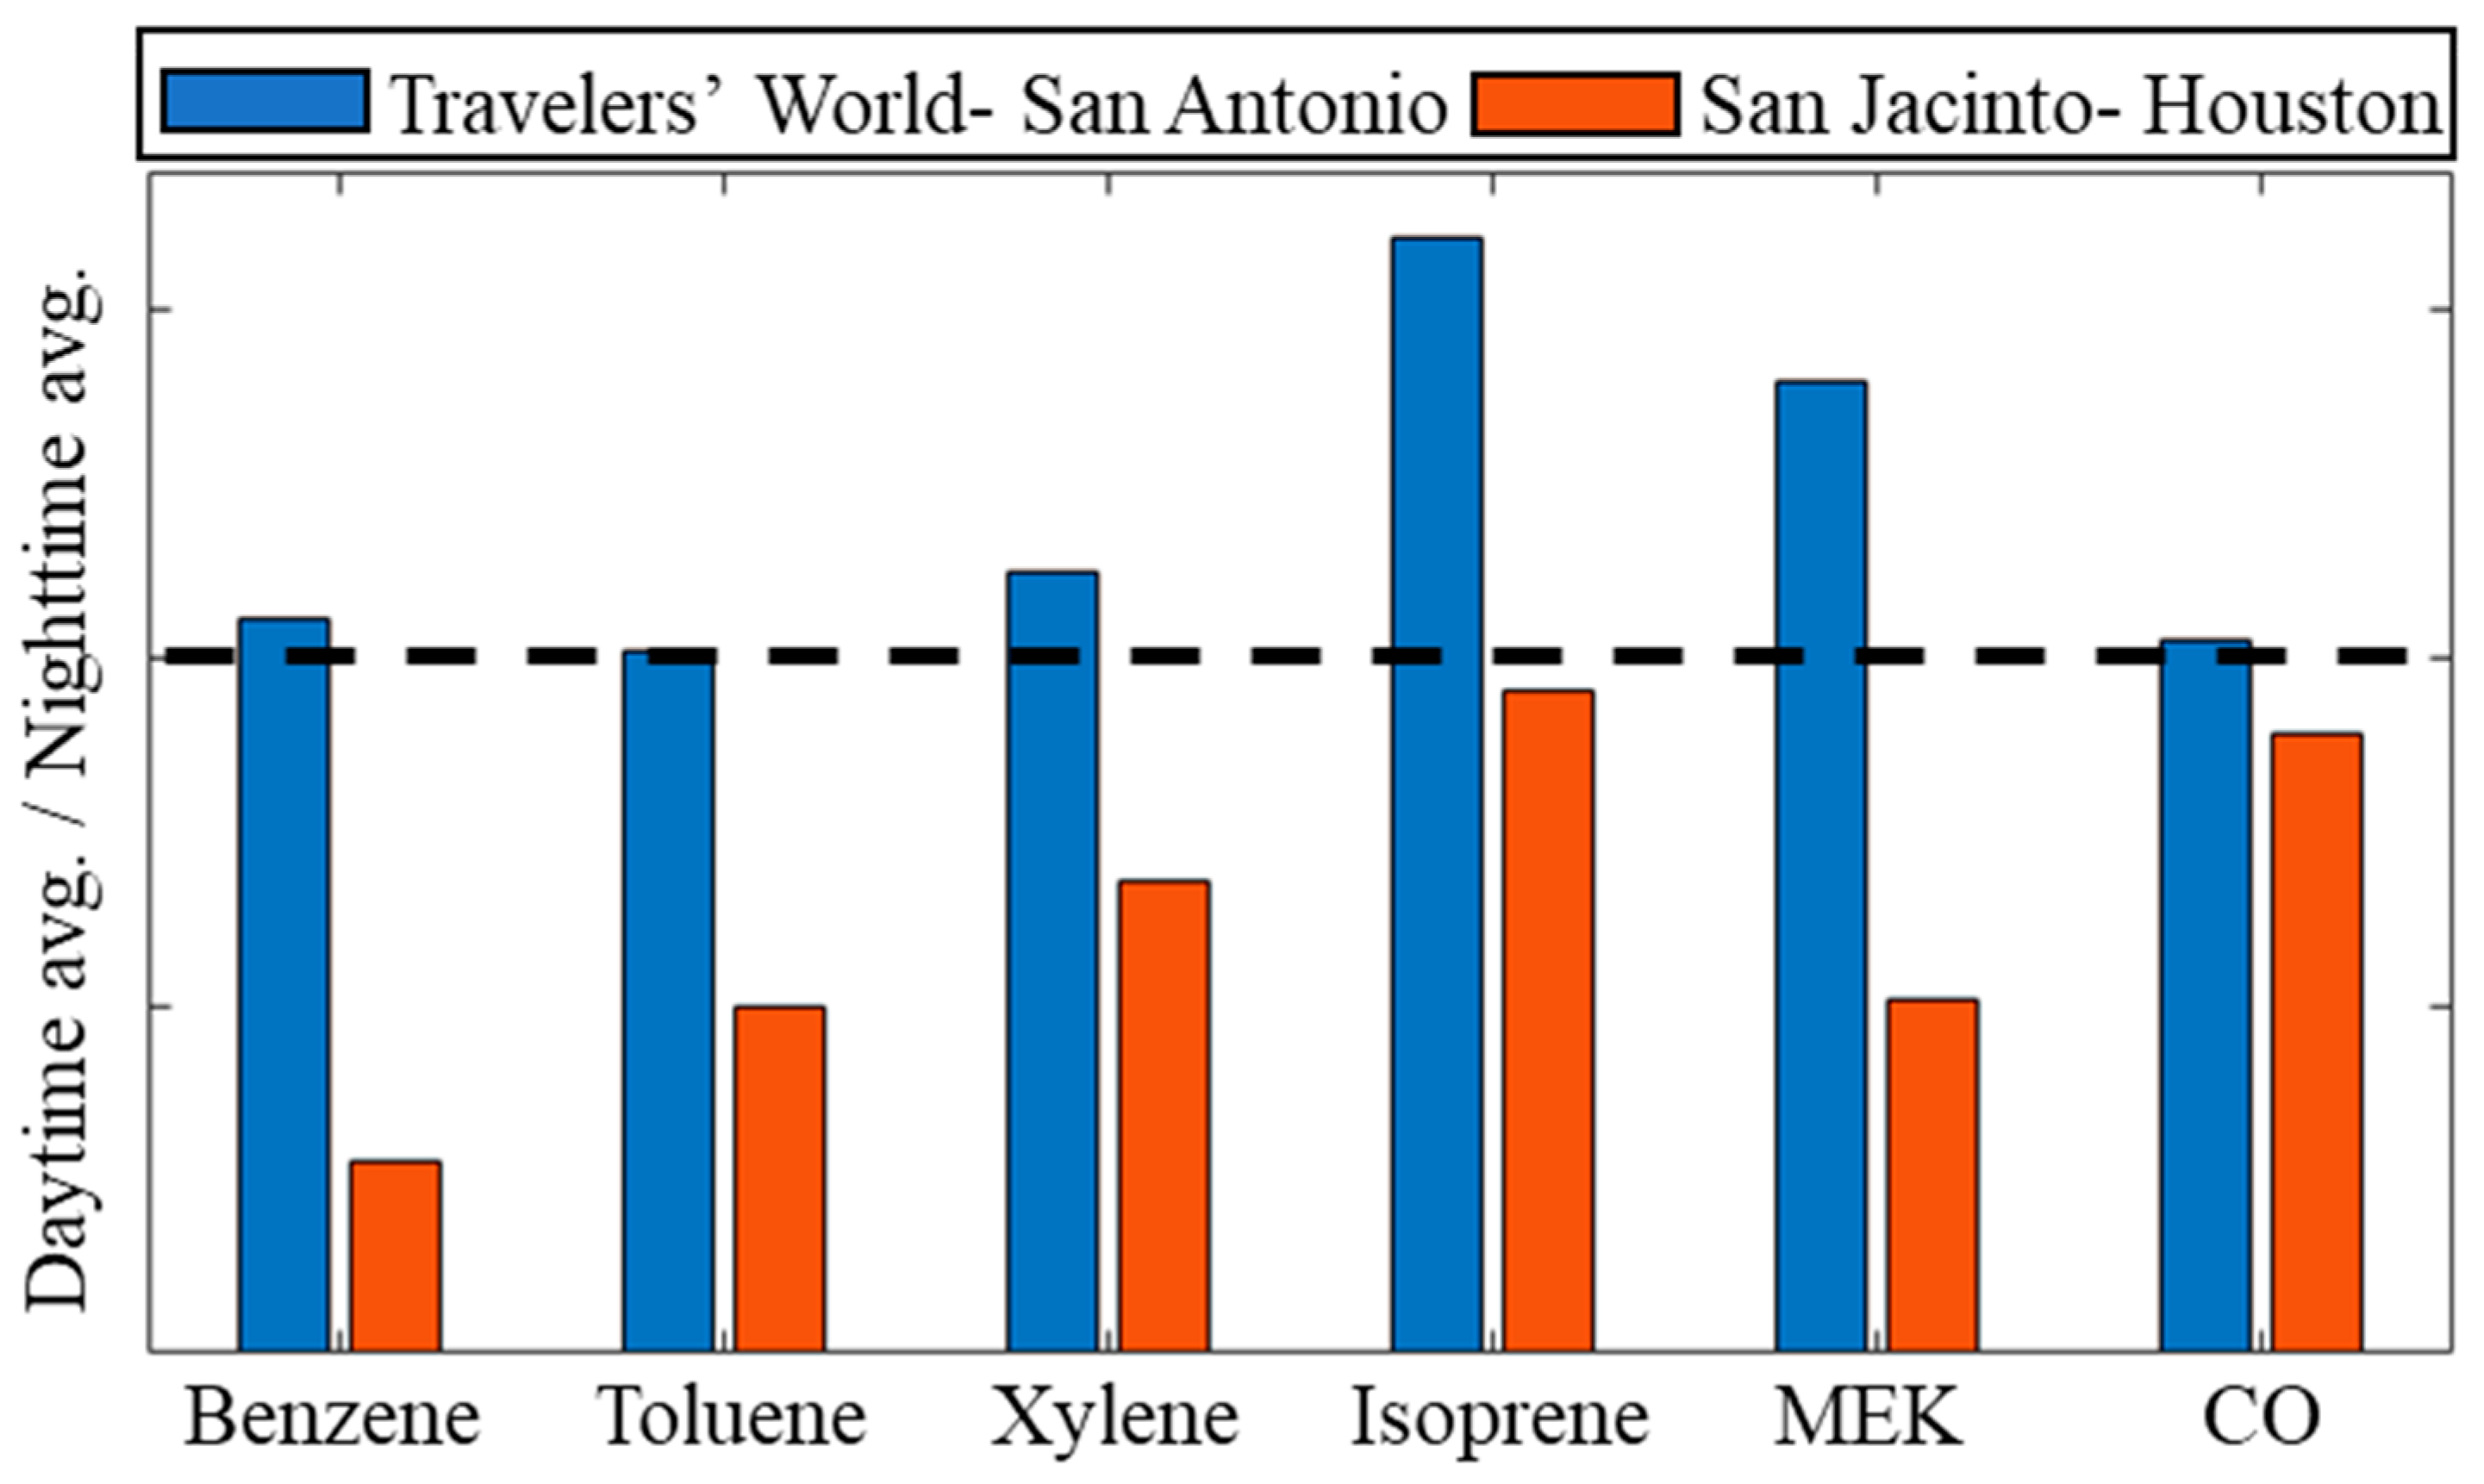
As expected from Figure 2 and Figure 3, BTX and CO in San Antonio have minimal differences in the day vs. nighttime averages (Figure 4). Isoprene and MEK are added here as examples of compounds that increase in the daytime: biogenic emissions of isoprene peak with sunlight, while MEK is an oxidation product of isoprene. These two compounds are enhanced in the daytime (Figure 4) in San Antonio. Again, Houston has very different day vs. night averages, with a very low ratio for benzene and toluene, but also ratios less than 1 for MEK. In contrast, CO is very close to 1 for the day vs. night ratio, which is similar to San Antonio. Isoprene has a ratio close to 1, indicating a consistency of emission throughout the day. These ratios again highlight that the Houston site was heavily impacted by nighttime, non-combustion sources for BTX, but also potentially for isoprene and MEK.
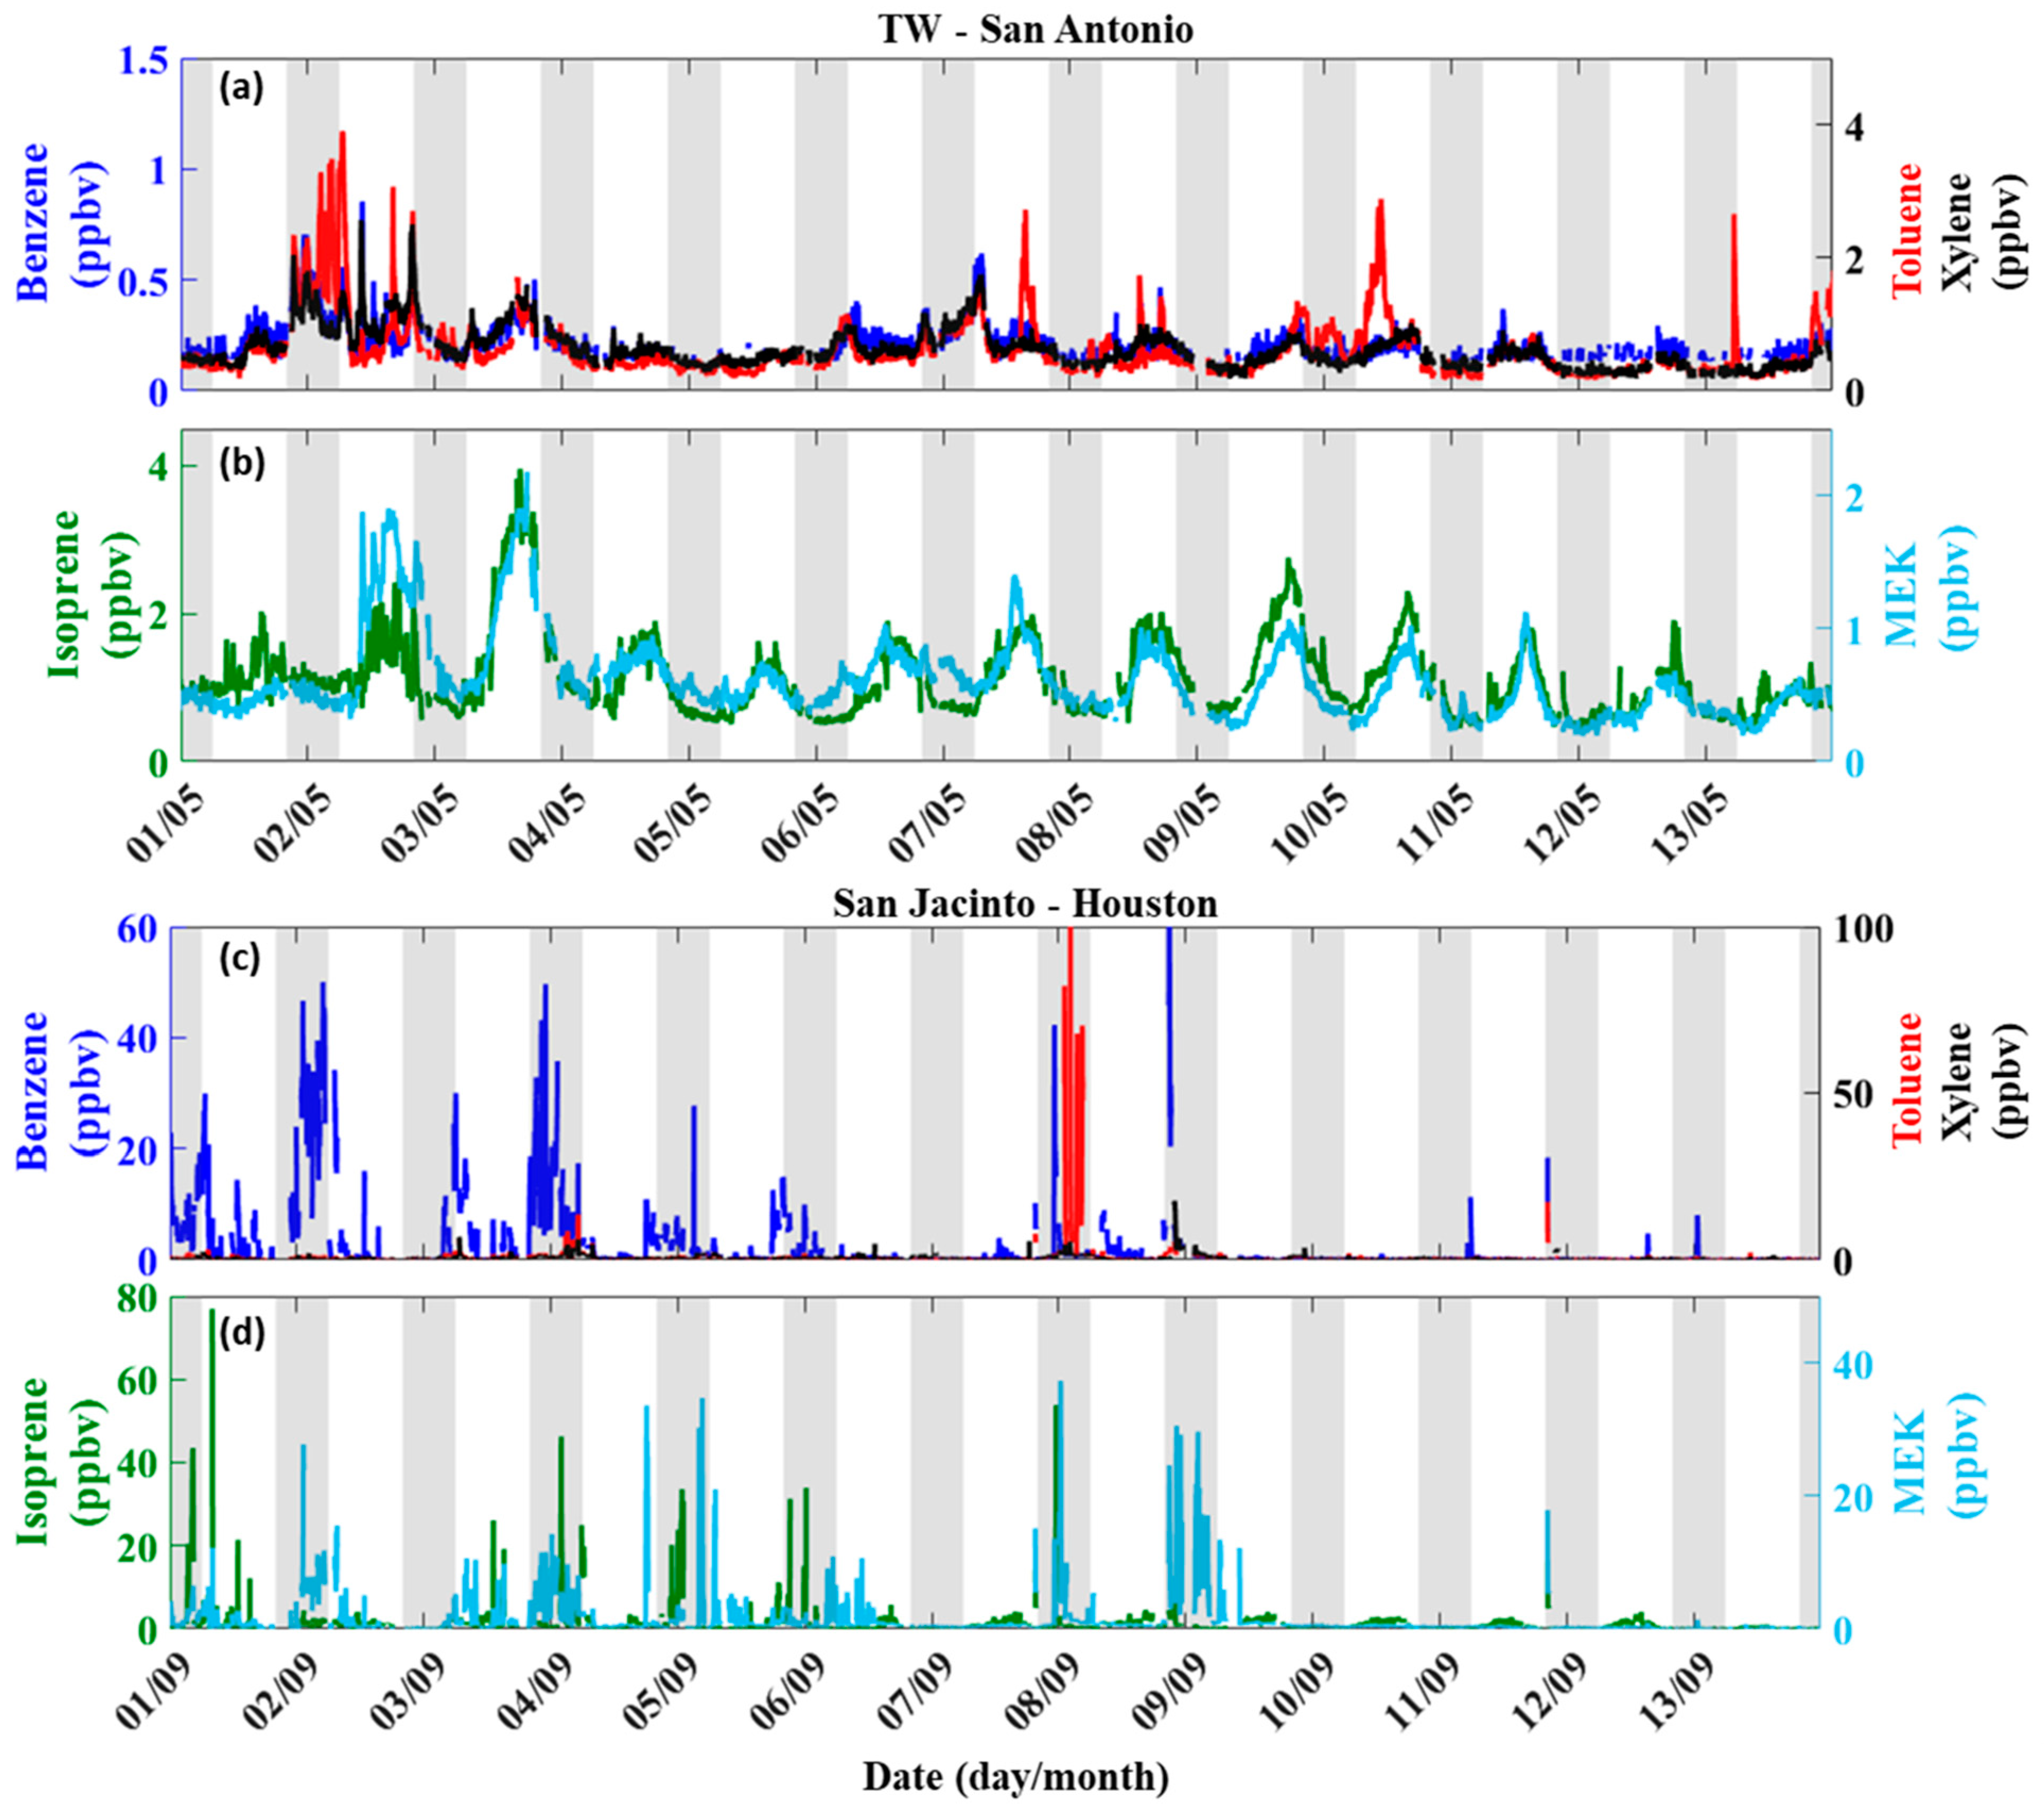
In order to achieve a more thorough comprehension of the difference between daytime and nighttime emissions, this section examines the time series analysis of VOCs (Figure 5). This analysis offers improved insight into the actual emissions through a visual assessment of concentration ranges and daily trends observed at the two sites. Figure 5 exhibits the observed levels of BTX, isoprene, and MEK at the San Antonio and Houston sites during the campaign. It is evident that the peak concentration ranges of these VOCs differ significantly between the two locations. For instance, the high benzene events at the Houston site exceeded the maximum benzene concentration in San Antonio by more than 60 times. Similar differences were observed for toluene and xylene at the Houston site compared with San Antonio. BTX compounds exhibited a strong correlation with each other in San Antonio, with occasional peaks in toluene concentration deviating from the benzene or xylene trends. This suggests the presence of a local toluene source near the sampling site that may not be related to traffic emissions. In San Antonio, isoprene and MEK exhibited a typical daytime photochemical profile throughout the campaign. However, at the Houston site, peak events occurred during the nighttime. These peak concentrations of isoprene and MEK at the Houston site surpassed those observed in San Antonio and other ambient measurements reported in the literature with the biogenic origin [19,52,53,54]. These nighttime peak events in isoprene and MEK at the Houston site explain the daytime-to-nighttime average ratios below 1 (Figure 4). Similar nighttime peaks were also observed in BTX concentrations at the Houston site. However, these nighttime events were not uniform across the measured VOC or CO. These nighttime peaks in isoprene and MEK do not indicate biogenic origin, further supporting our earlier discussion that the Houston site was heavily influenced by industrial releases not only for BTX but also for isoprene and MEK.

3.3. Comparison with Emission Inventories

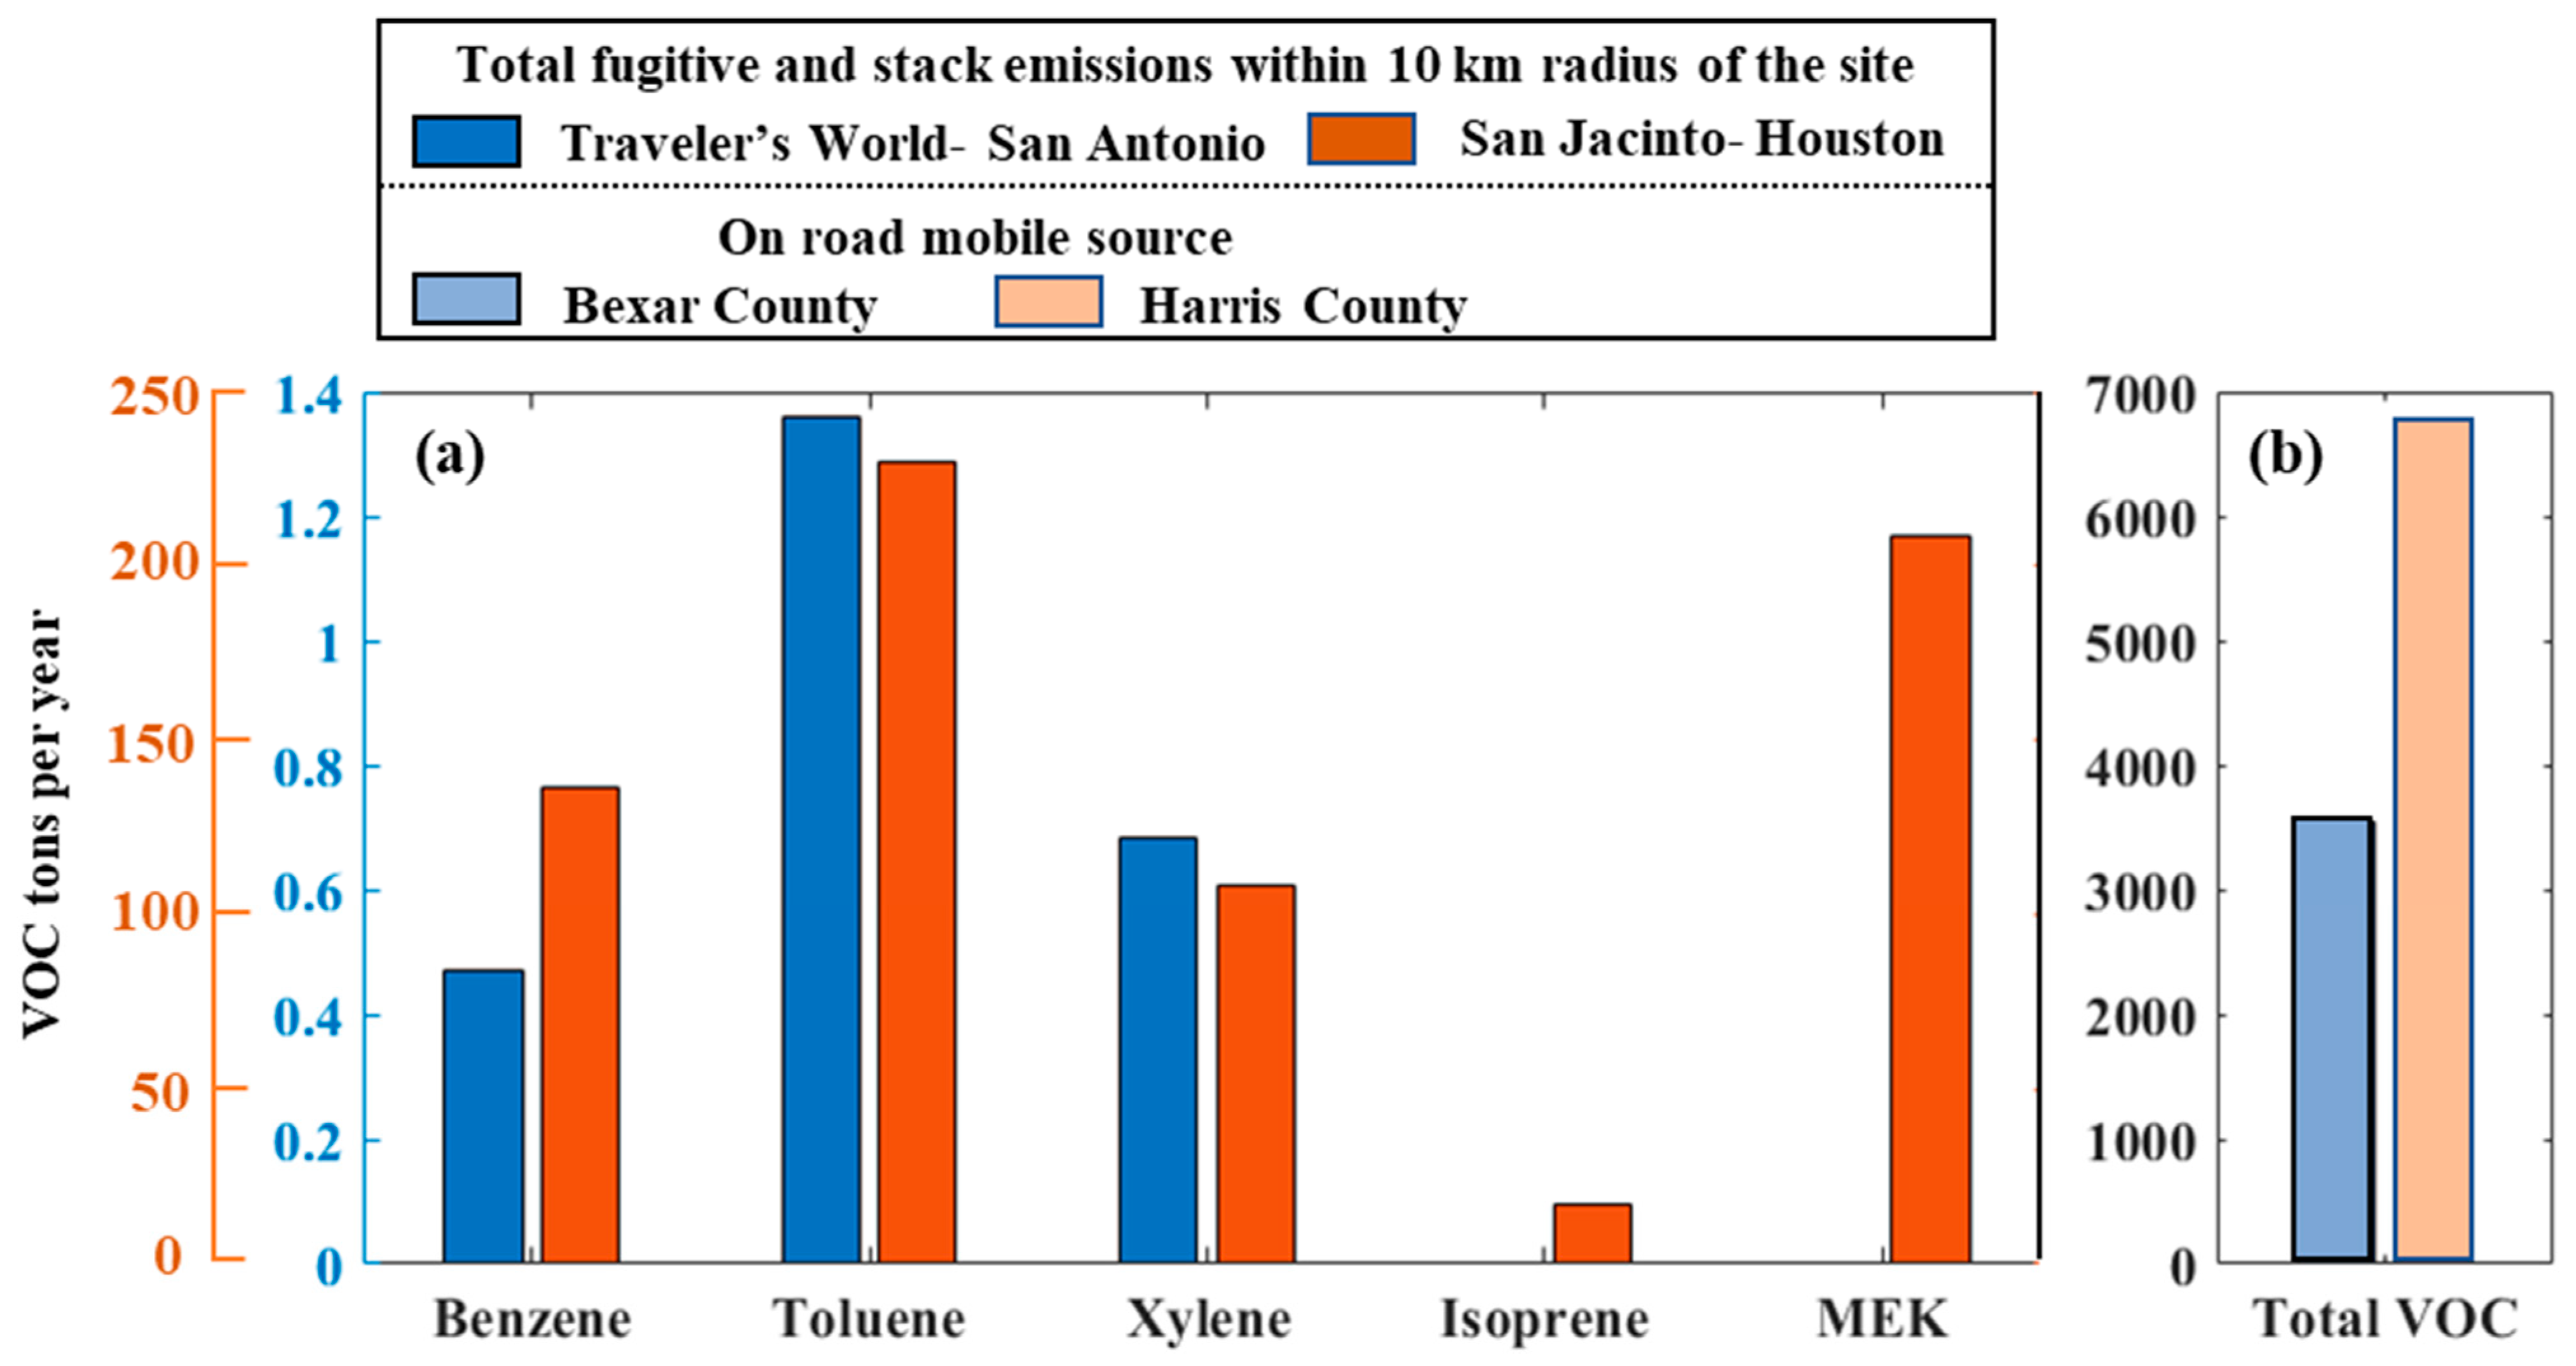
To better understand the impact of local emissions on BTX, isoprene, and MEK at the San Antonio and Houston sites, we summed the fugitive and stack emissions within a 10 km radius of each site. For comparison, we also included the total on-road mobile VOC for each metropolitan area (Figure 6). Houston is a large metropolitan area, and the San Jacinto site is likely influenced by local sources associated with industrial and other activities in the ship channel and does not reflect emission conditions across the entire metropolitan area. There is a stark difference between the VOC emissions for San Antonio and the San Jacinto ship channel area in Houston; in Figure 6, the VOC tons per year for the area around San Jacinto are over two orders of magnitude higher than the area around Traveler’s World in San Antonio. For comparison, the traffic emissions for Houston (Harris County) and San Antonio (Bexar County) are only a factor of two different. The emissions inventory for fugitive and stack emissions near the San Jacinto site in Houston adds confirmation to the hypothesis that these select VOCs are highly impacted by local industrial emissions, which do not necessarily co-emit with CO and do not have the same diurnal variability as traffic or biogenic emission sources. Although the emissions inventory does show similarly high emissions for xylene, the LRF-based ER and diurnal trends seem to indicate traffic influence as well. Conversely, this emissions inventory information for San Antonio confirms that the local industrial emissions (within 10 km) are not a strong source for these select VOCs. Further work is needed to understand the specific influence of fugitive and stack emission sources on BTX and VOCs near the Houston Ship Channel and to understand the impact of these emissions on O3 and SOA production. As indicated in previous studies, traffic, and biogenic emissions are important for BTX and isoprene in San Antonio. These newly calculated ERs for San Antonio align the traffic emissions of these compounds with other major cities (e.g., LA and Paris in Table 1).
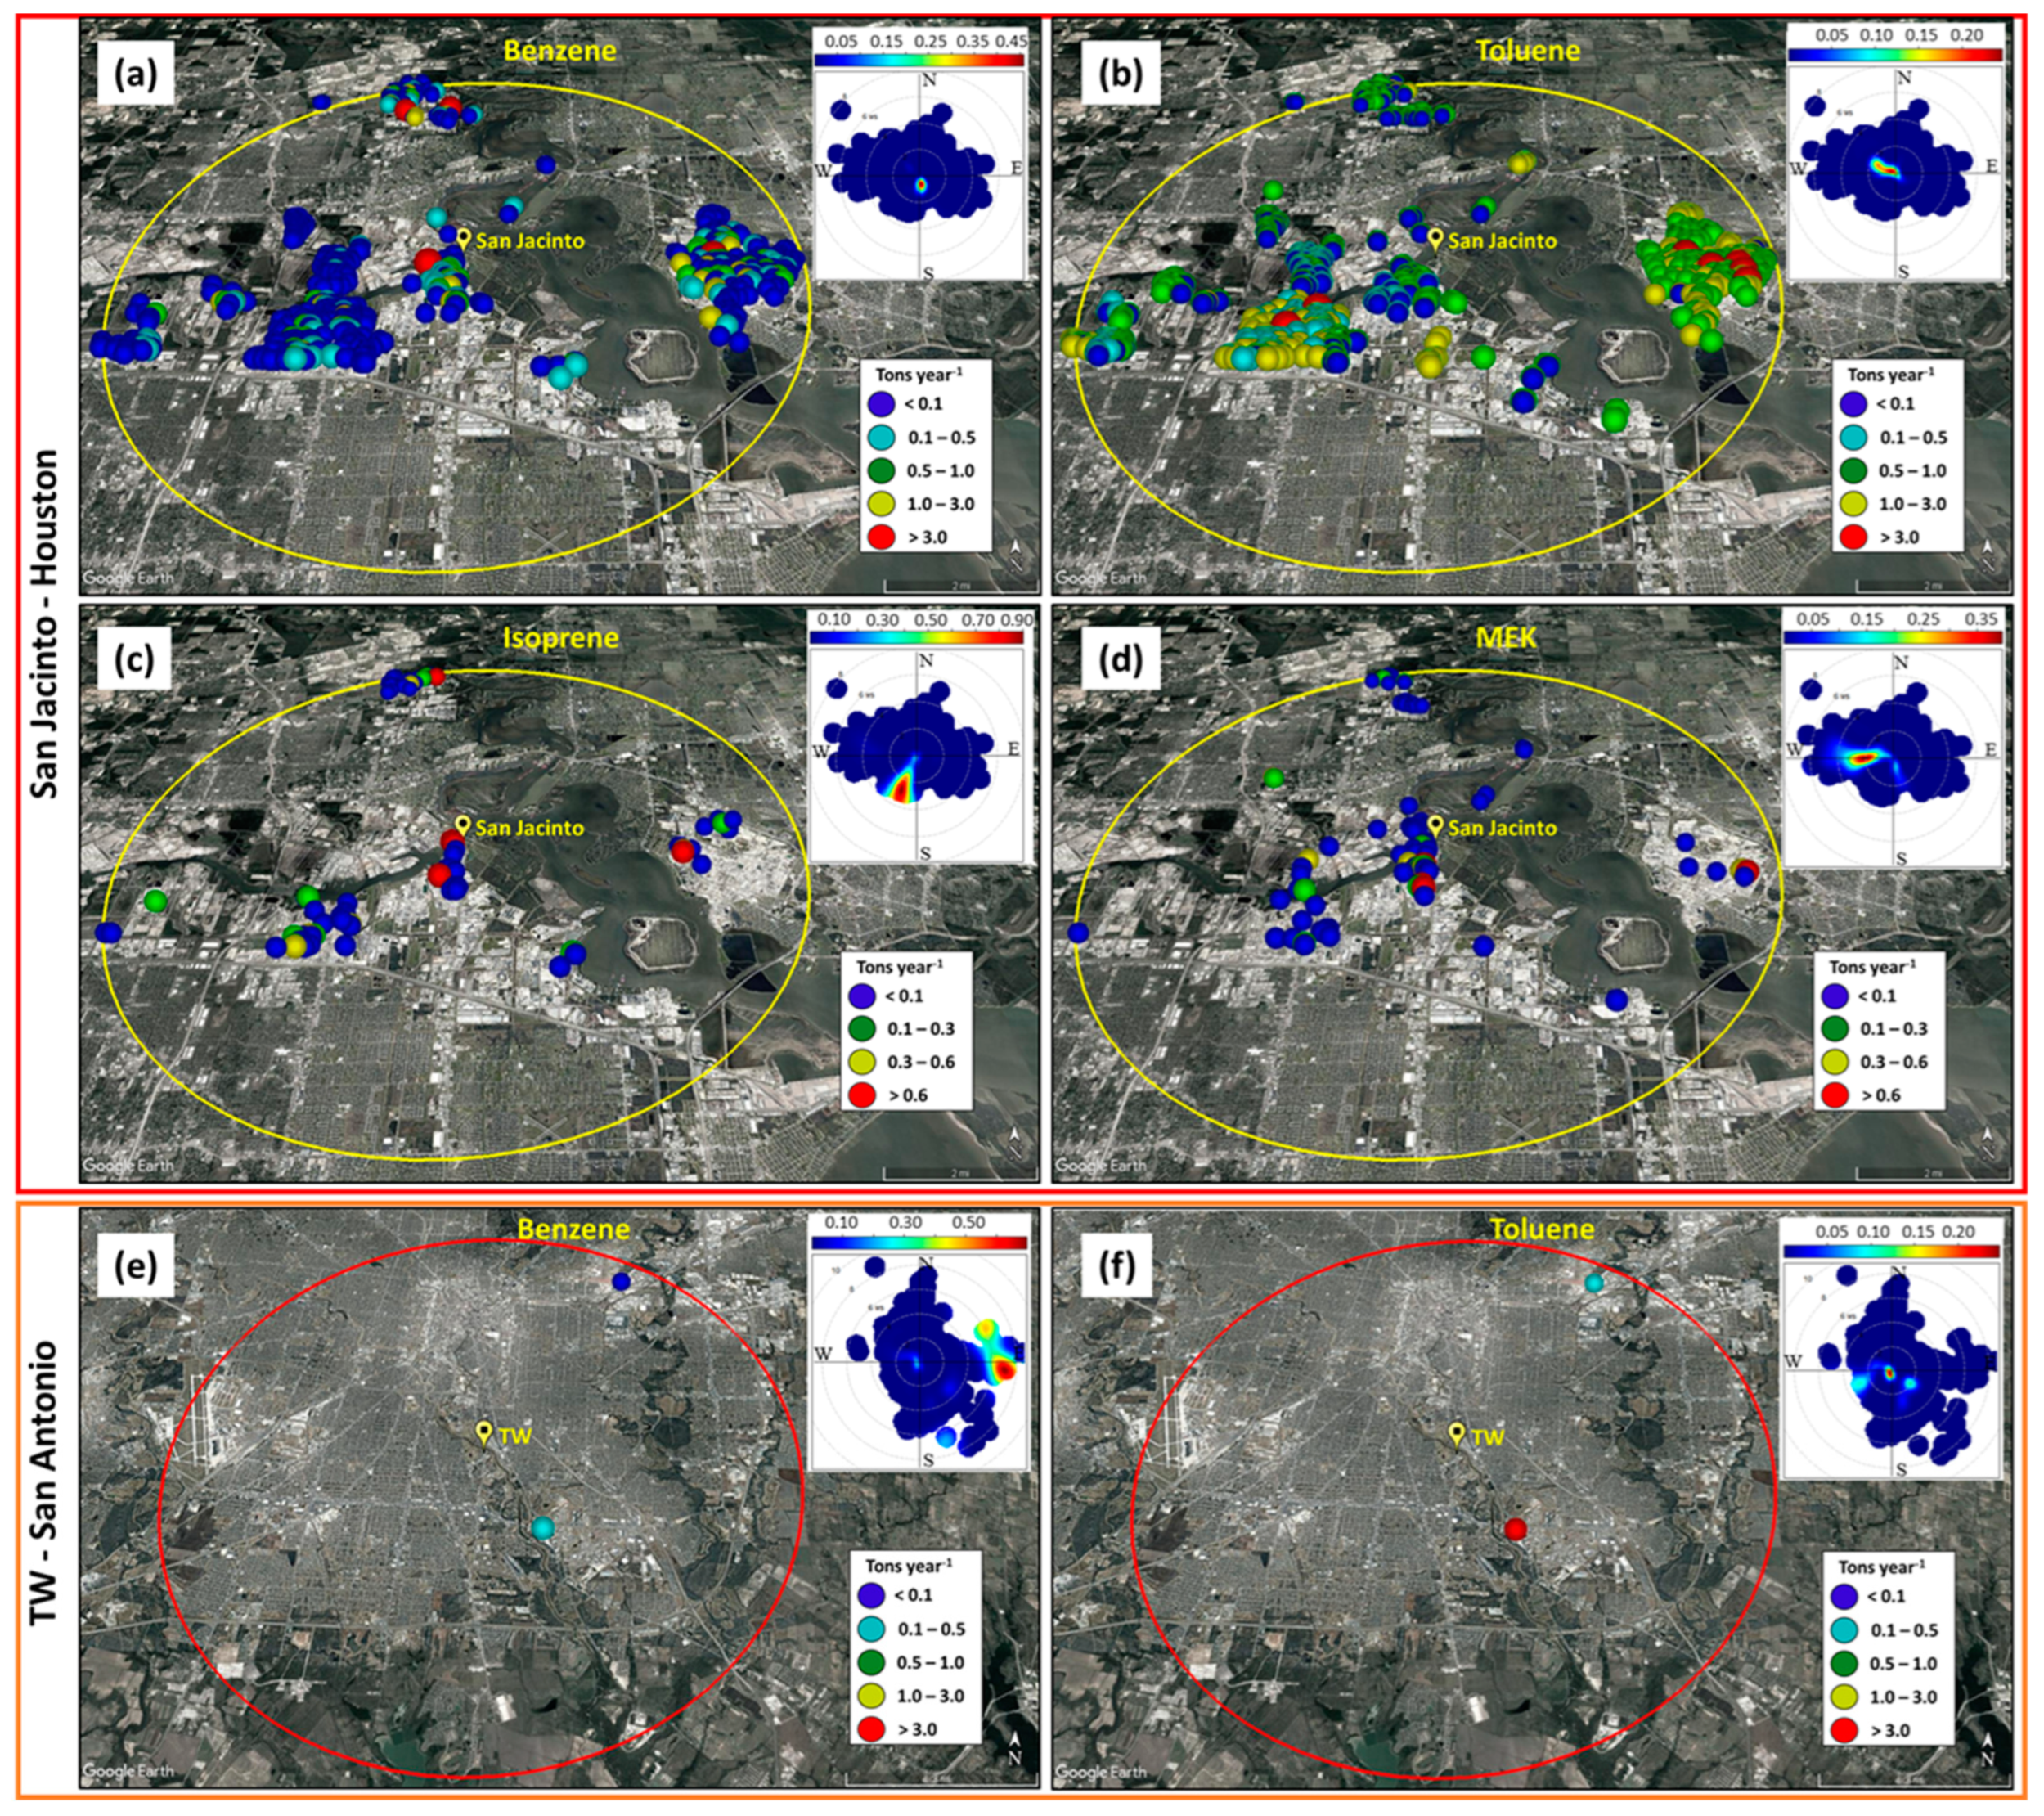
A comparison of the wind direction linked to high source contributions observed in the ambient data can provide insights into regions with substantial emission sources. This allows for a comparison between the ambient results and the documented locations of actual VOC sources as listed in the emission inventory, aiming to assess the accuracy of the previously discussed potential VOC sources [55]. Figure 7 displays the precise geographic locations of the stack and fugitive emission sources (used in Figure 6), with color grading indicating the range of total emissions associated with these sources within a 10 km radius of the study sites in Houston and San Antonio. Additionally, Figure 7 shows the CPF plots for the respective VOCs. These CPF plots demonstrate the higher concentration of ambient measurements within a specific wind sector for each VOC. Overall, the CPF results align closely with the directions of the highest emission sources documented in the emission inventory. The low variability observed in these CPF plots (especially for benzene at the Houston site) can be attributed to the higher concentrations of these VOCs released by local sources during nighttime periods when wind speeds and mixing heights are low. The CPF results for isoprene and MEK at the Houston site (Figure 7c,d) clearly exhibit a higher contribution of these VOCs aligned with the direction associated with industrial sources documented in the emission inventory, thus demonstrating the robustness of this analysis. In contrast, the San Antonio site has only two industrial sources listed for benzene and toluene within a 10 km radius. While these industries may contribute to benzene and toluene emissions in San Antonio, they are unlikely to be the dominant contributors. The CPF plot for benzene in San Antonio likely indicates emissions from the nearby interstate highway in the south. On the other hand, the CPF plot for toluene in San Antonio reveals high periods of this VOC from occasional local emissions (as discussed in Section 3.2). The San Antonio emission inventory does not include any industrial sources for isoprene or MEK.

3.4. Atmospheric Implications

There has been significant concern regarding O3 pollution in Texas cities for decades due to its impact on the public health of over 25 million Texans [14,55,56,57,58,59,60,61,62,63]. Multiple major urban areas in Texas, including various counties within Houston–Galveston–Brazoria, San Antonio, Dallas–Fort Worth, and El Paso, surpass the active National Ambient Air Quality Standards (NAAQS) for 8-hour O3 pollution (www.tceq.texas.gov/airquality, accessed on 15 April 2023). The O3 issue in San Antonio reflects a common pattern observed in large US cities, where O3 precursors are dominated by mobile sources [14]. Meanwhile, Houston’s O3 pollution is unique. It stems from a complex combination of anthropogenic emissions originating from extensive petrochemical industries and refining facilities as well as traffic [19,58,59,60,62] and specific meteorological conditions characterized by sea breeze circulation that confines pollutants within the urban area [57,64]. Additionally, the transport of O3 and its precursors into both San Antonio and Houston can play a role in elevated O3 levels within these cities [14,61].
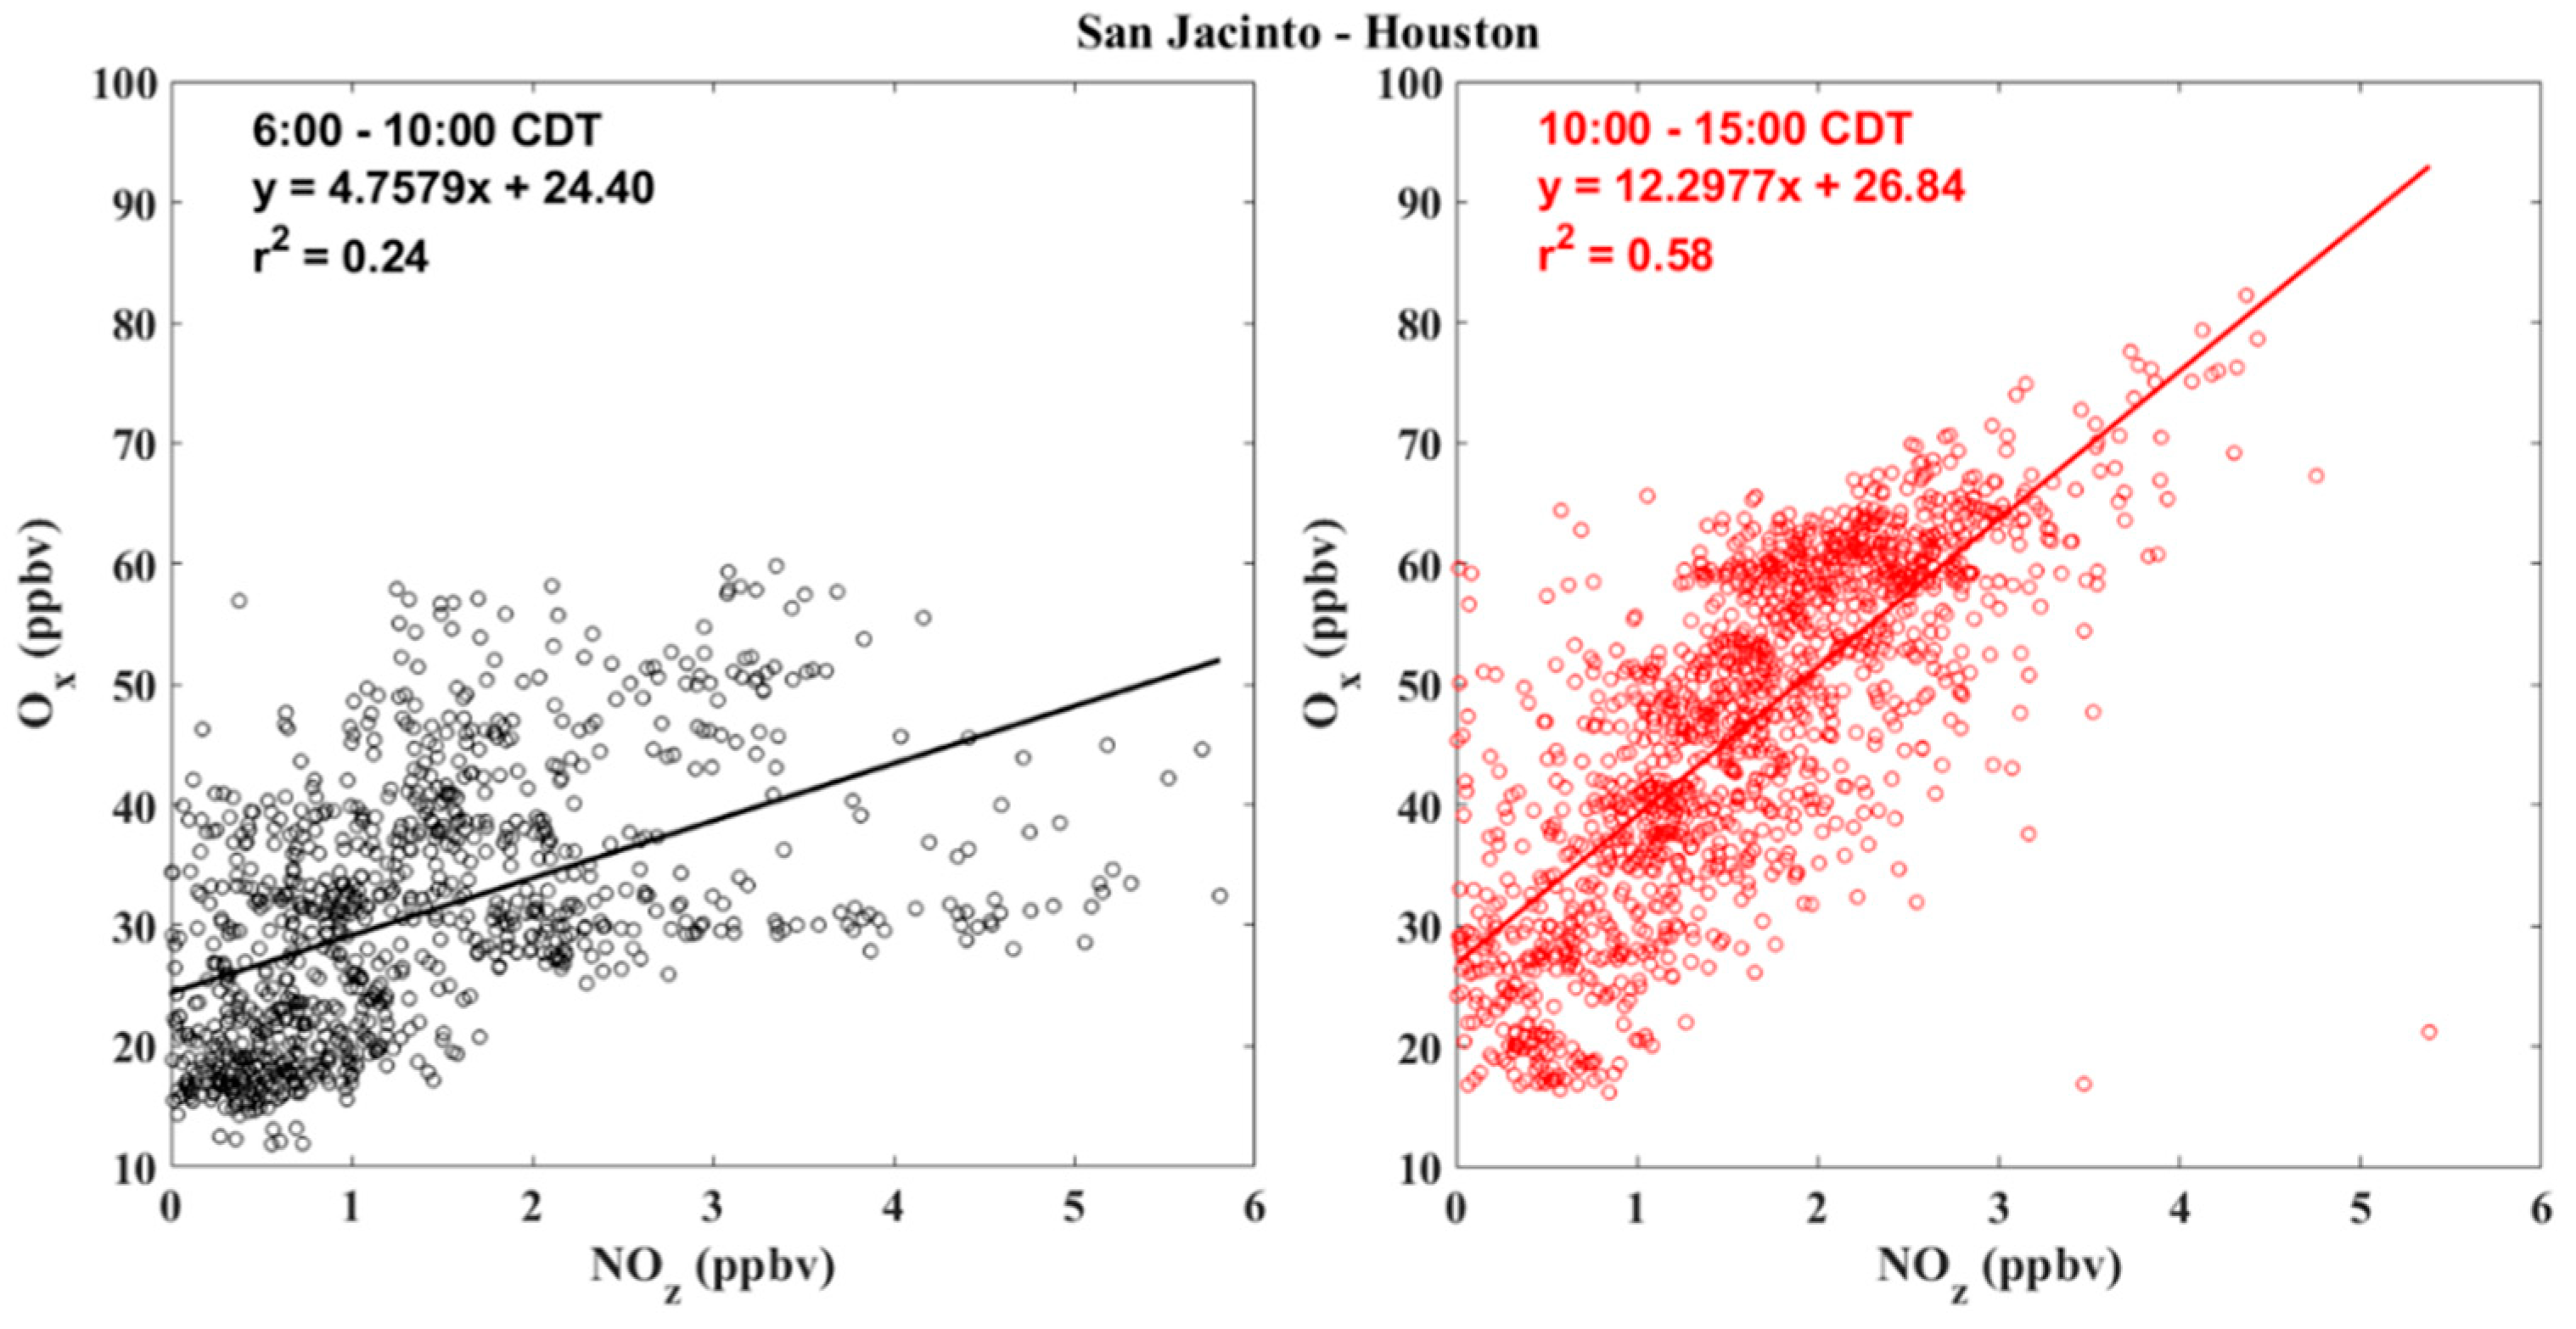
Several studies have shown that emissions of highly reactive VOCs and NOx from industries contribute significantly to the elevated levels of O3 in the HSC area [12,19,58,59,65]. The dependence of O3 production on NOx and VOCs can be categorized into two typical scenarios: NOx-limited and VOC-limited; therefore, a comprehensive source and emission characterization of these precursors are vital in O3 mitigation. During this study in the Houston site, the O3 production sensitivity to NOx or VOC had similar behavior as observed in a previous study in Houston [66], where OPE calculation (Figure 8) revealed that O3 formation was VOC-limited in the morning and transitioned to NOx-limited condition during the day. In such conditions where morning hours are predominantly in a VOC-limited regime, the accumulation of highly reactive VOCs, such as isoprene, resulting from nighttime emissions (as described in previous sections), may contribute to peak O3 levels on the following day. Further, to lower the O3 level in HSC, integrated emission reduction methods that target NOx and VOCs must be employed.
Our previous publications have demonstrated, through regression-based OPE and 0D Lagrangian model analyses, that the formation of O3 in the San Antonio site during 2017 was NOx-limited [13,14]. Although the OPE analysis for San Antonio was not feasible in this study, additional analysis is warranted.

4. Conclusions

This study aimed to compare the emission ratios and diurnal variability of VOC measured during the SAFS and TRACER-AQ campaigns in 2021 in two Texas cities, San Antonio and Houston. The emission ratios of benzene, toluene, xylenes, isoprene, and MEK were calculated using the LRF method and were compared with emission ratios reported for urban locations in LA, Paris, Moscow, London, Ahmedabad, Mexico City, and São Paulo to evaluate potential differences in emission sources. The results showed that San Antonio had similar emission ratios as other megacities for benzene, toluene, and xylenes, likely indicating a similar traffic emission source. In contrast, Houston had a different emission ratio, but the coefficient of determination (r2) between CO and VOCs was very low, indicating little confidence in that value.
The diurnal normalized mixing ratio of CO and benzene in San Antonio most closely resembled the Paris diurnal trends, with a morning rush-hour peak and a small decrease during the daytime, indicating the influence of traffic emissions on both CO and benzene at this site. The Houston site had a similar early-morning peak for CO but a unique profile for benzene, with peak concentration overnight, no considerable rush-hour signal, and very low normalized concentration at midday. In San Antonio, the isoprene and MEK exhibited consistent daytime profiles that are similar to the diurnal trend of O3. However, in Houston, there was no smooth isoprene or MEK profile likely due to intermittent anthropogenic plumes. The day and nighttime average ratio of BTX and CO in San Antonio exhibited minimal differences, whereas, in Houston, there was a substantial difference, with a very low ratio for BTX and MEK. These results indicate that the Houston site was considerably impacted by non-combustion anthropogenic sources for BTX, and possibly also for isoprene and MEK, which are commonly presumed to have biogenic origins. Aromatics such as BTX and reactive species such as isoprene are also relevant for the production of SOA, and these high local emissions likely impact downwind aerosol chemistry.
To better understand the impact of local emissions on BTX, isoprene, and MEK at the San Antonio and Houston sites, the study exploited the TCEQ emission inventory for fugitive and stack emissions within a 10 km radius of each site and the total on-road mobile VOC for each metropolitan area. The emissions inventory information confirmed that the VOCs at the Houston site were highly impacted by local industrial emissions, which do not necessarily co-emit with CO and do not have the same diurnal variability as traffic emissions. The CPF analysis closely matched the direction of the sources with the highest recorded emission levels as listed in the emission inventory. The OPE calculation at the Houston site indicated an apparent transition from a morning VOC-limited O3 production regime to an afternoon NOx-limited condition. With this VOC limitation in the morning, the high emissions of reactive VOCs such as isoprene become more relevant for local and downwind chemistry. Overall, these results indicate that Texas cities may have complex emission scenarios and that future efforts to mitigate O3 and particulate matter may have to consider the nontraffic anthropogenic VOC sources.

Author Contributions

Conceptualization, methodology: S.S. and R.J.S.; formal analysis, investigation: S.S., S.Y. and S.L.A.; data curation: S.S.; writing—original draft preparation: S.S. and R.J.S.; writing—review and editing: R.J.S. and S.U.; supervision: R.J.S.; project administration, R.J.S., S.U. and J.H.F.; funding acquisition: R.J.S., S.U., J.H.F. and Y.W. All authors have read and agreed to the published version of the manuscript.

Funding

The preparation of this manuscript was financed through a grant from the Texas Commission on Environmental Quality (TCEQ, grant number 582-18-81339), administered by the University of Texas at Austin Center for Energy and Environmental Resources (CEER) through the Air Quality Research Program (AQRP), and TCEQ grant numbers 582-22-33351-024, 582-21-22179-015, and 582-22-31913-020. The content, findings, opinions, and conclusions are the work of the authors and do not necessarily represent the findings, opinions, or conclusions of the TCEQ or the AQRP.

Institutional Review Board Statement

Not applicable.

Informed Consent Statement

Not applicable.

Data Availability Statement

Data used in the current manuscript will be available upon request from the corresponding author.

Acknowledgments

The authors would like to acknowledge the San Jacinto Battleground State Historic Site for site access during TRACER-AQ. The authors would also like to acknowledge the contributions of Meghan Guagenti, Manisha Mehra, and Robert J. Griffin during the SAFS 2021 field campaign.

Conflicts of Interest

The authors declare no conflict of interest.

References

  1. Hallquist, M.; Wenger, J.C.; Baltensperger, U.; Rudich, Y.; Simpson, D.; Claeys, M.; Dommen, J.; Donahue, N.; George, C.; Goldstein, A. The formation, properties and impact of secondary organic aerosol: Current and emerging issues. Atmos. Chem. Phys. 2009, 9, 5155–5236. [Google Scholar] [CrossRef] [Green Version]
  2. Healy, R.M.; Sofowote, U.M.; Wang, J.M.; Chen, Q.; Todd, A. Spatially resolved source apportionment of industrial VOCs using a mobile monitoring platform. Atmosphere 2022, 13, 1722. [Google Scholar] [CrossRef]
  3. Jia, C.; Batterman, S.; Godwin, C. VOCs in industrial, urban and suburban neighborhoods, Part 1: Indoor and outdoor concentrations, variation, and risk drivers. Atmos. Environ. 2008, 42, 2083–2100. [Google Scholar] [CrossRef]
  4. Liggio, J.; Li, S.-M.; Hayden, K.; Taha, Y.M.; Stroud, C.; Darlington, A.; Drollette, B.D.; Gordon, M.; Lee, P.; Liu, P. Oil sands operations as a large source of secondary organic aerosols. Nature 2016, 534, 91–94. [Google Scholar] [CrossRef]
  5. Seinfeld, J.H.; Pandis, S.N. Atmospheric Chemistry and Physics: From Air Pollution to Climate Change; John Wiley & Sons: Hoboken, NJ, USA, 2016. [Google Scholar]
  6. Yao, D.; Li, C.; Niu, Q.; Gao, W.; Yu, H.; Yan, G.; Liu, J.; Cao, Z.; Wang, S.; Wang, Y. Characteristics of volatile organic compounds and their contribution to secondary organic aerosols during the high O3 period in a Central Industry City in China. Atmosphere 2022, 13, 1625. [Google Scholar] [CrossRef]
  7. US Census Bureau, City and Town Population Totals: 2010-2019. 2019. Available online: https://www.census.gov/data/tables/time-series/demo/popest/2010s-total-cities-and-towns.html (accessed on 15 April 2019).
  8. Caselli, M.; de Gennaro, G.; Marzocca, A.; Trizio, L.; Tutino, M. Assessment of the impact of the vehicular traffic on BTEX concentration in ring roads in urban areas of Bari (Italy). Chemosphere 2010, 81, 306–311. [Google Scholar] [CrossRef]
  9. Dantas, G.; Gorne, I.; da Silva, C.M.; Arbilla, G. Benzene, toluene, ethylbenzene and xylene (BTEX) concentrations in urban areas impacted by chemical and petrochemical industrial emissions. Bull. Environ. Contam. Toxicol. 2022, 108, 204–211. [Google Scholar] [CrossRef]
  10. Hoque, R.R.; Khillare, P.; Agarwal, T.; Shridhar, V.; Balachandran, S. Spatial and temporal variation of BTEX in the urban atmosphere of Delhi, India. Sci. Total Environ. 2008, 392, 30–40. [Google Scholar] [PubMed]
  11. Zalel, A.; Broday, D.M. Revealing source signatures in ambient BTEX concentrations. Environ. Pollut. 2008, 156, 553–562. [Google Scholar] [CrossRef]
  12. Kim, S.-W.; McKeen, S.; Frost, G.; Lee, S.-H.; Trainer, M.; Richter, A.; Angevine, W.; Atlas, E.; Bianco, L.; Boersma, K. Evaluations of NOx and highly reactive VOC emission inventories in Texas and their implications for ozone plume simulations during the Texas Air Quality Study 2006. Atmos. Chem. Phys. 2011, 11, 11361–11386. [Google Scholar] [CrossRef] [Green Version]
  13. Guo, F.; Bui, A.A.; Schulze, B.C.; Yoon, S.; Shrestha, S.; Wallace, H.W.; Sakai, Y.; Actkinson, B.W.; Erickson, M.H.; Alvarez, S. Urban core-downwind differences and relationships related to ozone production in a major urban area in Texas. Atmos. Environ. 2021, 262, 118624. [Google Scholar] [CrossRef]
  14. Shrestha, S.; Yoon, S.; Erickson, M.H.; Guo, F.; Mehra, M.; Bui, A.A.; Schulze, B.C.; Kotsakis, A.; Daube, C.; Herndon, S.C. Traffic, transport, and vegetation drive VOC concentrations in a major urban area in Texas. Sci. Total Environ. 2022, 838, 155861. [Google Scholar] [CrossRef]
  15. Zhou, S.; Guo, F.; Chao, C.-Y.; Yoon, S.; Alvarez, S.L.; Shrestha, S.; Flynn III, J.H.; Usenko, S.; Sheesley, R.J.; Griffin, R.J. Marine submicron aerosols from the Gulf of Mexico: Polluted and acidic with rapid production of sulfate and organosulfates. Environ. Sci. Technol. 2023, 57, 5149–5159. [Google Scholar] [CrossRef] [PubMed]
  16. Buzcu, B.; Fraser, M.P. Source identification and apportionment of volatile organic compounds in Houston, TX. Atmos. Environ. 2006, 40, 2385–2400. [Google Scholar] [CrossRef]
  17. Sadeghi, B.; Pouyaei, A.; Choi, Y.; Rappenglueck, B. Influence of seasonal variability on source characteristics of VOCs at Houston industrial area. Atmos. Environ. 2022, 277, 119077. [Google Scholar] [CrossRef]
  18. Zhao, W.; Hopke, P.K.; Karl, T. Source identification of volatile organic compounds in Houston, Texas. Environ. Sci. Technol. 2004, 38, 1338–1347. [Google Scholar] [CrossRef] [PubMed]
  19. Jobson, B.; Berkowitz, C.M.; Kuster, W.; Goldan, P.; Williams, E.; Fesenfeld, F.; Apel, E.; Karl, T.; Lonneman, W.A.; Riemer, D. Hydrocarbon source signatures in Houston, Texas: Influence of the petrochemical industry. J. Geophys. Res. Atmos. 2004, 109, D24305. [Google Scholar] [CrossRef]
  20. Legreid, G.; Lööv, J.B.; Staehelin, J.; Hueglin, C.; Hill, M.; Buchmann, B.; Prevot, A.S.; Reimann, S. Oxygenated volatile organic compounds (OVOCs) at an urban background site in Zürich (Europe): Seasonal variation and source allocation. Atmos. Environ. 2007, 41, 8409–8423. [Google Scholar] [CrossRef]
  21. Biesenthal, T.A.; Shepson, P.B. Observations of anthropogenic inputs of the isoprene oxidation products methyl vinyl ketone and methacrolein to the atmosphere. Geophys. Res. Lett. 1997, 24, 1375–1378. [Google Scholar] [CrossRef]
  22. Park, C.; Schade, G.W.; Boedeker, I. Characteristics of the flux of isoprene and its oxidation products in an urban area. J. Geophys. Res. Atmos. 2011, 116, D21303. [Google Scholar] [CrossRef] [Green Version]
  23. Borbon, A.; Gilman, J.; Kuster, W.; Grand, N.; Chevaillier, S.; Colomb, A.; Dolgorouky, C.; Gros, V.; Lopez, M.; Sarda-Esteve, R. Emission ratios of anthropogenic volatile organic compounds in northern mid-latitude megacities: Observations versus emission inventories in Los Angeles and Paris. J. Geophys. Res. Atmos. 2013, 118, 2041–2057. [Google Scholar] [CrossRef]
  24. de Gouw, J.D.; Gilman, J.; Kim, S.W.; Lerner, B.; Isaacman-VanWertz, G.; McDonald, B.; Warneke, C.; Kuster, W.; Lefer, B.; Griffith, S. Chemistry of volatile organic compounds in the Los Angeles basin: Nighttime removal of alkenes and determination of emission ratios. J. Geophys. Res. Atmos. 2017, 122, 11843–811861. [Google Scholar] [CrossRef] [Green Version]
  25. Apel, E.; Emmons, L.; Karl, T.; Flocke, F.; Hills, A.; Madronich, S.; Lee-Taylor, J.; Fried, A.; Weibring, P.; Walega, J. Chemical evolution of volatile organic compounds in the outflow of the Mexico City Metropolitan area. Atmos. Chem. Phys. 2010, 10, 2353–2375. [Google Scholar] [CrossRef] [Green Version]
  26. Berezina, E.; Moiseenko, K.; Vasileva, A.; Pankratova, N.; Skorokhod, A.; Belikov, I.; Belousov, V. Emission Ratios and Source Identification of VOCs in Moscow in 2019–2020. Atmosphere 2022, 13, 257. [Google Scholar] [CrossRef]
  27. Brito, J.; Wurm, F.; Yáñez-Serrano, A.M.; de Assunção, J.O.V.; Godoy, J.M.; Artaxo, P. Vehicular emission ratios of VOCs in a megacity impacted by extensive ethanol use: Results of ambient measurements in São Paulo, Brazil. Environ. Sci. Technol. 2015, 49, 11381–11387. [Google Scholar] [CrossRef] [PubMed]
  28. Sahu, L.; Yadav, R.; Pal, D. Source identification of VOCs at an urban site of western India: Effect of marathon events and anthropogenic emissions. J. Geophys. Res. Atmos. 2016, 121, 2416–2433. [Google Scholar] [CrossRef] [Green Version]
  29. Valach, A.; Langford, B.; Nemitz, E.; MacKenzie, A.; Hewitt, C. Concentrations of selected volatile organic compounds at kerbside and background sites in central London. Atmos. Environ. 2014, 95, 456–467. [Google Scholar] [CrossRef] [Green Version]
  30. Acton, W.J.F.; Huang, Z.; Davison, B.; Drysdale, W.S.; Fu, P.; Hollaway, M.; Langford, B.; Lee, J.; Liu, Y.; Metzger, S. Surface–atmosphere fluxes of volatile organic compounds in Beijing. Atmos. Chem. Phys. 2020, 20, 15101–15125. [Google Scholar] [CrossRef]
  31. Morino, Y.; Ohara, T.; Yokouchi, Y.; Ooki, A. Comprehensive source apportionment of volatile organic compounds using observational data, two receptor models, and an emission inventory in Tokyo metropolitan area. J. Geophys. Res. Atmos. 2011, 116, D02311. [Google Scholar] [CrossRef] [Green Version]
  32. Parrish, D.D.; Kuster, W.C.; Shao, M.; Yokouchi, Y.; Kondo, Y.; Goldan, P.D.; de Gouw, J.A.; Koike, M.; Shirai, T. Comparison of air pollutant emissions among mega-cities. Atmos. Environ. 2009, 43, 6435–6441. [Google Scholar] [CrossRef]
  33. Velasco, E.; Lamb, B.; Pressley, S.; Allwine, E.; Westberg, H.; Jobson, B.; Alexander, M.; Prazeller, P.; Molina, L.; Molina, M. Flux measurements of volatile organic compounds from an urban landscape. Geophys. Res. Lett. 2005, 32, L20802. [Google Scholar] [CrossRef]
  34. Warneke, C.; McKeen, S.; De Gouw, J.; Goldan, P.; Kuster, W.; Holloway, J.; Williams, E.; Lerner, B.; Parrish, D.; Trainer, M. Determination of urban volatile organic compound emission ratios and comparison with an emissions database. J. Geophys. Res. Atmos. 2007, 112, D10S47. [Google Scholar] [CrossRef]
  35. McDonald, B.C.; De Gouw, J.A.; Gilman, J.B.; Jathar, S.H.; Akherati, A.; Cappa, C.D.; Jimenez, J.L.; Lee-Taylor, J.; Hayes, P.L.; McKeen, S.A. Volatile chemical products emerging as largest petrochemical source of urban organic emissions. Science 2018, 359, 760–764. [Google Scholar] [CrossRef] [PubMed] [Green Version]
  36. Griffin, R.J.; Johnson, C.A.; Talbot, R.W.; Mao, H.; Russo, R.S.; Zhou, Y.; Sive, B.C. Quantification of ozone formation metrics at Thompson Farm during the New England Air Quality Study (NEAQS) 2002. J. Geophys. Res. Atmos. 2004, 109, D24302. [Google Scholar] [CrossRef]
  37. Sillman, S. The use of NO y, H2O2, and HNO3 as indicators for ozone-NO x-hydrocarbon sensitivity in urban locations. J. Geophys. Res. Atmos. 1995, 100, 14175–14188. [Google Scholar] [CrossRef]
  38. Sun, Y.; Wang, L.; Wang, Y.; Zhang, D.; Quan, L.; Jinyuan, X. In situ measurements of NO, NO2, NOy, and O3 in Dinghushan (112° E, 23° N), China during autumn 2008. Atmos. Environ. 2010, 44, 2079–2088. [Google Scholar] [CrossRef]
  39. de Gouw, J.; Warneke, C. Measurements of volatile organic compounds in the earth’s atmosphere using proton-transfer-reaction mass spectrometry. Mass Spectrom. Rev. 2007, 26, 223–257. [Google Scholar] [CrossRef]
  40. Lindinger, W.; Hansel, A.; Jordan, A. On-line monitoring of volatile organic compounds at pptv levels by means of proton-transfer-reaction mass spectrometry (PTR-MS)—Medical applications, food control and environmental research. Int. J. Mass Spectrom. Ion Process. 1998, 173, 191–241. [Google Scholar] [CrossRef]
  41. Jobson, B.T.; McCoskey, J.K. Sample drying to improve HCHO measurements by PTR-MS instruments: Laboratory and field measurements. Atmos. Chem. Phys. 2010, 10, 1821–1835. [Google Scholar] [CrossRef] [Green Version]
  42. Parrish, D.; Ryerson, T.; Mellqvist, J.; Johansson, J.; Fried, A.; Richter, D.; Walega, J.; Washenfelder, R.D.; De Gouw, J.; Peischl, J. Primary and secondary sources of formaldehyde in urban atmospheres: Houston Texas region. Atmos. Chem. Phys. 2012, 12, 3273–3288. [Google Scholar] [CrossRef] [Green Version]
  43. de Gouw, J.; Middlebrook, A.; Warneke, C.; Goldan, P.; Kuster, W.; Roberts, J.; Fehsenfeld, F.; Worsnop, D.; Canagaratna, M.; Pszenny, A. Budget of organic carbon in a polluted atmosphere: Results from the New England Air Quality Study in 2002. J. Geophys. Res. Atmos. 2005, 110, D16305. [Google Scholar] [CrossRef]
  44. Sahu, L.; Tripathi, N.; Gupta, M.; Singh, V.; Yadav, R.; Patel, K. Impact of COVID-19 pandemic lockdown in ambient concentrations of aromatic volatile organic compounds in a metropolitan city of western India. J. Geophys. Res. Atmos. 2022, 127, e2022JD036628. [Google Scholar] [CrossRef]
  45. Texas A&M Transportation Institute. Final Report-2020 On-road mobile source annual, summer weekday, and winter weekday emissions inventories. 2022. Available online: https://www.tceq.texas.gov/downloads/air-quality/research/reports/on-road/5822111197019-20220425-tti-2020-aerr.pdf (accessed on 15 April 2023).
  46. Leuchner, M.; Rappenglück, B. VOC source–receptor relationships in Houston during TexAQS-II. Atmos. Environ. 2010, 44, 4056–4067. [Google Scholar] [CrossRef]
  47. Xie, Y.; Berkowitz, C.M. The use of positive matrix factorization with conditional probability functions in air quality studies: An application to hydrocarbon emissions in Houston, Texas. Atmos. Environ. 2006, 40, 3070–3091. [Google Scholar] [CrossRef]
  48. Pollack, I.B.; Ryerson, T.B.; Trainer, M.; Neuman, J.; Roberts, J.M.; Parrish, D.D. Trends in ozone, its precursors, and related secondary oxidation products in Los Angeles, California: A synthesis of measurements from 1960 to 2010. J. Geophys. Res. Atmos. 2013, 118, 5893–5911. [Google Scholar] [CrossRef]
  49. Trainer, M.; Parrish, D.; Buhr, M.; Norton, R.; Fehsenfeld, F.; Anlauf, K.; Bottenheim, J.; Tang, Y.; Wiebe, H.; Roberts, J. Correlation of ozone with NOy in photochemically aged air. J. Geophys. Res. Atmos. 1993, 98, 2917–2925. [Google Scholar] [CrossRef]
  50. Blanchard, C.L.; Hidy, G.M. Ozone response to emission reductions in the southeastern United States. Atmos. Chem. Phys. 2018, 18, 8183–8202. [Google Scholar] [CrossRef] [Green Version]
  51. Bon, D.; Ulbrich, I.; De Gouw, J.; Warneke, C.; Kuster, W.; Alexander, M.; Baker, A.; Beyersdorf, A.; Blake, D.; Fall, R. Measurements of volatile organic compounds at a suburban ground site (T1) in Mexico City during the MILAGRO 2006 campaign: Measurement comparison, emission ratios, and source attribution. Atmos. Chem. Phys. 2011, 11, 2399–2421. [Google Scholar] [CrossRef] [Green Version]
  52. Borbon, A.; Fontaine, H.; Veillerot, M.; Locoge, N.; Galloo, J.; Guillermo, R. An investigation into the traffic-related fraction of isoprene at an urban location. Atmos. Environ. 2001, 35, 3749–3760. [Google Scholar] [CrossRef]
  53. Drewitt, G.; Curren, K.; Steyn, D.; Gillespie, T.; Niki, H. Measurement of biogenic hydrocarbon emissions from vegetation in the Lower Fraser Valley, British Columbia. Atmos. Environ. 1998, 32, 3457–3466. [Google Scholar] [CrossRef] [Green Version]
  54. Jorquera, H.; Rappenglück, B. Receptor modeling of ambient VOC at Santiago, Chile. Atmos. Environ. 2004, 38, 4243–4263. [Google Scholar] [CrossRef]
  55. Buzcu-Guven, B.; Fraser, M.P. Comparison of VOC emissions inventory data with source apportionment results for Houston, TX. Atmos. Environ. 2008, 42, 5032–5043. [Google Scholar] [CrossRef]
  56. Anderson, D.C.; Pavelec, J.; Daube, C.; Herndon, S.C.; Knighton, W.; Lerner, B.M.; Roscioli, J.R.; Yacovitch, T.I.; Wood, E.C. Characterization of ozone production in San Antonio, Texas using observations of total peroxy radicals. Atmos. Chem. Phys. 2019, 19, 2845–2860. [Google Scholar] [CrossRef] [Green Version]
  57. Banta, R.; Senff, C.; Nielsen-Gammon, J.; Darby, L.; Ryerson, T.; Alvarez, R.; Sandberg, S.; Williams, E.; Trainer, M. A bad air day in Houston. Bull. Am. Meteorol. Soc. 2005, 86, 657–670. [Google Scholar] [CrossRef]
  58. Henderson, B.H.; Jeffries, H.E.; Kim, B.-U.; Vizuete, W.G. The influence of model resolution on ozone in industrial volatile organic compound plumes. J. Air Waste Manag. Assoc. 2010, 60, 1105–1117. [Google Scholar] [CrossRef] [Green Version]
  59. Kemball-Cook, S.; Parrish, D.; Ryerson, T.; Nopmongcol, U.; Johnson, J.; Tai, E.; Yarwood, G. Contributions of regional transport and local sources to ozone exceedances in Houston and Dallas: Comparison of results from a photochemical grid model to aircraft and surface measurements. J. Geophys. Res. Atmos. 2009, 114, D00F02. [Google Scholar] [CrossRef] [Green Version]
  60. Kleinman, L.I.; Daum, P.; Imre, D.; Lee, Y.N.; Nunnermacker, L.; Springston, S.; Weinstein-Lloyd, J.; Rudolph, J. Ozone production rate and hydrocarbon reactivity in 5 urban areas: A cause of high ozone concentration in Houston. Geophys. Res. Lett. 2002, 29, 105-1–105-4. [Google Scholar] [CrossRef] [Green Version]
  61. Nielsen-Gammon, J.; Tobin, J.; McNeel, A.; Li, G. A Conceptual Model for Eight-Hour Ozone Exceedances in Houston, Texas Part I: Background Ozone Levels in Eastern Texas. HARC/TERC/TCEQ Report. 2005. Available online: https://oaktrust.library.tamu.edu/handle/1969.1/158250 (accessed on 15 April 2023).
  62. Ryerson, T.; Trainer, M.; Angevine, W.; Brock, C.; Dissly, R.; Fehsenfeld, F.; Frost, G.; Goldan, P.; Holloway, J.; Hübler, G. Effect of petrochemical industrial emissions of reactive alkenes and NOx on tropospheric ozone formation in Houston, Texas. J. Geophys. Res. Atmos. 2003, 108, 4249. [Google Scholar] [CrossRef] [Green Version]
  63. Kotsakis, A.; Choi, Y.; Souri, A.H.; Jeon, W.; Flynn, J. Characterization of regional wind patterns using self-organizing maps: Impact on Dallas–Fort Worth long-term ozone trends. J. Appl. Meteorol. Climatol. 2019, 58, 757–772. [Google Scholar] [CrossRef]
  64. Bernier, C.; Wang, Y.; Estes, M.; Lei, R.; Jia, B.; Wang, S.C.; Sun, J. Clustering surface ozone diurnal cycles to understand the impact of circulation patterns in Houston, TX. J. Geophys. Res. Atmos. 2019, 124, 13457–13474. [Google Scholar] [CrossRef]
  65. Mazzuca, G.M.; Ren, X.; Loughner, C.P.; Estes, M.; Crawford, J.H.; Pickering, K.E.; Weinheimer, A.J.; Dickerson, R.R. Ozone production and its sensitivity to NOx and VOCs: Results from the DISCOVER-AQ field experiment, Houston 2013. Atmos. Chem. Phys. 2016, 16, 14463–14474. [Google Scholar] [CrossRef] [Green Version]
  66. Ren, X.; Van Duin, D.; Cazorla, M.; Chen, S.; Mao, J.; Zhang, L.; Brune, W.H.; Flynn, J.H.; Grossberg, N.; Lefer, B.L. Atmospheric oxidation chemistry and ozone production: Results from SHARP 2009 in Houston, Texas. J. Geophys. Res. Atmos. 2013, 118, 5770–5780. [Google Scholar] [CrossRef]
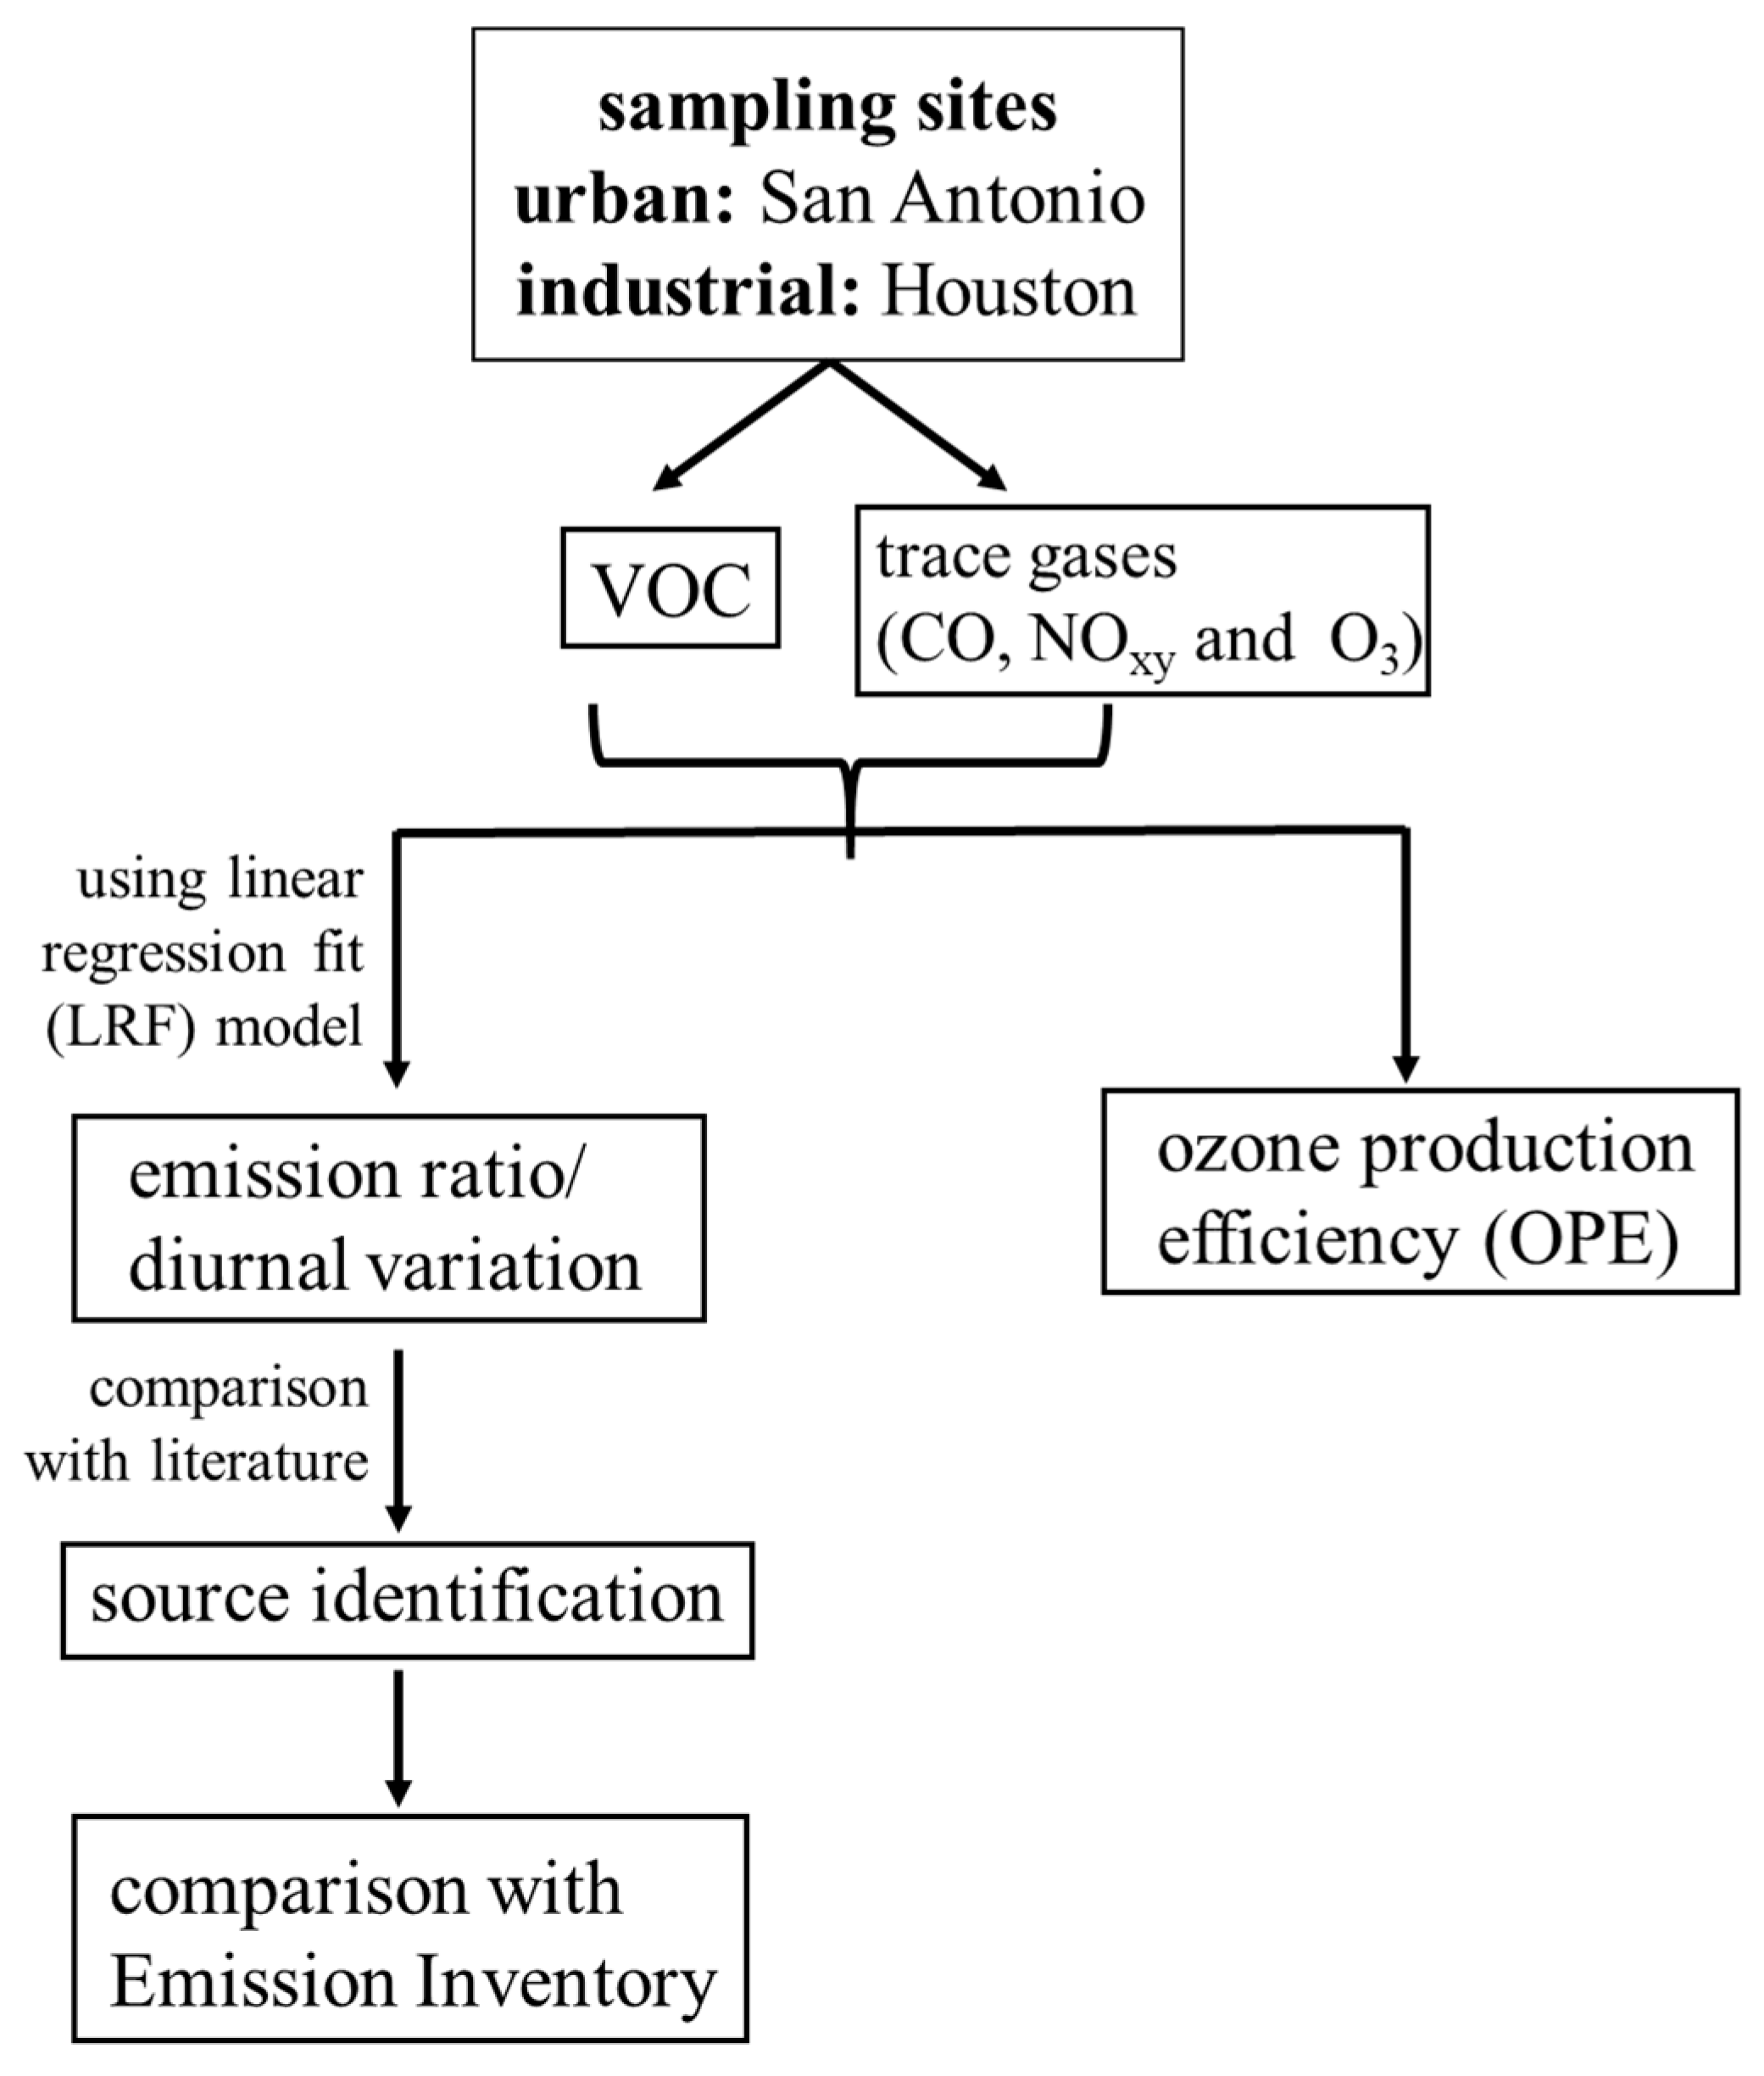
Figure 1. Flow diagram showing the methodology applied in this study.
Atmosphere 14 01006 g001
Figure 2. Normalized mixing ratios of select VOC at four different cities. Panel (a) for Los Angeles is reproduced, with permission, from de Gouw et al. [24]; panel (b) is reproduced, with permission, from Borbon et al. [23]; panels (cf) include measurements from San Antonio and Houston, respectively. ©2017 American Geophysical Union (panel (a)) and ©2013 American Geophysical Union (panel (b)).
Atmosphere 14 01006 g002
Figure 3. Correlation plots for benzene, toluene, xylenes, isoprene, and MEK versus CO for San Antonio (ae) and Houston (fj).
Atmosphere 14 01006 g003
Figure 4. The ratio of daytime to nighttime averages for benzene, toluene, xylenes, isoprene, methyl ethyl ketone (MEK), and CO for San Antonio and Houston.
Atmosphere 14 01006 g004
Figure 5. The series of BTX, isoprene, and MEK at TW–San Antonio (a,b) and San Jacinto–Houston (c,d).
Atmosphere 14 01006 g005
Figure 6. Fugitive and stack emissions within a 10 km radius of the studies’ sites reported by the TCEQ emissions inventory for Harris County and Bexar County for the year 2019 (a); on-road mobile source annual VOC emission reported by the TCEQ for the year 2020 [45] (b).
Atmosphere 14 01006 g006
Figure 7. Spatial distribution of point emissions for select VOCs within a 10 km radius of the studies sites in Houston (ad) and San Antonio (e,f) reported by the TCEQ emissions inventory for Harris County and Bexar County for the year 2019. The point sources are color grades based on their emission range (tons per year). The San Antonio emission inventory does not include any point sources for isoprene or MEK. The inset figures represent CPF plots for respective VOCs.
Atmosphere 14 01006 g007
Figure 8. Regression-based OPE (i.e., intercept of Ox to NOz) values in the morning (6:00–10:00) and later in the day (10:00–15:00) for the San Jacinto site in Houston. Generally, regression-based OPE < 7 indicates VOC-limited and >7 indicates NOx-limited O3 production regimes.
Atmosphere 14 01006 g008
Table 1. Emission ratios for select VOCs (part per trillion of VOC to part per billion of CO). The Texas cities from the current study are compared with the emission ratios from other megacities. The emission ratios are calculated using the LRF method. The r2 is reported for the Texas emission ratios calculated here; when the r2 > 0.5, the cell is bolded to denote a strong correlation.
VOCΔVOC/ΔCO (ppt/ppb)
TW–San Antonio (r2)San Jacinto–Houston (r2)LA aParis aMoscow bMexico City cSão Paulo dLondon eAhmedabad f
Benzene1.103.331.301.07 *-1.211.031.591.00
(0.70)(0.00)
Toluene4.577.183.1812.3 *1.774.23.103.093.14
(0.49)(0.27)
Xylene3.603.371.794.591.744.32.153.69-
(0.62)(0.31)
Isoprene0.774.810.30-0.170.08 g1.171.130.48
(0.03)(0.02)
MEK0.9715.33---0.291.42--
(0.10)(0.13)
a Borbon et al. [23]. b Berezina et al. [26]. c Bon et al. [51]. d Brito et al. [27]. e Valach et al. [29]. f Sahu et al. [28]. g Apel et al. [25]. * Determined from airborne measurement in Paris.
Disclaimer/Publisher’s Note: The statements, opinions and data contained in all publications are solely those of the individual author(s) and contributor(s) and not of MDPI and/or the editor(s). MDPI and/or the editor(s) disclaim responsibility for any injury to people or property resulting from any ideas, methods, instructions or products referred to in the content.