1. Introduction
Our society increasingly depends on satellite-based services as communication, surveillance, navigation, and timing technologies [
1]. Space weather is one of the main drivers of ionospheric disturbances, which can affect conditions for the propagation of electromagnetic signal from GNSS (Global Navigation Satellite System), communication, and other types of satellites. Space weather effects on the ionosphere are notable at high and low latitudes and, for this reason, are extensively studied and described. However, as pointed out by [
2], based on historical surveys, the current state of knowledge of properties of ionospheric disturbances is biased for specific geographic regions, in particular for the middle latitude region.
The mid-latitude region comprises the latitudinal range between ~20° and 50° latitude, being considered until very recently devoid of significant ionospheric disturbances and irregularities [
3]. Advances in observational techniques and the increasing use of GNSS data to perform the Total Electron Content (TEC) measurements, which are widely used for ionosphere diagnostics, show that ionospheric disturbances at middle latitudes occur more often than previously thought [
2,
3,
4,
5,
6], including [
4,
7], based on bibliographical research, where a brief review of ionospheric disturbances at mid-latitudes can also be found.
The strong effects of space weather at high latitudes on the ionosphere are due to specific geomagnetic field configurations that lead to the coupling of the magnetosphere and the polar ionosphere. At low latitudes, the space weather influence is mainly due to higher insolation (and, consequently, ionization) level, and the presence of the equatorial electrojet (EEJ), a strong electric current in the ionosphere. All these factors lead to variations (spatial and temporal) of the electric and magnetic fields and associated convection of the upper atmosphere, resulting in TEC fluctuations and scintillation events. The ionosphere at middle latitudes is affected by space weather events both directly and due to couplings with polar and equatorial regions [
4,
5,
8,
9,
10,
11].
Besides the latitude, other factors related with the ionospheric TEC fluctuations must also be considered, such as seasonal variation, longitude, time of the day, solar cycles, and geomagnetic activity [
12]. In [
13], a comparative analysis of studies related to the latitudinal or longitudinal dependences of ionospheric responses can be found. This work also focuses on the seasonal impact on the ionosphere and the global effect on TEC values along three meridians (American, Euro-African, and Asian-Australian) based on six geomagnetic storms of different intensities to find similarities or differences in TEC response.
This work intends to contribute to the understanding of geomagnetic storms driving ionospheric disturbances at middle latitudes, in the longitudinal direction across the Atlantic Ocean from mainland Portugal to the Azores (~9° W to ~26° W, respectively) and at different latitudes (mainland Portugal and the Azores at ~40° N versus Madeira at ~30° N), through the comparative study of eight geomagnetic storms from 2015 to 2022. To the best of our knowledge, there are few studies for this region, despite being geographically very attractive, since it is located on the western borders of the coverage of the European Geostationary Navigation Overlay (EGNOS), the satellite-based augmentation system (SBAS) for GNSS (such as GALILEO).
The paper is structured as follows:
Section 2 describes the data and methods used in our analysis,
Section 3 refers the results obtained, and
Section 4 gives a discussion with the main conclusions.
2. Materials and Methods
The ionospheric disturbances were studied for eight geomagnetic storms between 2015 and 2022, corresponding to the descending phase of the solar cycle 24, whose maximum was in 2014 and the beginning of the solar cycle 25, which started in December 2019.
2.1. Total Electron Content Data
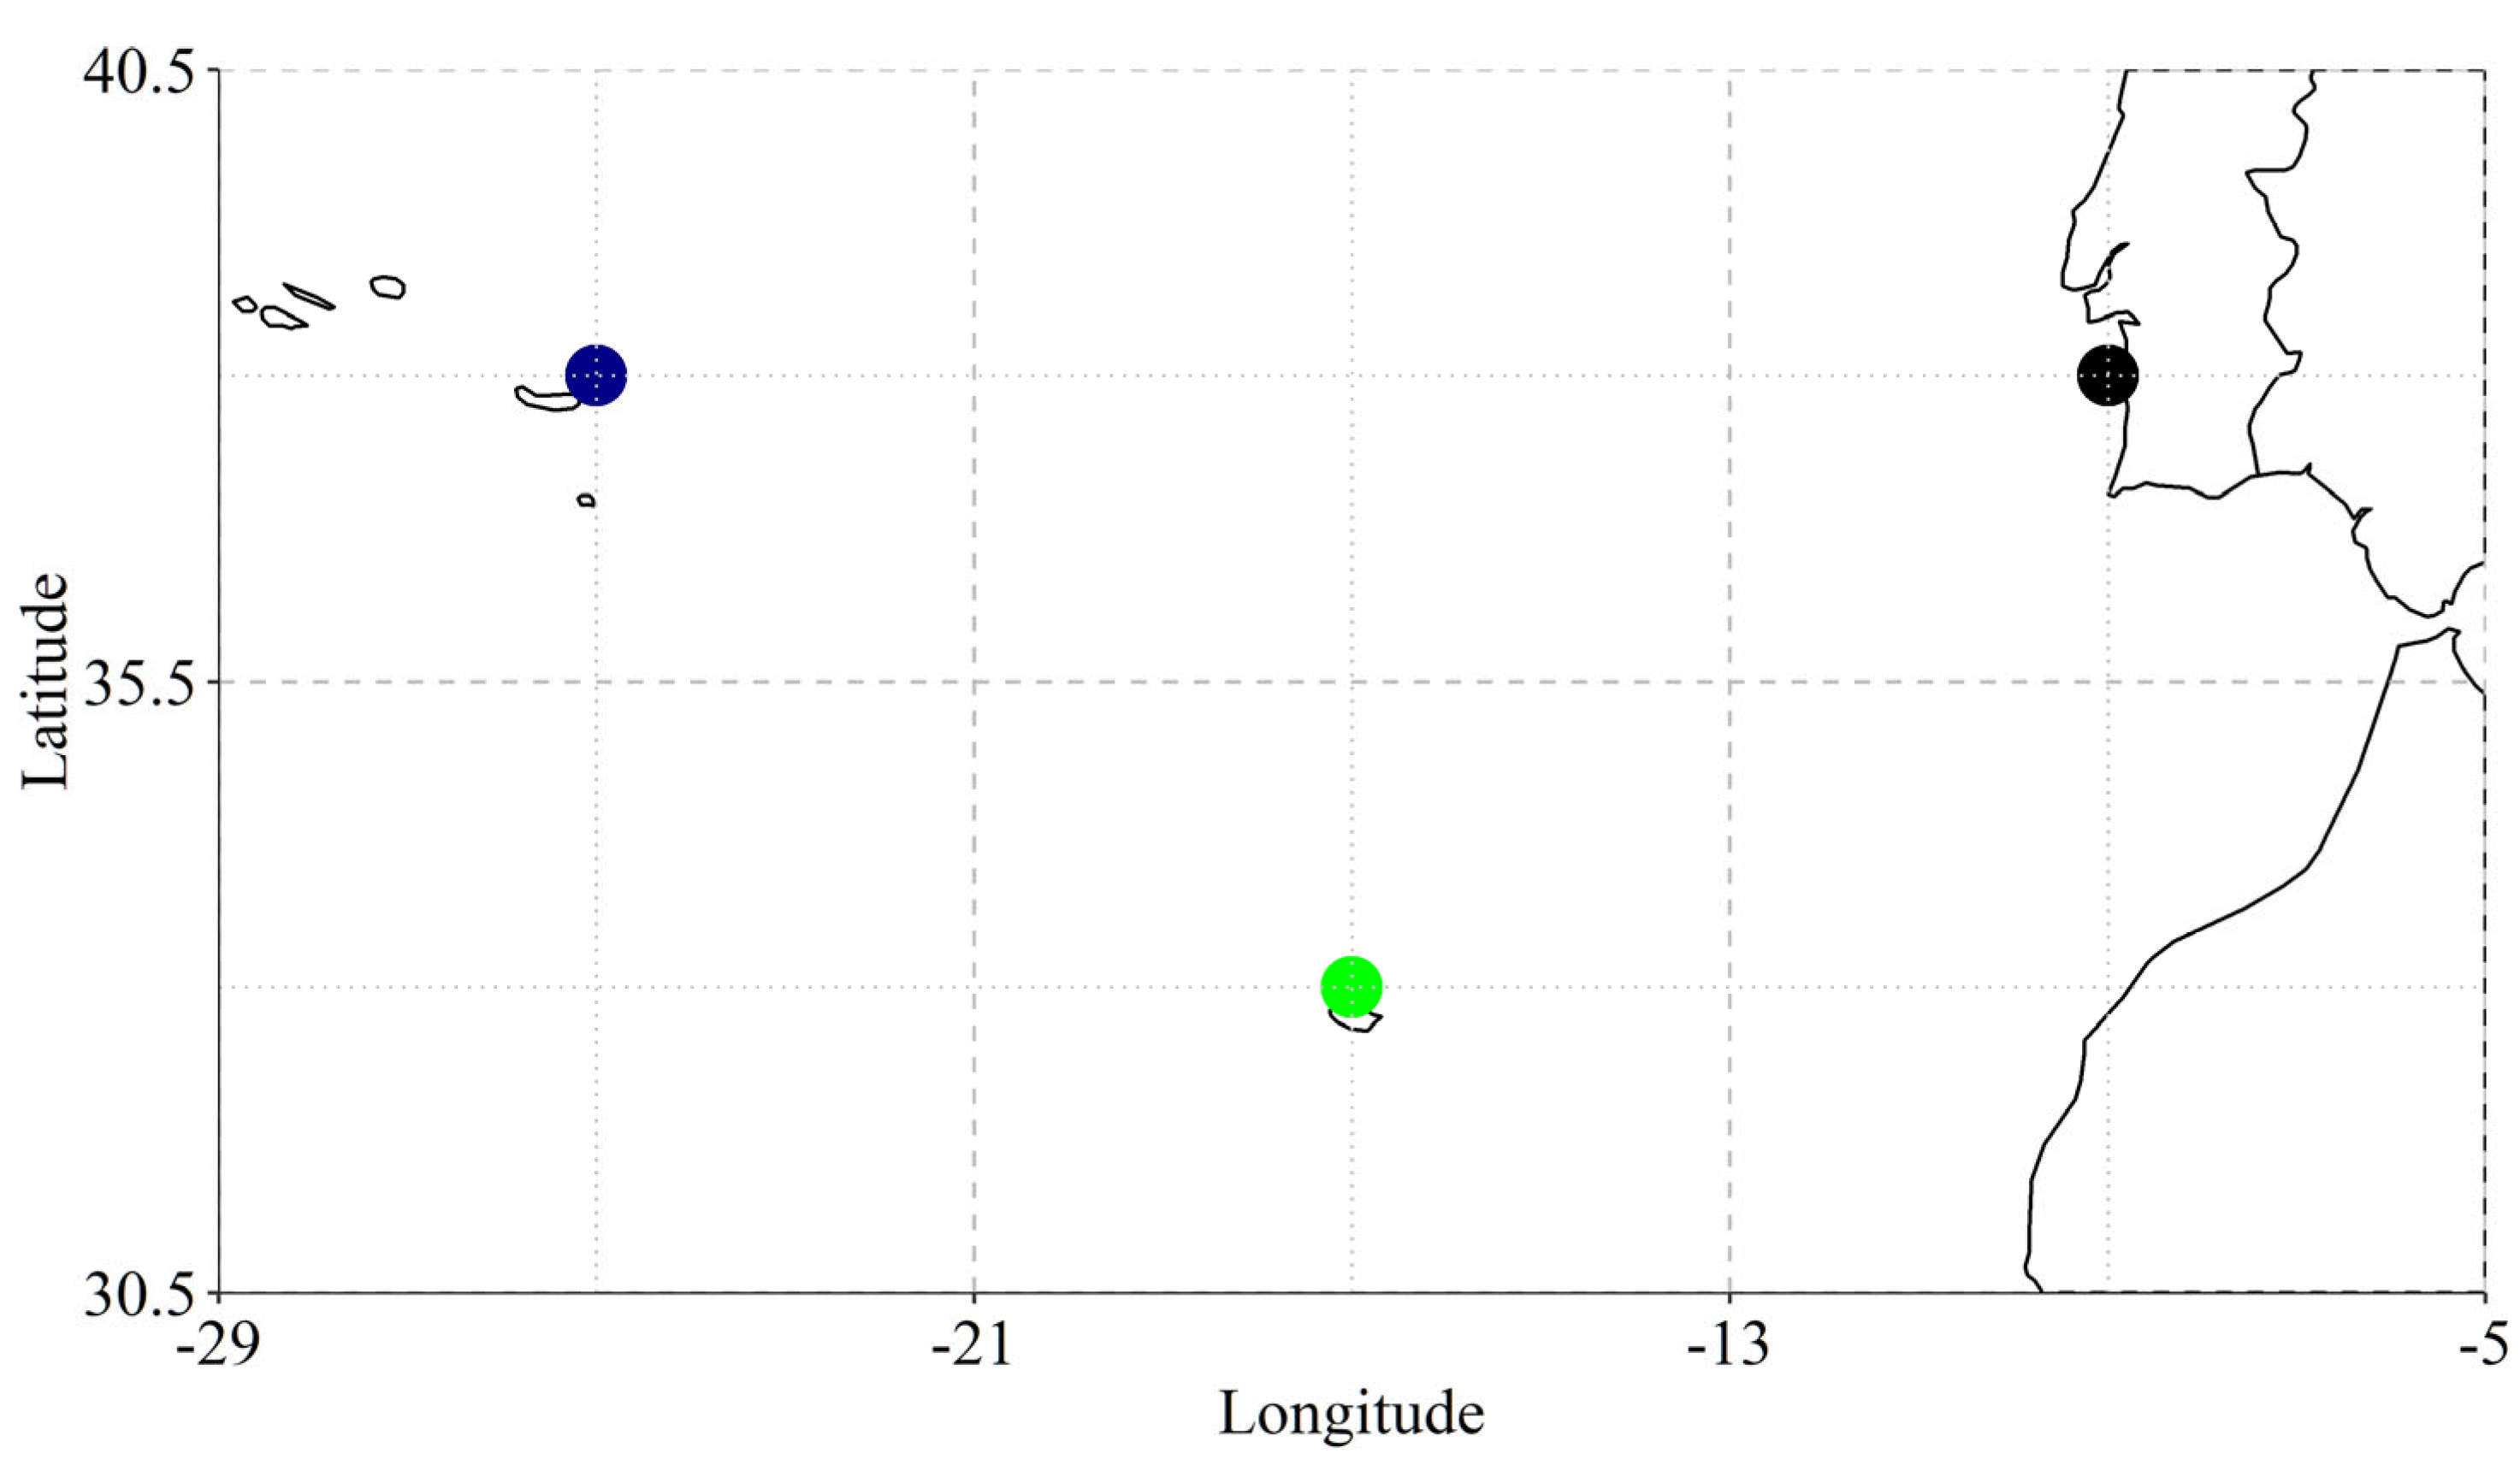
The TEC series were collected for three locations: Continental Portugal, area around Lisbon; the Azores archipelago, area around the Santa Maria; and São Miguel islands and the Madeira archipelago, area around Funchal city—see
Figure 1.
The TEC data are GNSS TEC data obtained from SCINDA and RINEX files. For the Lisbon location, there were three data sources:
Data from a GNSS receiver installed in the area of the Lisbon airport between 2014 and 2019. The data are available at [
14,
15] and described in [
16,
17]. Since the calibration procedure was not performed during the installation of this receiver, a provisional calibration of the TEC records using TEC data from the Royal Observatory of Belgium (ROB) as a reference was performed, as described in [
17]—hereafter, Lis-SCINDA TEC.
Data from a GNSS receiver installed in the same area during the SWAIR (
https://about.swair.ptech.io/ (accessed on 26 April 2023)) project (calibrated and in TECu)—hereafter, Lis-SWAIR TEC.
Data obtained from a RENEP (Rede Nacional de Estações Permanentes GNSS,
https://renep.dgterritorio.gov.pt/ (accessed on 26 April 2023)) receiver at Lisbon—hereafter, Lis-RENEP TEC.
For the Azores, there were two data sources:
For Madeira, there was one data source: data obtained from a RENEP receiver at Funchal—hereafter, Mad-RENEP TEC.
The coordinates of all these receivers are shown in
Table 1.
RAEGE-Az provides data in the RINEX 3.0 format. These files were processed and calibrated using software developed by the UPC-IonSAT team [
21,
22]. This software allows the reading of RINEX 3.0 files to obtain an ionospheric (geometry-free) combination of dual-frequency carrier phases L1–L2, download satellites RINEX 3 broadcast ephemeris files in SP3 format to calculate non-calibrated slant TEC (i.e., affected by the carrier phase bias) from each of the available satellite and receiver, and to use UQRG GIMs to calibrate slant TEC and calculate vertical TEC, from dual-frequency carrier phase measurements only.
TEC series for all the receivers were averaged to have 1 h time resolution. Variations of TEC during geomagnetic storms were studied as differences between the observed TEC and the mean quiet TEC variation: ΔTEC = TEC − TECQD. TECQD was calculated as an average daily TEC variation for quiet days (days without geomagnetic disturbances) of the given studied month. Only ΔTEC values exceeding the ±2σ limits were considered to be statistically significant, where σ is the maximum standard deviation for all available quiet TEC series for a studied month.
2.2. Space Weather Data
To identify and characterise geomagnetic storms, we used the Dst geomagnetic index from the OMNI data base (
https:/omniweb.gsfc.nasa.gov (accessed on 26 April 2023)) with 1 h time resolution. The geomagnetic storms were selected taking into account the availability of TEC data for all three locations and the strength of storms (only storms with min Dst < −90 nT were selected). Please note that in this study we used Dst only as a marker of a storm, and did not aim at statistical analysis of ΔTEC in relation to min Dst (especially considering a small number of analysed geomagnetic disturbances).
3. Results
As mentioned above, studies of TEC irregularities are mainly focused on the northern hemisphere at high latitudes, the equatorial region, and the South Atlantic Anomaly, with minor attention to European and North Atlantic middle latitudes. Additionally, relations between TEC variations and position errors (or other faults) of GNSS systems are not always addressed [
23]. In this work, we focus on the ionospheric response to geomagnetic storms at the North Atlantic middle latitude region (Portugal, Azores, and Madeira) with emphasis on TEC variations and consequences for the GNSS signal found in other studies and reports.
3.1. Geomagnetic Storm of January 2015
The first storm of 2015 was a relatively strong storm (min Dst = −107 nT) that occurred on 7 January 2015. It was, most probably, related to a CME that occurred four days before, on 3 January 2015 [
24]. Other manifestations of the solar activity occurred in the following days, such as a coronal hole near the south pole and another at low latitudes in the northern solar hemisphere. The flare activity was considered medium, and on 5 January, another CME occurred, but it is unlikely to be related to the storm (see [
24]). The storm was preceded by weak geomagnetic disturbances on 4–5 January 2015—see
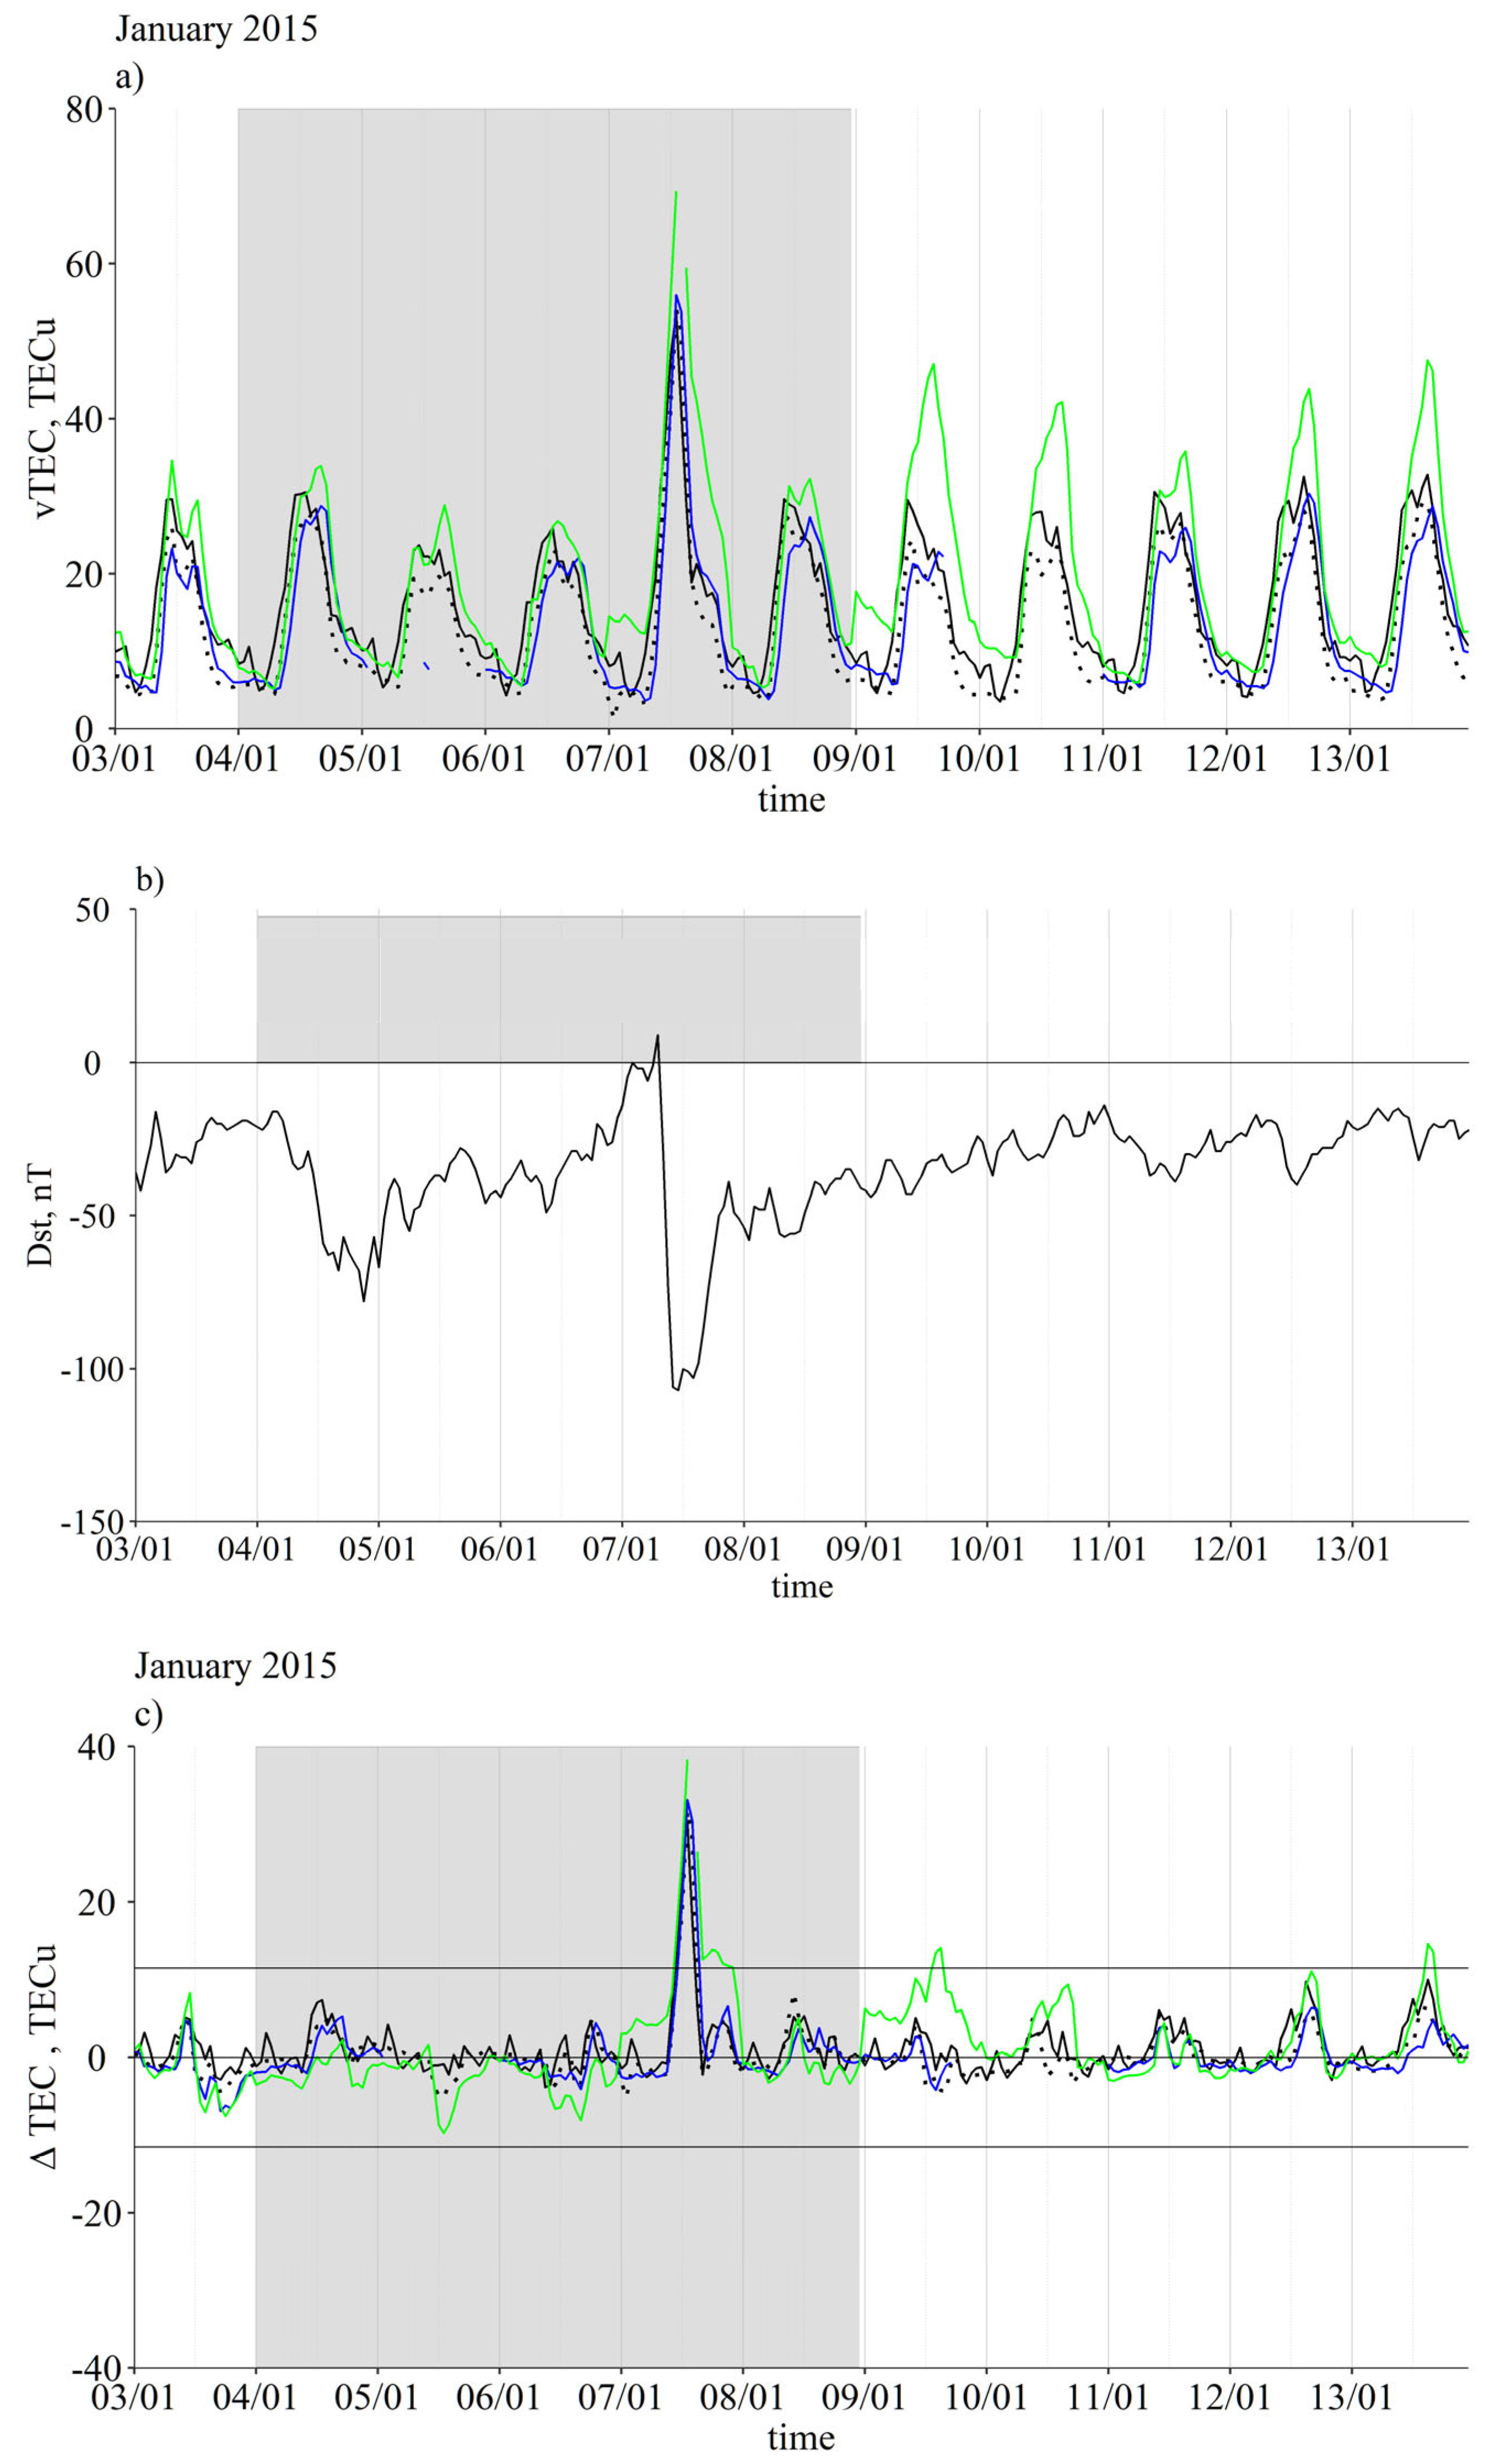
Figure 2b.
Figure 2.
Variations of TEC and Dst during January 2015. For this and similar plots, (a) variations of TEC measured at the three locations: Lisbon (black lines: Lis-SCINDA—solid line, Lis-SWAIR—dashed line, Lis-RENEp—dotted line), Azores (blue lines: Az-RAEGE—solid line, Az-RENEP—dashed line), and Madeira (Az-Madeira—green solid line). (b) Variations of Dst. (c) Variations of ΔTEC the three locations. Horizontal lines mark ±2σ limits for ΔTEC.
At the region under study, this geomagnetic storm caused an increase of TEC during 7 January 2015 by 30–40 TECu (
Figure 2a,c). The weak geomagnetic disturbances on 3–4 January 2015 had no strong ionospheric consequences (ΔTEC was inside ±2σ limits). The maximum ΔTEC values at Lisbon and Azores were approximately the same and lower by ~5 TECu than the maximum ΔTEC at Madeira. Additionally, ΔTEC at Madeira has a second increase in the afternoon hours of 7 January 2015, and also exceeded the 2σ limit on 9 January, during the recovery phase of the storm.
Supplementary Figure S1 shows animations of changes of the average ΔTEC (in σ units) for each location from 6 January to 10 January 2015 with 1 h cadence.
As one can see, the ionospheric storm began on 7 January 2015 at 10 h UTC, reached its maximum at 12 h UTC, and the ionosphere began to recover at around 16 h UTC (except for Madeira). There were no significant ionospheric disturbances during 8 January 2015, but on 9 January 2015, small ionospheric disturbances of ~2σ for Lisbon-Azores and >2σ for Madeira were observed. Whether they are related to disturbances in the equatorial electrojet (EEJ) is not yet clear.
This storm provoked TEC fluctuations on 7 January 2015 at high latitudes, with the consequent degradation of the accuracy of GPS positioning, as reported by [
25].
3.2. Geomagnetic Storm of March 2015
This storm, called the St. Patrick’s geomagnetic storm of 2015, occurred on 17 March 2015. It is very well described in the literature (e.g., [
8,
26,
27,
28,
29]), since it was the most severe storm of the solar cycle 24 [
30]. TEC variations during this storm for the Iberian Peninsula were previously described in [
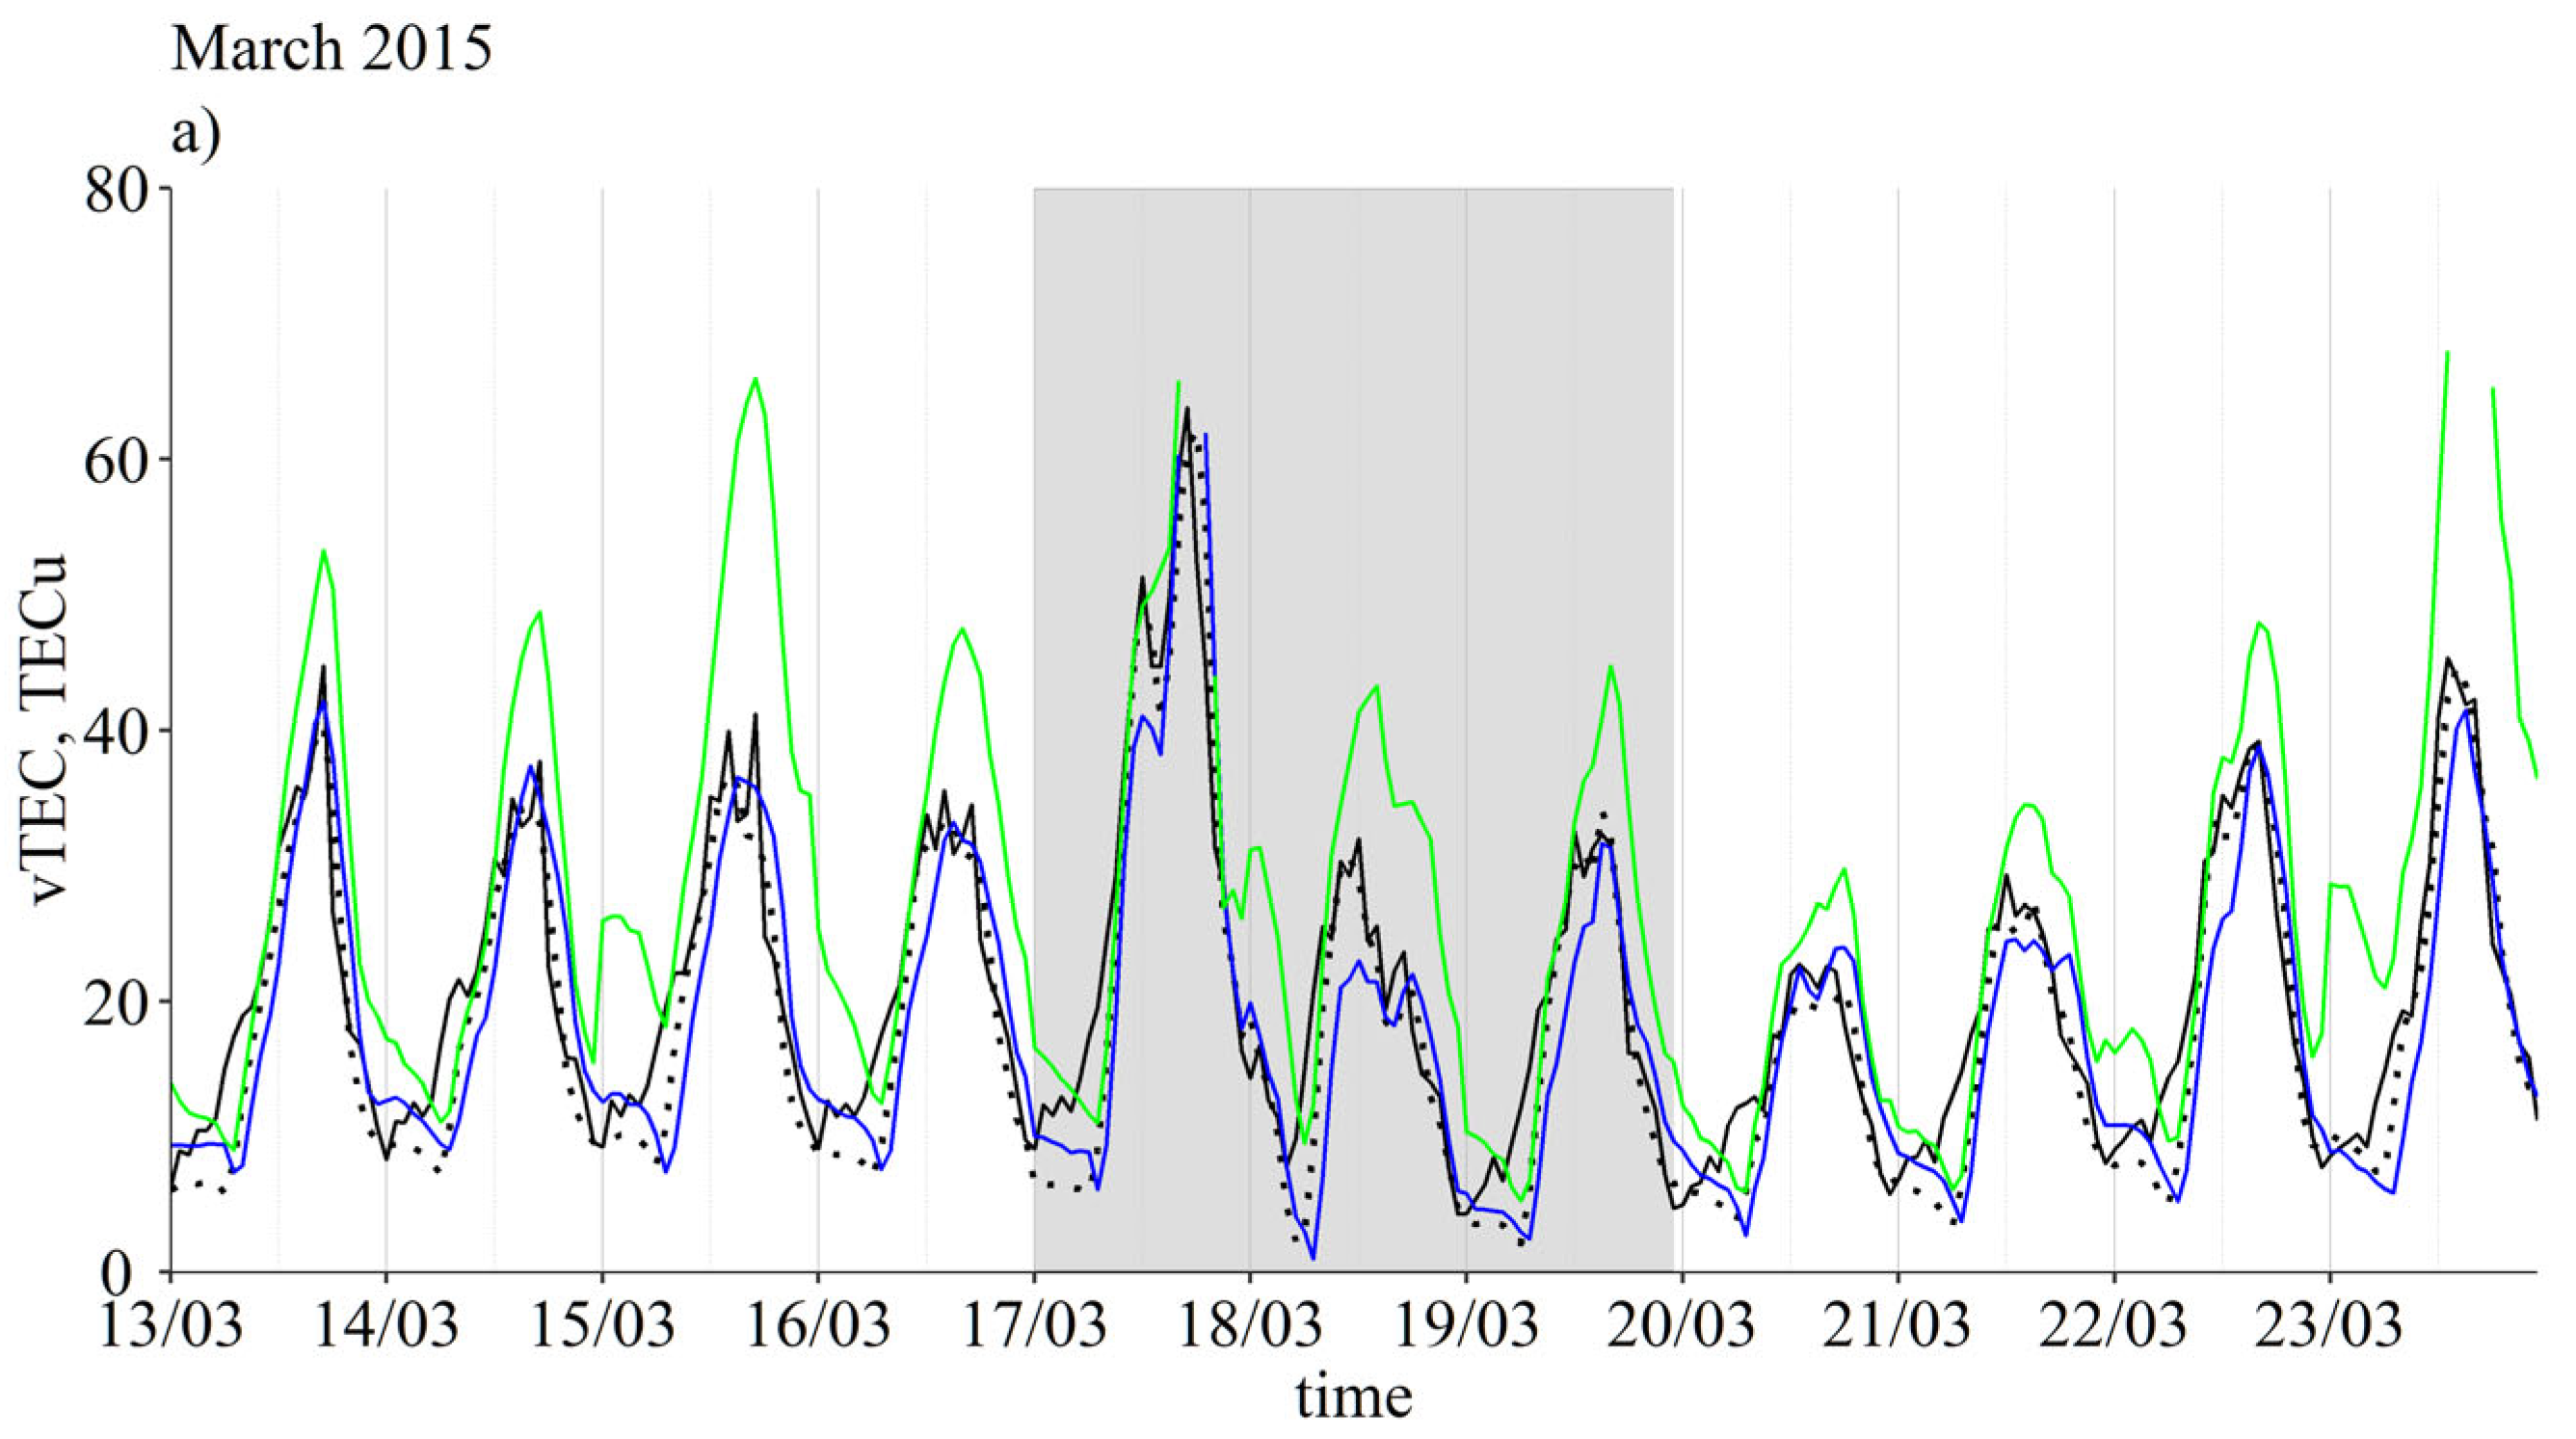
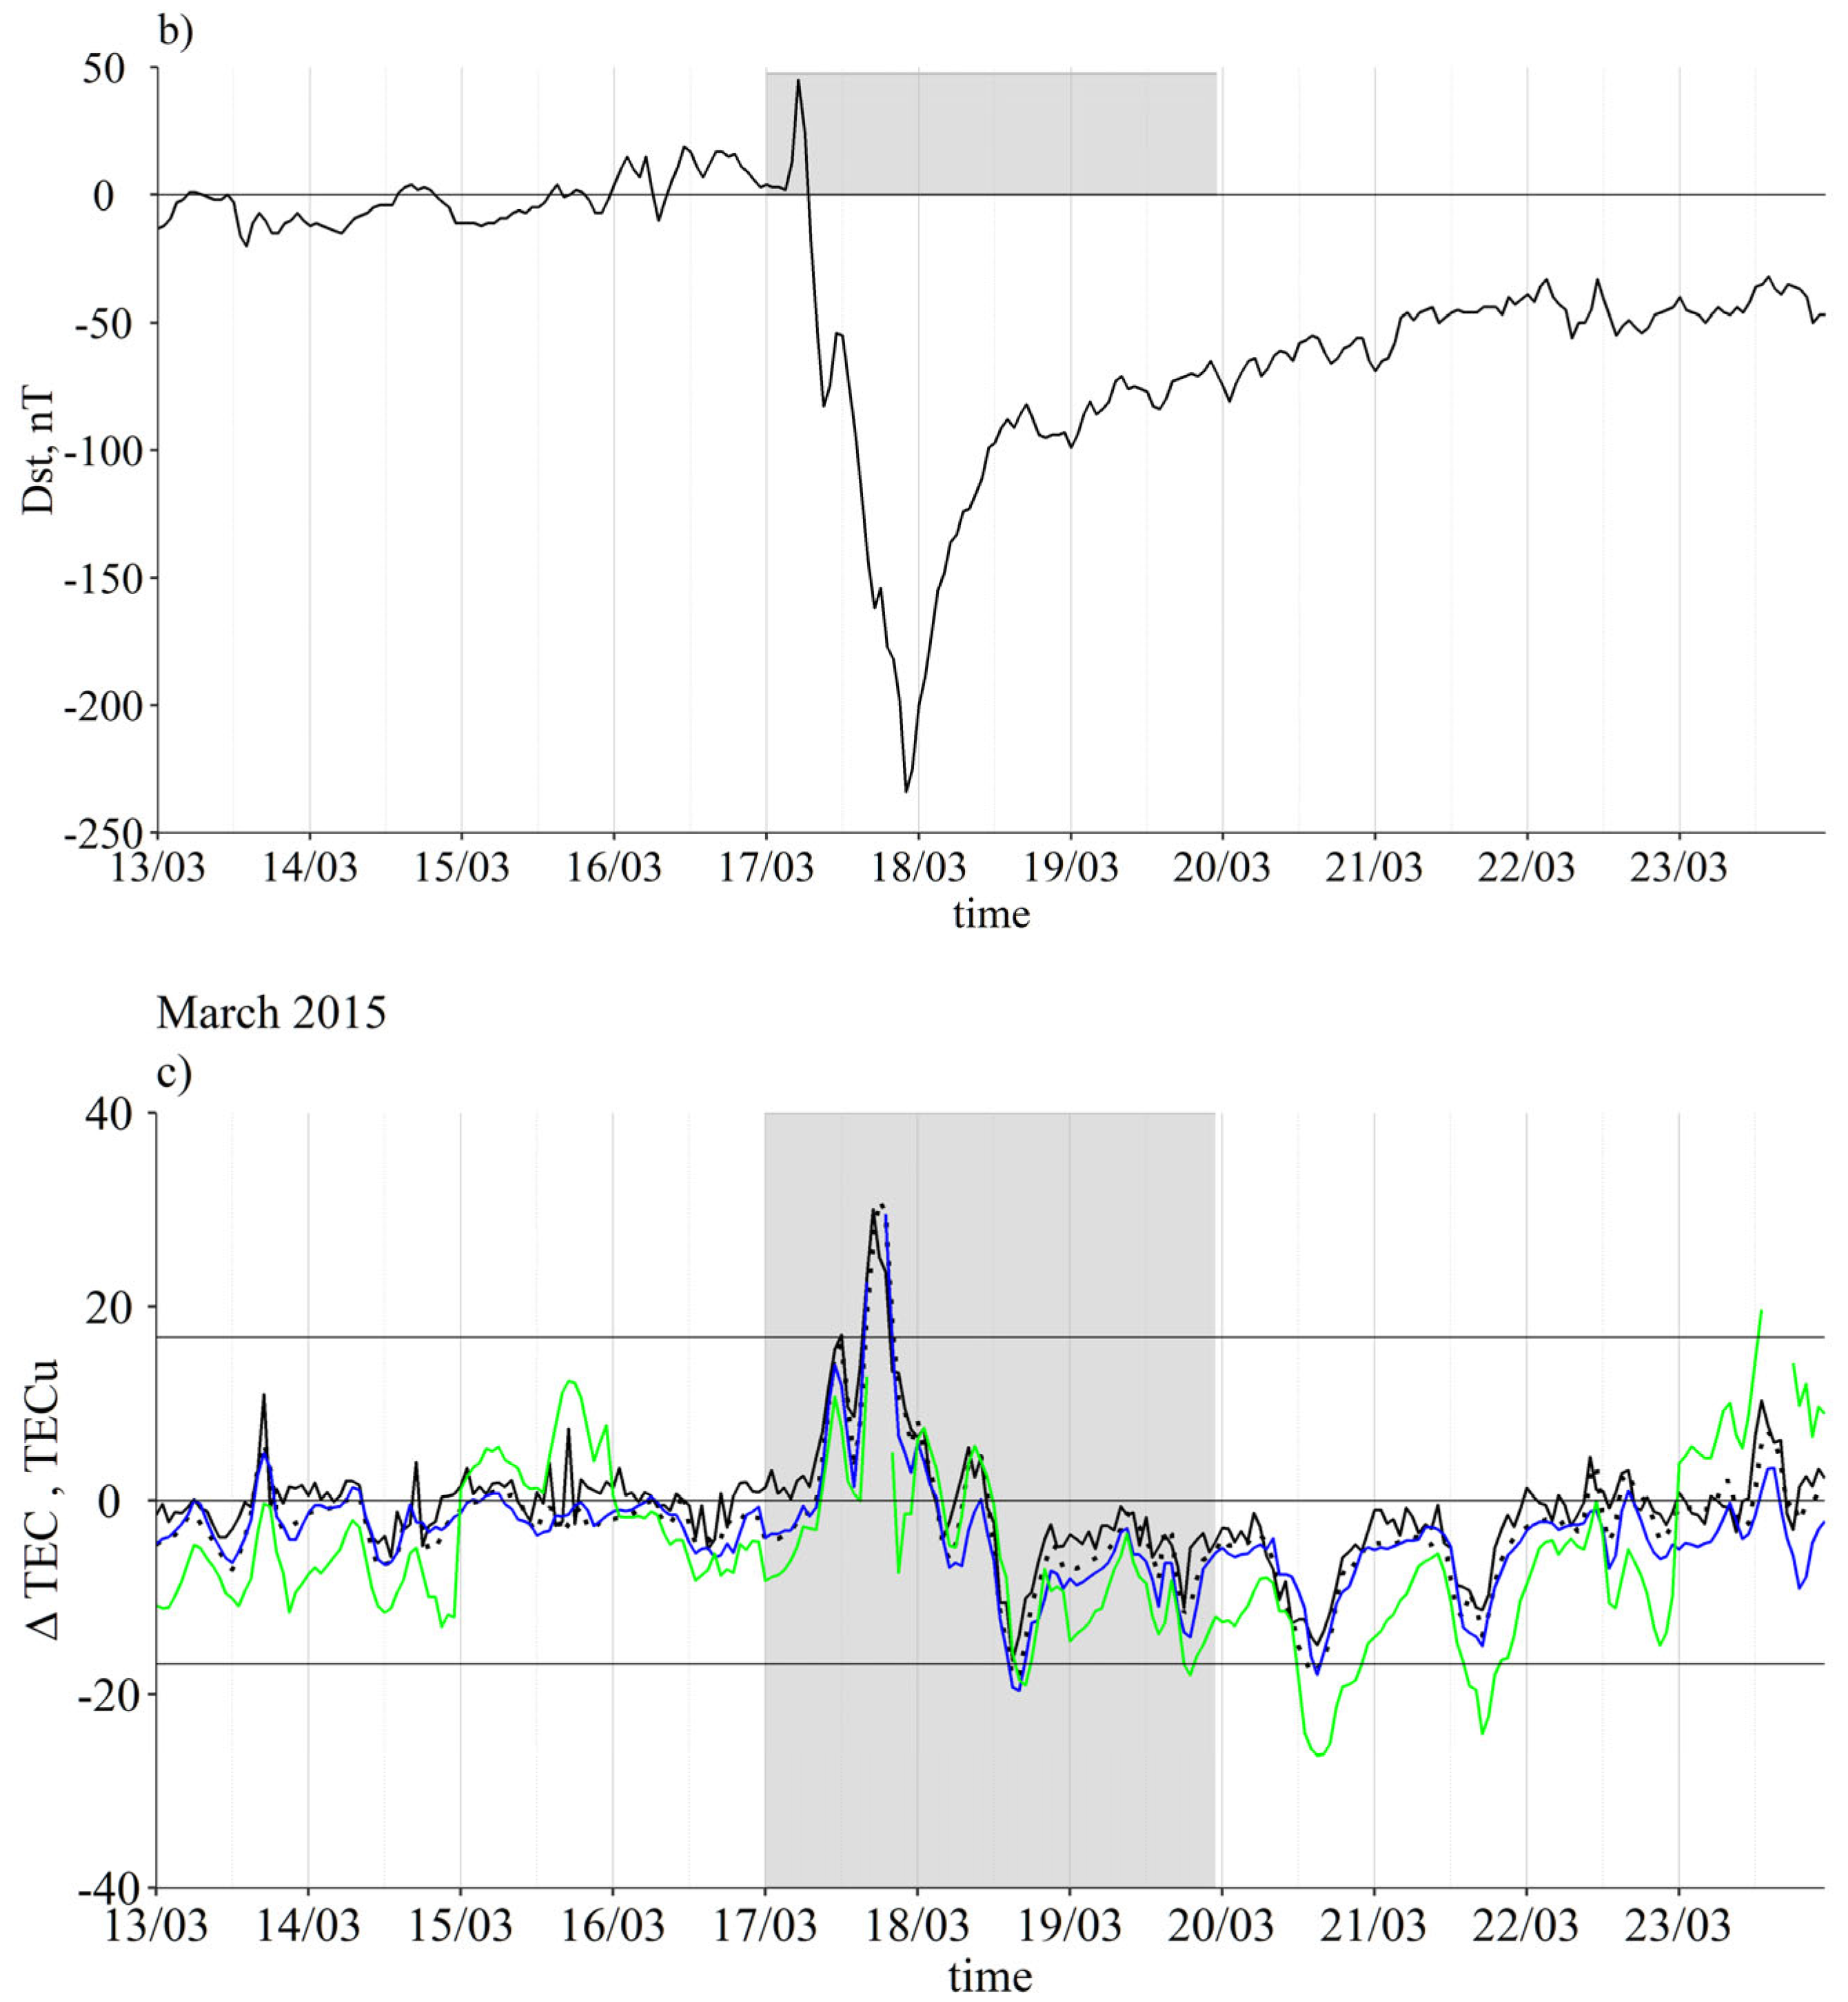
5]: this geomagnetic storm resulted in a positive–negative ionospheric storm (increase of TEC (positive ΔTEC) during the day of the storm and decrease of TEC (negative ΔTEC) during the following day). A comparison of the TEC variations for Lisbon, Azores, and Madeira (
Figure 3a,c) shows that for all locations, the TEC variations are synchronous (have the same dynamics and very similar amplitudes inside time intervals of 1 h), though the amplitude is higher for the most southern location, Madeira, probably due to the effect of EEJ.
Supplementary Figure S2 shows the variations of an average ΔTEC (in σ units) for each location from 16 March to 20 March 2015 with 1 h cadence.
Figure 3.
Variations of TEC and Dst during March 2015 (see detailed description in
Figure 2a–c).
Figure 3.
Variations of TEC and Dst during March 2015 (see detailed description in
Figure 2a–c).
The ionospheric storm started in the morning of 17 March 2015 first at Lisbon, then at Azores and Madeira. Maximum ΔTEC were observed in the afternoon of 17 March 2015 near and after the local sunset. TEC variations during the night were small, but starting from midday of 18 March 2015, ΔTEC decreased below −2σ for all locations.
A fast recovery to the quiet level was observed on 19 March 2015, but on 20 March 2015, there was another decrease of TEC due to a partial solar eclipse that was observed at this region around 09:00 UT, with the maximal obscuration of 60% at Lisbon, 65% at Madeira, and 70% at Azores. This eclipse or, more precisely, the atmospheric gravity waves generated by the Moon’s shadow passing through the atmosphere, caused traveling ionospheric disturbances (TIDs) occurring over Europe [
31,
32,
33]. The results of our analysis support a conclusion of [
32] that the recovery of the ionisation rate was faster at higher latitudes: as one can see from
Figure 3c: ΔTEC at Madeira (~30° N) was larger in the absolute values and recovered slower compared to TEC at ~40° N (Lisbon and Azores).
One of several examples of the impact of this storm on GNSS systems can be found in [
34]. Based on measurements of 15 reference stations from the ASG-EUPOS network (Poland), the results have found degradation of the position quality determined by GNSS and decreased GNSS accuracy due to ionospheric perturbations in Central Europe. Strong GNSS disturbances with reflexes on positioning errors were detected in Norway [
35]. Those examples are supported by the study of [
36], based on 5500 GNSS stations installed worldwide. The results show that the overall impact on GNSS positioning was more severe at high latitudes and related to ionospheric plasma irregularities. At low latitudes, the degradation was associated with various ionospheric disturbances, such as the equatorial ionosphere anomalies.
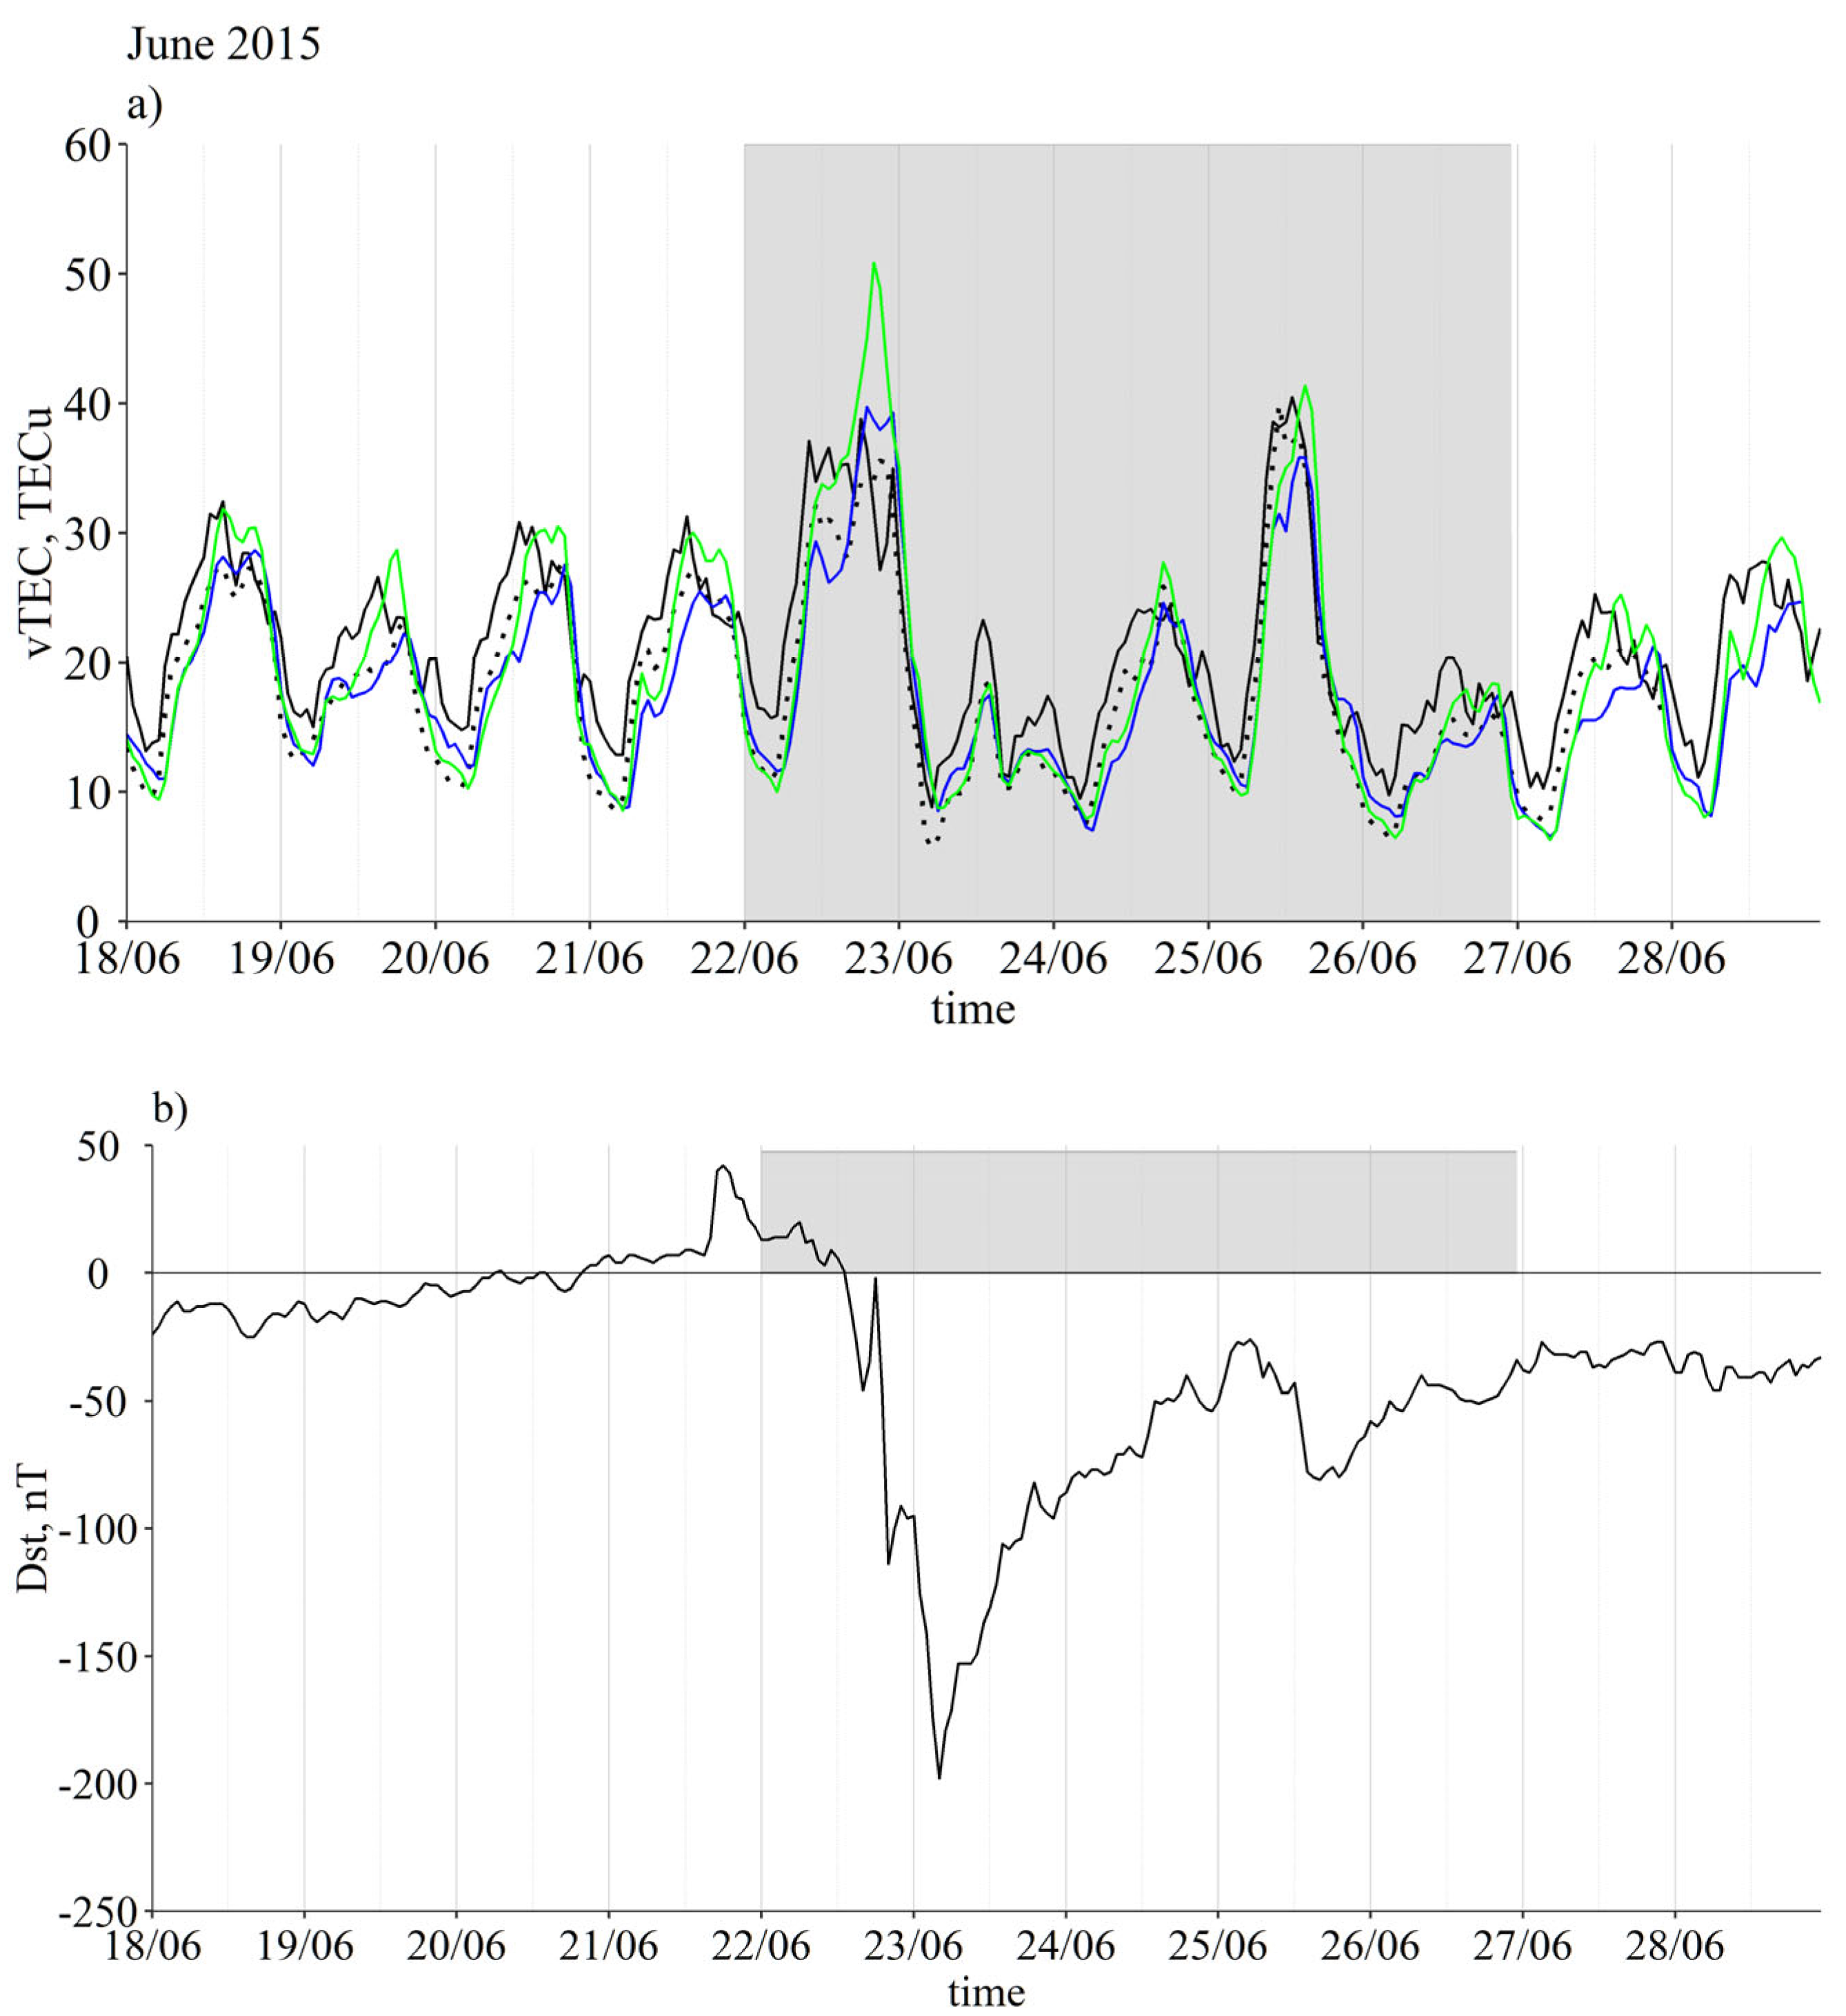
3.3. Geomagnetic Storm of June 2015
The second strongest geomagnetic storm of cycle 24 was due to three consecutive CMEs, the first two associated with a filament and the third with a solar flare of the M2.6 intensity [
37]. The severe storm of 23 June 2015 was studied globally based on TEC values of GIMs, COSMIC radio occultation, and IGS stations [
38]. During the initial period of the storm, the response of the ionosphere was asymmetric concerning the hemispheres, mainly due to seasonal effects, with a negative phase of the storm observed in most of the northern hemisphere and a positive phase in the southern hemisphere and western longitudes of the northern hemisphere, over the North Atlantic Ocean. The effect of this storm on TEC for the Iberian Peninsula was also described in [
5].
This ionospheric storm was caused by a two-fold geomagnetic storm with the main Dst decrease on 22–23 June 2015 and a secondary decrease on 25 June 2015—see
Figure 4b. As a result, two positive–negative ionospheric storms were observed on 22–23 June 2015 and 25–26 June 2015, respectively (
Figure 4a,c and
Figure S3). The amplitude of ΔTEC was above 2σ (in absolute values) for the main storm and about 2σ for the secondary storms for all studied locations. No significant differences in the ionospheric behaviour at different latitudes and longitudes were found.
Figure 4.
Same as
Figure 2a–c, but for June 2015.
Figure 4.
Same as
Figure 2a–c, but for June 2015.
As was reported in [
39], post-sunset equatorial plasma bubbles were generated and reached ~30–45° N at the European sector during this geomagnetic storm. It seems that the sharp increase of TEC (
Figure 4a–c) observed at all three locations in the late evening of 23 June 2015, and most strongly at Madeira, is related to this set of plasma bubbles.
These geomagnetic and ionospheric storms caused problems with the precision of the GNSS positing, well described in [
40]. This study also covers GNSS positioning deteriorations during the St. Patrick’s storm of 2015 and the geomagnetic storm of August 2018 (Greenland region only), described below.
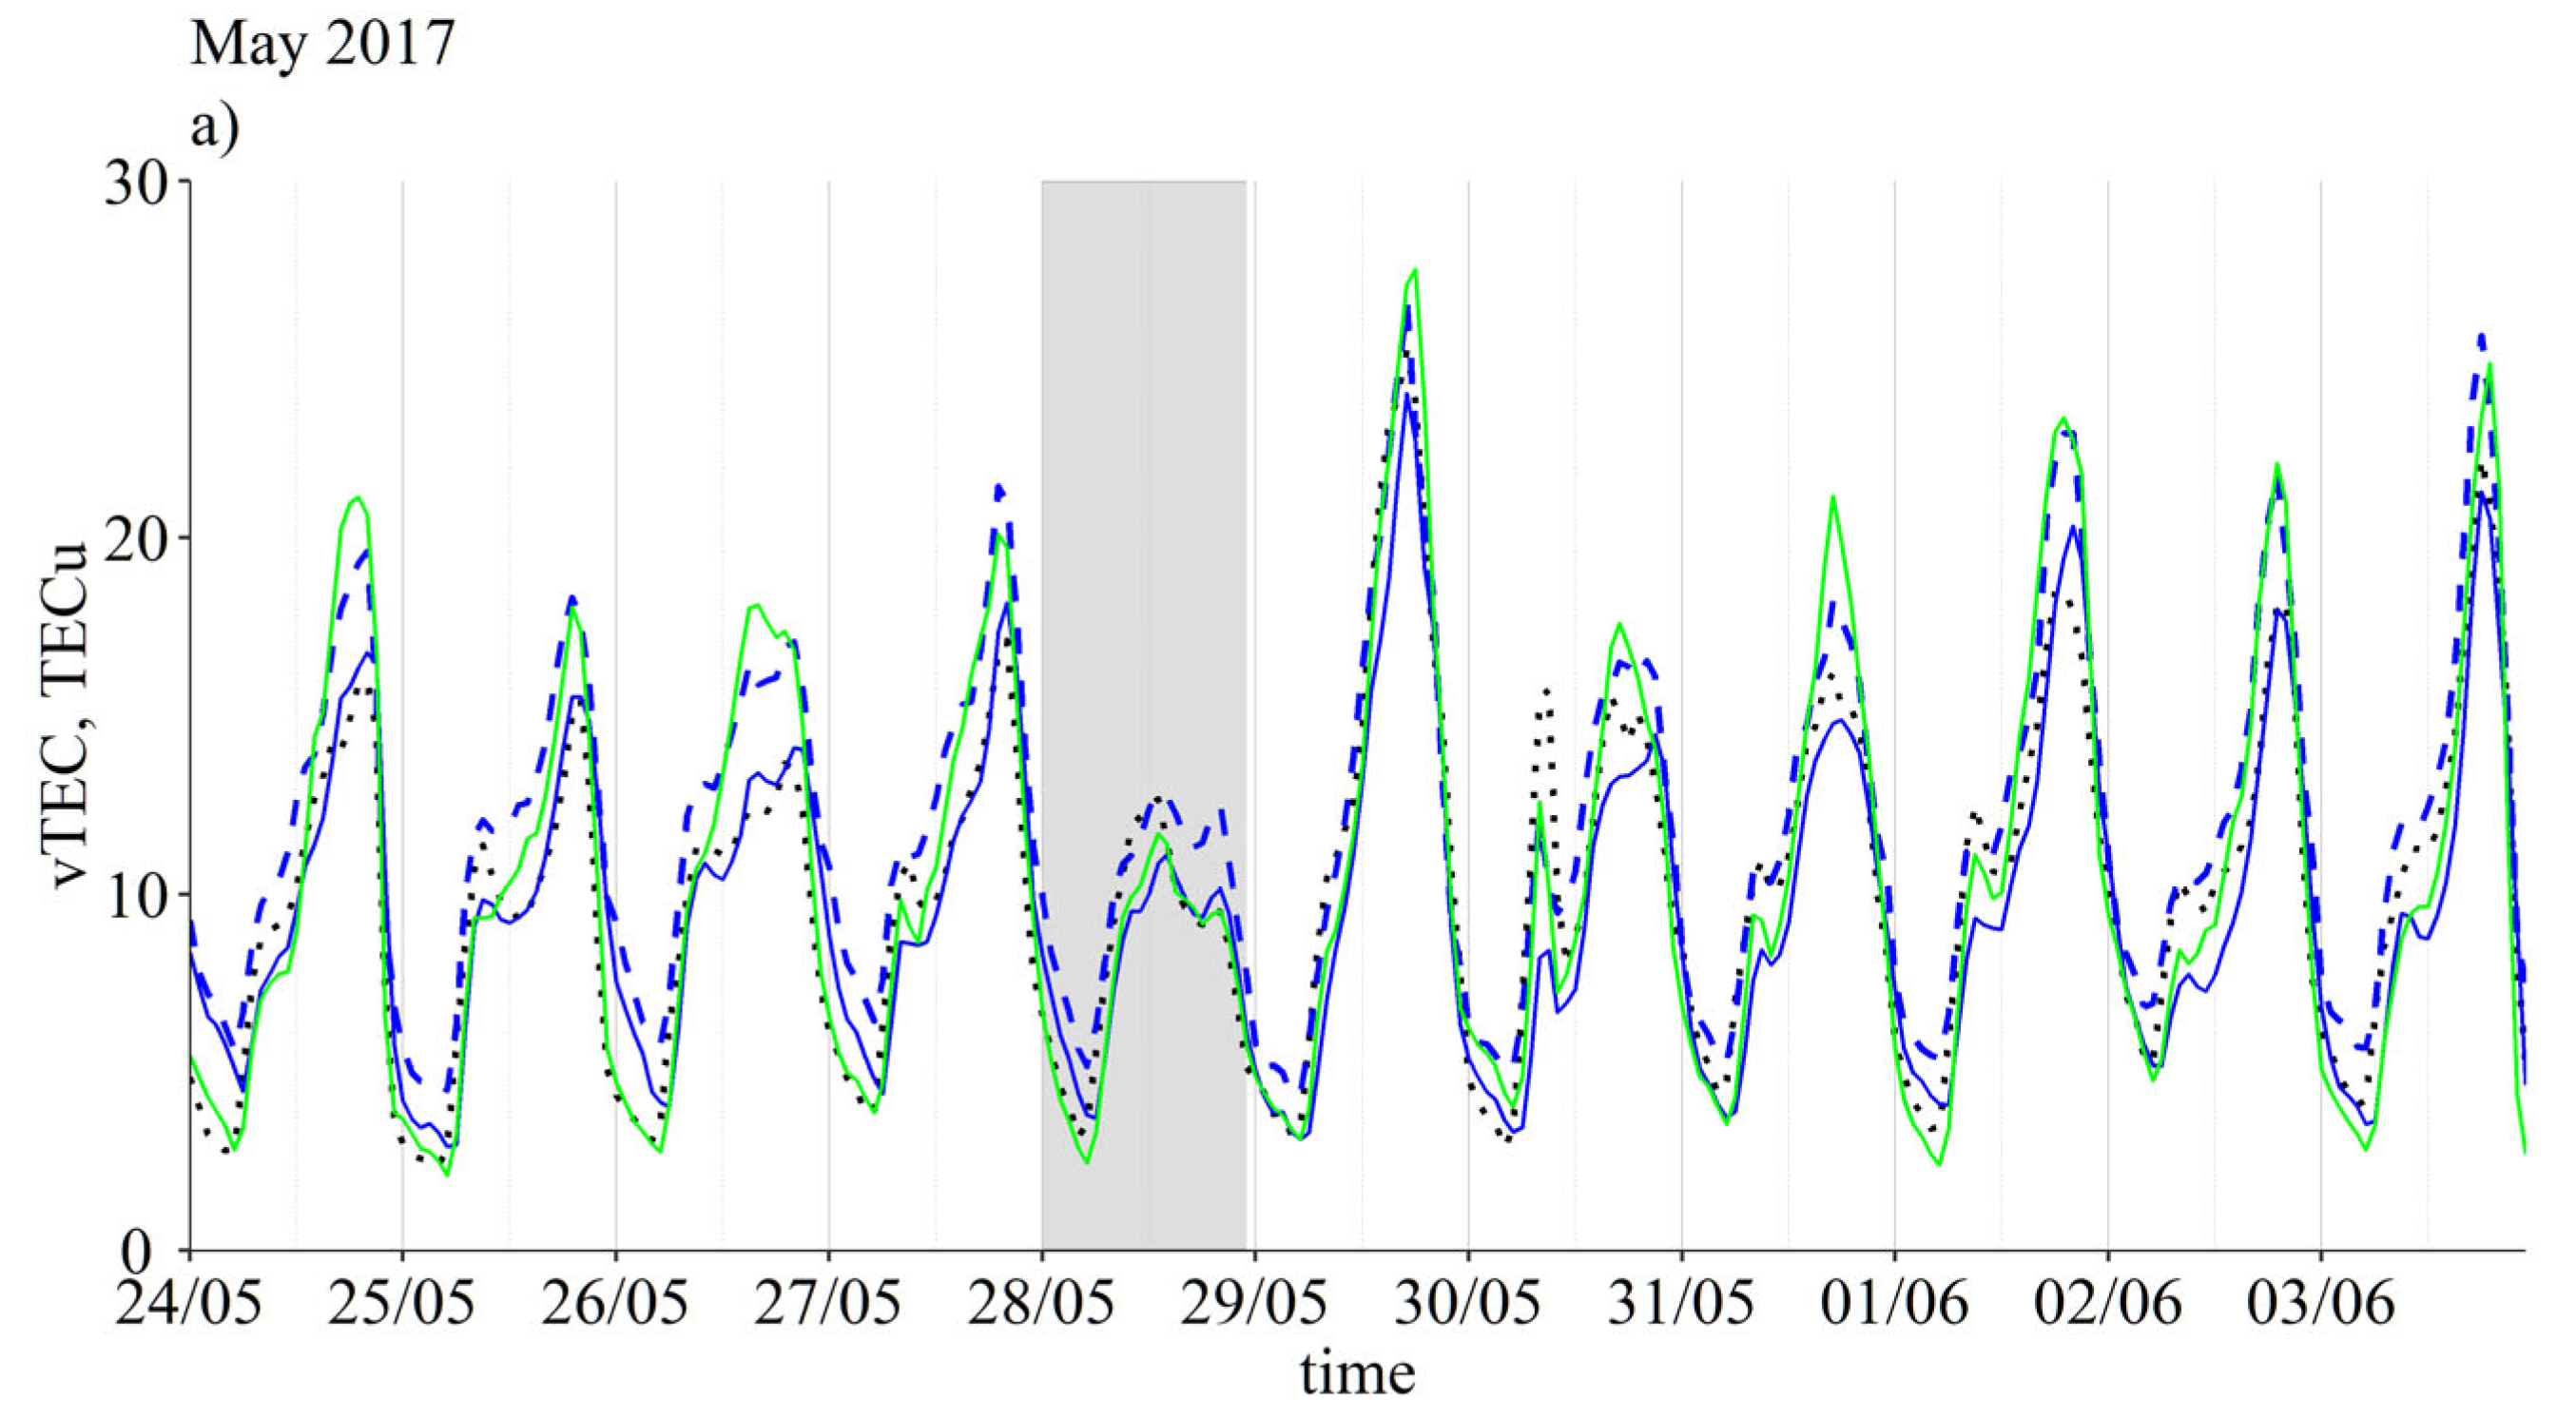
3.4. Geomagnetic Storm of May 2017
An Earth-directed CME on 23 May 2017 resulted in a geomagnetic storm from 27 May to 29 May 2017, initially due to fast changes in solar wind speed and pressure increase at the shock front [
41].
Contrary to the storms of 2015 discussed above, the ionospheric storm of 28–29 May 2017 was a negative–positive storm. This is probably because the geomagnetic storm commencement took place on the late evening of 27 May 2017 and the geomagnetic storm was already well developed to the local morning hours of 28 May 2017 (
Figure 5b), resulting in a strong decrease of TEC during this day: ΔTEC were ~−2σ for Lisbon and Azores and <−2σ for Madeira—see
Figure 5a,c and
Figure S4. On the following day, the ΔTEC was above +3σ for all three locations.
Figure 5.
Same as
Figure 2a–c, but for May 2017.
Figure 5.
Same as
Figure 2a–c, but for May 2017.
An interesting event was observed in the morning of 30 May 2017: a sharp increase of TEC between 08:00 and 09:00 UTC was observed at all three locations, but it reached the threshold of 2σ for Lisbon and Madeira only. As one can see from
Figure 5c, almost all days between 25 May 2017 and 3 June 2017 had small “jumps” in TEC at about these hours, but only on 30 May 2017 and only for the Lisbon and Madeira locations were these “jumps” of a significant amplitude. We suppose that these TEC variations are not related to a storm effect (the geomagnetic conditions were quiet on 30 May 2017, see
Figure 5c, but caused by post-sunset equatorial plasma bubbles that survived until the morning hours and went too northward during those days, similarly to the case of the late evening of 22 June 2015 (
Figure 4c).
The study performed by [
42] based on in situ and satellite observations (Swarm B and DMSP F15 & 16) of this storm revealed structures corresponding to a plasma blob over the Asian sector. The Earth-directed CME reached Earth on 27 May 2017, and after the impact, it caused two more episodes. On [
43], the authors reported a range error of 1.6–3.2 m at the GPS (Global Position System) L1 frequency during the quietest periods of the storm (20–10 TECu) and a 37 m range error at the GPS L1 frequency for 20–45 TECu values over the India sector [
43]. These values demonstrate the degradation of the performance of GNSS receivers, which is critical for many GNSS applications.
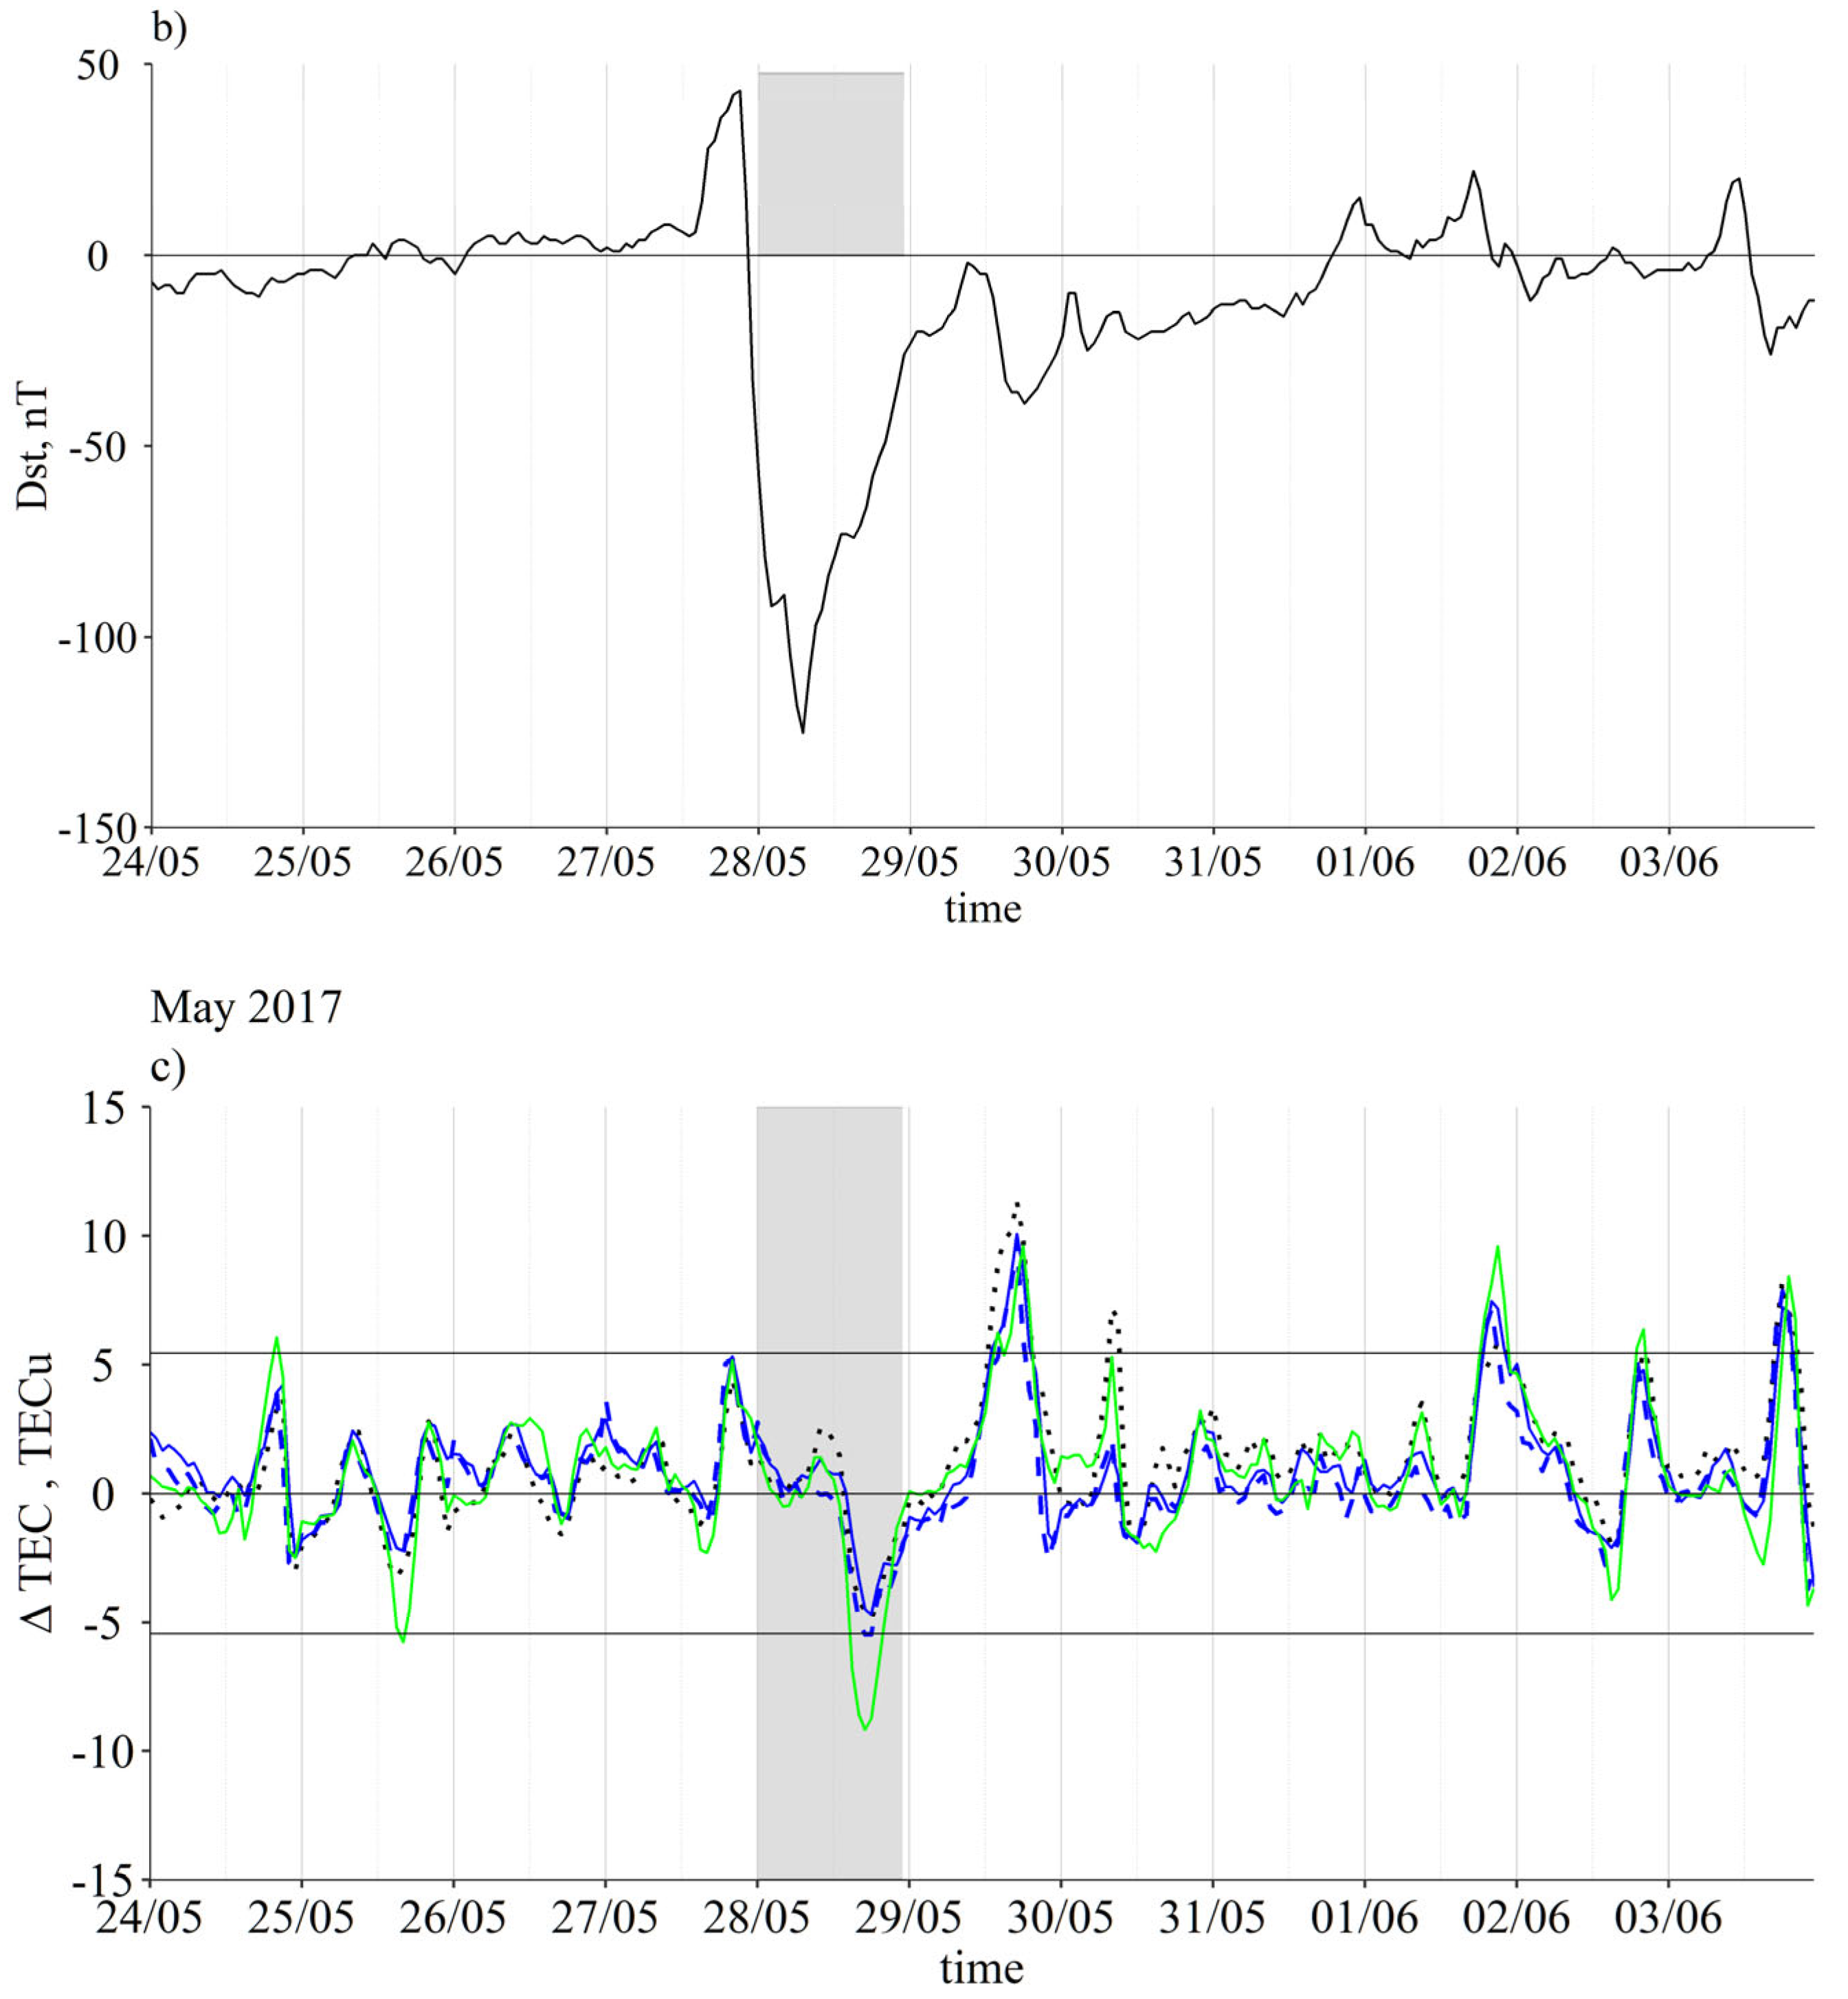
3.5. Geomagnetic Storm of September 2017
At the beginning of September of 2017 (starting from 3 September 2017), the active region NOAA 2673 increased its activity, being the origin of several solar M flares, radio bursts, and CMEs. The geomagnetic storm started at early hours of 7 September 2017 and lasted until 9 September 2017—
Figure 6b. The minimum Dst value reached during this storm is −122 nT.
Figure 6.
Same as
Figure 2a–c, but for September 2017.
Figure 6.
Same as
Figure 2a–c, but for September 2017.
The ionospheric response to this storm in the studied region consisted of a strong positive ionospheric storm on 7 September 2017 (ΔTEC ≥ 2σ at all studied location) and a weak positive ionospheric storm on 8 September seen at Lisbon and Madeira (ΔTEC for the Azores did not reach the 2σ limit)—
Figure 6c and
Figure S5. Additionally, on 7 September 2017, there was an afternoon increase of TEC with ΔTEC < 2σ for Lisbon and Azores (~40° N) and ΔTEC > 2σ for Madeira (~30° N). On the third day of the storm, 9 September 2017, a negative ionospheric storm took place, but with a small amplitude |ΔTEC| ≤ 2σ (
Figure 6a,c).
On 6 September 2017, the Earth-directed CME from an X9.3 flare provoked ionospheric disturbances with consequences for the EGNOS system and GNSS receivers [
44]. During this event, the availability of EGNOS was reduced by 10%, with limited usage for the safety of life applications, such as services to aviation, maritime, and land-based users [
44]. In this paper, the authors describe other examples of how ionospheric perturbations have an impact on GNSS systems, such as the loss of GNSS receivers with links to the GNSS satellite (designated by the loss of lock) and the Automatic Identification System (AIS), an automatic tracking system to improve the safety at sea. In Svalbard, the effect on the GPS positioning was also evaluated and reported in [
45]: due to this ionospheric storm, significant increments of the positioning error were observed during scintillation events. Signal interferences on ground GNSS stations for the European longitude sector (20° N to 70° N) affecting the GNSS single and the dual positioning for Galileo, GLONASS, and GPS were also studied in [
46]; the dual frequency systems were the most affected ones.
Plasma bubbles are ionospheric phenomena typical over equatorial and low latitudes. However, as we discussed above, recent studies, e.g., such as those in [
9], suggest that plasma bubbles can extend to other regions, such as middle latitudes. In these cases, the Travelling Ionospheric Disturbances (TID) could play a role in enabling the latitudinal extension of the bubbles. As demonstrated by the authors in [
9], during this storm, the TIDS facilitated the latitudinal extension of the bubbles over China and adjacent areas (20°–45° N and 80°–110° E). Another example of TID influence, but of different origin, was found in [
47], where fluctuations on TEC indicate TID propagation from high latitudes to lower latitudes.
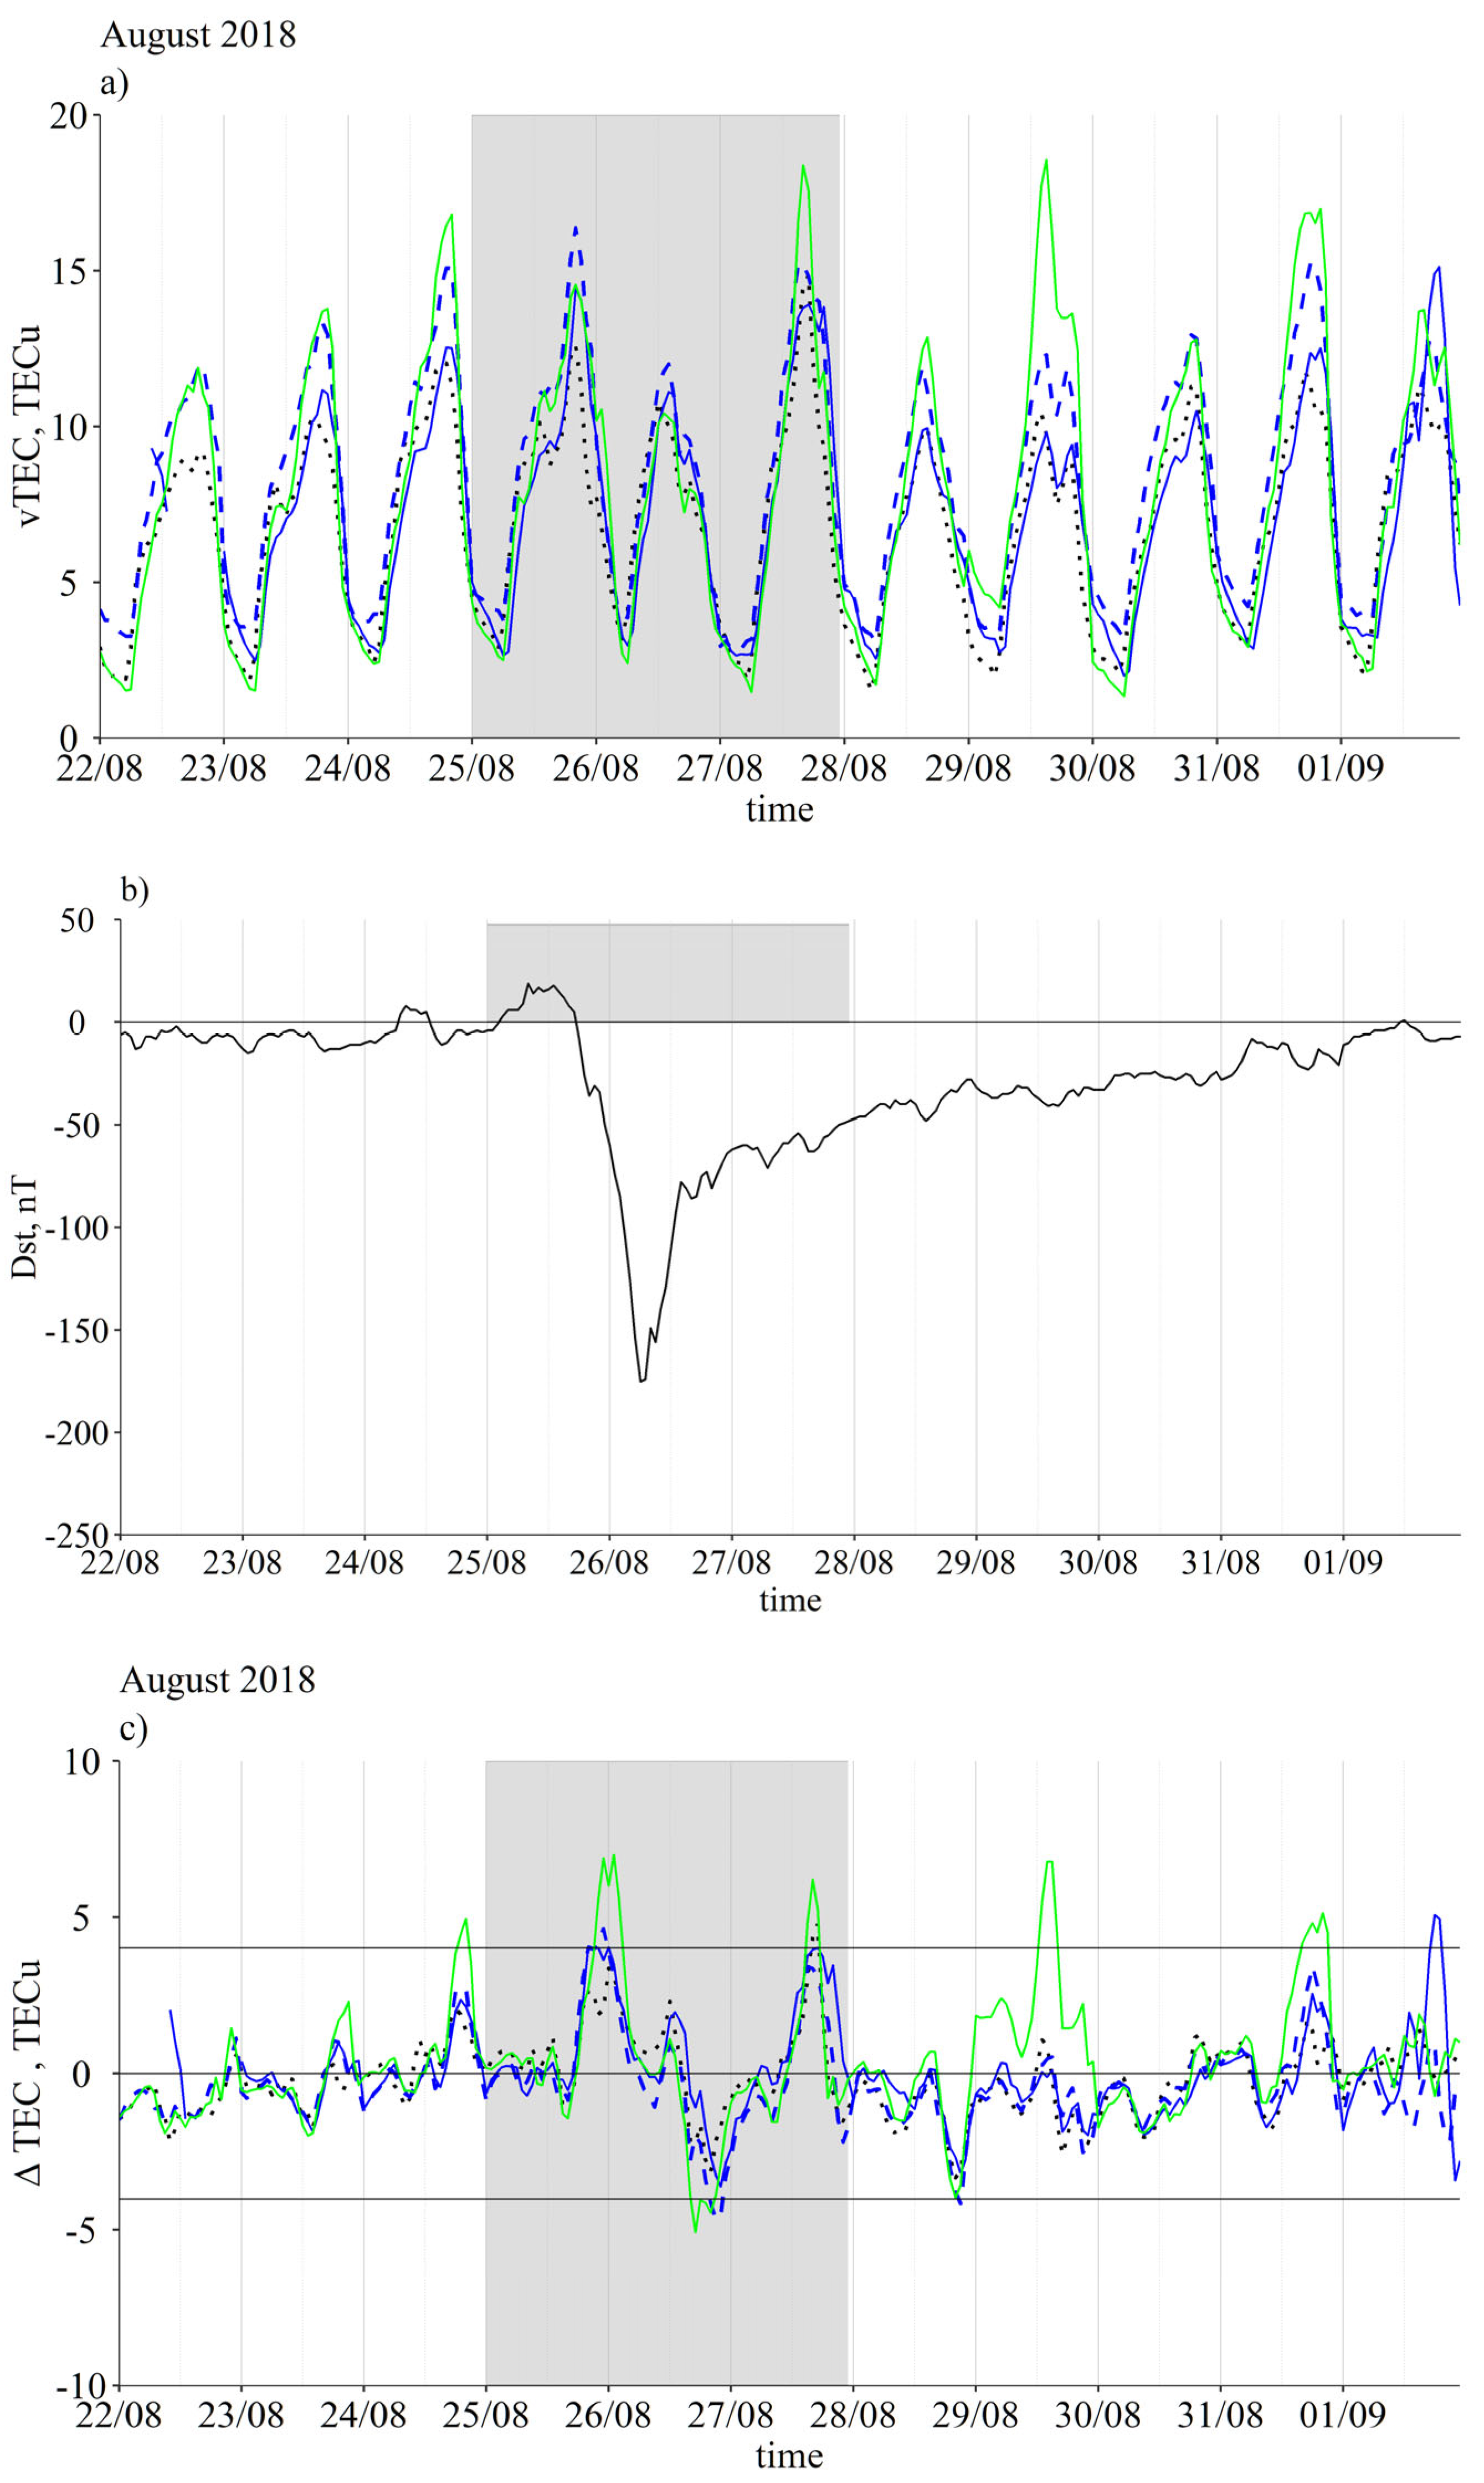
3.6. Geomagnetic Storm of August 2018
This geomagnetic storm was provoked by a CME that occurred on 20 August 2018 and impacted the Earth on 25 August 2018 during the daytime, but the Dst index started to drop only in the late afternoon, reaching its minimum of −175 nT around 06:00 UTC of 26 August 2018—
Figure 7b. As a result, TEC variations in the studied region during 25 August 2018 (see
Figure 7a,c and
Figure S6) were insignificant until the afternoon of 25 August 2018, but then rapidly increased and reached the maximum at around midnight 25–26 August 2018 (a positive storm with ΔTEC ≥ 2σ for Azores and Madeira and ΔTEC < 2σ for Lisbon). On the following day, 26 August 2018, the ionospheric storm was a negative one (|ΔTEC| > 2σ for Azores and Madeira and |ΔTEC| < 2σ for Lisbon); however, on 27 August 2018, there was another positive ionospheric storm with ΔTEC > 2σ for all three locations. ΔTEC variations observed for Madeira on 29 and 31 August 2018, to our mind, are not related to the geomagnetic storm directly, but caused by disturbed conditions in EEJ.
Figure 7.
Same as
Figure 2a–c, but for August 2018.
Figure 7.
Same as
Figure 2a–c, but for August 2018.
As reported in [
48], from 25 August 2018 to 26 August 2018, intense ionospheric irregularities occurred in the equatorial region, observed at both sides of the equator, and extended considerably to higher latitudes (40°–45°). Considering the study by [
49], the TEC increase for middle latitudes was more significant in the southern hemisphere (Africa) than in Europe.
Despite the intensity of ionospheric disturbances and the significant increase in electron density recorded, especially in the storm’s main phase, no loss of lock or other problems were reported for any of the GNSS systems. In terms of impact on GNSS navigation systems, this corresponds to a weak space weather event, contrary to what occurred to the geomagnetically-induced currents, whose effects were strong [
50].
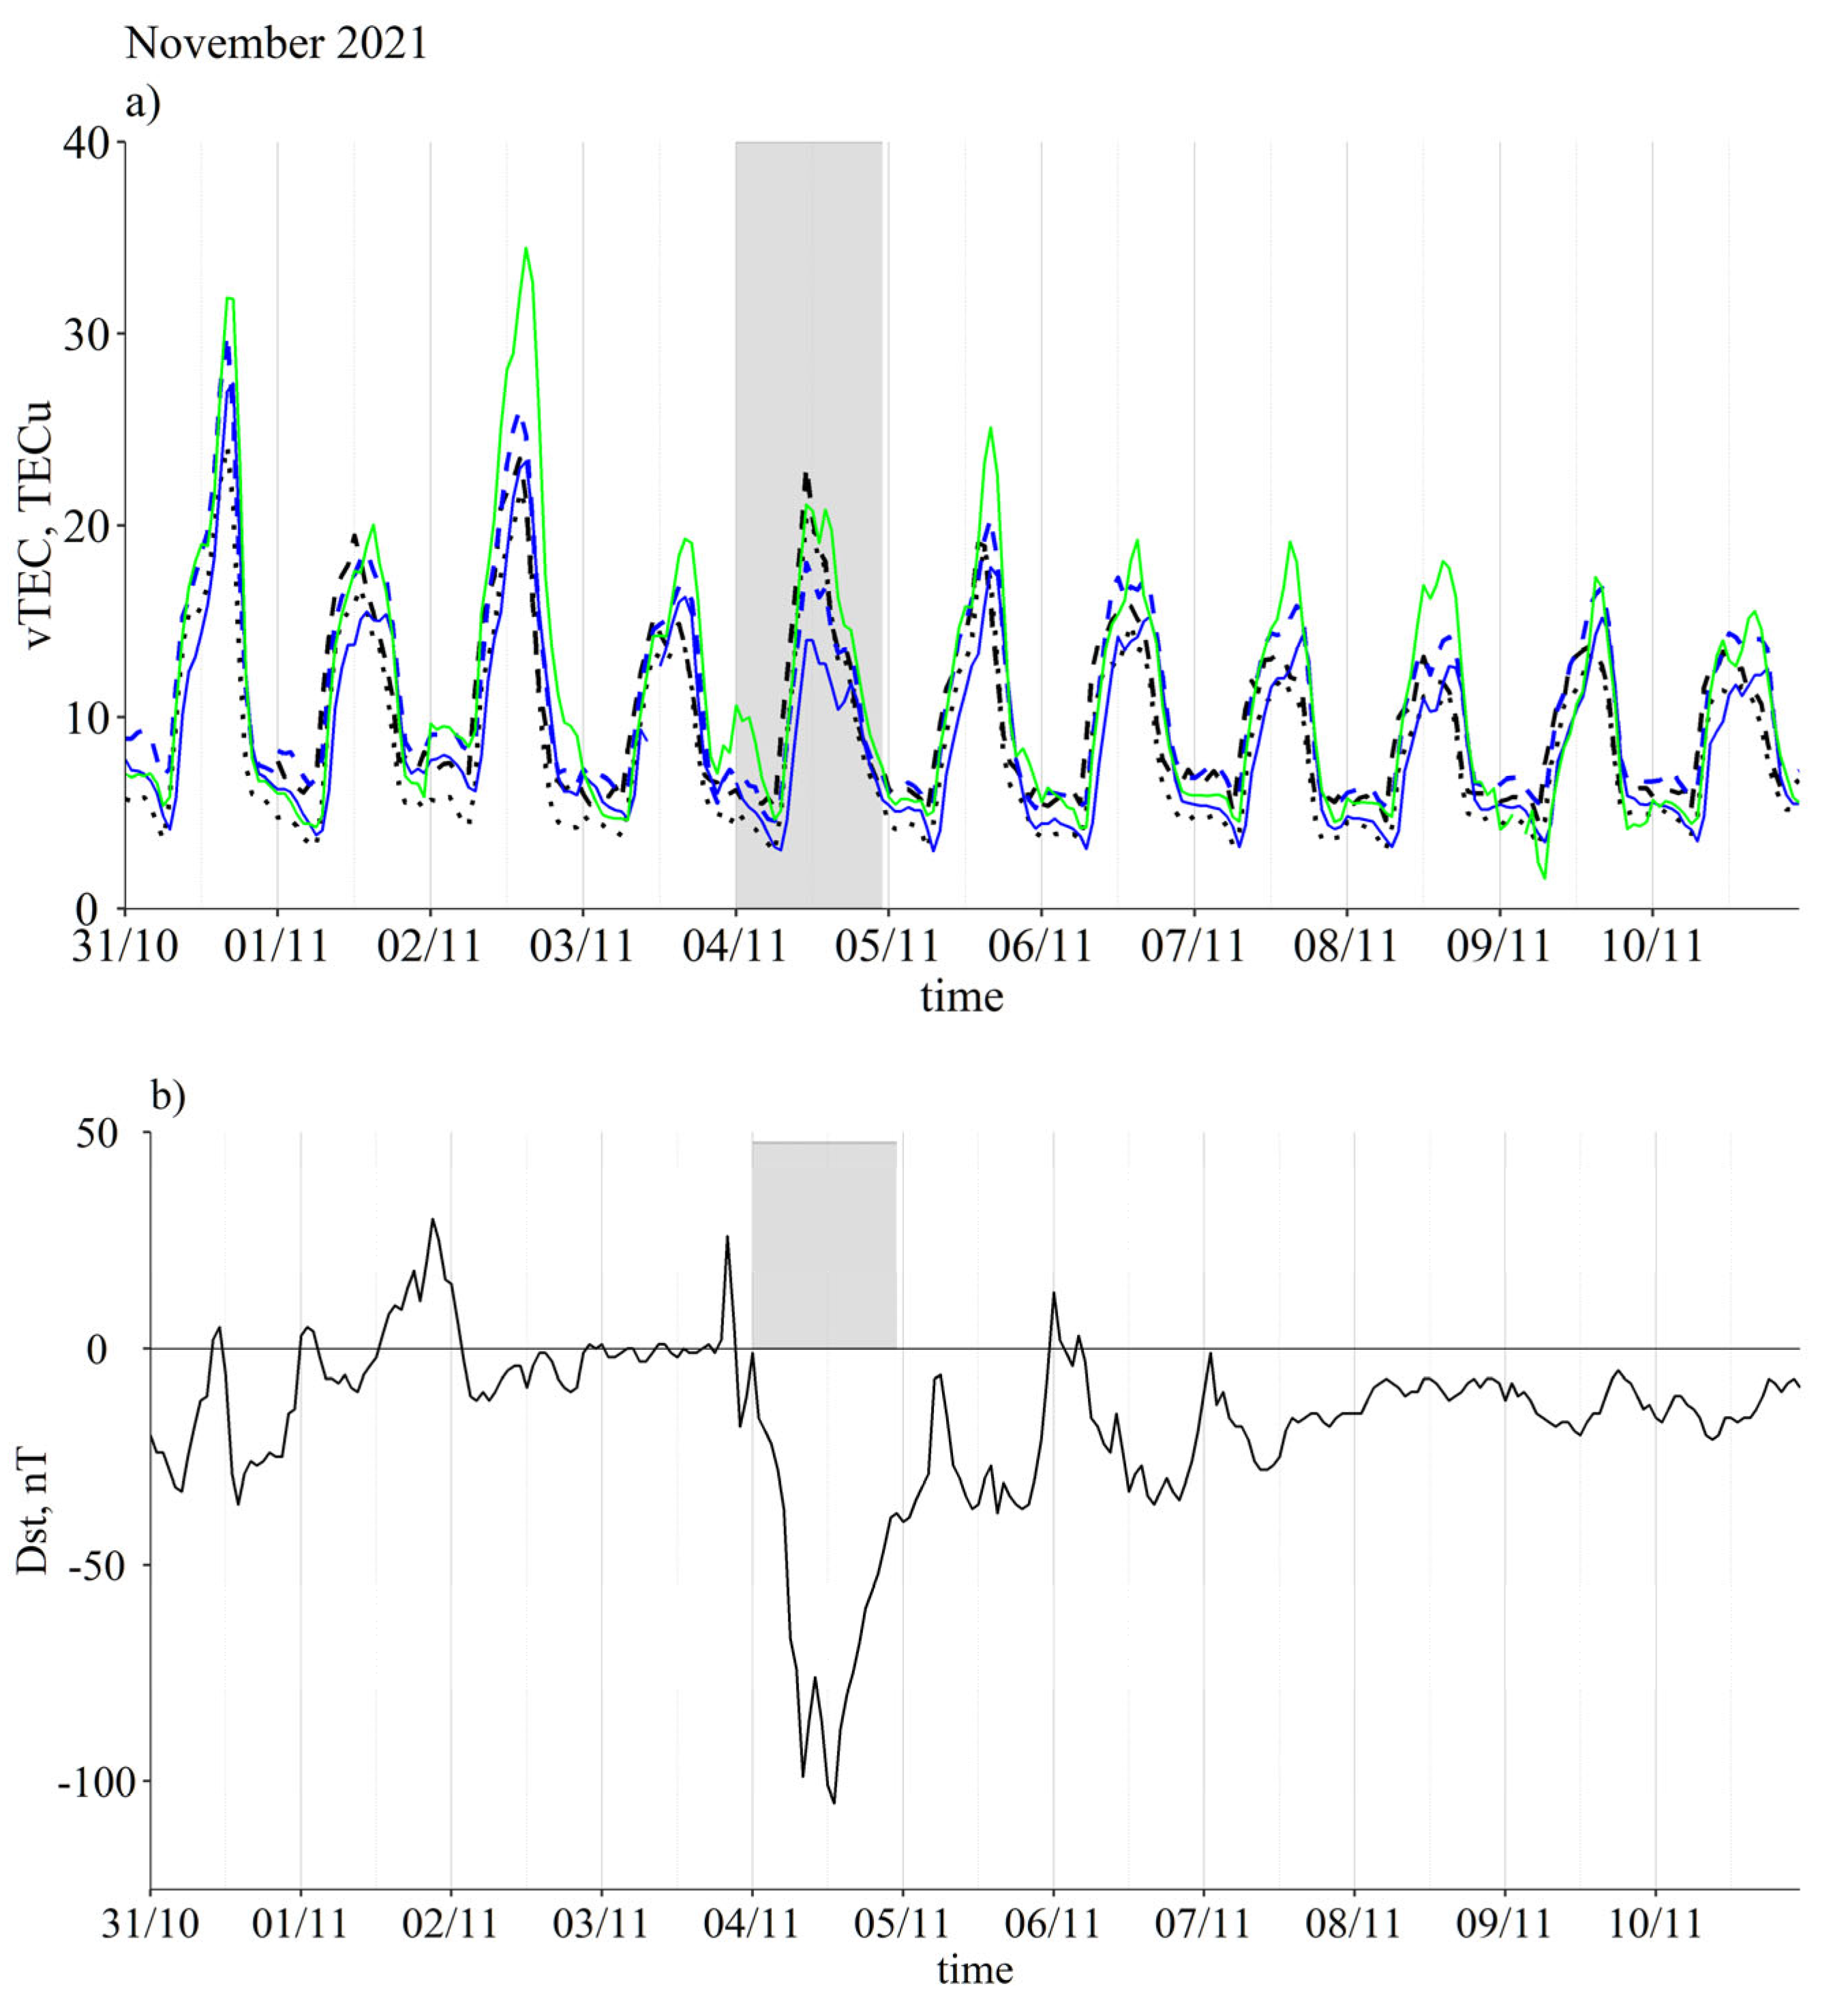
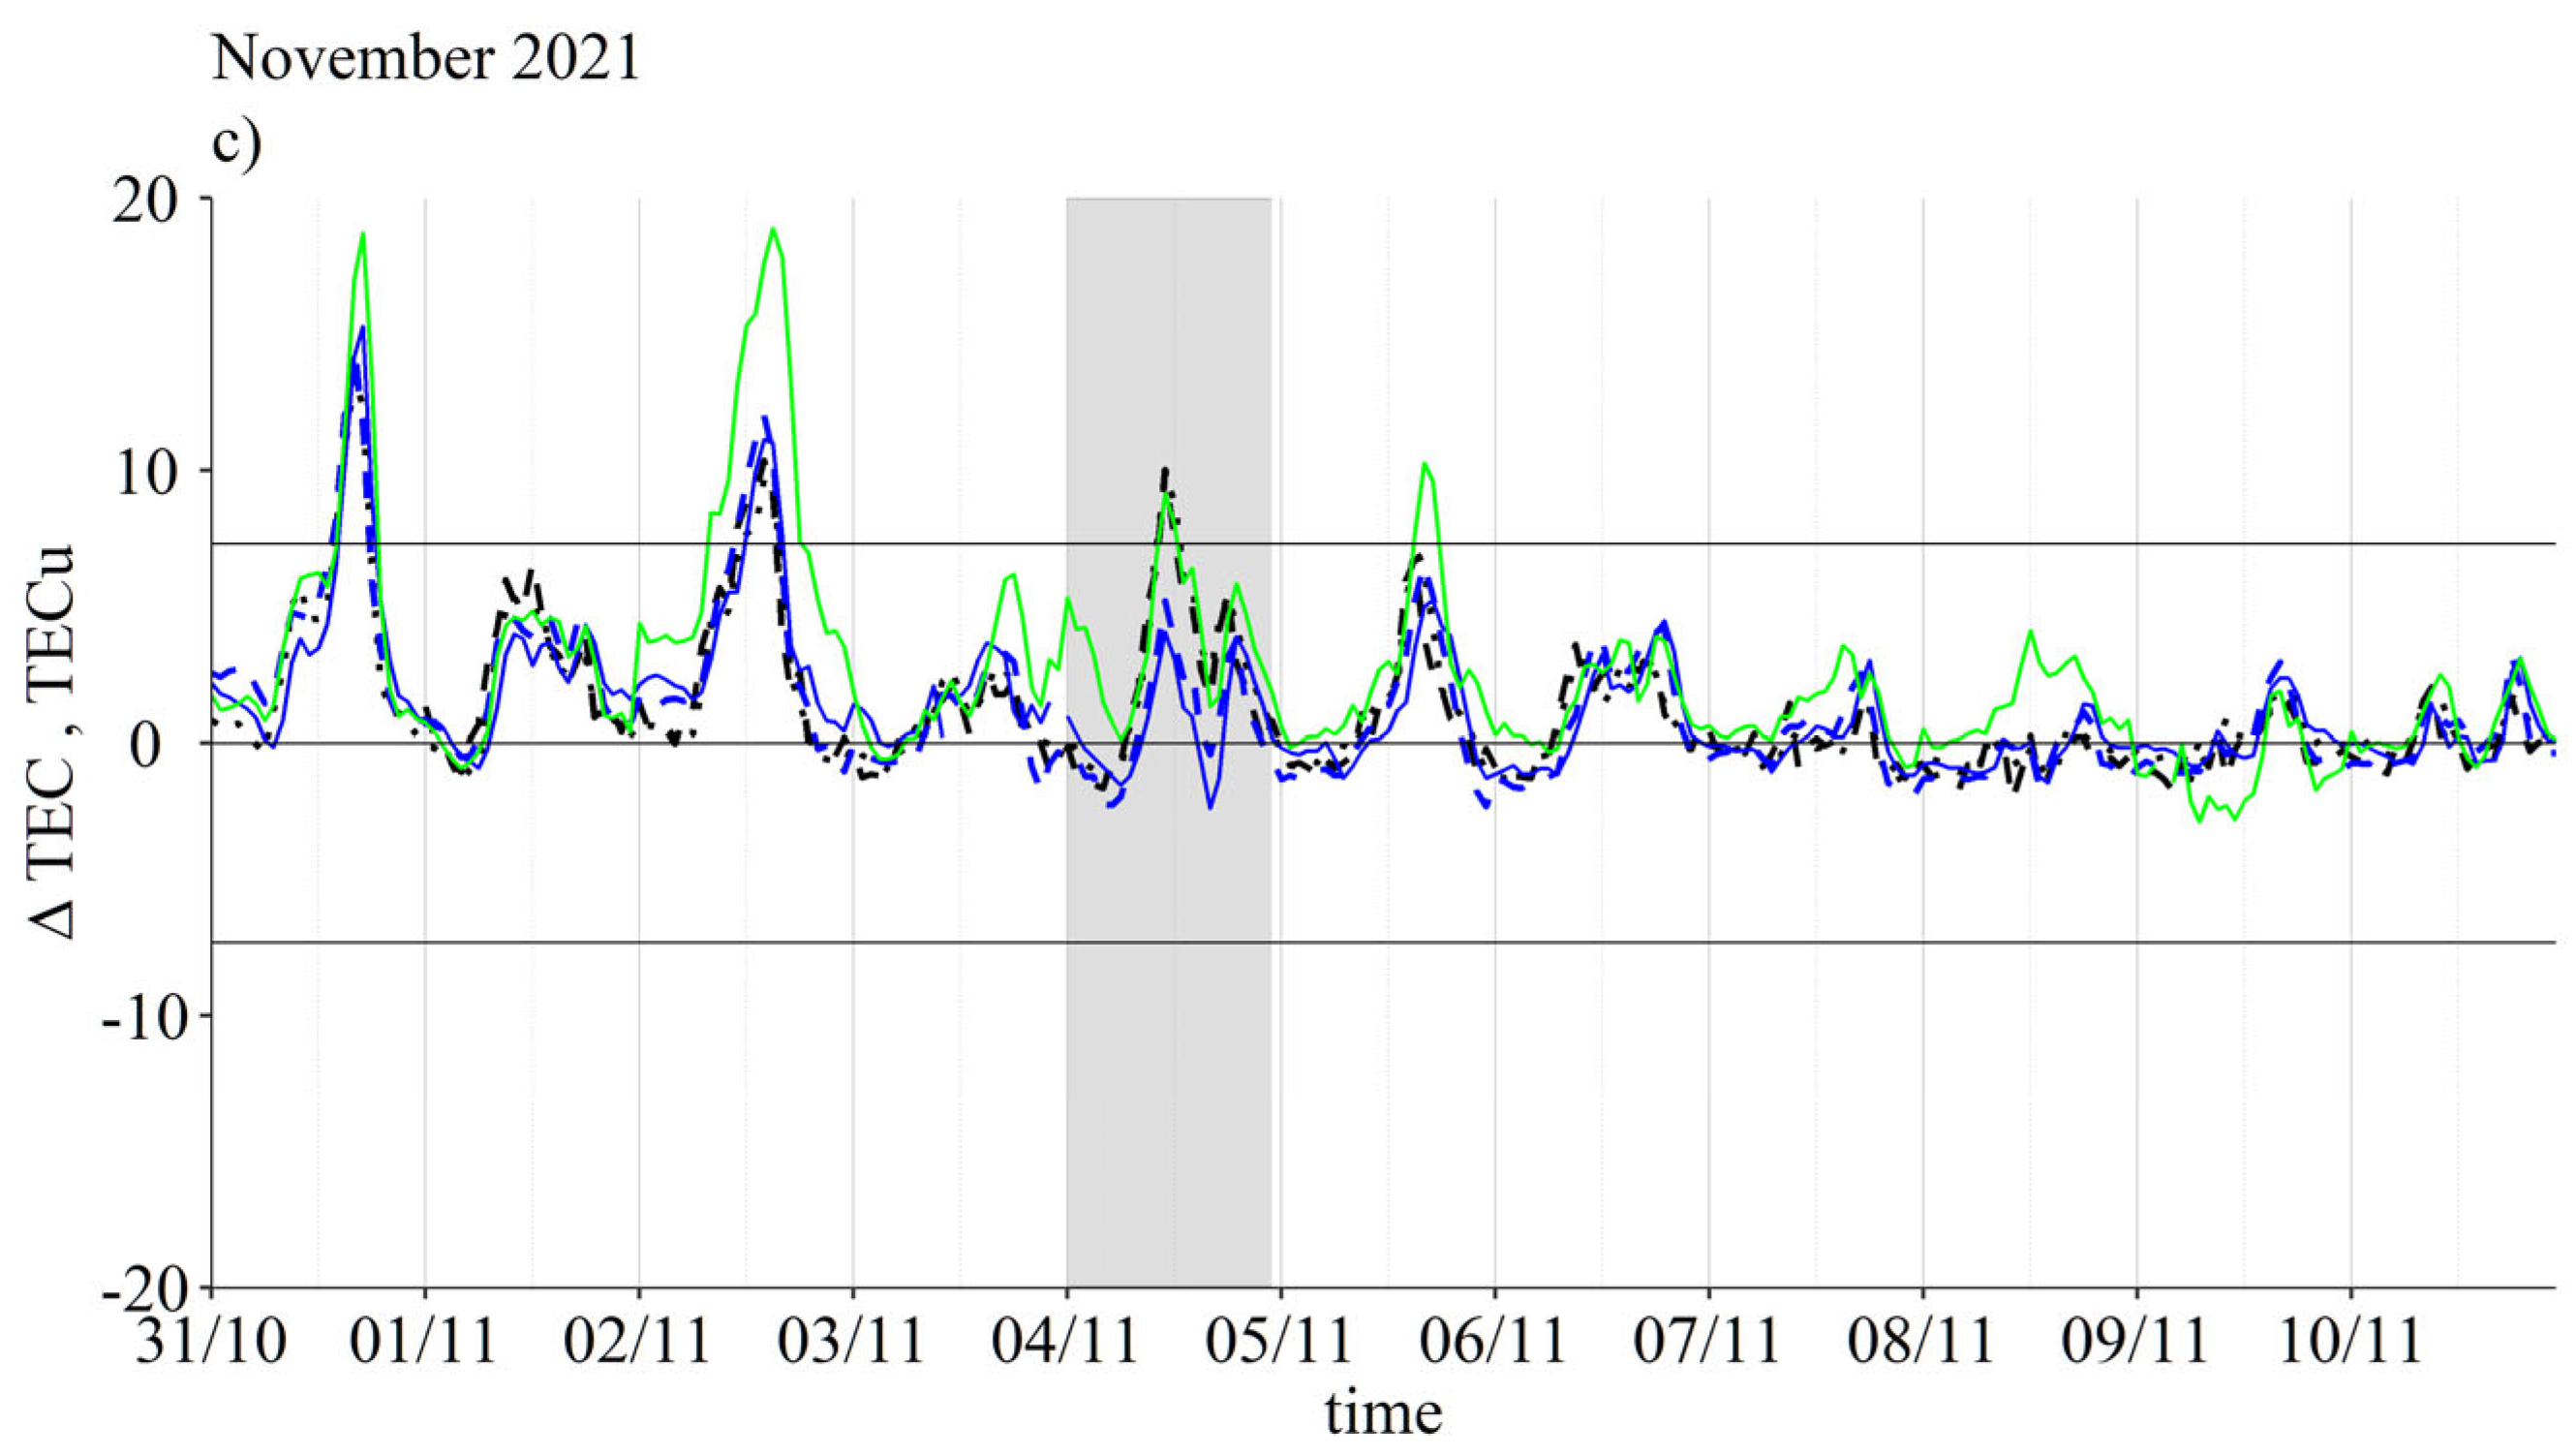
3.7. Geomagnetic Storm of November 2021
This geomagnetic storm is considered to be the first geomagnetic storm of the solar cycle 25. It provoked ionospheric variations with latitudinal and longitudinal dependences in Europe [
51]. Several C and M flares occurred during 1 November 2021, leading to a CME on 2 November 2021. The geomagnetic event was a short-living storm that lasted just one day, 4 November 2021—
Figure 8b.
Figure 8.
Same as
Figure 2a–c, but for November 2021.
Figure 8.
Same as
Figure 2a–c, but for November 2021.
The ionospheric response in the studied region can be classified as a 2-day-long (4 and 5 November 2021) positive ionospheric storm that was observed at all three locations, with ΔTEC > 2σ for Lisbon and Madeira and ΔTEC < 2σ for Azores (see
Figure 8b,c and
Figure S7). Additionally, in the afternoon hours of 4 November 2021, a secondary TEC maximum was observed (<2σ) at all three locations. The TEC variations observed during this storm at all three locations were synchronous.
To our knowledge, no disturbances in the GNSS signal were reposted for this storm.
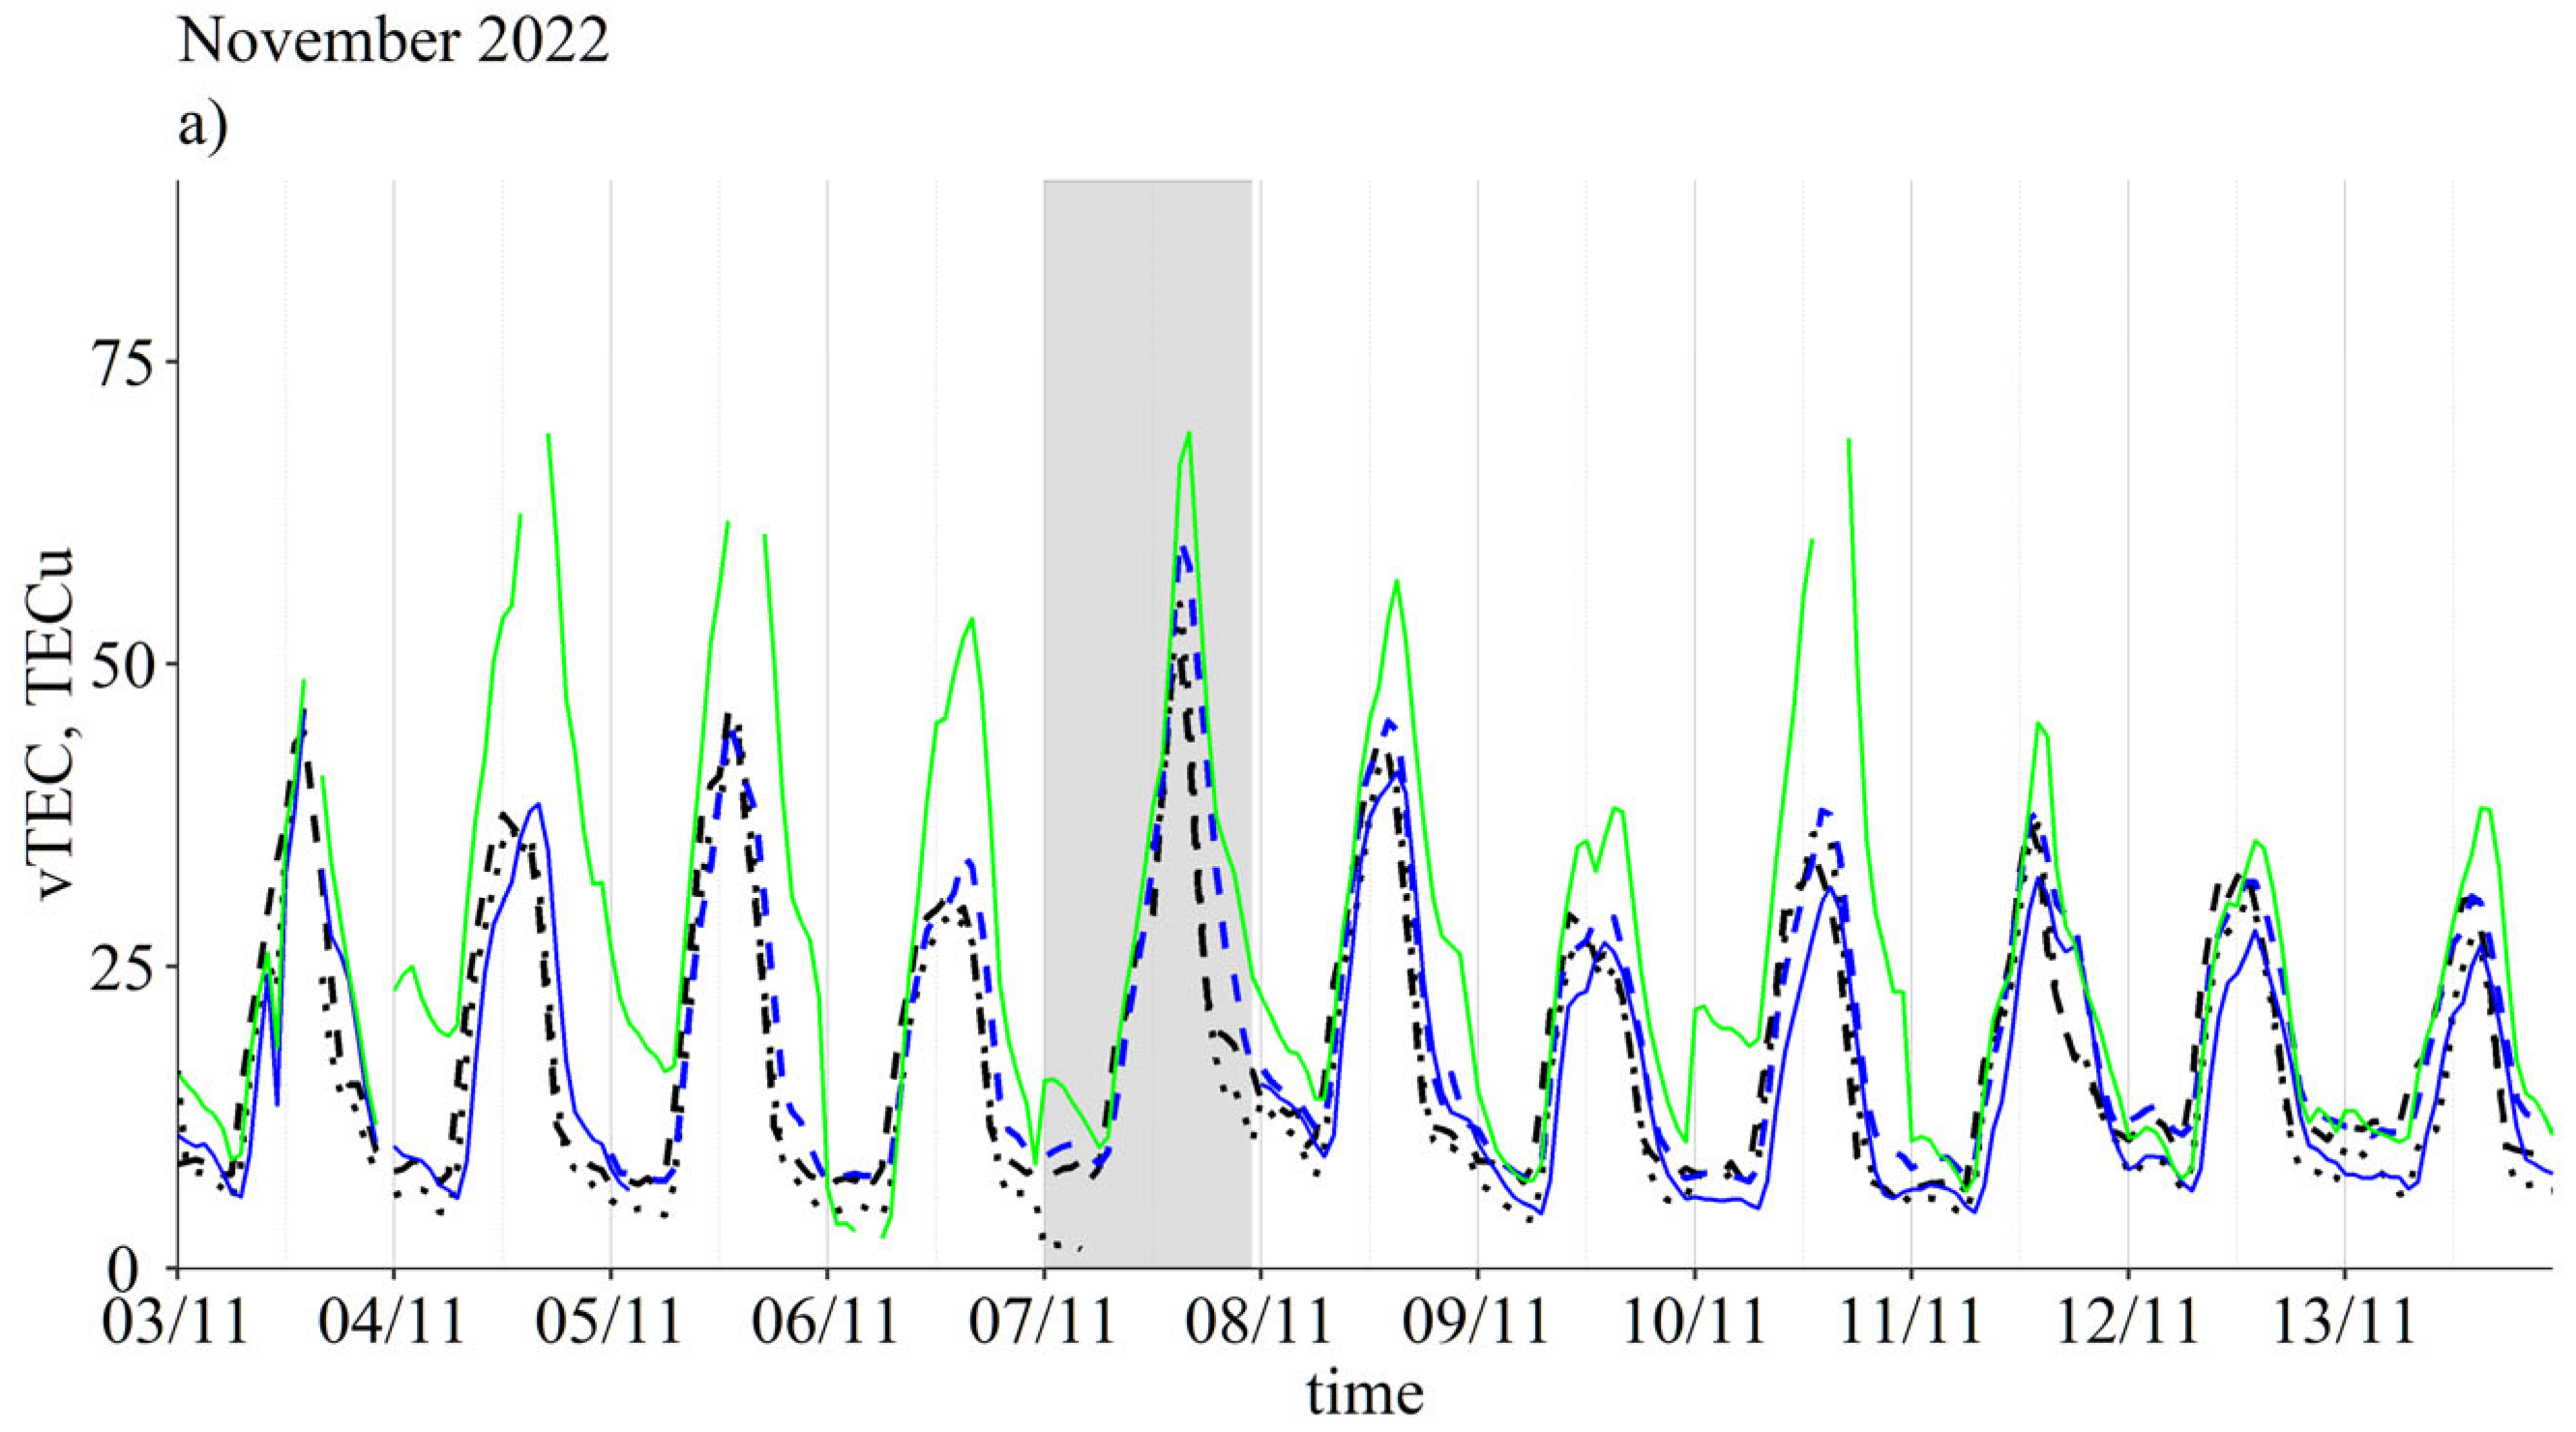
3.8. Geomagnetic Storm of November 2022
Due to a M5.2 flare and following disturbances in the solar wind that occurred on 7 November 2022, a geomagnetic storm started in the morning hours of 7 November 2022 and a Dst minimum of −92 nT was registered around 18:00 UTC—
Figure 9b.
As a result, a 2-day-long positive ionospheric storm has been developed at the studied region (
Figure 9a,c and
Figure S8) with ΔTEC > 2σ on 7 November 2022 at all locations and on 8 November 2022 only at Madeira (ΔTEC ≤ 2σ at Lisbon and Azores). This geomagnetic storm has been preceded by several days of a disturbed geomagnetic field (3–5 November 2022) with Dst ≈ −50 nT. These disturbances may be a source of TEC variation observed on 3–5 November 2022 at all locations, but most prominently at Madeira.
Figure 9.
Same as
Figure 2a–c, but for November 2022.
Figure 9.
Same as
Figure 2a–c, but for November 2022.
This minor storm provoked perturbations in the SBAS systems: EGNOS for GALILEO and the Wide Area Augmentation System (WAAS) for GPS. Significant disturbances affected some services provided by both systems. In Europe, EGNOS availability was reduced over Scandinavia, and for America, the WAAS availability affected Canada [
52].
4. Discussion and Conclusions
The ionospheric response to eight geomagnetic storms with Dst < −90 nT between 2015 and 2022 was studied for a mid-latitudinal region of the eastern North Atlantic: Lisbon at the Continental Portugal, and Madeira and Azores archipelagos (i.e., between 32° N and 39° N in latitudes and between 27° W and 9° W in longitude). GNSS-based total electron content (TEC) data were used to characterise ionospheric conditions.
For most of the studied geomagnetic storms, the induced TEC variations during the day of a storm are synchronous for all three studied locations despite there being about a 1 h difference in the local (solar) time. On the other hand, in some cases, ionospheric disturbances were observed first at the most eastern part of the studied region (Lisbon, or Lisbon and Madeira) and then, the TEC variations “travelled” westward to Azores with a delay of about 1 h.
In many studied cases, the amplitude of TEC variations at Madeira was larger than in the other two locations, probably due to its lower latitude and, as a result, a proximity to the equatorial electrojet. Additionally, for some storms (e.g., June 2015 and May 2017), features that may be related to a northward transition of post-sunset equatorial plasma bubbles were observed.
For some of the storms, there are differences in the ionospheric response between the west (Azores) and east (Lisbon and Madeira) parts of the studied region (e.g., storms of May 2017 and November 2021).
For some of the storms, there are differences (not just in the amplitude of TEC variations, but in an appearance of certain features) in the ionospheric response between the northern (Azores and Lisbon) and southern (Madeira) parts of the studied region (e.g., storms of January and March 2015).
Almost all the studied geomagnetic storms caused positive or positive–negative ionospheric storms.
Two of the eight studied geomagnetic storms (May 2017 and August 2018) started during the local night-time and resulted in negative–positive ionospheric storms. More studies are needed to confirm or discard this probable relation between the ionospheric storm type and the time of the geomagnetic storm commencement.
During some of the studied months (e.g., August 2018 or November 2022), significant TEC variations observed during geomagnetically quiet days (before or after a storm). Since, in most cases, these variations are stronger at the most southern station (Madeira), we guess that they are related to the dynamics of EEJ. On the other hand, we cannot exclude an effect described in [
53]: a propagation of ionospheric disturbances from high to middle latitudes during geomagnetically quiet conditions.
Finally, there is no clear dependence between the strength of a geomagnetic storm and the strength and the type of a following ionospheric storm, as well as the appearances of different type of discontinuities in the work of GNSS systems. Even though six out of eight (75%) studied storms were accompanied by reports of different kinds of failures in one or many of the operational GNSS systems, some of the storms were nevertheless completely “invisible” from the GNSS point of view (such as, for example, the storm of November 2021). We believe that this ambiguity is due to the lack of systematic and uniform collection and analysis of data on the GNSS systems failures.
Supplementary Materials
The following supporting information can be downloaded at:
https://www.mdpi.com/article/10.3390/atmos14060949/s1, Figures S1–S8: Animations showing average ΔTEC variations (in σ units—semi-transparent colour scale) for the studied locations for each of the analysed storms. Figure S1—January 2015, S2—March 2015, S3—June 2015, S4—May 2017, S5—September 2017, S6—August 2018, S7—November 2021, S8—November 2022. Non-transparent grey—no data.
Author Contributions
This work has the following contributions: conceptualization—A.M.; methodology—A.M. and T.B. (Teresa Barata); software—A.M., M.H.-P. and T.B. (Tatiana Barlyaeva); validation—A.M. and J.P.; formal analysis—A.M.; investigation—A.M., J.P., T.B. (Tatiana Barlyaeva), T.B. (Teresa Barata) and M.H.-P.; resources—A.M. and T.B. (Teresa Barata); data curation—A.M. and T.B. (Tatiana Barlyaeva); writing—original draft preparation—T.B. (Teresa Barata); writing—review and editing—T.B. (Teresa Barata), A.M., J.P., T.B. (Tatiana Barlyaeva) and M.H.-P.; visualisation—A.M.; supervision—A.M.; project administration—A.M.; funding acquisition—A.M. All authors have read and agreed to the published version of the manuscript.
Funding
IA is supported by Fundação para a Ciência e a Tecnologia (FCT, Portugal) through the research grants UIDB/04434/2020 and UIDP/04434/2020. This study is a contribution to the PRIME project (EXPL/CTA-MET/0677/2021, FCT, Portugal) and JP is supported by this project. The PITHIA-NRF project has received funding from European Union’s Horizon 2020 research and innovation programme under grant agreement no. 101007599.
Institutional Review Board Statement
Not applicable.
Informed Consent Statement
Not applicable.
Data Availability Statement
Acknowledgments
The authors would like to acknowledge the Direção Geral do Território (DGT) for making ReNEP data available and to A-RAEGE-Az for providing data from the RAEGE stations, as well as the people involved, Helena Ribeiro (RENEP) and João Ferreira (A-RAEGE-Az). The authors are grateful to Yuri Yasyukevich and his team for the development of the GNSS Lab software and technical support. We acknowledge the research infrastructure and the access provider UPC-IonSAT of the PITHIA-NRF project (
https://www.pithia-nrf.eu/ (accessed on 26 April 2023)).
Conflicts of Interest
The authors declare no conflict of interest.
References
- Kumar, V.; Parkinson, M.L. A global scale picture of ionospheric peak electron density changes during geomagnetic storms. Space Weather 2017, 15, 637–652. [Google Scholar] [CrossRef]
- Mrak, S. GNSS Remote Sensing of Space Weather at Mid-Latitudes: Ionospheric Irregularities and Source Analysis. Ph.D. Thesis, Boston University College of Engineering, Boston, MA, USA, 2020. [Google Scholar]
- Rodrigues, F.S.; Socola, J.G.; Moraes, A.O.; Martinis, C.; Hickey, D.A. On the properties of and ionospheric conditions associated with a mid-latitude scintillation event observed over southern United States. Space Weather 2021, 19, e2021SW002744. [Google Scholar] [CrossRef]
- Basu, S.; Basu, S.; Makela, J.J.; MacKenzie, E.; Doherty, P.; Wright, J.W.; Rich, F.; Keskinen, M.J.; Sheehan, R.E.; Coster, A.J. Large magnetic storm-induced night time ionospheric flows at midlatitudes and their impacts on GPS-based navigation systems. J. Geophys. Res. Space Phys. 2008, 113, A00A06. [Google Scholar] [CrossRef]
- Morozova, A.L.; Barlyaeva, T.V.; Barata, T. Variations of TEC over Iberian Peninsula in 2015 due to geomagnetic storms and flares. Space Weather 2020, 18, e2020SW002516. [Google Scholar] [CrossRef]
- Cherniak, I.; Zakharenkova, I. First observations of super plasma bubbles in Europe. Geophys. Res. Lett. 2016, 43, 11137–11145. [Google Scholar] [CrossRef]
- Tsagouri, I. Space weather effects on the Earth’s upper atmosphere: Short report on ionospheric storm effects at middle latitude. Atmosphere 2022, 13, 346. [Google Scholar] [CrossRef]
- Astafyeva, E.; Zakharenkova, I.; Förster, M. Ionospheric response to the 2015 St. Patrick’s Day storm: A global multi-instrumental overview. J. Geophys. Res. 2015, 120, 9023–9037. [Google Scholar] [CrossRef]
- Aa, E.; Huang, W.; Liu, S.; Ridley, A.; Zou, S.; Shi, L.; Chen, Y.; Shen, H.; Yuan, T.; Li, J.; et al. Midlatitude plasma bubbles over China and adjacent areas during a magnetic storm on 8 September 2017. Space Weather 2018, 16, 321–331. [Google Scholar] [CrossRef]
- Mukhtarov, P.; Andonov, B.; Pancheva, D. Empirical model of TEC response to geomagnetic and solar forcing over Balkan Peninsula. J. Atmos. Sol. Terr. Phys. 2018, 167, 80–95. [Google Scholar] [CrossRef]
- Morozova, A.L.; Ribeiro, P.; Blanco, J.J.; Barlyaeva, T.V. Temperature and pressure variability in mid-latitude low atmosphere and stratosphere ionosphere coupling. Adv. Space Res. 2020, 65, 2184–2202. [Google Scholar] [CrossRef]
- Elmunim, N.A.; Abdullah, M.; Bahari, S.A. Evaluating the performance of IRI-2016 using GPS-TEC measurements over the equatorial region. Atmosphere 2021, 12, 1243. [Google Scholar] [CrossRef]
- Blagoveshchensky, D.V.; Maltseva, O.A.; Sergeeva, M.A. Impact of magnetic storms on the global TEC distribution. Ann. Geophys. 2018, 36, 1057–1071. [Google Scholar] [CrossRef]
- Barlyaeva, T.; Barata, T.; Morozova, A. Data from: Datasets of ionospheric parameters provided by SCINDA GNSS receiver from Lisbon airport area. Mendeley Data 2020, V1. [Google Scholar] [CrossRef]
- Morozova, A.; Barlyaeva, T.; Barata, T. Data from: Datasets of ionospheric parameters (TEC, SI, positioning errors) from Lisbon airport area for 2014–2019. Mendeley Data 2022, V2. [Google Scholar] [CrossRef]
- Barlyaeva, T.; Barata, T.; Morozova, A. Datasets of ionospheric parameters provided by SCINDA GNSS receiver from Lisbon airport area. Data Brief 2020, 31, 105966. [Google Scholar] [CrossRef]
- Morozova, A.; Barlyaeva, T.; Barata, T. Updating Datasets of ionospheric parameters (TEC, SI, positioning errors) from Lisbon airport area with full data sets for 2014–2019. Data Brief 2023, 47, 109026. [Google Scholar] [CrossRef]
- Yasyukevich, Y.V.; Mylnikova, A.A.; Kunitsyn, V.E.; Padokhin, A.M. Influence of GPS/GLONASS differential code biases on the determination accuracy of the absolute total electron content in the ionosphere. Geomagn. Aeron. 2015, 55, 763–769. [Google Scholar] [CrossRef]
- Mylnikova, A.A.; Yasyukevich, Y.V.; Kunitsyn, V.E.; Padokhin, A.M. Variability of GPS/GLONASS differential code biases. Results Phys. 2015, 5, 9–10. [Google Scholar] [CrossRef]
- Yasyukevich, Y.V.; Mylnikova, A.A.; Polyakova, A.S. Estimating the total electron content absolute value from the GPS/GLONASS data. Results Phys. 2015, 5, 32–33. [Google Scholar] [CrossRef]
- Hernández-Pajares, M.; Juan, J.M.; Sanz, J.; Aragón-Àngel, À.; García-Rigo, A.; Salazar, D.; Escudero, M. The ionosphere: Effects, GPS modeling and the benefits for space geodetic techniques. J. Geod. 2011, 85, 887–907. [Google Scholar] [CrossRef]
- Hernández-Pajares, M.; Graffigna, V.; Roma-Dollase, D.; García-Rigo, A.; Lyu, H. Learning Global Navigation Satellite Systems from Actual Data (LeGAD). Introduction to GNSS Data Processing. Lecture Notes. 2018. Available online: http://chapman.upc.es/lectures/legad/ (accessed on 26 April 2023).
- Valdés-Abreu, J.C.; Díaz, M.A.; Báez, J.C.; Stable-Sánchez, Y. Effects of the 12 May 2021 Geomagnetic Storm on Georeferencing Precision. Remote Sens. 2022, 14, 38. [Google Scholar] [CrossRef]
- Cid, C.; Palacios, D.; Sainz, E.; Guerrero, A. The stealth geomagnetic storm on 2015 January 7: Forecasting, solar sources and interplanetary medium interactions. In Proceedings of the XII Scientific Meeting of the Spanish Astronomical Society, Bilbao, Spain, 18–22 July 2016. [Google Scholar]
- Shagimuratov, I.; Chernouss, S.; Efistov, I.; Cherniak, I.; Tepenitsyna, N.; Koltunenko, L.; Yakimova, G. The phase fluctuations on GPS signals at high latitudes during 7 January 2015 geomagnetic storm. In Proceedings of the 10th European Conference on Antennas and Propagation (EuCAP), Davos, Switzerland, 10–15 April 2016; pp. 1–4. [Google Scholar]
- Wu, C.; Liou, K.; Lepping, R.P.; Hutting, L.; Plunkett, S.; Howrad, R.A.; Scocker, D. The first super geomagnetic storm of solar cycle 24: The St. Patricks day event (17 March 2015). Earth Planets Space 2016, 68, 151. [Google Scholar] [CrossRef]
- Demestrescu, C.; Dobrica, V.; Greculeasa, R.; Stefan, C. The induced surface electric response in Europe to 215 St. Patrick’s Day geomagnetic storm. J. Atmos. Sol. Terr. Phys. 2018, 180, 106–115. [Google Scholar] [CrossRef]
- Tariku, Y.A. The geomagnetic storm time response of the mid latitude ionosphere during solar cycle 24. Radio Sci. 2021, 56, e2021RS007340. [Google Scholar] [CrossRef]
- Poniatowski, M.; Nykiel, G. Degradation of kinematic PPP of GNSS stations in central Europe caused by medium-scale Traveling Inospheric Disturbances during the St. Patrick’s day 2015 geomagnetic storm. Remote Sens. 2020, 12, 3582. [Google Scholar] [CrossRef]
- Space Weather Prediction Center NOAA. Available online: https://www.swpc.noaa.gov/news/solar-cycle-24-status-and-solar-cycle-25-upcoming-forecast (accessed on 17 March 2023).
- Verhulst, T.G.; Sapundjiev, D.; Stankov, S.M. High-resolution ionospheric observations and modeling over Belgium during the solar eclipse of 20 March 2015 including first results of ionospheric tilt and plasma drift measurements. Adv. Space Res. 2016, 57, 2407–2419. [Google Scholar] [CrossRef]
- Stankov, S.M.; Bergeot, N.; Berghmans, D.; Bolsée, D.; Bruyninx, C.; Chevalier, J.M.; Clette, F.; De Backer, H.; De Keyser, J.; D’Huys, E.; et al. Multi-instrument observations of the solar eclipse on 20 March 2015 and its effects on the ionosphere over Belgium and Europe. J. Space Weather Space Clim. 2017, 7, A19. [Google Scholar] [CrossRef]
- Panasenko, S.V.; Otsuka, Y.; Van de Kamp, M.; Chernogor, L.F.; Shinbori, A.; Tsugawa, T.; Nishioka, M. Observation and characterization of traveling ionospheric disturbances induced by solar eclipse of 20 March 2015 using incoherent scatter radars and GPS networks. J. Atmos. Sol. Terr. Phys. 2019, 191, 105051. [Google Scholar] [CrossRef]
- Jacobsen, K.S.; Andalsvik, Y.L. Overview of the 2015 St. Patrick’s day storm and its consequences for RTK and PP positioning in Norway. J. Space Weather Space Clim. 2016, 6, A9. [Google Scholar] [CrossRef]
- Fabbro, V.; Jacobsen, K.; Andalsvik, Y.; Rougerie, S. GNSS positioning error forecasting in the Arctic: ROTI and Precise Point Positioning error forecasting from solar wind measurements. J. Space Weather Space Clim. 2021, 11, 43. [Google Scholar] [CrossRef]
- Yan, Z.; Morton, Y.T.J.; Zakaharenkova, I.; Cherniak, I.; Song, S.; Li, W. Global view of Ionospheric disturbance impacts on kinematic GPS positioning solutions during the 2015 St. Patrick’s Day storm. J. Geophys. Res. Space Phys. 2020, 123, e2019JA027681. [Google Scholar] [CrossRef]
- Macho, E.P.; Correia, E.; Paulo, C.M.; Angulo, L.; Vieira, J.A.G. Ionospheric response to the June 2015 geomagnetic storm in the South American region. Adv. Space Res. 2020, 65, 2172–2183. [Google Scholar] [CrossRef]
- Sentürk, E. Investigation of global ionospheric response of the severe geomagnetic storm on June 22–23, 2015 by GNSS-based TEC observations. Astrophys. Space Sci. 2020, 365, 110. [Google Scholar] [CrossRef]
- Cherniak, I.; Zakharenkova, I.; Sokolovsky, S. Multi-instrumental observation of storm-induced ionospheric plasma bubbles at equatorial and middle latitudes. J. Geophys. Res. Space Phys. 2019, 124, 1491–1508. [Google Scholar] [CrossRef]
- Paziewsli, J.; Høeg, P.; Sieradzki, R.; Jin, Y.; Jarmolowski, W.; Hoque, M.M.; Berdermann, J.; Hernandez-Pajares, M.; Wielgosz, P.; Lyu, H.; et al. The implications of ionospheric disturbances for precise GNSS positioning in Greenland. J. Space Weather Space Clim. 2022, 12, 33. [Google Scholar] [CrossRef]
- Kotova, D.S.; Zakharenkova, I.E.; Klimenko, M.V.; Ovodenko, V.B.; Tyutin, I.V.; Chugunin, D.V.; Chernyshov, A.A.; Ratovsky, K.G.; Chirik, N.V.; Uspensky, M.V.; et al. Formation of Ionospheric Irregularities in the East Siberian Region during the Geomagnetic Storm of 27–28 May 2017. Russ. J. Phys. Chem. B 2020, 14, 377–389. [Google Scholar] [CrossRef]
- Liu, L.; Zou, S.; Yao, Y.; Aa, E. Multi-scale ionosphere responses to the May 2017 magnetic storm over the Asian sector. GPS Solut. 2020, 24, 26. [Google Scholar] [CrossRef]
- Chakraborty, S.; Ray, S.; Sur, D.; Datta, A.; Paul, A. Effects of CME and CIR induced geomagnetic storms on low-latitude ionization over Indian longitudes in terms of neutral dynamics. Adv. Space Res. 2020, 65, 198–213. [Google Scholar] [CrossRef]
- Berdermann, J.; Kriegel, M.; Banys, D.; Heymann, F.; Hoque, M.M.; Wilken, V.; Borries, C.; Heßelbarth, A.; Jakowski, N. Ionospheric Response to the X9.3 Flare on 6 September 2017 and Its Implication for Navigation Services over Europe. Space Weather 2018, 16, 1604–1615. [Google Scholar] [CrossRef]
- Linty, N.; Minetto, A.; Dovis, F.; Spogli, L. Effects of Phase Scintillation on the GNSS Positioning Error During the September 2017 Storm at Svalbard. Space Weather 2018, 16, 1317–1329. [Google Scholar] [CrossRef]
- Sato, H.; Jakowski, N.; Berdermann, J.; Jiricka, K.; Heßelbarth, A.; Banyś, D.; Wilken, V. Solar Radio Burst Events on 6 September 2017 and Its Impact on GNSS Signal Frequencies. Space Weather 2019, 17, 816–826. [Google Scholar] [CrossRef]
- Liu, Y.; Li, Z.; Fu, L.; Wang, J.; Zhang, C. Studying the ionospheric responses induced by a geomagnetic storm in September 2017 with multiple observations in America. GPS Solut. 2020, 24, 3. [Google Scholar] [CrossRef]
- Cherniak, I.; Zakharenkova, I. Development of the storm-induced ionospheric irregularities at equatorial and middle latitudes during the 25–26 August 2018 geomagnetic storm. Space Weather 2022, 20, e2021SW002891. [Google Scholar] [CrossRef]
- Zhang, X.; Dong, L.; Nie, L. The Ionospheric Responses from Satellite Observations within Middle Latitudes to the Strong Magnetic Storm on 25–26 August 2018. Atmosphere 2022, 13, 1271. [Google Scholar] [CrossRef]
- Piersanti, M.; De Michelis, P.; Del Moro, D.; Tozzi, R.; Pezzopane, M.; Consolini, G.; Marcucci, M.F.; Laurenza, M.; Di Matteo, S.; Pignalberi, A.; et al. From the Sun to Earth: Effects of the 25 August 2018 geomagnetic storm. Ann. Geophys. 2020, 38, 703–724. [Google Scholar] [CrossRef]
- Regi, M.; Perrone, L.; Del Corpo, A.; Spogli, L.; Sabbagh, D.; Cesaroni, C.; Alfonsi, L.; Bagiacchi, P.; Cafarella, L.; Carnevale, G.; et al. Space Weather Effects Observed in the Northern Hemisphere during November 2021 Geomagnetic Storm: The Impacts on Plasmasphere, Ionosphere and Thermosphere Systems. Remote Sens. 2022, 14, 5765. [Google Scholar] [CrossRef]
- Solar-Terrestrial Centre of Excellence. Available online: https://www.stce.be/news/616/welcome.html (accessed on 28 March 2023).
- Cai, X.; Burs, A.G.; Wang, W.; Quian, L.; Pedatella, N.; Coster, A.; Zhang, S.; Solomon, S.C.; Eastes, R.W.; Daniell, R.E.; et al. Variations in thermosphere composition and ionosphere total electron content under “geomagnetically quiet” conditions at solar-minimum. Geophys. Res. Lett. 2021, 48, e2021GL093300. [Google Scholar] [CrossRef]
- Morozova, A.; Barata, T.; Barlyaeva, T. Data from: SWAIR project—GNSS receivers TEC. Mendeley Data 2023, v1. [Google Scholar] [CrossRef]
| Disclaimer/Publisher’s Note: The statements, opinions and data contained in all publications are solely those of the individual author(s) and contributor(s) and not of MDPI and/or the editor(s). MDPI and/or the editor(s) disclaim responsibility for any injury to people or property resulting from any ideas, methods, instructions or products referred to in the content. |
© 2023 by the authors. Licensee MDPI, Basel, Switzerland. This article is an open access article distributed under the terms and conditions of the Creative Commons Attribution (CC BY) license (https://creativecommons.org/licenses/by/4.0/).


 ,
, 


