Article

The Spatiotemporal Characteristics of Urban Snow Disasters in Xinjiang over the Last 60 Years

1
Xinjiang Climate Center, China Meteorological Administration, 327 Jianguo Road, Urumqi 830002, China
2
China Meteorological Administration Key Laboratory for Climate Prediction Studies, National Climate Center, 46 Zhongguancun Nandajie, Beijing 100081, China
3
Northwest Institute of Eco-Environment and Resources, Chinese Academy of Sciences, 320 Donggang West Road, Lanzhou 730000, China
4
University of Chinese Academy of Sciences, No. 1 Yanqihu East Road, Huairou District, Beijing 101408, China
*
Author to whom correspondence should be addressed.
Atmosphere 2023, 14(5), 802; https://doi.org/10.3390/atmos14050802
Submission received: 30 March 2023 / Revised: 23 April 2023 / Accepted: 24 April 2023 / Published: 28 April 2023
(This article belongs to the Special Issue Climate Extremes in China)

Abstract

:
Based on the daily observations from 83 meteorological stations in Xinjiang between 1961 and 2020, urban snow disasters were divided into four grades: extremely severe, severe, medium and light. The patterns in the spatiotemporal variability of snow disasters and the relationship between snow disasters and the Northern Hemisphere circulation indices are discussed. The results show that snow disasters were more frequent in the north than in the south, and severe and extremely severe snow disasters mainly occurred in the north. Over the past 60 years, the frequency of medium and above snow disasters has been increasing significantly, while the frequency of light disasters has been decreasing significantly. The areas with significant changes are mainly located in the snow-rich area of Northern Xinjiang. The above changes were more evident during 1991–2020 and occurred in more than 70% of the whole area. Compared to the previous 30 years, the annual average, the maximum and minimum frequency of snow disasters classified as medium and above increased. This is especially true for severe and extremely severe disasters, which increased by more than 70%. Severe and extremely severe snow disasters in the north are significantly and positively correlated with the Northern Hemisphere Polar Vortex Central Intensity Index (NHPVCI), the India-Burma Trough Intensity Index (IBTI) and negatively correlated with AO during the cold season and the winter. Severe snow disasters in the south are positively correlated with the IBTI during winter and autumn.

1. Introduction

Snow disasters are a type of cryosphere hazard and are one of the growing major natural hazards and their particular uncertainties and instabilities are increasing in the context of anomalous global climate change [1,2]. Snow disasters can be highly destructive and can arrive with little prior warning. These disasters can cause significant damage to property, infrastructure, and transportation and result in extensive loss of life [3,4,5,6,7]. However, the impact varies significantly across the globe. For example, in early 2008, a severe snowfall event occurred in southern China, which led to more than 100 million people being affected and direct economic losses above USD 20 billion [8]. A severe snowstorm from December 2009 to January 2010 invaded the city of Altai in northern Xinjiang and led to record-breaking snowfall (from the last 60 years of observations), and wreaked havoc on livestock, agriculture, and local populations [9]. In the United States, a blizzard interrupted the production of nearly half of the power plants in Texas, leaving 4.3 million people without electricity and heat for several days in February 2021 [5,10]. Therefore, increasing the understanding of urban snowfall changes and snow disasters is particularly important to help build public perceptions of climate change, and it also strengthens urban hazard control and disaster reduction at home and abroad.
In recent years, many scholars have studied the formation of snow disasters and have developed indicators to rank them. Snowfall data and other related meteorological data (the average snowfall, temperature, and so on) are used to establish snow disaster indicators in different regions and study the climatological characteristics of snow disasters [11,12]. Meanwhile, the influence of snow depth and the number of snow days on snow disasters was analyzed and carried out. Since the late 1990s, studies of snow disaster formation mechanisms [13,14] and climate risk assessments have been performed [15,16,17,18,19]. Owing to the increasing accumulation of snow data and the results of research, the Qinghai-Tibet Plateau, Inner Mongolia and northern Xinjiang, where snow is abundant, have become hot spots for snow disaster research in China [20,21]. However, there is little research on the variation, causes and the relationship between snow disasters and atmospheric circulation.
Under the impact of global warming, extreme heavy precipitation has increased in continental regions around the world [22,23,24], and the contribution of extreme precipitation to total precipitation has also increased [25], as is the case in China [26,27,28]. This is mainly because of increased water vapor in the atmosphere under the background of global warming [29]. It also means that if temperatures are low enough for snow to form, the additional moisture will lead to heavy snowfall, thus increasing the intensity of snow disasters in colder regions [30]. Since 1960, the frequency of snow disasters has shown a growing trend in the Qinghai-Tibet Plateau and its surrounding areas and has exhibited significant interannual and interdecadal variations [11]. There, the winter snow depth and the number of days with snow cover decreased [15,31]. In Xinjiang, there was a rapid reduction in the snow accumulation period, and the date when snow cover began was significantly delayed [32]. Additionally, the number of regional snowstorms has significantly increased trends of heavy snowfall in northern Xinjiang [33], and the risk of snow hazards has increased [34,35]. Moreover, a significant decrease in snow accumulation and snowfall ratios and an unusual increase in extreme snowfall climatic events are closely related to snowstorms [36].
In the context of global warming, the spatial and temporal distribution characteristics of snowstorms in Xinjiang are changing significantly. Do snowstorms with high-intensity grades contribute more to the overall frequency change of snow disasters? Are these changes correlated with the atmospheric circulation indices of the Northern Hemisphere? Exploring these questions is important for explaining and understanding the changing patterns of snowstorms in Xinjiang. Furthermore, analyzing the long-term changes and variability of urban snow disasters can provide a scientific basis for local prevention of the impacts and losses caused by snowstorms on urban transportation, production and other human activities while also providing a reference for snowstorm monitoring and prediction as well as disaster prevention in Xinjiang.

2. Materials and Methods

2.1. Overview of the Study Area

Xinjiang is located in the middle of Eurasia and the northwest of China, far from the ocean. The landform belongs to “two basins sandwiched by three mountains”, with Altai Mountain in the north, Kunlun Mountain in the south and Tianshan Mountain in the middle of the transverse, dividing Xinjiang into two parts, Junggar Basin in the north and Tarim Basin in the south. The south of Tianshan Mountain is southern Xinjiang, and the north of Tianshan Mountain is northern Xinjiang [12]. In the following, northern Xinjiang and southern Xinjiang are abbreviated as northern and southern, respectively.
There are great differences in geographical environment and climate among different regions. The weather system moving from west to east interacts with special topography and geomorphology, make Xinjiang to be one of the regions with serious snow disasters in China (Figure 1). The occurrence and intensity of snow disasters are related to many factors, such as a snowfall in the winter half-year, depth of snow cover, duration of snow cover, and degree of cooling after snow, etc., but it mainly depends on the amount of precipitation. According to the causes of snow disasters, they can be divided into two categories. One is the disasters caused by short-term weather processes, such as a snowstorm, blizzard, sleet, avalanche, etc.; the other is the disasters caused by heavy snow or several weather processes and last for a long time, including climate disasters caused by excessive snow in the whole winter. The former accounts for 81.4%, while the latter accounts for 18.6% [37].

2.2. Urban Snow Disaster Meteorological Classification

Within natural hazard research, hazards themselves are a critical component of risk and are defined as a function of the probability and intensity of an event, i.e., the likelihood that an event will occur at a given site based on intrinsic properties and dynamic characteristics of that site combined with the overall magnitude of the event [38]. A snow disaster is a natural disaster caused by snow, snowstorms and avalanches, which seriously affects the survival and health of people and animals, or causes damage to transportation, power and communication systems. The probability of a snow disaster occurring at a given point in time is dependent on specific local conditions, including meteorological conditions (temperature/snowfall/wind, etc.). Here, we take a consequence based on the meteorological standard “Meteorological grades for urban snow hazard” (QX/T 178-2013) [39] and focus on quantifying the intensity of snow disasters. We then extract seven meteorological features of accumulative snowfall, daily maximum snowfall, snow depth, number of consecutive snowfall days, daily minimum temperature, daily maximum wind speed and daily minimum relative humidity in the period of 1961–2020 and calculate the urban snow disaster meteorological index of 83 national meteorological stations located in counties (cities) in Xinjiang (Equation (1)).
I = I R + I R M + I D + I N + I T + I W + I R H
where:
I—The urban snow meteorological index;
IR—The component of the urban snow meteorological index corresponding to the accumulated snowfall;
IRM—The component of the urban snow meteorological index corresponding to the maximum daily snowfall;
ID—A component of the urban snow meteorological index corresponding to snow depth;
IN—A component of the urban snow meteorological index corresponding to the number of consecutive days of snowfall;
IT—A component of the urban snow meteorological index corresponding to the daily minimum temperature;
IW—A component of the urban snow meteorological index corresponding to the daily maximum wind speed;
IRH—A component of the urban snow meteorological index corresponding to the daily minimum relative humidity.
The values of each impact factor in the formula are shown in Table 1 [39].
According to Table 2 [39], urban snow disaster in Xinjiang is divided into four levels: light, medium, severe and extremely severe.
Annual snow records begin in July and end in June of the following year. That from July 1961 to June 1962 is the 1961 snow record, and so on, and the 60-year time series extends from 1961 to 2020. Then, the number of snow disasters of all grades from each meteorological station was counted for each year. The number of snow disasters at all grades in Xinjiang, North Xinjiang and South Xinjiang each year is the total number of snow disasters of all meteorological stations in the region. The median value of the box-plot diagram is the median value of all stations in the region, as well as the 25% and 75% percentile values of the annual cumulative frequency of each station in the study period. The upper and lower bounds are the maximum and minimum values, respectively. The 83 meteorological stations in Xinjiang are divided into 43 stations in northern Xinjiang and 40 stations in southern Xinjiang, and Figure 1 shows the specific distribution. A comparative analysis was made between 1961–1990 (the previous 30 years, discussed below) and 1991–2020 (the last 30 years, discussed below).

2.3. Sen Slope Estimation and the Mann–Kendall Test

The Theil–Sen median method (also known as Sen slope estimation) was used to calculate the magnitude of the trends in the frequency of snowstorm occurrences by classes, and then the Mann–Kendall (MK) test was used to determine the significance of the trend. Sen slope estimation is a robust nonparametric statistical method for calculating trends. The MK test is a nonparametric test for assessing trends in time series data [40,41], which does not require the measurements to obey a normal distribution. It has been used with great success in studies related to hydrological and meteorological trend changes.

2.4. Atmospheric Characteristic Indices

Atmospheric circulation change is one of the main factors affecting climate change and influencing natural hazards. However, due in part to the absence of sufficient data, few studies have considered the temporal trend in the circulation characteristic quantity indices. Here, we combine qualitative information obtained from the Northern Hemisphere Polar Vortex Central Intensity Index (NHPVCI), the Arctic Oscillation Index (AO) and India-Burma Trough Intensity Index (IBTI) to provide a proxy for the correlation and trend of snow disasters. These indices are from the website of National Climate Center, China Meteorological Administration (http://cmdp.ncc-cma.net/download/Monitoring/Index/M_Atm_Nc.txt, accessed on 30 January 2022). While these indices provide a useful metric for assessing climate change, their influence on snow disasters is not readily known. Thus, the relationship between circulation indices and the frequency of snow disasters during the winter months is assessed.
NHPVCI refers to the total air mass between the 500 hPa isobaric surface and the constant-height surface of the southern boundary contour of the polar vortex (Table 3) within the entire Northern Hemisphere. The AO is the normalized time coefficient of the first mode from the empirical orthogonal function analysis (EOF) of the 1000 hPa height anomaly field in the 20° N–90° N, 0–360° region.

3. Results

3.1. Analysis of the Spatial and Temporal Variability of Urban Disasters in Xinjiang

3.1.1. Spatial Distribution of Different Grades of Snow Disasters

The average annual cumulative frequency of urban snow disasters in Xinjiang was 771 events per year, of which 86% occur in the north and 14% are in the south. From the annual frequency of snow disaster occurrence in cities of various categories from 1961 to 2020, it could be seen that the spatial distribution of snow disasters varies significantly in Xinjiang, with more in the north and less in the south, as shown in Figure 2. Snow disasters in the south are mainly light or medium, and severe and extremely severe disasters rarely occur. The frequency of light snow disasters was more than three events per year in northern Xinjiang (high-value zone reaches 9–11 events) and less than three events per year in southern Xinjiang. The distributions of the frequencies of medium and light snow disasters were roughly the same, but the station number, with six or more medium-grade events per year, was less than that of light snow disasters. Severe snow disasters occur in one to three events per year, and extremely severe disasters occurred less than one event per year in most stations of northern Xinjiang.
By analyzing the regional proportion of the annual frequency of each grade of snow disasters, Figure 3 shows that the frequencies of light and medium snow disasters accounted for 44% and 42%, respectively, in Xinjiang, while severe disasters accounted for 12% and extremely severe disasters accounted for approximately 2%. The frequency of all grades of snow disasters in northern Xinjiang was generally consistent with that of the whole region. In the southern region, the frequency of light snowstorms was the largest at 55%, followed by medium snow disasters at 36%, severe at approximately 8%, and extremely severe rarely occurring.
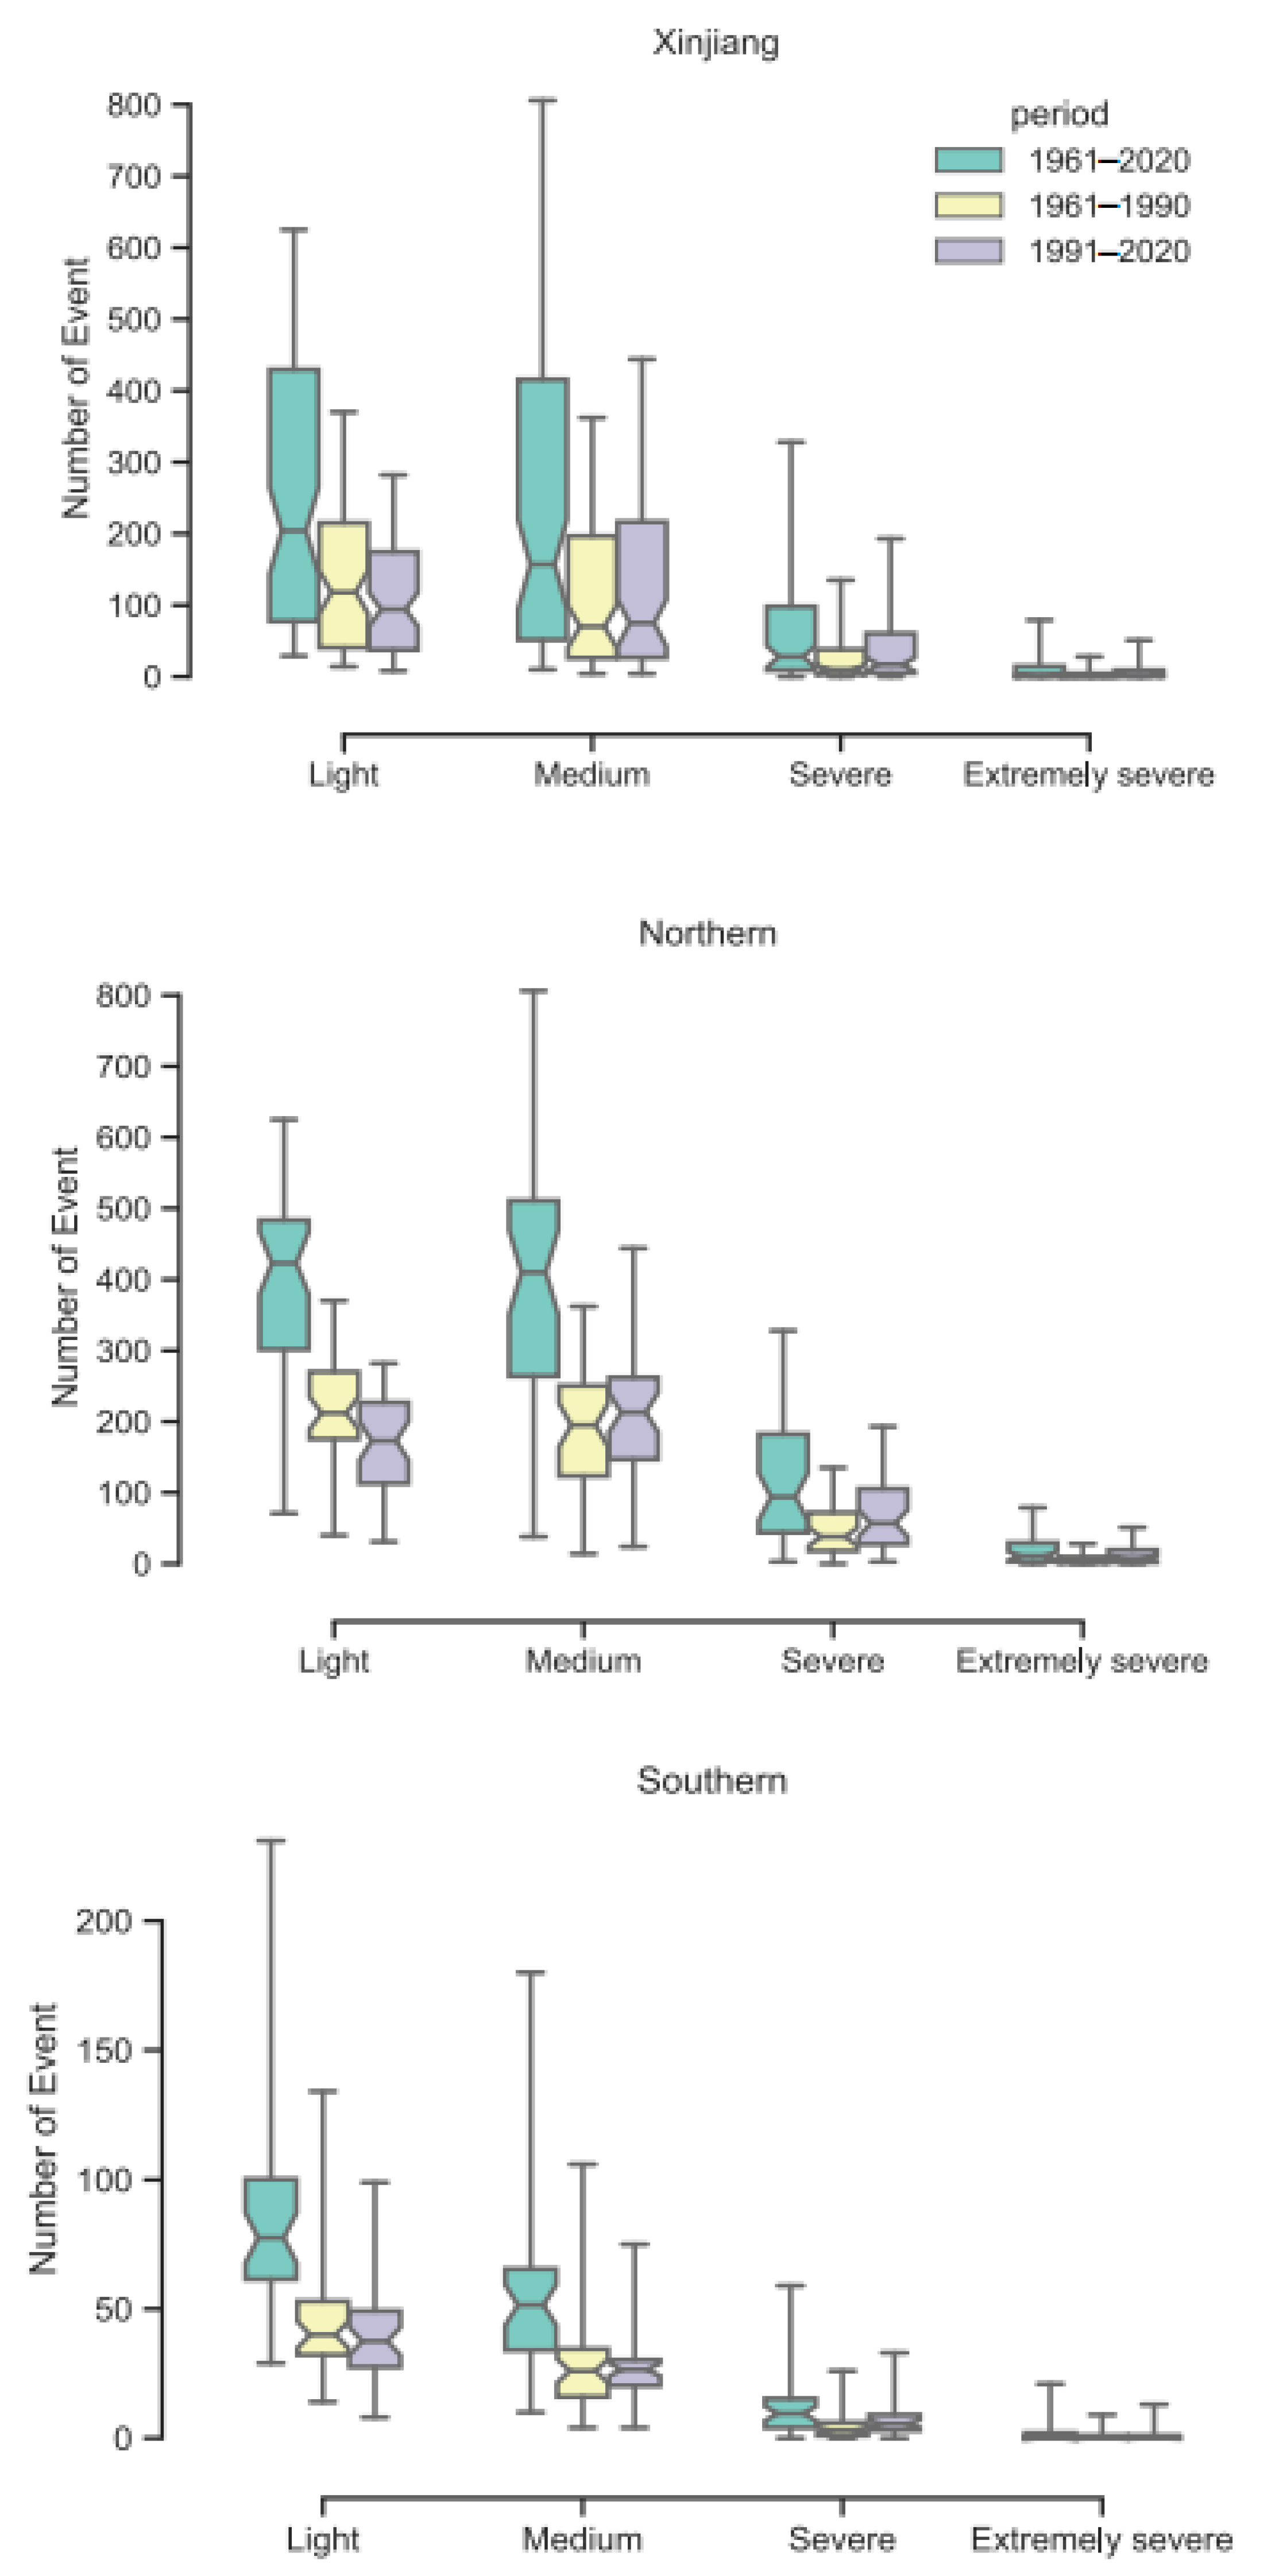
Figure 4 shows the proportions of the frequency of each grade in northern and southern Xinjiang. In northern regions, the frequency of light-grade snowstorms accounted for more than 70% of the total snowstorms in the whole region, with medium-grade snowstorms accounting for approximately 90%. The median cumulative frequency of snow disasters was 423, 410, 94 and 11 events per year for each grade from light to extremely severe, respectively.

3.1.2. Spatial Distribution of Trends in Different Grades of Snow Disasters

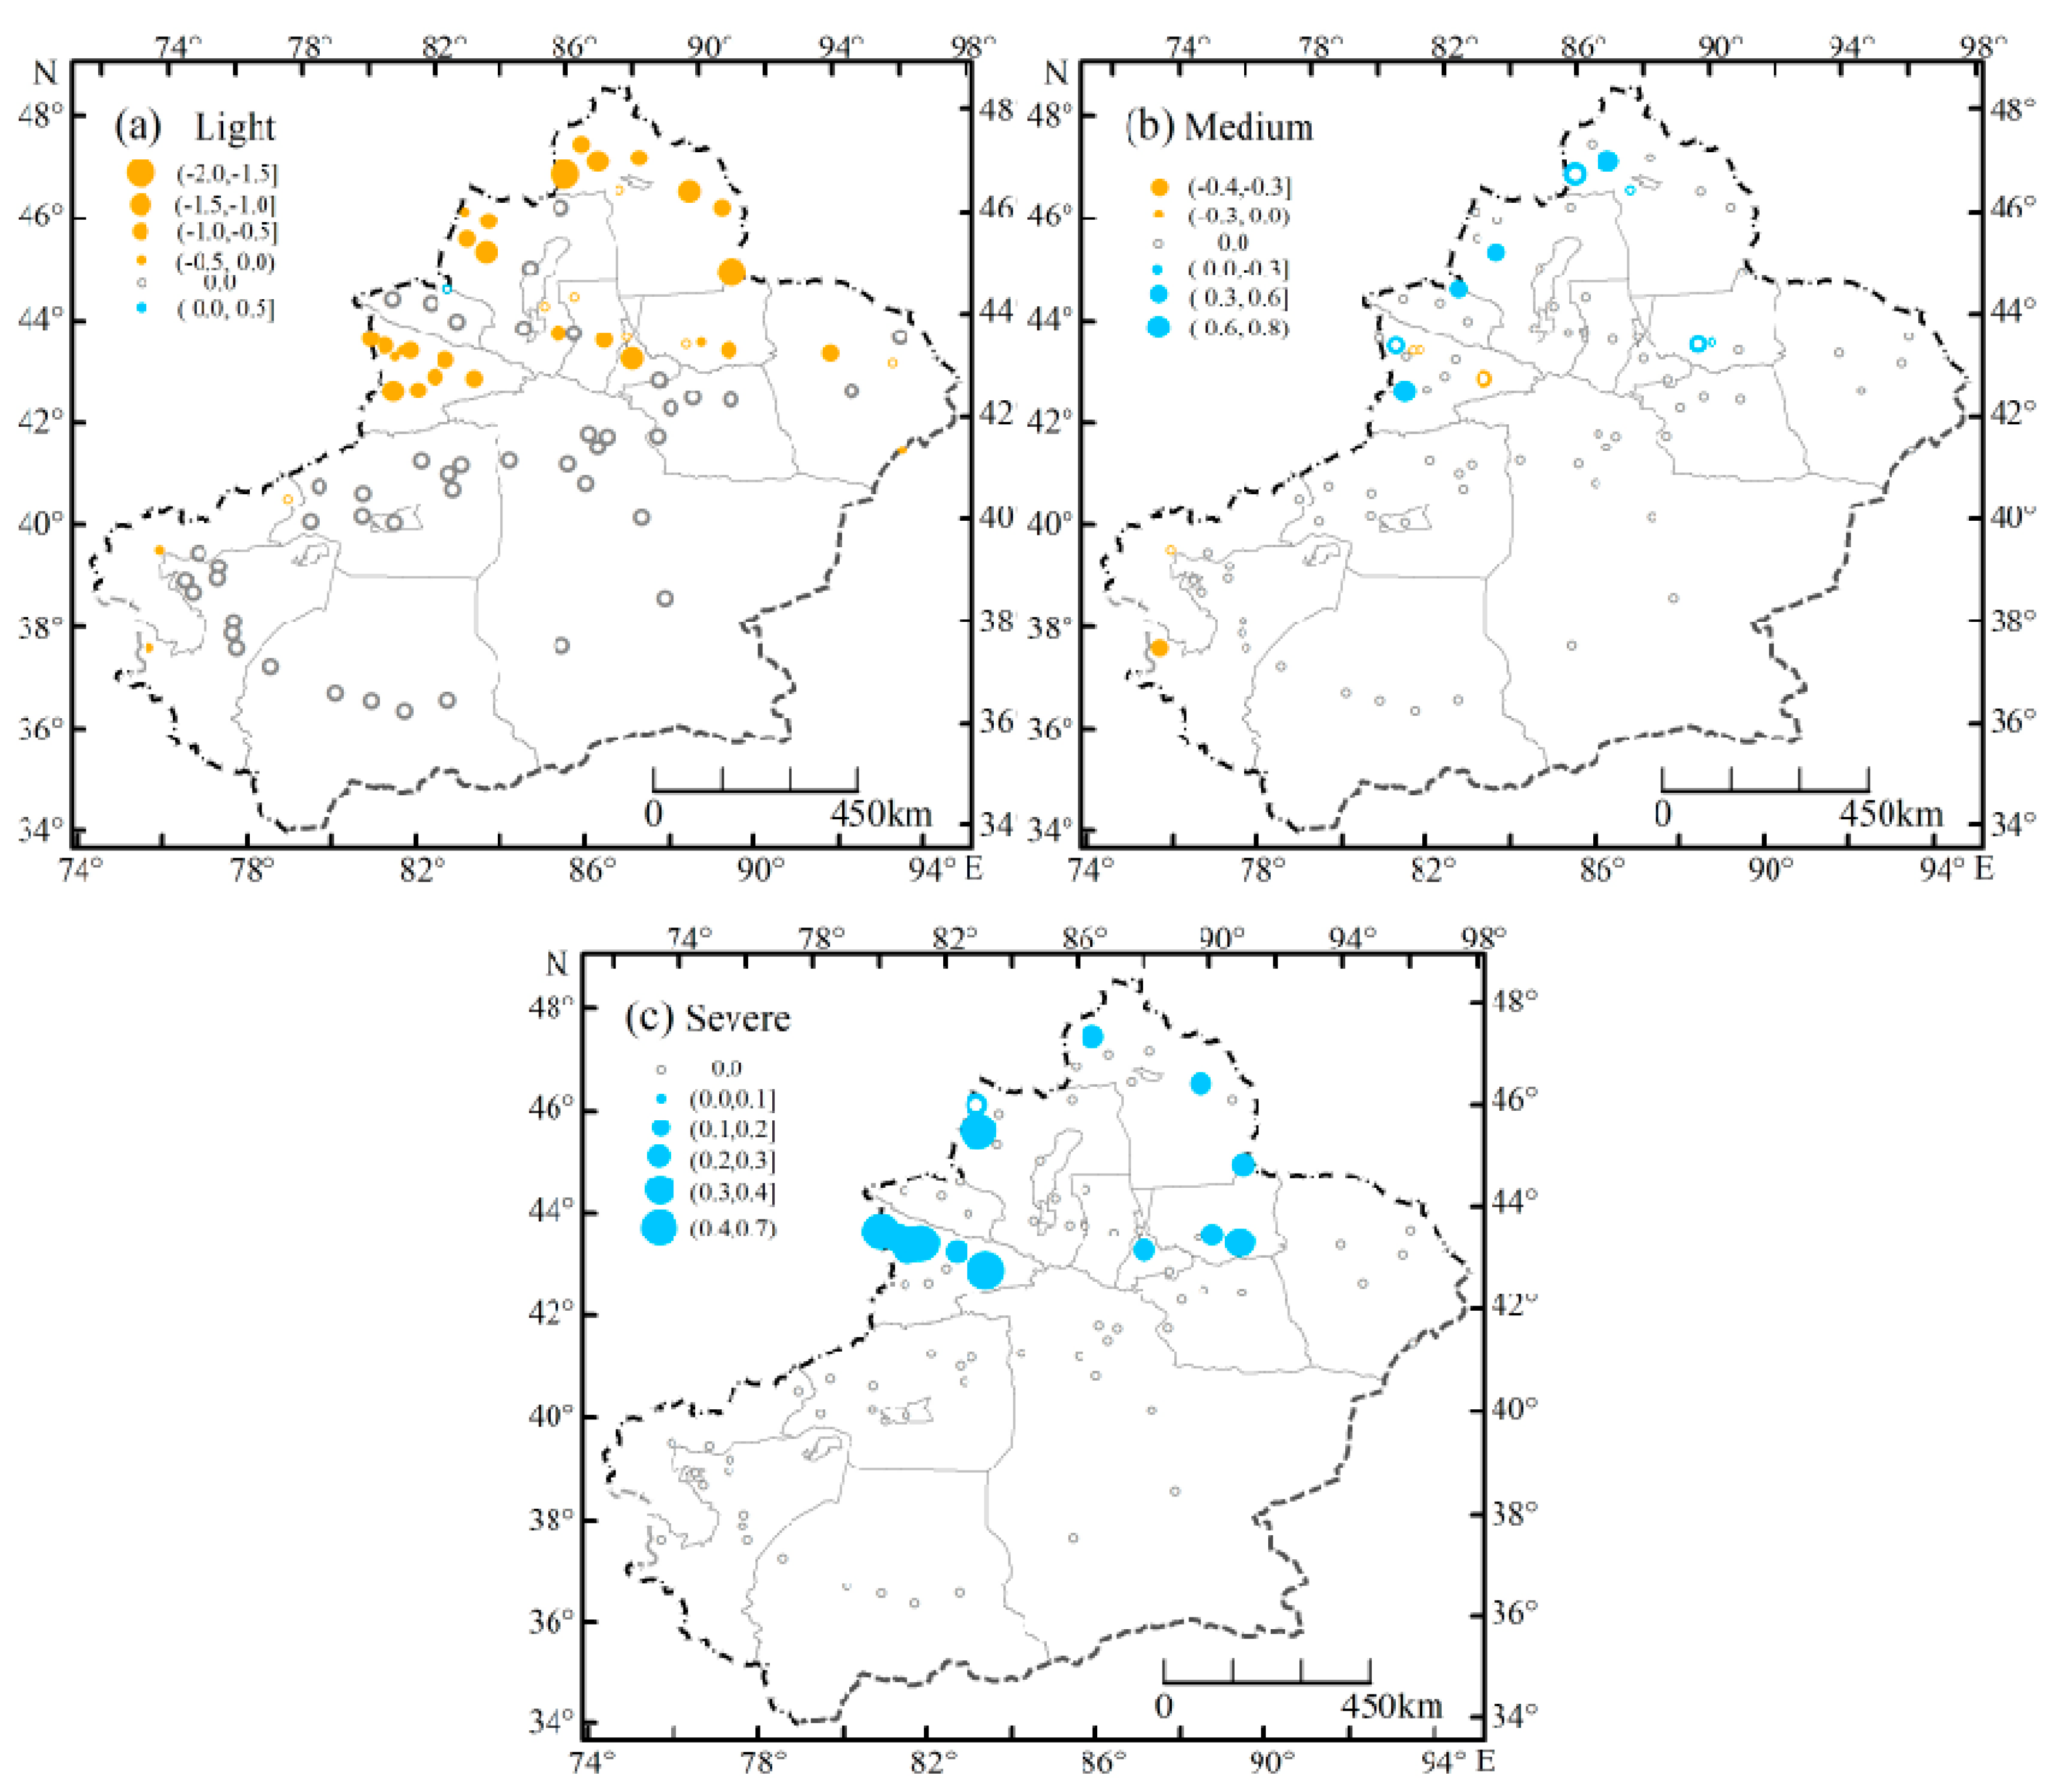
Figure 5 shows the spatial distribution of snow disaster trends across Xinjiang in the last 60 years. The frequency of severe snow disasters has increased and the frequency of light storms has decreased significantly in northern Xinjiang, with significant changes mainly occurring in the snow-rich Altai region, Tacheng Basin, Yili Valley and the northern slopes of the Tianshan Mountains. The occurrence frequency of extremely severe snow disasters was low, and the trends in their occurrence were not obvious (Figure omitted).
Calculating the significance of the trends of different grades of snow disasters at all stations in Xinjiang, “extremely significantly decrease (or increase)” and “significantly decrease (or increase)” indicate passing the significance test of α = 0.01 and α = 0.05, “No trend” indicates not passing the significance test of α = 0.05. Statistical analysis showed the number of stations with a significant decrease in the frequency of light snow disasters and a significant increase in medium and severe snow disasters in Xinjiang over the last 60 years. Among them, the frequency of light snow disasters had significant and extremely significant decreases in 28% and 8% of all stations in Xinjiang over the last 60 years, respectively. Approximately 5% and 1% of stations had a significant and extremely significant increase in medium snow disasters, and 5% and 12% of stations had a significant and extremely significant increase in severe snow disasters. The overall trend in the frequency of extremely severe snow disasters was not significant (Figure 6).
In the last 60 years, the frequency of the light grade urban snow disasters showed a significantly decreasing trend, with a decreasing rate of 29.0 events·decade−1 in the whole area. However, the medium, severe and extremely severe grades showed an increasing trend, with increasing rates of 6.0 events·decade−1, 9.9 events·decade−1, and 2.4 events·decade−1, respectively. The variation in the frequency of snow disasters in the northern and southern areas was consistent with the trend in the whole region. In northern Xinjiang, the frequency of light snow disasters decreased significantly, with a rate of decrease of 15.8 events·decade−1; the frequency of medium, severe and very severe snow disasters increased significantly, with rates of increase of 14.2 events·decade−1, 11.3 events·decade-1 and 2.9 events·decade−1. In southern Xinjiang, the rate of decrease in the frequency of light snow disasters was 2.7 events·decade−1, and the rates of increase in medium, heavy and extremely heavy snow disasters were 2.2 events·decade−1, 1.7 events·decade−1, and 0.3 events·decade−1, respectively (Figure 7).

3.1.3. Different Grades of Urban Snow Disaster Frequency at Different Periods

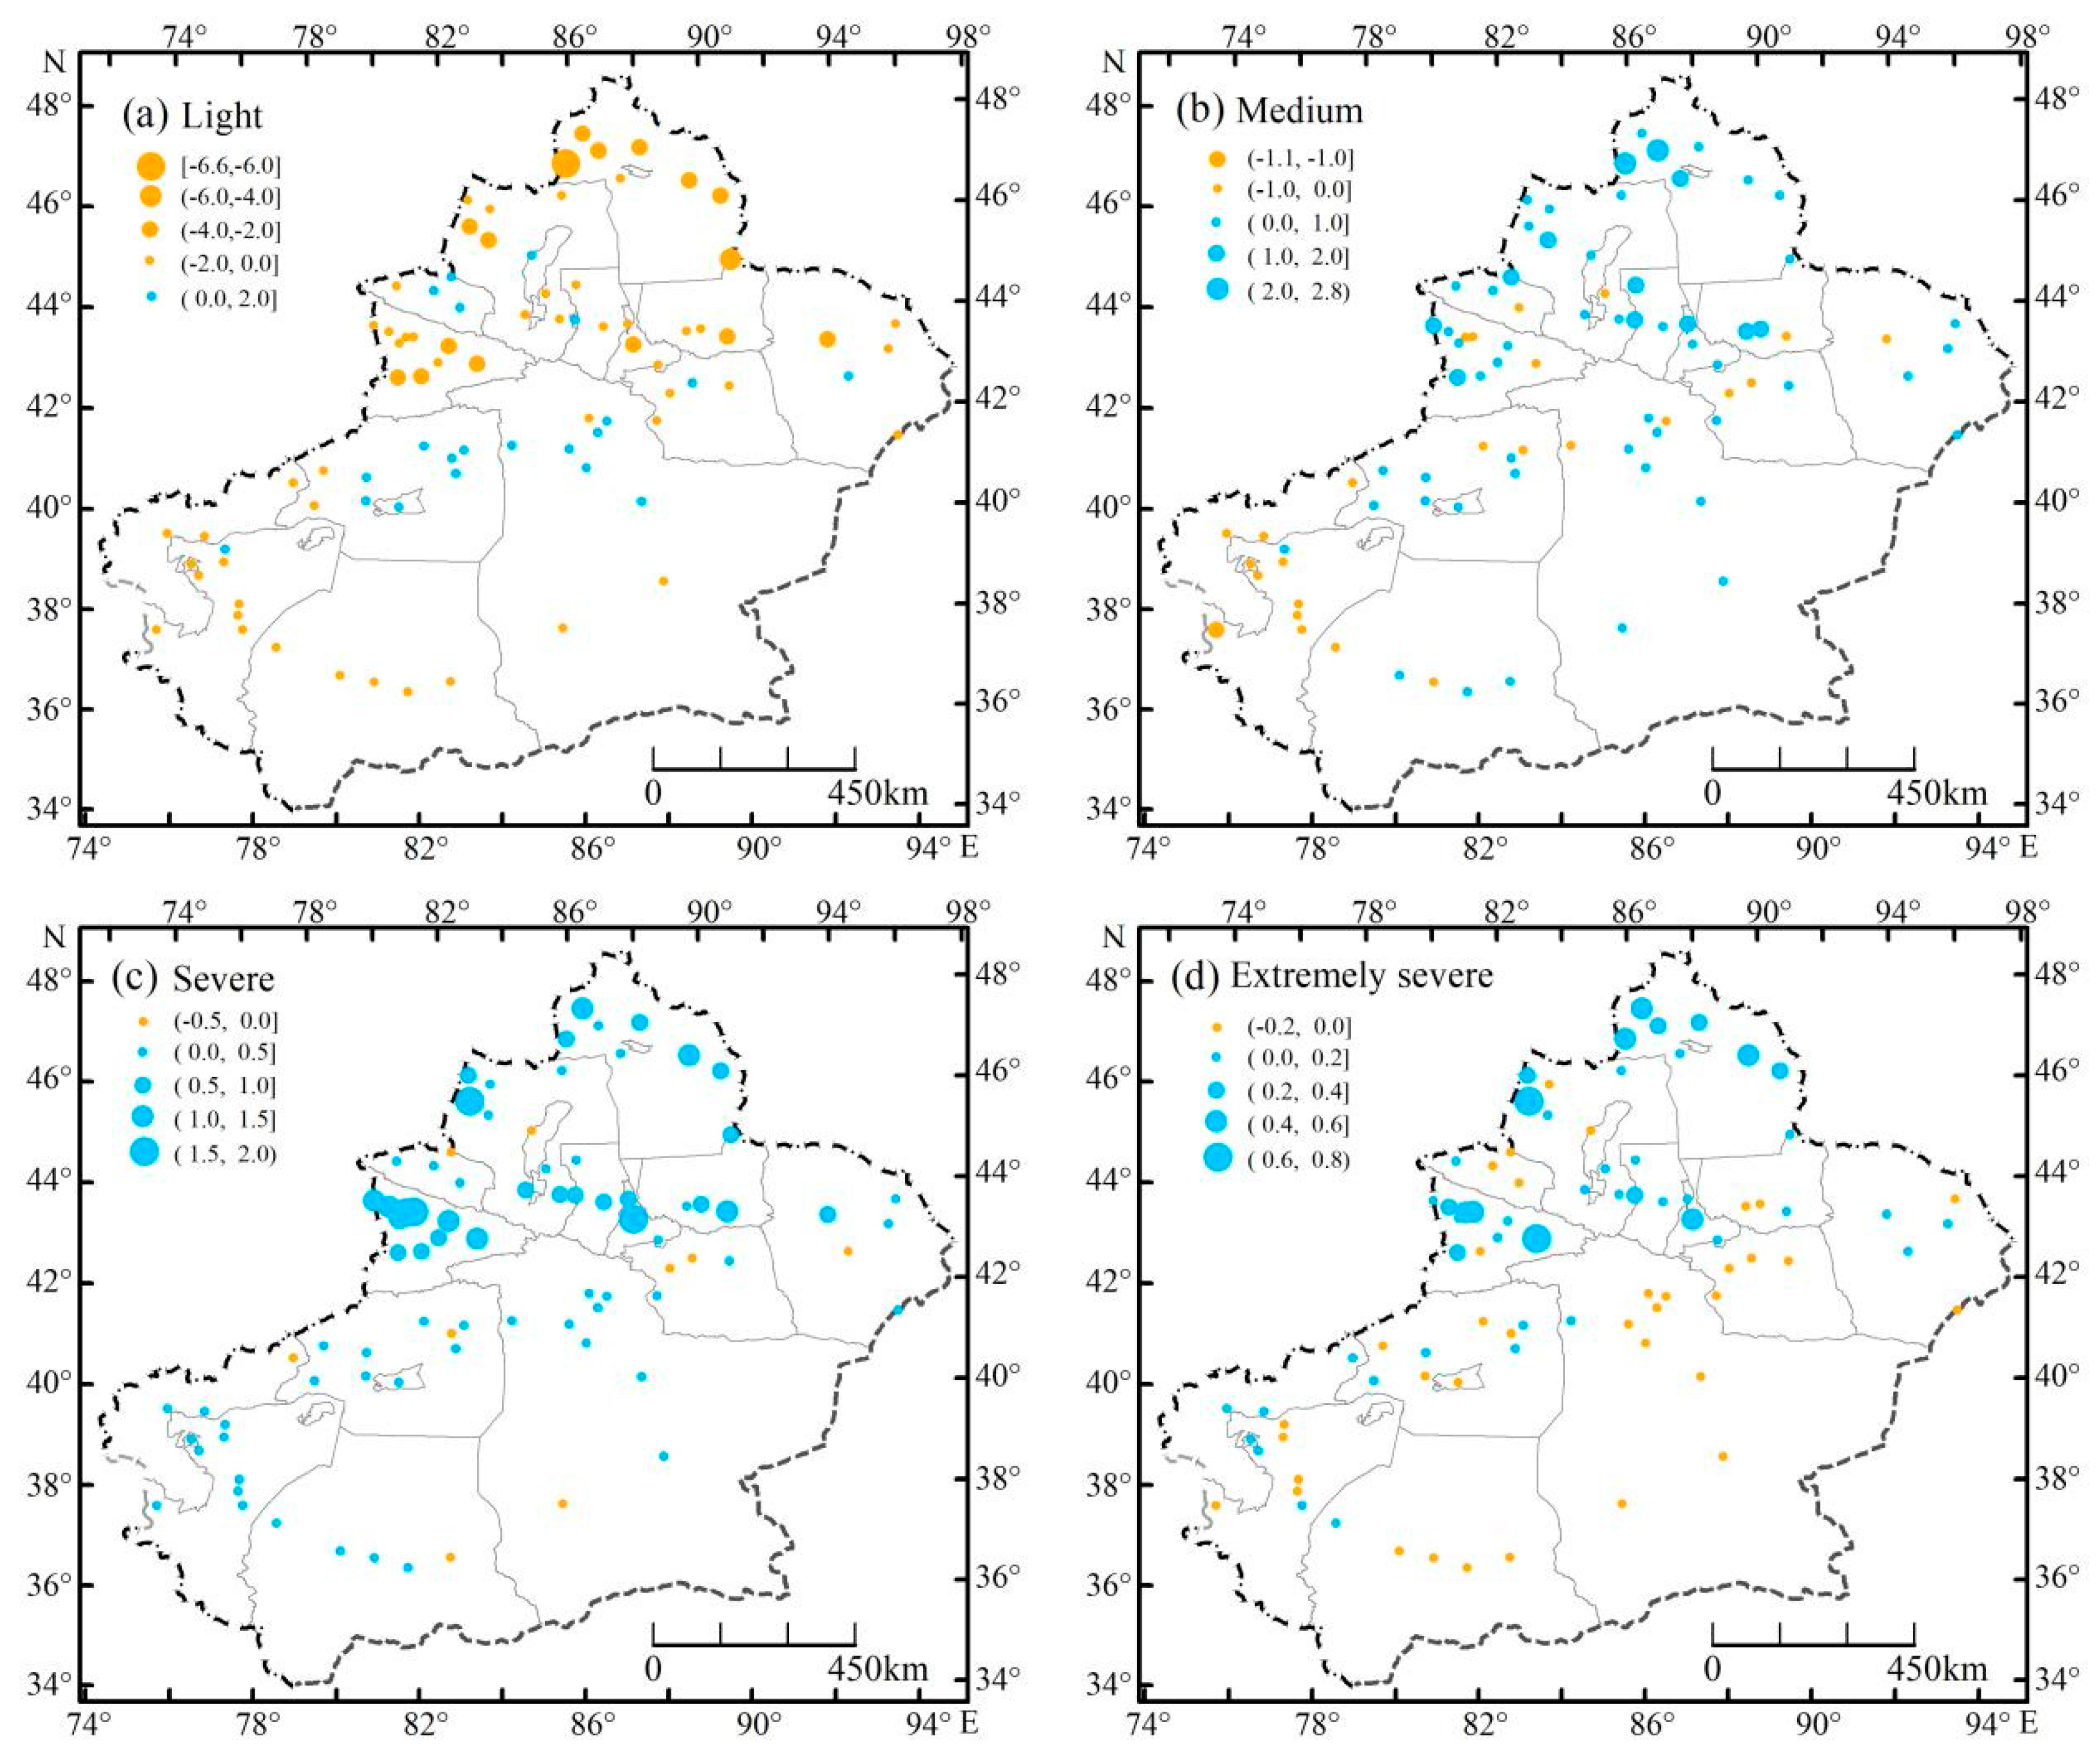
From 1961–1990 to 1991–2020, light snow disasters increased at 75% of the stations, whereas medium snow disasters increased at 71%, and severe and extremely severe snow disasters at about 92% of the stations (Figure 8). In terms of spatial change, the areas with the greatest increase in the annual frequency of severe and above-grade snow disasters and the areas with the greatest decrease in light snow disasters are mainly in northern Xinjiang, including the Altai region, Tacheng Basin, Yili Valley and the northern slope of the Tianshan Mountains, as shown in Figure 9.
Compared with 1961–1990, the annual average cumulative frequency and maximum and minimum frequencies of light snow disasters all showed a significant decrease and an increase in medium and above-grade snow disasters during the period of 1991–2020 (Figure 4). In Xinjiang and northern Xinjiang, the annual frequency of light snow disasters decreased by approximately 20%, while the medium frequency increased by 7% and 9%, the frequency of severe events increased by 70% and 50%, and the frequency of extremely severe events increased by 100%. In the last 30 years, the average annual frequency and the maximum and minimum frequencies of light and medium snow disasters decreased compared with that of 1961–1990, while severe and extremely severe snow disasters increased in southern Xinjiang. The annual frequency of severe snow disasters increased by 83%, and light snow disasters decreased by 6%, while the frequency of medium and extremely severe snow disasters did not change much.
Figure 3 shows that the proportions of the frequency of light, medium, severe and extremely severe snow disasters in the region were 49%, 40%, 10% and 1%, respectively, during 1991–2020 and were 39%, 44%, 15% and 2%, respectively, in 1961–1990. Compared with the previous 30 years (1961–1990), the proportion of light snow disasters decreased by 10%, medium and severe snow disasters increased by 4% and 5%, and extremely heavy snow disasters increased by 1%. The changes between these two periods in the north and the south were basically consistent with the whole region, but the change in northern Xinjiang was more significant than that in southern Xinjiang.

3.2. Relationship between Urban Snow Disasters and Atmospheric Circulation Indices

The frequency of urban snow disasters in Xinjiang was well correlated with the NHPVCI, IBTI and AO during the winter half-year (September to February), autumn (September to November) and winter (December to February) (Table 4). The results showed that medium and above snow disasters in northern Xinjiang were positively correlated with the NHPVCI and IBTI, especially severe and extremely severe snow disasters, which were significantly correlated with both indices during the cold season and the winter, and the correlation coefficients pass the significance test of α = 0.01. Furthermore, light snow disasters were negatively correlated with both indices, but they did not pass the significance test. In northern Xinjiang, the different grades of snow disasters were negatively correlated with AO in the cold season and the winter, with a significant negative correlation for extremely severe snow disasters and a nonsignificant positive correlation with AO in autumn. In southern Xinjiang, severe snow disasters were significantly and positively correlated with the IBTI in the cold season and autumn, and the other grades of snow disasters were generally not significantly correlated with the above three circulation indices.

4. Discussion and Conclusions

This study analyzed the spatial and temporal patterns of the frequency of different grades of urban snow disasters in Xinjiang from 1961 to 2020 and the relationship between them and the atmospheric circulation indices during the cold season of the Northern Hemisphere, which are summarized as follows.
In the context of global warming, the frequency of light snow disasters has decreased significantly in the last 60 years, while the frequency of severe and extremely severe snow disasters has increased significantly. The regions with significant changes were mainly located in the Altai region, Tacheng basin, Yili valley and the northern slopes of the Tianshan Mountains, which were also the areas with the most snow and frequent snowstorms in Xinjiang, which was consistent with the regions where the number of snow days with snow depths >20 cm and the number of severe snowstorm processes had increased significantly since the 1980s [42,43,44]. This change was even more pronounced in 1991–2020 and occurred in more than 70% of Xinjiang, and severe and extremely severe snow disasters increased in 92% of the regions. Compared to the previous 30 years, the average annual frequency and the maximum and minimum frequencies of snow disasters grades medium and above all increased, especially the frequency of severe and extremely severe events, which increased by more than 70%, and the frequency of light events, which decreased by approximately 20%.
The frequency of severe and extremely severe snow disasters in northern Xinjiang was significantly positively correlated with the NHPVCI and IBTI, and the frequency of extremely severe snow disasters was significantly negatively correlated with the AO in the cold season and the winter. Severe snow disasters in southern Xinjiang are positively and significantly correlated with the IBTI during the cold season and autumn. It had been suggested that the temperature, precipitation, and heavy snowfall of northern Xinjiang in winter were closely related to the location and intensity of the polar vortex [45,46], which was also consistent with the findings of this study.
It is important to note that extreme weather and climate events are frequently occurring in the context of global warming. It has particularly impacted Xinjiang in recent years, leading to an increased risk of snow disasters. For example, the winter of 2010 was characterized by severe cold waves and strong breezes in northern Xinjiang, with 10 extreme snowstorms. Furthermore, a study showed that the mean contribution of extreme precipitation (defined as daily precipitation exceeding its 95th percentile) to total precipitation in Xinjiang was greater than 26%, with an increasing trend for both rain and snow [47]. The number of snowfall days and the amount of snowfall were mainly increased by moderate snow and heavy snow, and the snowfall intensity was mainly increased by blizzard intensity. The contribution of light snow to the number of snowfall days and the amount of snowfall showed a decreasing trend, the other levels showed an increasing trend, and the contribution of medium snow days and heavy snow amounts was the most obvious [48]. This is in line with our findings, which showed an increase in the frequency of medium and above snow disasters, a significant increase in severe and extremely severe snow disasters, and a significant decrease in light snow disasters in Xinjiang. The interannual variations in severe and extremely severe snow disasters showed that these events have been relatively frequent during the last 30 years, and it is necessary to expand the research on the causes and effects of snow disasters to reduce the disaster losses caused by extreme weather and climate events in Xinjiang.
This study focuses on the spatiotemporal variability of the occurrence frequency of urban snow disasters in Xinjiang over the past 60 years and the relationship between that variability and the atmospheric circulation indices in the Northern Hemisphere. However, future research will focus on studying the impact that atmospheric circulation in the Northern Hemisphere and greenhouse gas and aerosol emissions have on snow disasters in Xinjiang.

Author Contributions

Conceptualization, methodology, data analysis, and writing—original draft preparation, H.W.; formal analysis, supervision, validation, and writing—review and editing, S.D.; investigation, validation, writing—review and editing, M.W.; data curation, S.W.; visualization, software, X.Y. and J.L. All authors have read and agreed to the published version of the manuscript.

Funding

This research was funded by the Guided Project of Xinjiang Meteorological Bureau [YD202217] and LCPS Youth Fund [2022].

Data Availability Statement

The datasets are available upon request to the first author.

Conflicts of Interest

The authors declare no conflict of interest.

References

  1. Wei, Y.; Wang, S.; Fang, Y.; Nawaz, Z. Integrated assessment on the vulnerability of animal husbandry to snow disasters under climate change in the Qinghai-Tibetan Plateau. Glob. Planet. Change 2017, 157, 139–152. [Google Scholar] [CrossRef]
  2. Qin, D.; Edi, D.C. China National Assessment Report on Risk Management and Adaptation of Climate Extremes and Disasters; Science Report: Beijing, China, 2015. [Google Scholar]
  3. Kunkel, K.E.; Robinson, D.A.; Champion, S.; Yin, X.; Estilow, T.; Frankson, R.M. Trends and extremes in Northern Hemisphere snow characteristics. Curr. Clim. Change Rep. 2016, 2, 65–73. [Google Scholar] [CrossRef]
  4. Chen, H.; Sun, J.; Lin, W. Anthropogenic influence would increase intense snowfall events over parts of the Northern Hemisphere in the future. Environ. Res. Lett. 2020, 15, 114022. [Google Scholar] [CrossRef]
  5. Ding, Y.; Wang, Z.; Song, Y.; Zhang, J. Causes of the unprecedented freezing disaster in January 2008 and its possible association with the global warming. Acta Meteorol. Sin. 2008, 66, 808–825. (In Chinese) [Google Scholar]
  6. Vavrus, S. The role of terrestrial snow cover in the climate system. Clim. Dyn. 2007, 29, 73–88. [Google Scholar] [CrossRef]
  7. Zhou, B.; Xu, Y.; Wu, J.; Dong, S.; Shi, Y. Changes in temperature and precipitation extreme indices over China: Analysis of a high-resolution grid dataset. Int. J. Climatol. 2016, 36, 1051–1066. [Google Scholar] [CrossRef]
  8. Zhou, B.; Gu, L.; Ding, Y.; Shao, L.; Wu, Z.; Yang, X.; Li, C.; Li, Z.; Wang, X.; Cao, Y.; et al. The great 2008 Chinese ice storm: Its socioeconomic-ecological impact and sustainability lessons learned. Bull. Am. Meteorol. Soc. 2011, 92, 47–60. [Google Scholar] [CrossRef]
  9. Zhuang, X.; Zhou, H.; Wang, L.; Li, B. Evaluation and cause study on the snow disasters in pastoral areas of northern Xinjiang. Arid. Zone Res. 2015, 32, 1000–1006. [Google Scholar]
  10. Lin, W.; Chen, H. Changes in the spatial–temporal characteristics of daily snowfall events over the Eurasian continent from 1980 to 2019. Int. J. Climatol. 2022, 42, 1841–1853. [Google Scholar] [CrossRef]
  11. Guo, X.; Li, L.; Liu, C.; Wang, F.; Li, B. Spatio-temporal distribution of snow disaster in Qinghai Plateau during 1961–2008. Adv. Clim. Change Res. 2010, 6, 332–337. [Google Scholar]
  12. Wang, X.; Chu, C.-J.; Mou, H. Spatial pattern and interannual variation characteristics of snow disaster in Xinjiang. Arid. Zone Res. 2020, 37, 1488–1495. [Google Scholar]
  13. Liu, C.; Yu, J.; Yang, Y. A study of the response of snow disaster frequency to sea surface temperature forcing anomaly forcing over the Qinghai-Xizang Plateau. Plateau Meteorol. 2021, 40, 486–494. [Google Scholar]
  14. Huang, X.; Tang, S.; Ciwang, D. Variation of the snow disasters under global warming and its relationship with general circulation over Tibetan Plateau. Plateau Meteorol. 2018, 37, 325–332. [Google Scholar]
  15. Li, H.; Xi, W.; Zhang, L.; Zang, S. Snow-disaster risk zoning and assessment in Heilongjiang Province. Sustainability 2021, 13, 14010. [Google Scholar] [CrossRef]
  16. Li, J.; Zou, Y.; Zhang, Y.; Sun, S.; Dong, X. Risk assessment of snow disasters for animal husbandry on the Qinghai–Tibetan Plateau and influences of snow disasters on the well-being of farmers and pastoralists. Remote Sens. 2022, 14, 3358. [Google Scholar] [CrossRef]
  17. Liu, D.; Zhang, L.; Jiang, S.; Shi, S.; Li, Y. Hazard prediction and risk regionalization of snowstorms in northeast China. Phys. Chem. Earth Parts A/B/C 2019, 116, 102832. [Google Scholar] [CrossRef]
  18. Wang, S.; Zhou, L.; Wei, Y. Integrated risk assessment of snow disaster over the Qinghai-Tibet Plateau. Geomat. Nat. Hazards Risk 2019, 10, 740–757. [Google Scholar]
  19. Yang, D.; Liu, F.; Yan, J.; Zhang, Y.; Zhou, Q. A risk assessment of snow disaster along Qinghai-Tibet Railway. Geogr. Res. 2021, 40, 1223–1238. [Google Scholar]
  20. Dai, Y.; Chen, D.; Yao, T.; Wang, L. Large lakes over the Tibetan Plateau may boost snow downwind: Implications for snow disaster. Sci. Bull. 2020, 65, 1713–1717. [Google Scholar] [CrossRef]
  21. Wang, S.; Sheng, Y.; Wei, Y. Risk prevention and control strategies for the severely affected areas of snow disaster in the Three Rivers Source Region (TRSR). China Sci. Cold Arid. Reg. 2019, 11, 80–84. [Google Scholar]
  22. Alexander, L.V. Global observed long-term changes in temperature and precipitation extremes: A review of progress and limitations in IPCC assessments and beyond. Weather. Clim. Extrem. 2016, 11, 4–16. [Google Scholar] [CrossRef]
  23. IPCC. Summary for Policymakers. In Climate Change 2021: The Physical Science Basis. Contribution of Working Group I to the Sixth Assessment Report of the Intergovernmental Panel on Climate Change; Cambridge University Press: Cambridge, UK, 2021; p. 2391. [Google Scholar]
  24. Paik, S.; Min, S.; Zhang, X.; Donat, M.G.; King, A.D.; Sun, Q. Determining the anthropogenic greenhouse gas contribution to the observed intensification of extreme precipitation. Geophys. Res. Lett. 2020, 47, e2019GL086875. [Google Scholar] [CrossRef]
  25. Dong, S.; Sun, Y.; Li, C. Detection of Human Influence on Precipitation Extremes in Asia. J. Clim. 2020, 33, 5293–5304. [Google Scholar] [CrossRef]
  26. Burke, C.; Stott, P. Impact of Anthropogenic Climate Change on the East Asian Summer Monsoon. J. Clim. 2017, 30, 5205–5220. [Google Scholar] [CrossRef]
  27. Ma, S.; Zhou, T.; Stone, D.A.; Polson, D.; Dai, A.; Stott, P.A.; von Storch, H.; Qian, Y.; Burke, C.; Wu, P. Detectable anthropogenic shift toward heavy precipitation over Eastern China. J. Clim. 2017, 30, 1381–1396. [Google Scholar] [CrossRef]
  28. Dong, S.; Sun, Y.; Zhang, X. Attributing observed increase in extreme precipitation in China to human influence. Environ. Res. Lett. 2022, 17, 095005. [Google Scholar] [CrossRef]
  29. Zhang, C.; Tang, Q.; Chen, D.; Van der Ent, R.J.; Liu, X.; Li, W.; Haile, G.G. Moisture source changes contributed to different precipitation changes over the northern and southern Tibetan Plateau. J. Hydrometeorol. 2019, 20, 217–229. [Google Scholar] [CrossRef]
  30. O’Gorman, P.A. Contrasting responses of mean and extreme snowfall to climate change. Nature 2014, 512, 416–418. [Google Scholar] [CrossRef]
  31. Xi, S.; Zhang, Z. Spatial and temporal analysis of snow cover in China in recent 50 years. J. Arid. Meteorol. 2013, 31, 451–456. [Google Scholar]
  32. Wang, H.; Wang, M.; Wang, S.; Yu, X. Spatial-temporal variation characteristics of snow cover duration in Xinjiang from 1961 to 2017 and their relationship with meteorological factors. J. Glaciol. Geocryol. 2021, 43, 61–69. [Google Scholar]
  33. Yang, X.; Li, A.; Zhao, Y.; Wei, J. Spatial-temporal distribution and general circulation of snowstorm in northern Xinjiang from 1961 to 2018. J. Glaciol. Geocryol. 2020, 42, 756–765. [Google Scholar]
  34. Wang, X.; Lu, X.; Ma, Y.; Wang, X. Study on snow disaster assessment method and snow disaster regionalization in Xinjiang. J. Glaciol. Geocryol. 2019, 41, 836–844. [Google Scholar]
  35. Wang, Y.; Zhao, Z.; Yan, J.; Tang, Y.; Cai, Y. Spatial and temporal distribution characteristics and its classification of snow disaster in Xinjiang. Arid. Land Geogr. 2020, 43, 577–583. [Google Scholar]
  36. Yao, J.; Chen, Y.; Guan, X.; Zhao, Y.; Chen, J.; Mao, W. Recent climate and hydrological changes in a mountain–basin system in Xinjiang; China. Earth-Sci. Rev. 2022, 226, 103957. [Google Scholar] [CrossRef]
  37. Shi, Y. Chinese Meteorological Disaster Canon: Xinjiang Volume; China Meteorological Press: Beijing, China, 2006. [Google Scholar]
  38. Allen, S.; Frey, H.; Huggel, C. Assessment of Glacier and Permafrost Hazards in Mountain Regions; Technical Guidance Document; GAPHAZ: Zurich, Switzerland; Lima, Peru, 2017; pp. 6–9. [Google Scholar]
  39. China Meteorological Administration. Meteorological Grades for Urban Snow Hazard (QX/T 178-2013); China Meteorological Press: Beijing, China, 2013. [Google Scholar]
  40. Kendall, M.G. Rank correlation measures. Charles Griffin Lond. 1975, 202, 15. [Google Scholar]
  41. Mann, H.B. Nonparametric tests against trend. Econom. J. Econom. Soc. 1945, 13, 245–259. [Google Scholar] [CrossRef]
  42. Wang, H.; Wang, S.; Yu, X.; Wang, M.; Han, X. Spatial-temporal variation of snow cover in Xinjiang based on surface observation from 1961 to 2017. J. Glaciol. Geocryol. 2020, 42, 150–158. [Google Scholar]
  43. Yang, L.; Yang, T.; Jia, L.H.; Chang, T. Analyses of climate characteristics and water vapor of heavy snow in Xinjiang Region. J. Glaciol. Cryopedology 2005, 27, 389–396. [Google Scholar]
  44. Liu, Y.; Ren, G.; Yu, H.; Kang, H. Climatic characteristics of intense snowfall in China with its variation. J. Appl. Meteorol. Sci. 2013, 24, 304–313. [Google Scholar]
  45. Guan, X.; Sun, W.; Li, M. Climate change in North Xinjiang and its response to Arctic Oscillation during the period of 1965—2012. Arid. Zone Res. 2016, 33, 681–689. [Google Scholar]
  46. Zhuang, X.; Li, B.; Li, R.; Zhou, H. Some advances on study of strong snowfall in Northern Xinjiang. Desert Oasis Meteorol. 2016, 10, 1–8. [Google Scholar]
  47. Wang, W.; Liu, Y.; Zhao, Q.; Qin, Y.; Meng, X.; Zhang, M.; Jin, Z. Spatiotemporal characteristics of extreme precipitation and its response to temperature change in Xinjiang; China. Trans. Chin. Soc. Agric. Eng. (Trans. CSAE) 2022, 38, 133–142. [Google Scholar]
  48. Liu, C.; An, D.; Zhang, J. Variation characteristics of different levels of snowfall in winter over Northern Xinjiang from 1961 to 2019. Desert Oasis Meteorol. 2021, 15, 115–122. [Google Scholar]
Figure 1. Distribution of meteorological stations in Xinjiang (the blue squares represent the meteorological stations in northern Xinjiang, and the purple squares represent the meteorological stations in southern Xinjiang).
Atmosphere 14 00802 g001
Figure 2. The spatial distribution of the mean annual number of different grades of urban snow disasters in Xinjiang (the color scale indicates the number of events) (light (a), medium (b), severe (c), extremely severe (d)).
Atmosphere 14 00802 g002
Figure 3. The percentage of urban snow disaster of different grades in Xinjiang, northern and southern regions in different periods of time from 1961 to 2020.
Atmosphere 14 00802 g003
Figure 4. Annual frequency of urban snow disasters in different grades in Xinjiang, northern and southern regions in different periods of time from 1961 to 2020.
Atmosphere 14 00802 g004
Figure 5. Spatial distribution of the linear trends in the frequency of urban snow disasters in Xinjiang (Unit: events/10 yr) (Light(a), Medium (b), Severe (c)) (● indicates passing the significance test of α = 0.05, ○ indicates not passing the significance test of α = 0.05).
Atmosphere 14 00802 g005
Figure 6. The fraction of stations with different levels of significance in the trends of urban snow disasters.
Atmosphere 14 00802 g006
Figure 7. The interannual variation in the frequency of urban snow disasters from 1961 to 2020, given as anomalies relative to the mean values for 1961–1990.
Atmosphere 14 00802 g007
Figure 8. The percentage of stations with increasing or decreasing trends in the annual frequency of different grades of urban snow disasters in Xinjiang from 1991 to 2020 compared with 1961–1990.
Atmosphere 14 00802 g008
Figure 9. Comparison of the difference value of the annual average frequency of different grades of urban snow disasters in Xinjiang from 1991 to 2020 with that from 1961 to 1990 (Light (a), Medium (b), Severe (c), Extremely severe (d)).
Atmosphere 14 00802 g009
Table 1. The corresponding component value of each meteorological factor in the urban snow disaster meteorological index.
Serial NumberMeteorological FactorThe Corresponding Component Value in the Urban Snow Disaster Meteorological Index
1Accumulated snowfall/mm≤4.95.0~9.910.0~19.920.0~29.930.0~39.9≥40.0
IR81624324048
2The maximum daily snowfall/mm≤2.42.5~4.95.0~9.910.0~19.920.0~29.9≥30.0
IRM81624324048
3Snow depth/cm≤9.910.0~19.920.0~29.930.0~39.940.0~49.9≥50.0
ID4812162024
4The number of consecutive days of snowfall/d123~45~67~8≥9
IN369121518
5Daily minimum temperature/°C≤−15.0−14.9~−10.0−9.9~−7.0−6.9~−5.0−4.9~−3.0−2.9~−1.0
IT369121518
6Daily maximum wind speed/(m/s)≤1.51.6~3.33.4~5.45.5~7.98.0~10.7≥10.8
IW24681012
7Daily minimum relative humidity/%≤49.9≥50
IRH48
Table 2. Classification of urban snow disasters.
GradeGrade DescriptionIndex Range
Light[34, 44]
Medium[45, 70]
Severe[71, 99]
Extremely severe[100, 192]
Table 3. The southern boundary characteristic contour of the northern polar vortex of the 500 hPa layer in each month.
Month123456789101112
Characteristic contour/dagpm548552552552560568572572568564556552
Table 4. Correlation analysis between the frequency of urban snow disasters of different grades and the atmospheric circulation index during the cold season in northern and southern Xinjiang.
RegionProjectsNorthern Hemisphere Polar Vortex Central Intensity IndexIndia-Burma Trough Intensity IndexAO
Winter
Half-Year
AutumnWinterWinter
Half-Year
AutumnWinterWinter
Half-Year
AutumnWinter
NorthernLight−0.278−0.154−0.062−0.241−0.241−0.254−0.0610.038−0.094
Medium0.1360.1340.1860.351 *0.340 *0.342 *−0.093−0.072−0.077
Severe0.484 **0.336 *0.453 **0.535 **0.497 **0.510 **−0.211−0.159−0.193
Extremely severe0.507 **0.333 *0.478 **0.434 **0.372 **0.388 **−0.397 **−0.217−0.353 *
SouthernLight−0.155−0.247−0.1150.0430.066−0.022−0.1310.051−0.177
Medium−0.013−0.018−0.0540.1160.1390.084−0.0680.086−0.049
Severe0.1340.0370.0920.344 *0.349 *0.278−0.168−0.047−0.108
Extremely severe−0.093−0.021−0.0820.1850.2630.123−0.046−0.086−0.002
Note: * indicates significance at the α = 0.05 level, ** indicates significance at the α = 0.01 level.
Disclaimer/Publisher’s Note: The statements, opinions and data contained in all publications are solely those of the individual author(s) and contributor(s) and not of MDPI and/or the editor(s). MDPI and/or the editor(s) disclaim responsibility for any injury to people or property resulting from any ideas, methods, instructions or products referred to in the content.