
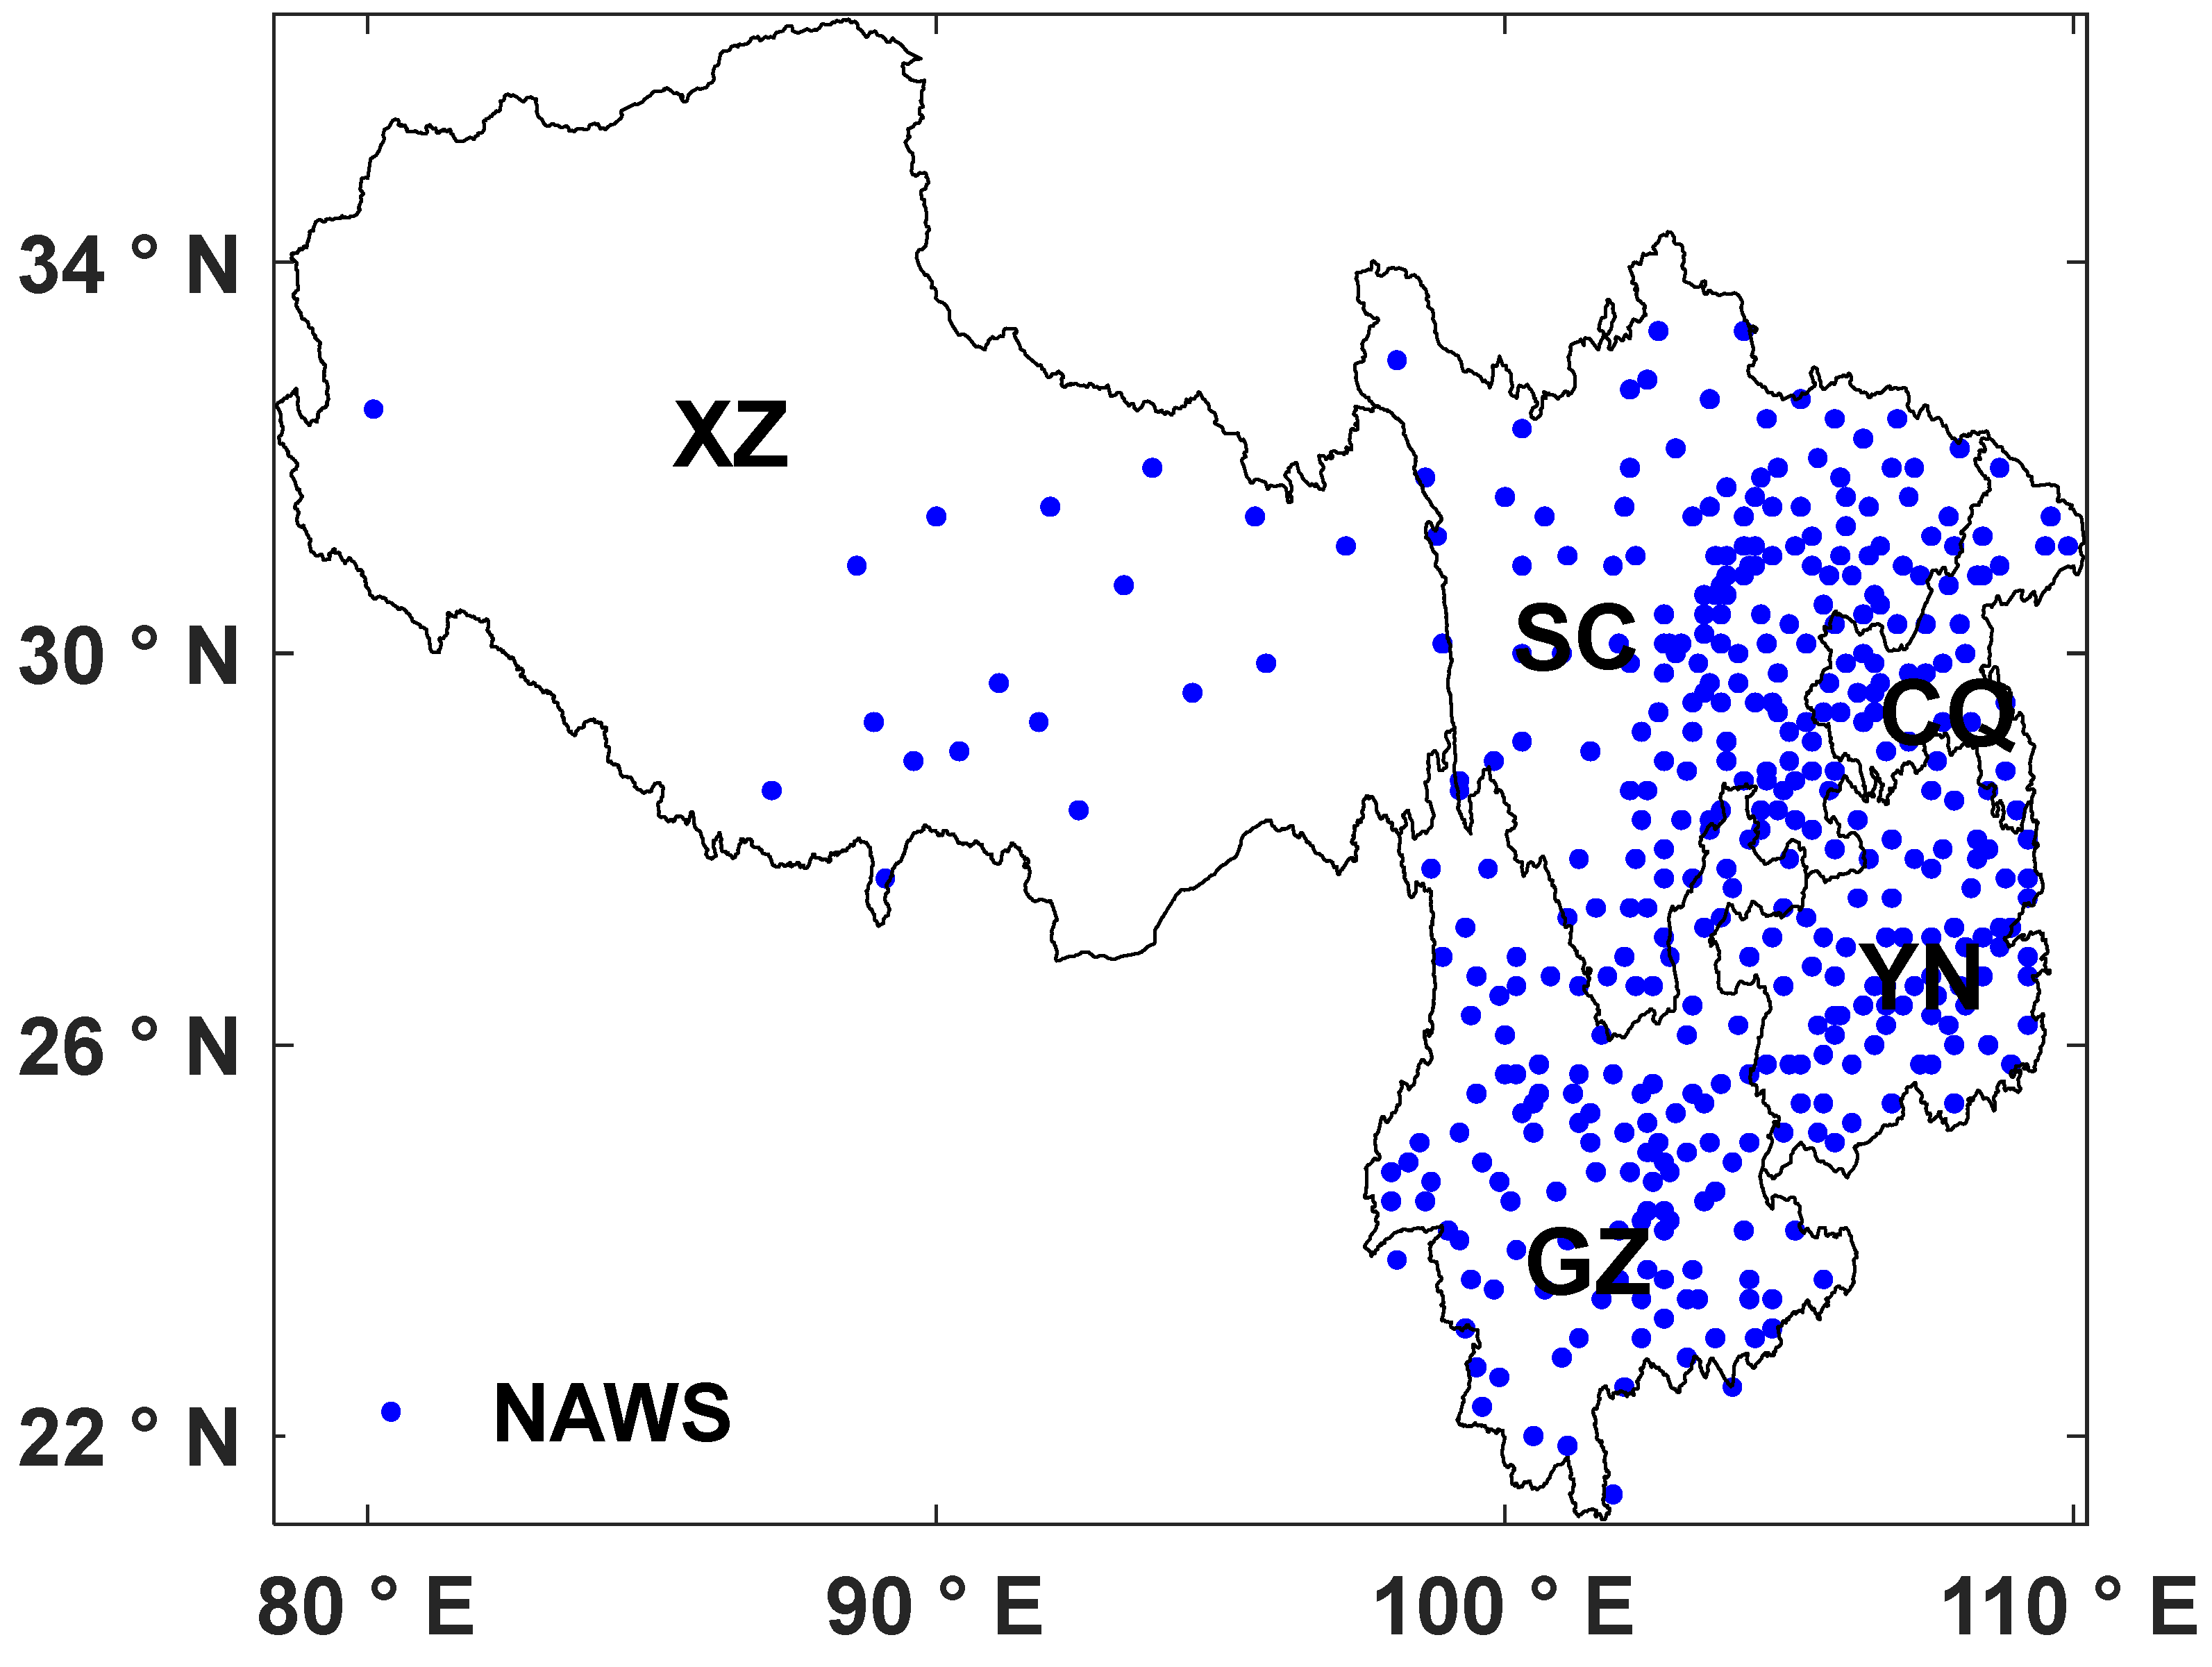
Spatial and Temporal Characteristics of Rainstorm Events in Southwest China from 1961 to 2021

Abstract
:1. Introduction
2. Data and Methods
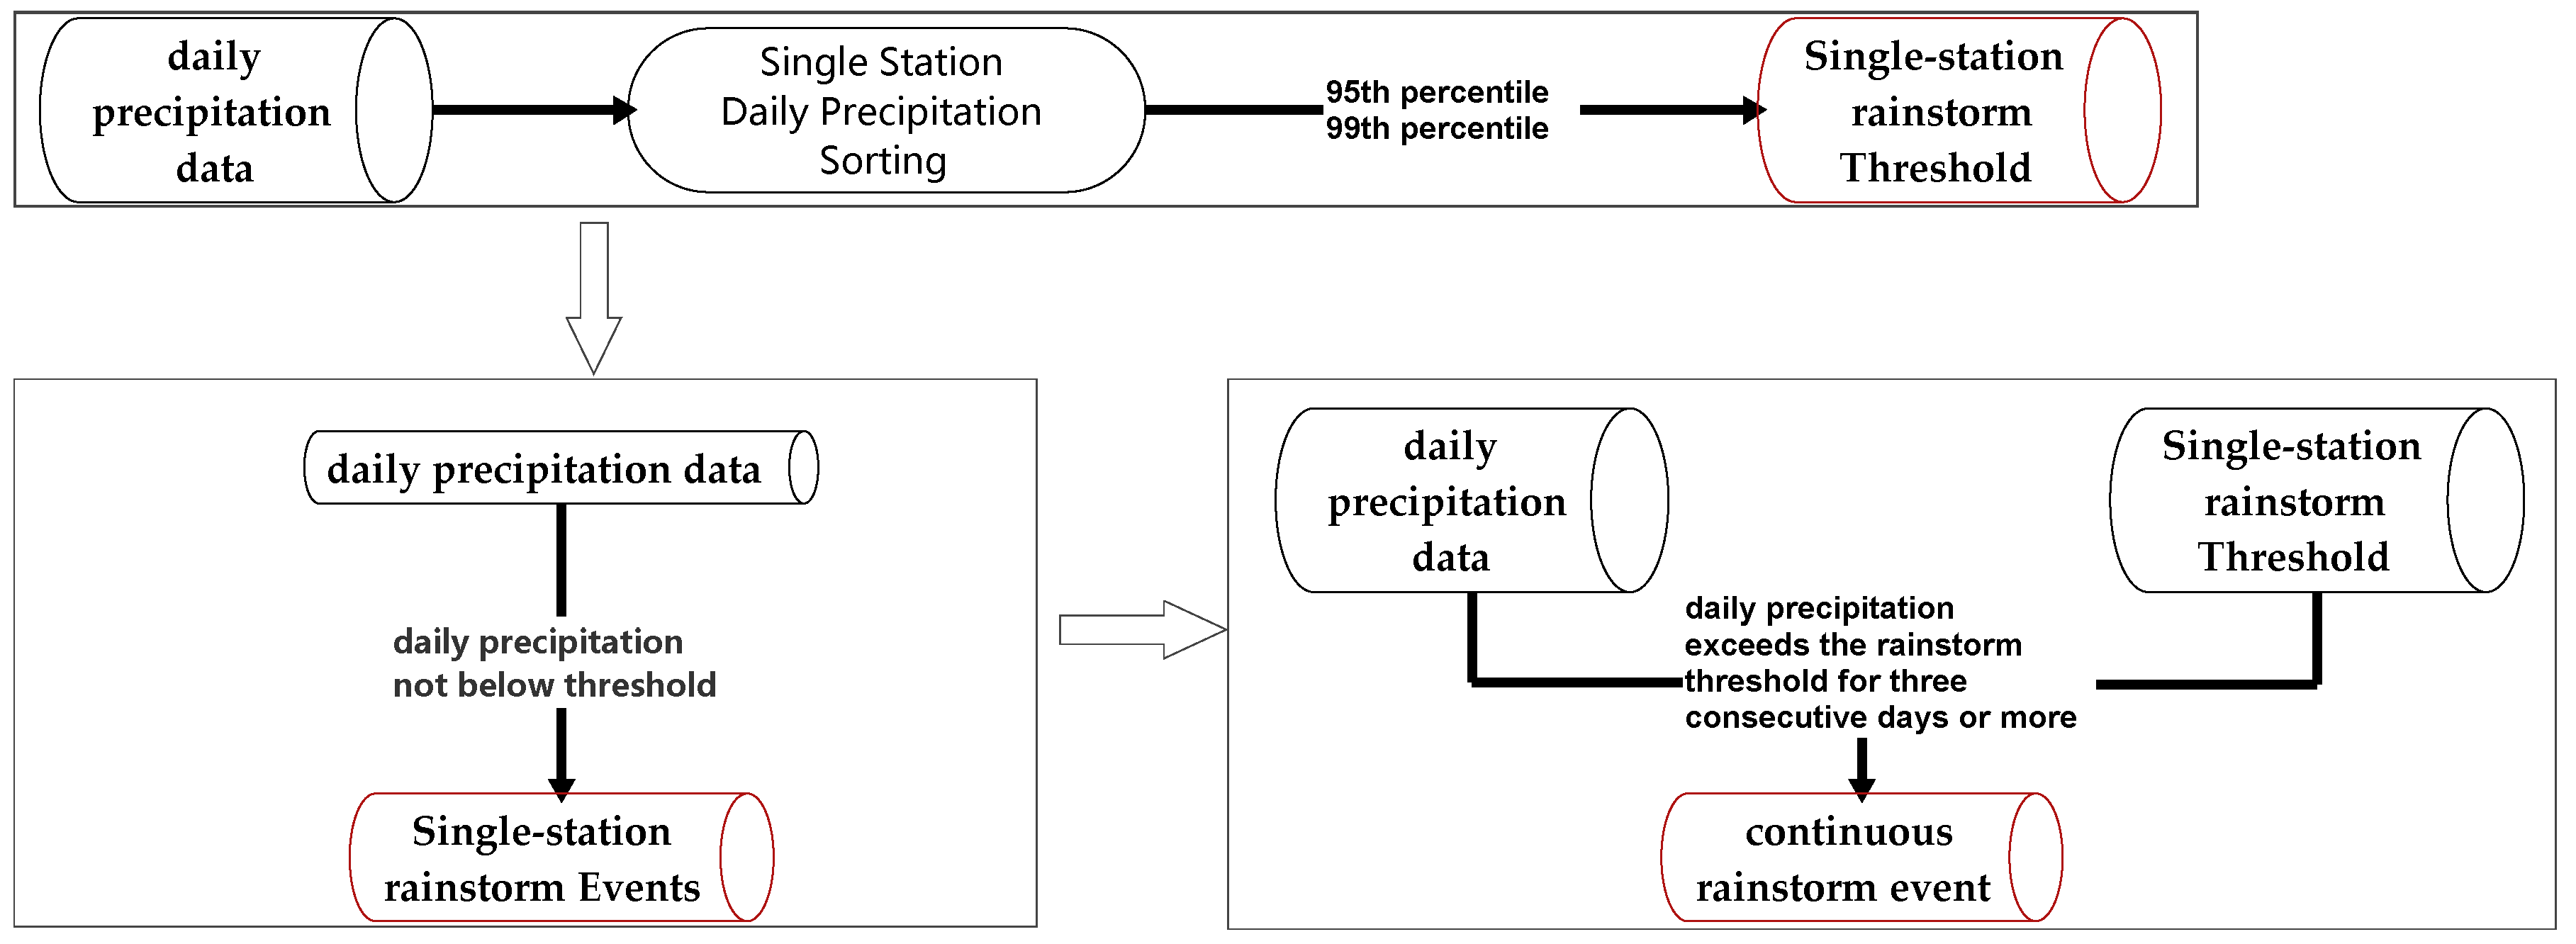
- (1)
- Extract precipitation data from China’s surface daily value dataset.
- (2)
- The precipitation data of ≥0.1 mm at each station is arranged in ascending order, and the precipitation values for the 99th percentile and 95th percentile are calculated, respectively.
- (3)
- Determine the rainstorm threshold at each station according to the following rules:
- (a)
- When the precipitation values of the 99th percentile is <50 mm, the precipitation value of the 95th percentile is taken as the rainstorm threshold of the station.
- (b)
- When the 99th percentile of a station is ≥50 mm, 50 mm is taken as the rainstorm threshold of the station.
3. Results
3.1. Single-Station Rainstorm Threshold
3.2. Temporal and Spatial Characteristics of Single-Station Rainstorm Events
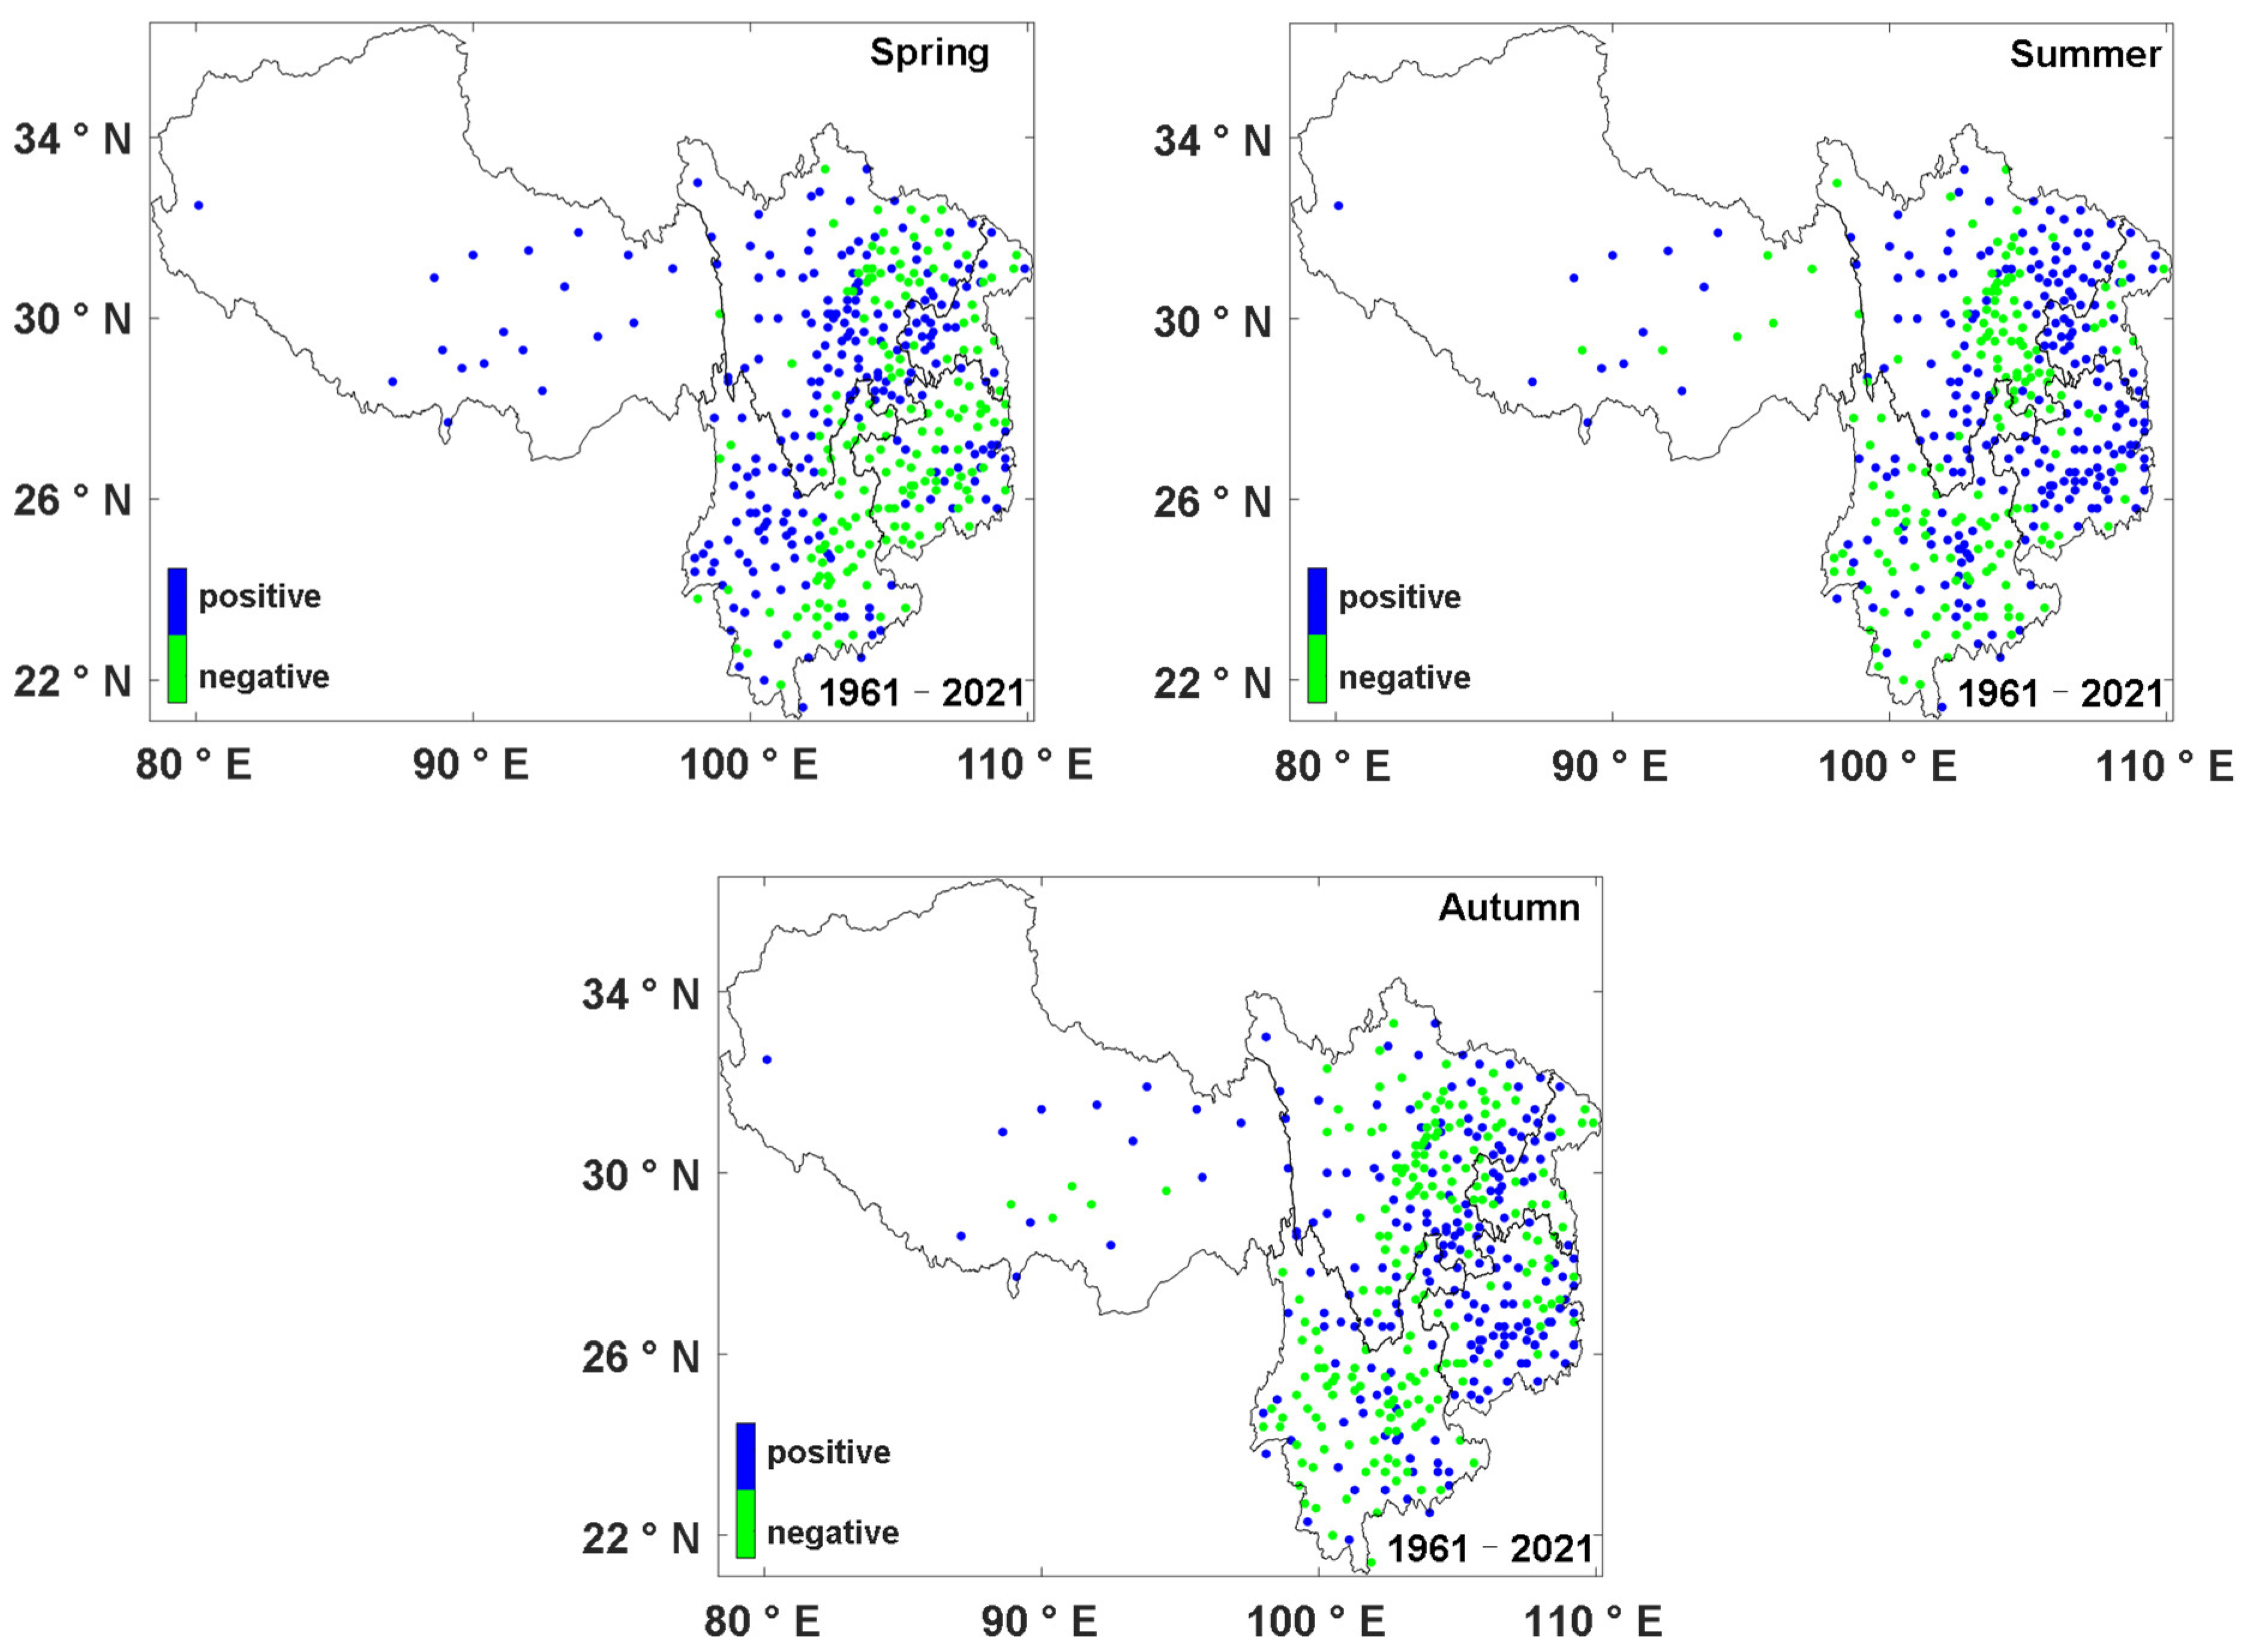
3.3. Seasonal Variation in Single-Station Rainstorm Events
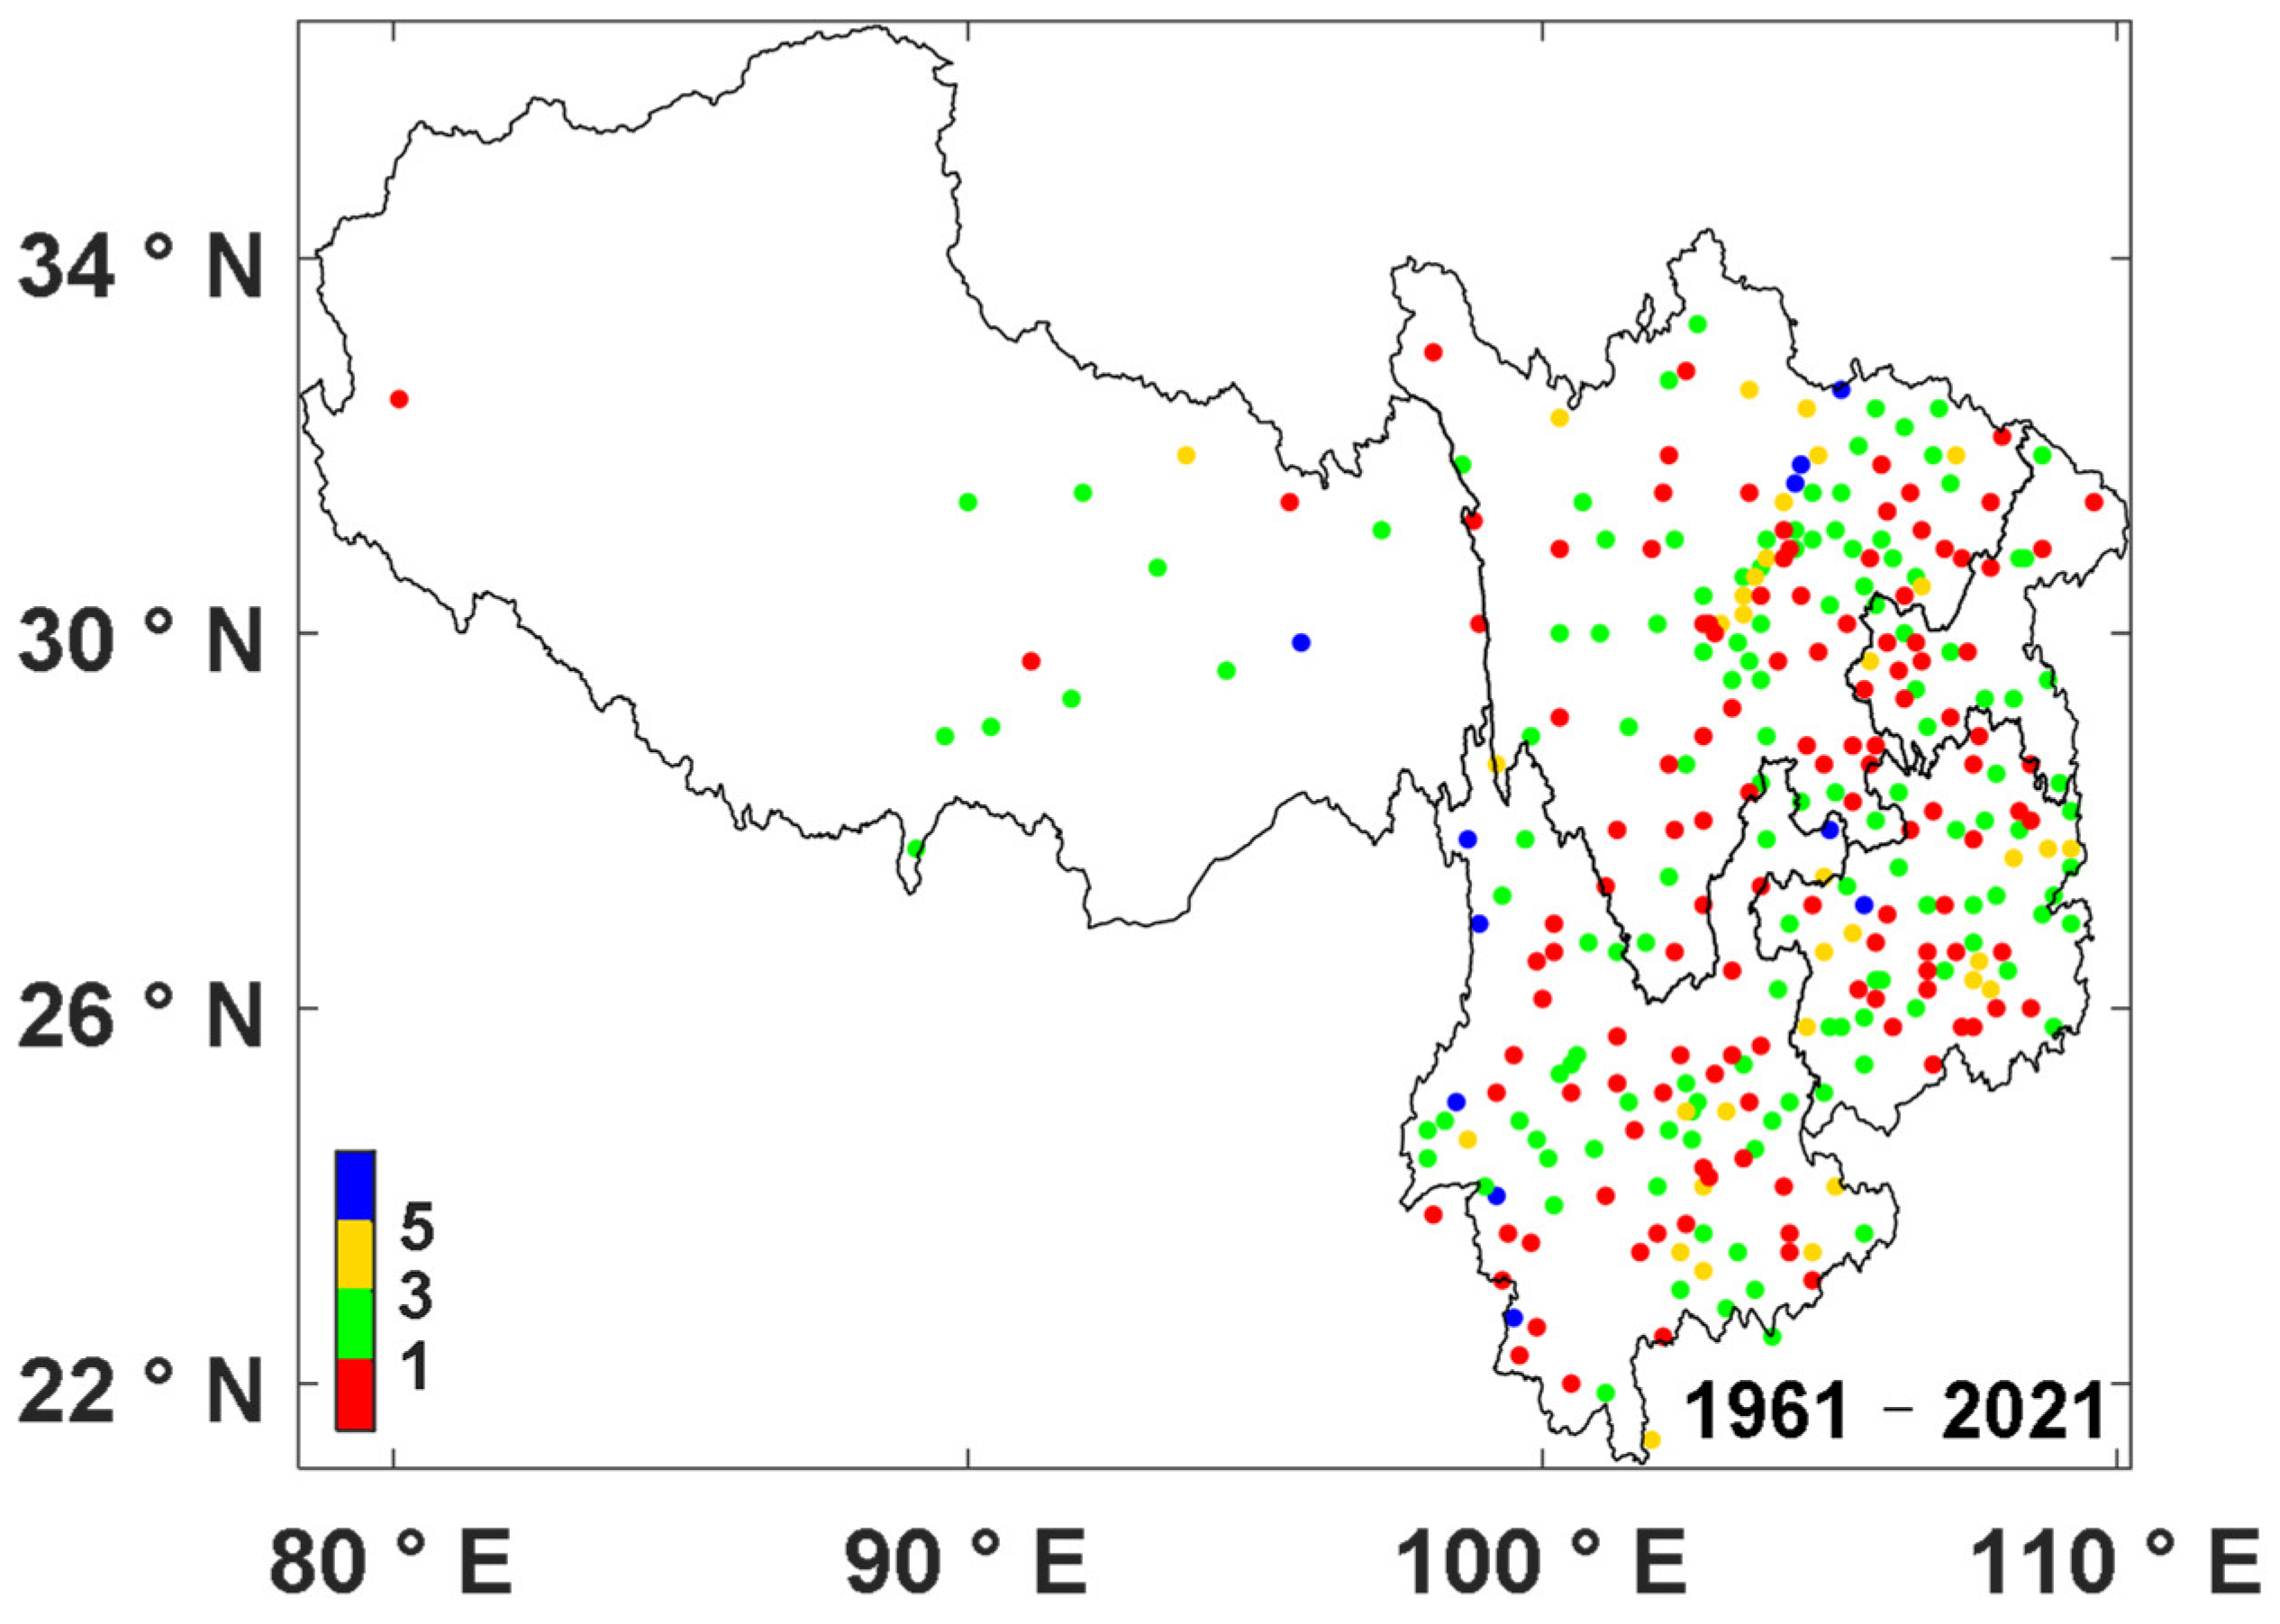
3.4. Temporal and Spatial Characteristics of Persistent Rainstorm Events
4. Conclusions and Discussion
4.1. Conclusions
- (1)
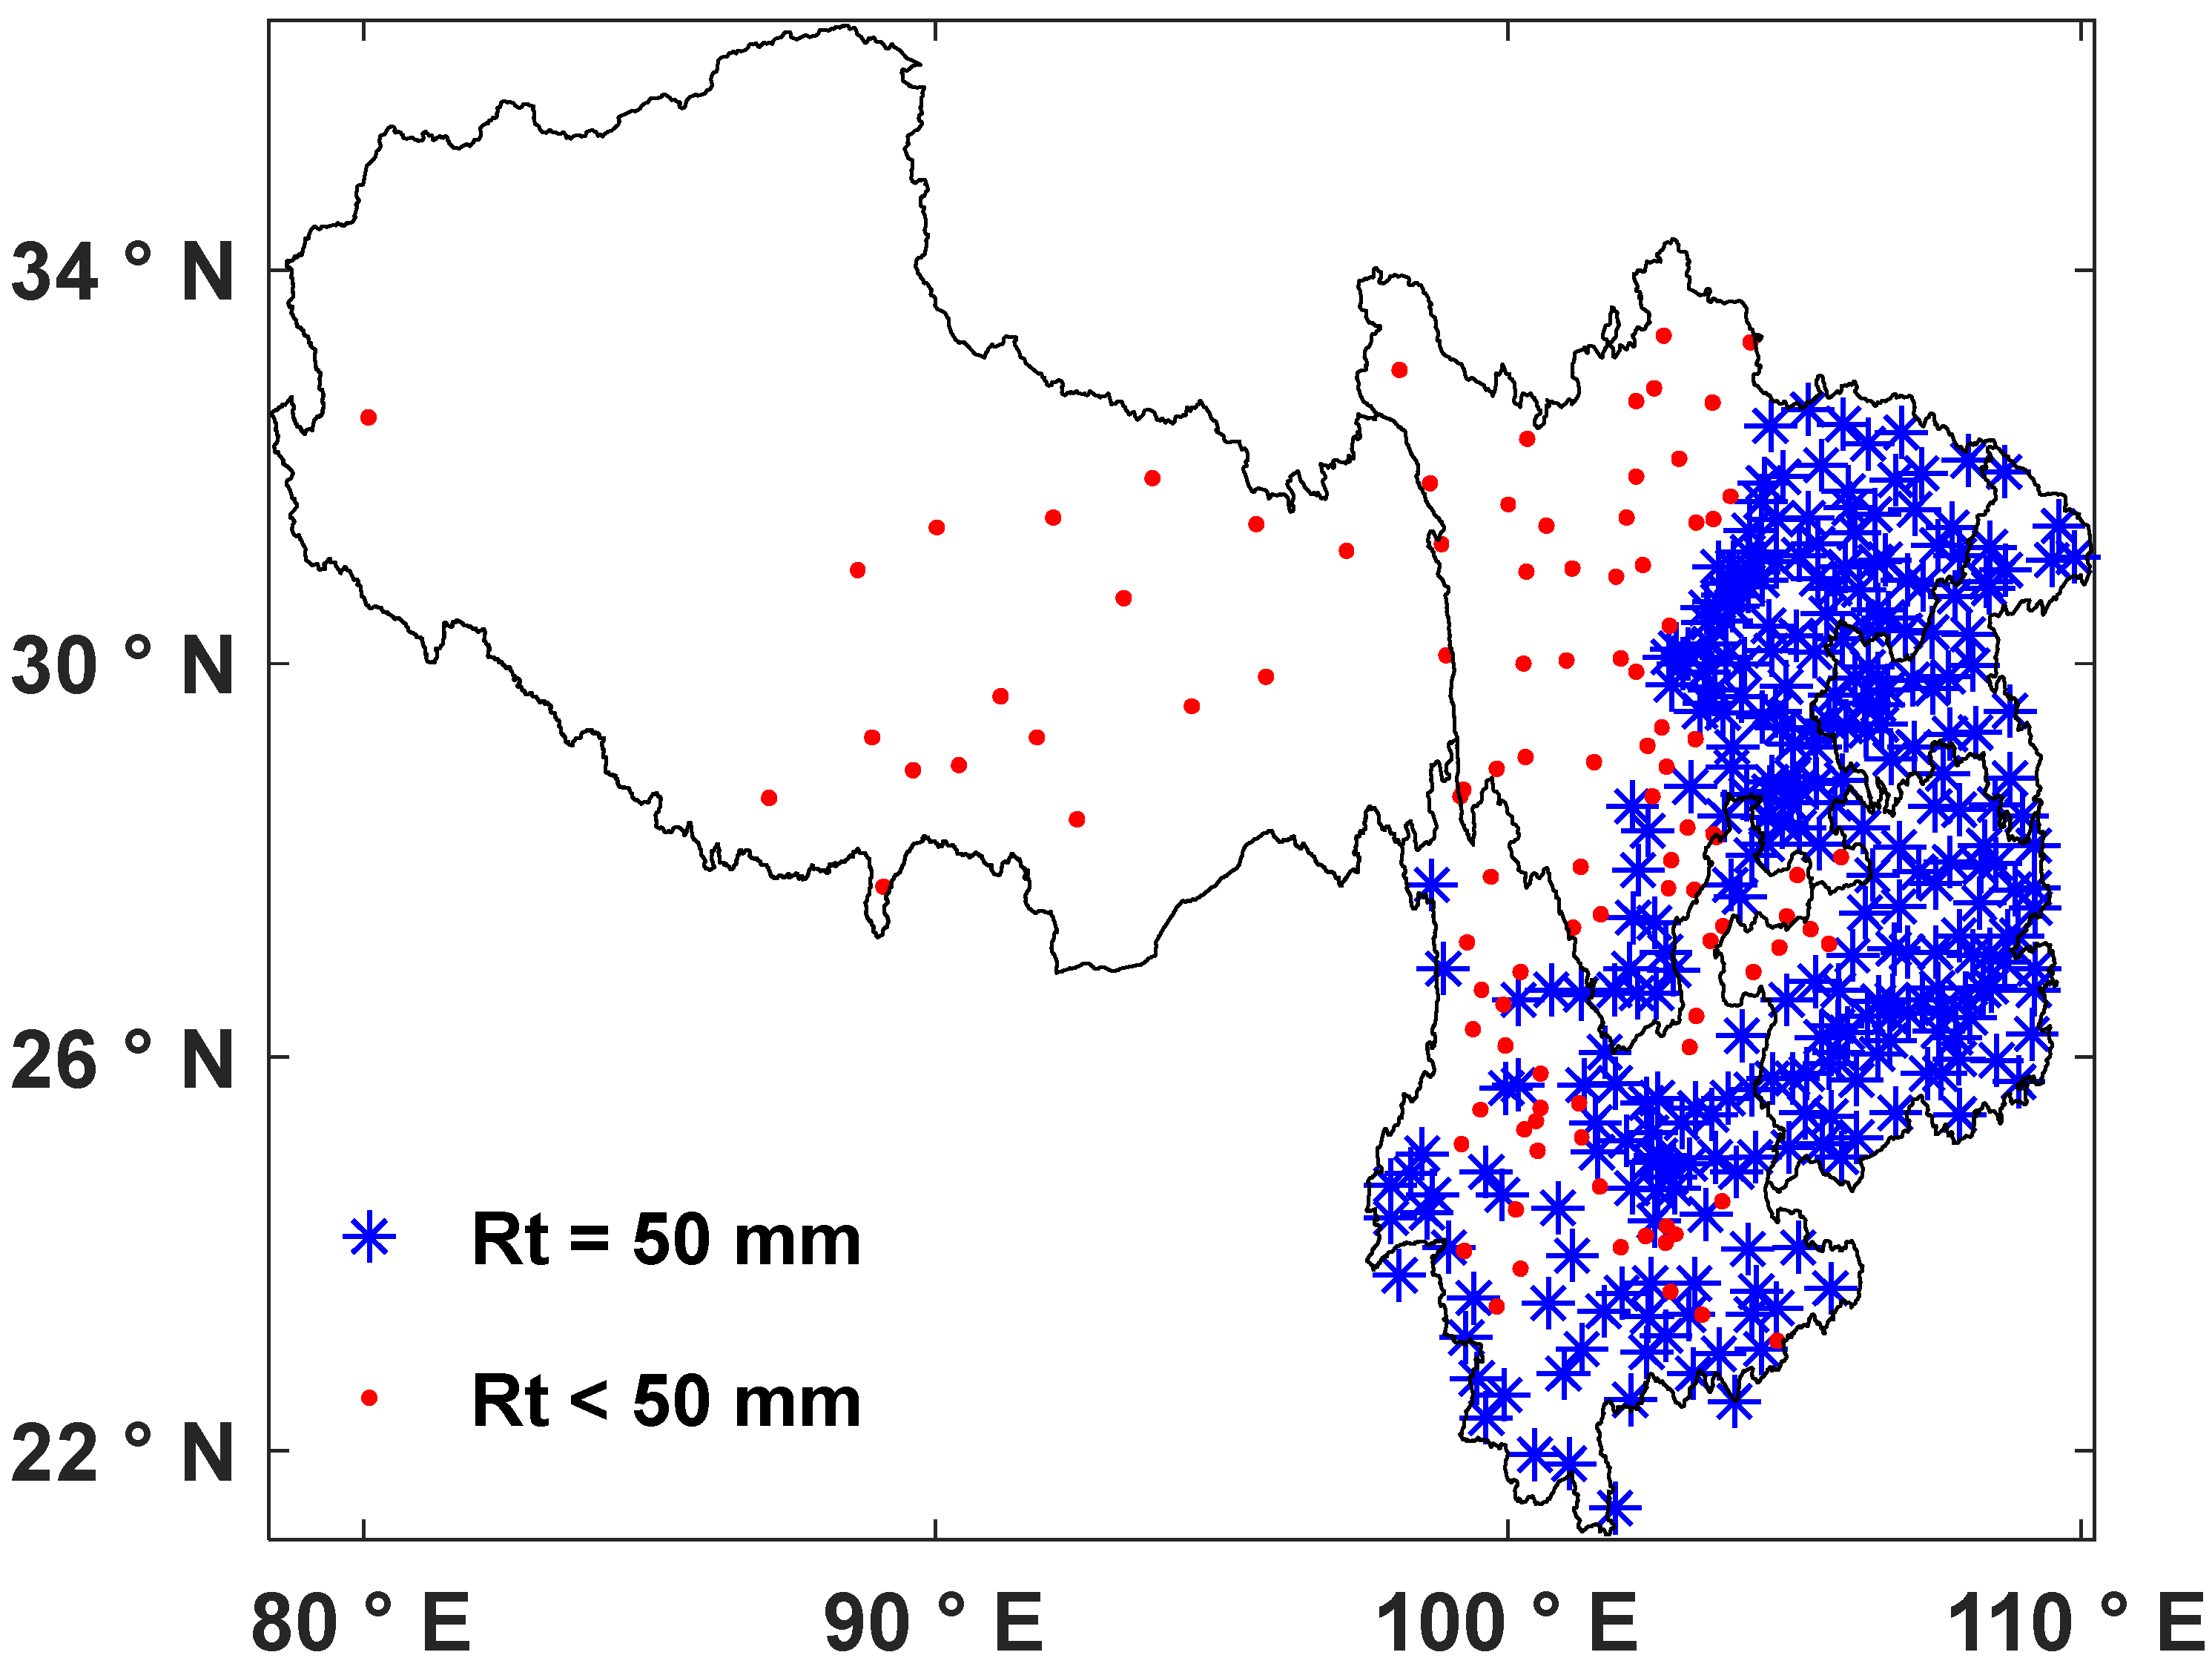
- Due to the uneven distribution of precipitation in southwest China, using a single rainstorm threshold is not suitable, and it should be considered comprehensively to determine the rainstorm threshold.
- (2)
- The rainstorm threshold in southwest China is comprehensively judged according to the combination of 95th percentile, 99th percentile, and 50 mm rainstorm standards. The threshold value gradually decreases from east to west, and the minimum threshold value of rainstorms is at Shiquanhe Station in Tibet (9.4 mm).
- (3)
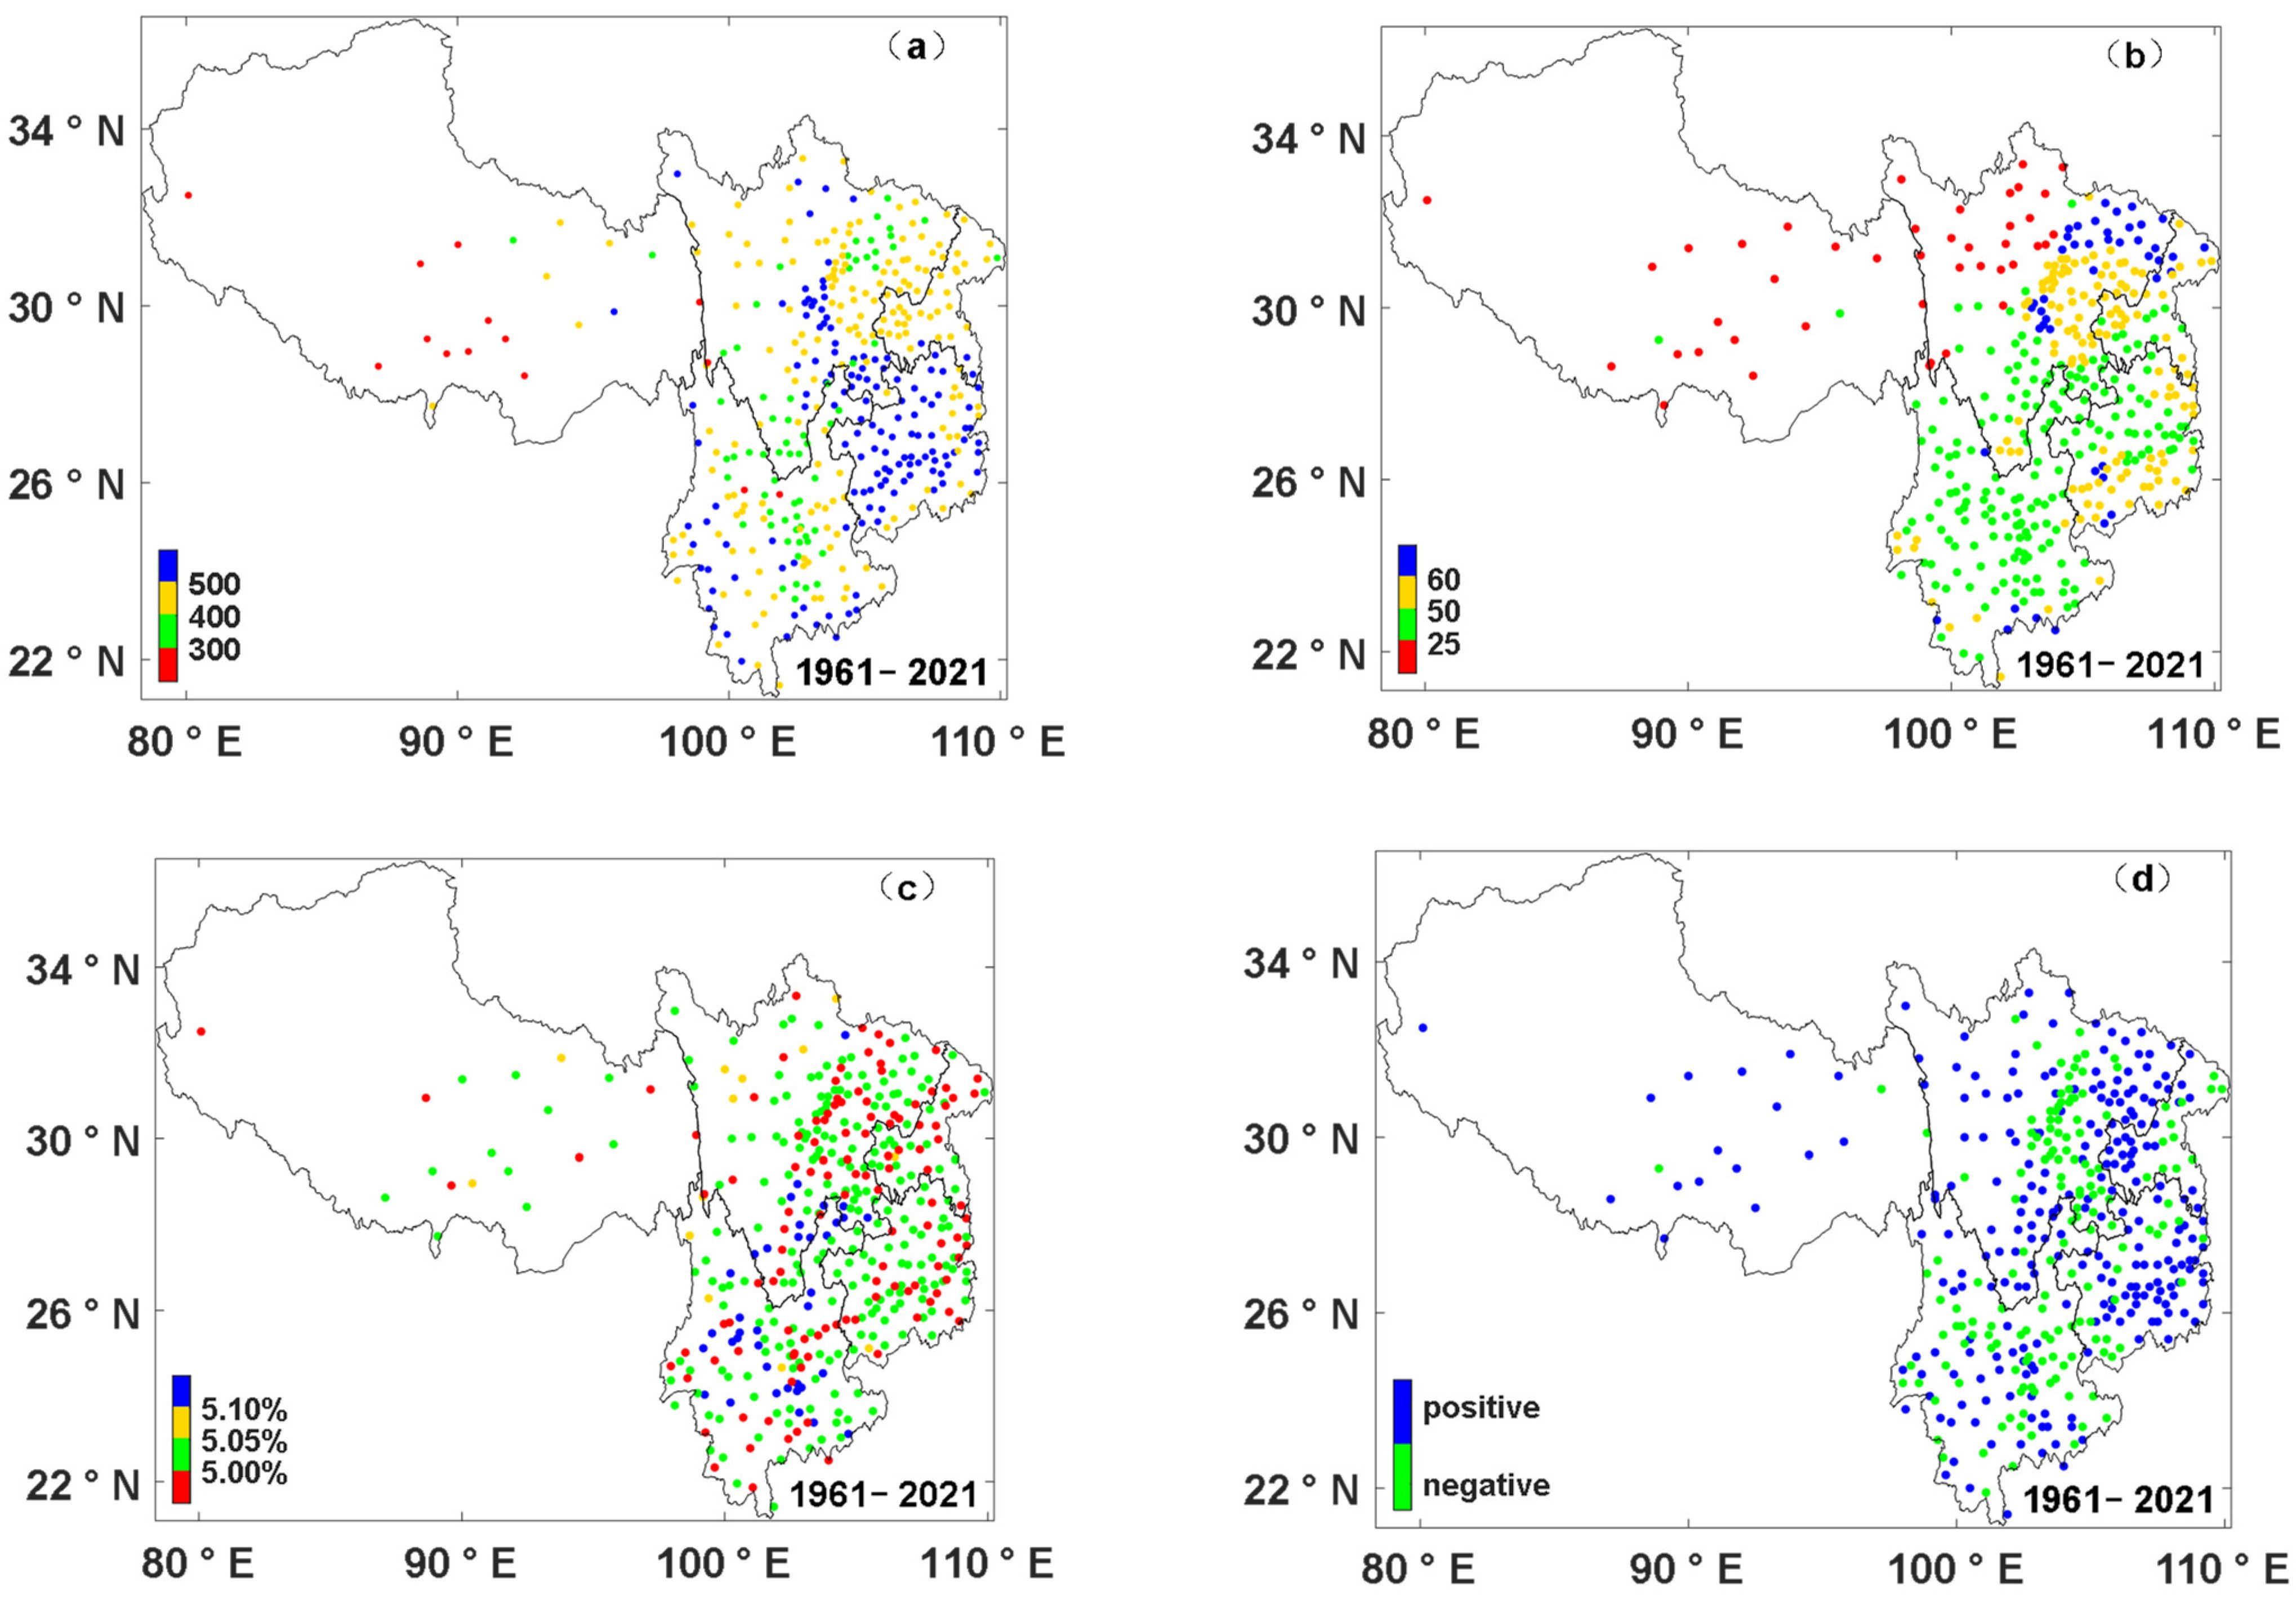
- Using NAWS, we obtained the detailed spatial and temporal distribution of rainstorm events in southwest China: The number of single-station rainstorm events and the average precipitation of single-station rainstorm events in southwest China from 1961 to 2021 decreased from east to west. The station with the largest single-station rainstorm events is Yanjin Station in YN (1294 times), and the smallest number is Shiquanhe Station in XZ (89 times). The number and frequency of single-station rainstorm events in GZ, SC, XZ, and CQ increased from 1961 to 2021, while the number of single-station rainstorm events in YN Province decreased. There is no obvious spatial distribution law for persistent rainstorm events in southwest China. The continuous rainstorm events at Fugong Station and Midu Station in YN Province, lasting for six days, triggered the rainstorm and flood disaster.
- (4)
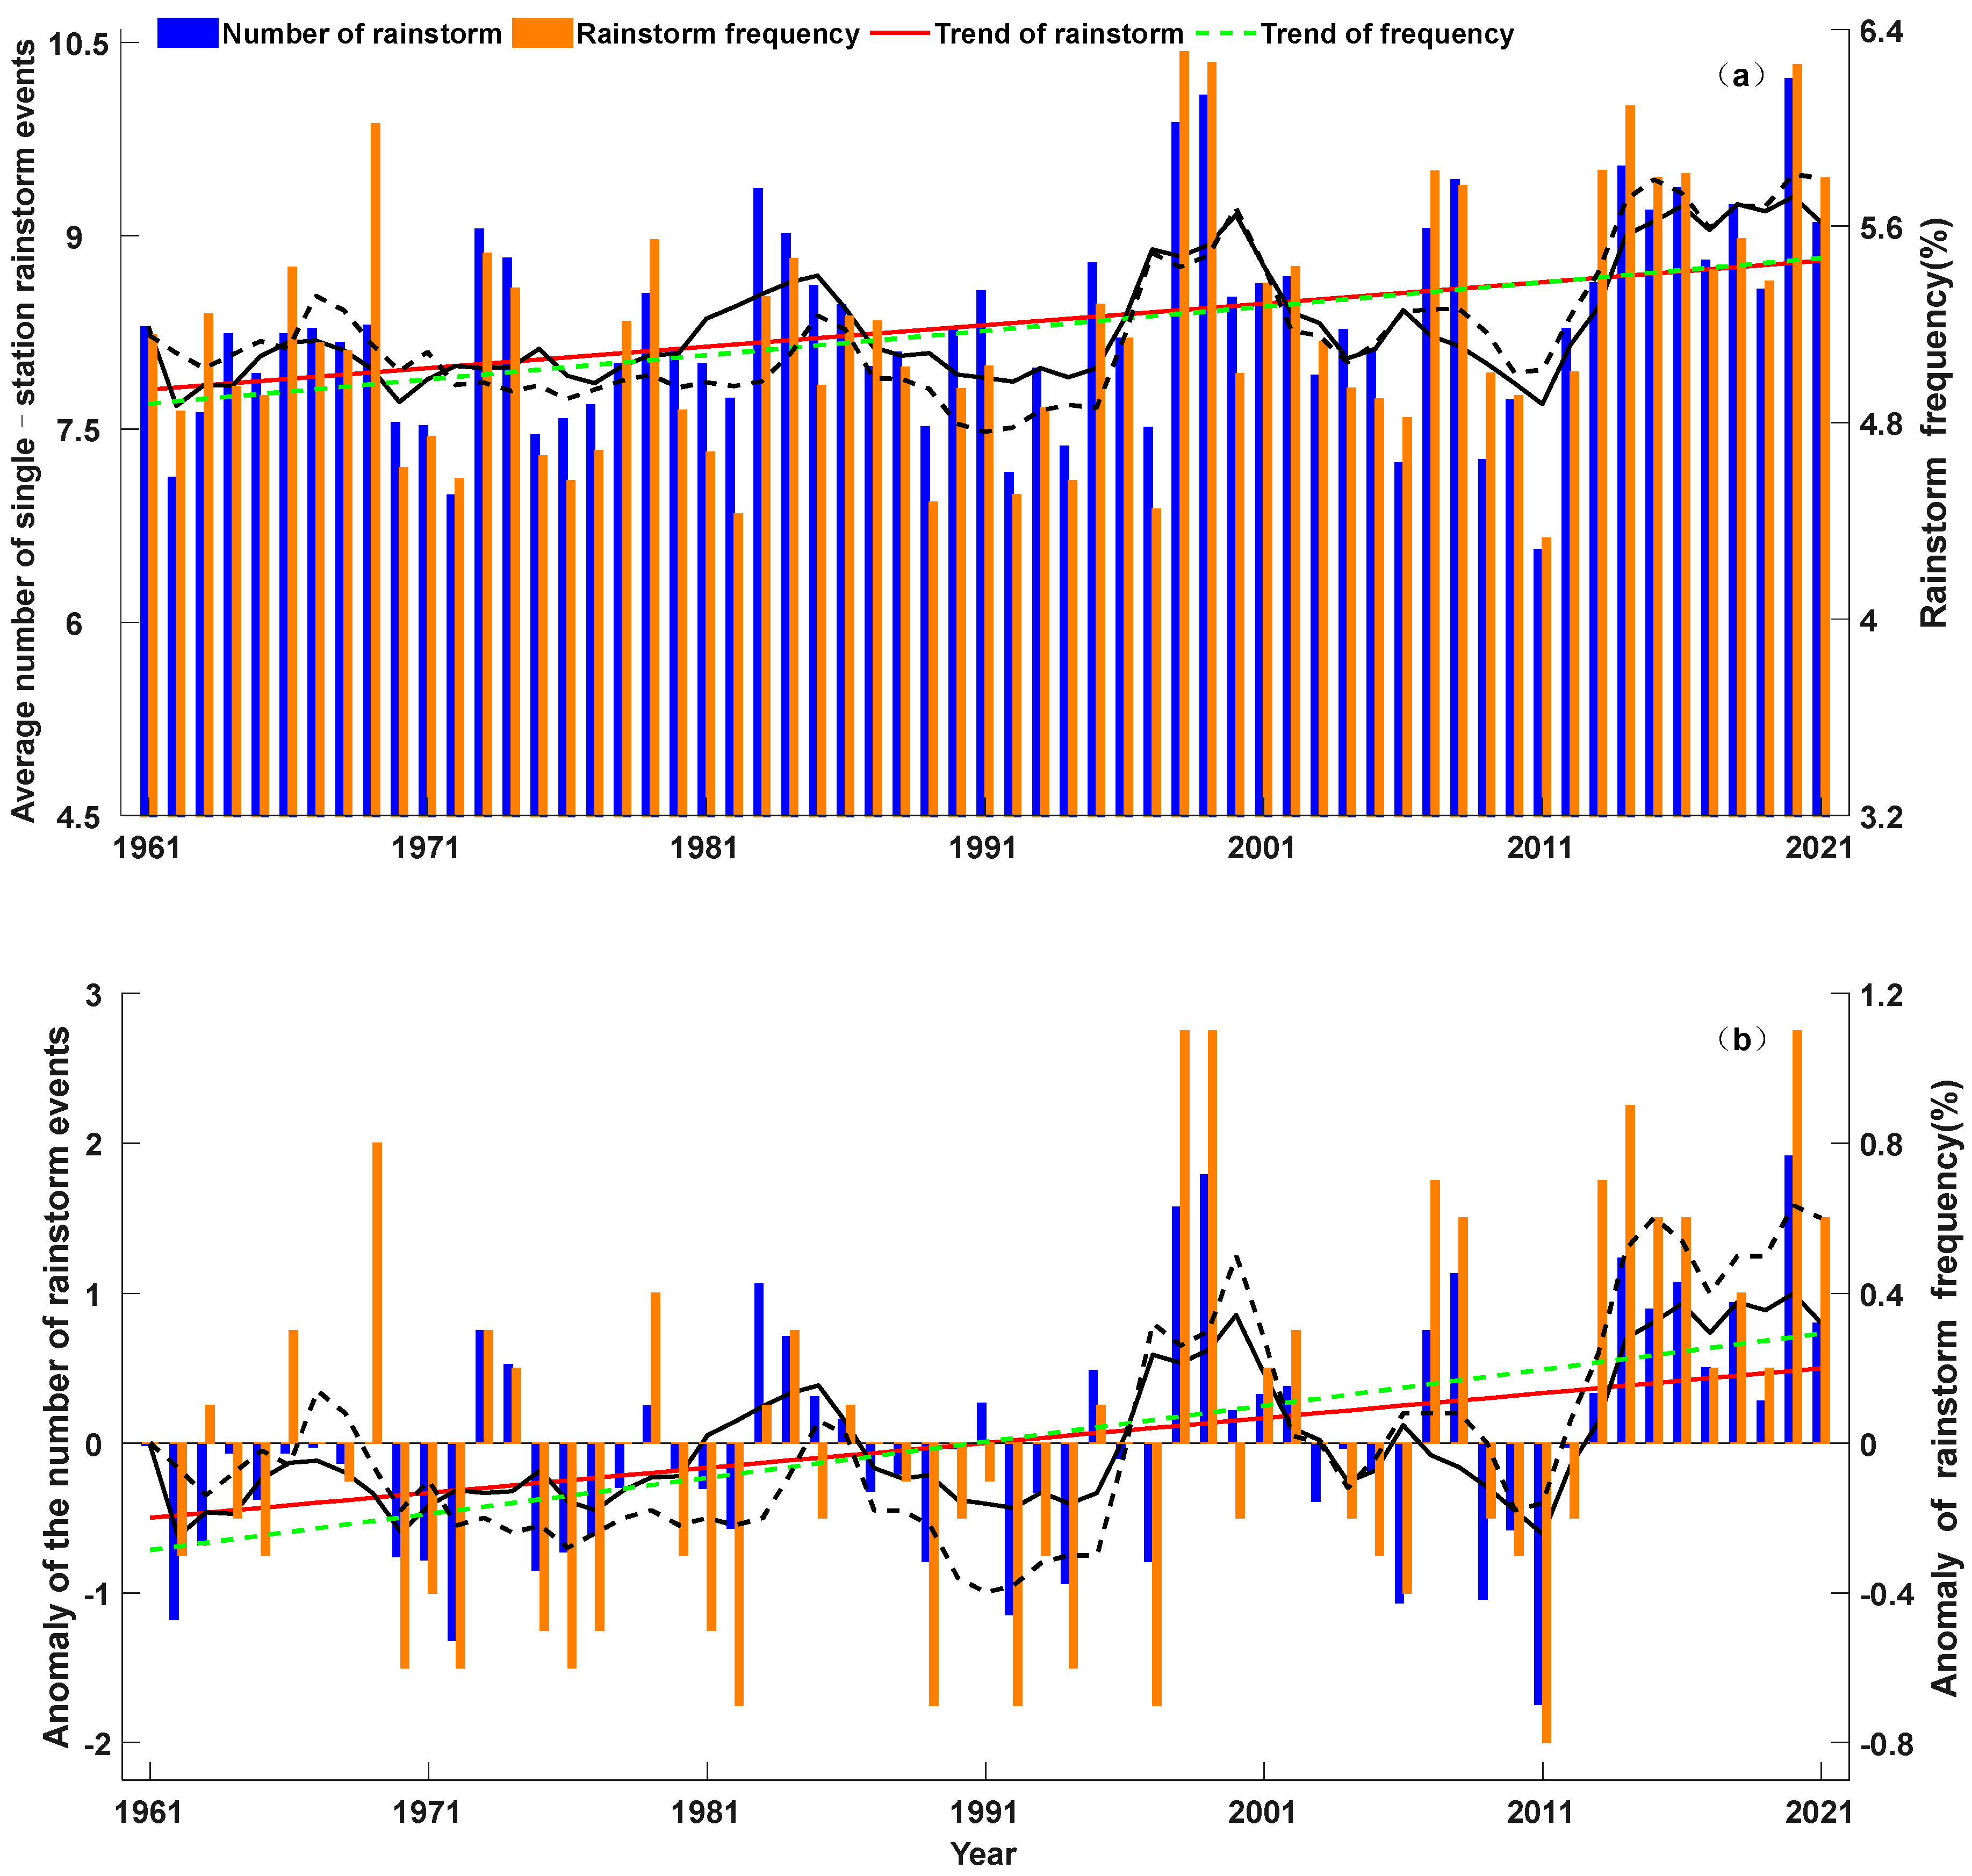
- From 1961 to 2021, the number of rainstorm events and the frequency of rainstorms in southwest China followed an upward trend. The number of rainstorm events at a single station increased by 66.6 times · (10a)−1, and the frequency of rainstorms increased by 9.9% · (10a)−1. The sliding t-test (n1 = n2 = 10) is used to test the mutation of rainstorm frequency anomaly at a single station, and the results show a decrease in mutation (more than 0.05 significance level) in 1997 and 2011. The year with the largest single-station rainstorm events is 2020, with 4087 events. The year with the least occurrence was 2011, with 2624 occurrences. The year with the highest annual average rainstorm frequency is 1998 (6.31%), and the year with the lowest annual average rainstorm frequency is 2011 (4.33%). From 1961 to 2021, the continuous rainstorm events in southwest China showed an increasing trend (the increasing trend was 0.1 times · (10a)−1) and a periodic increase and decrease. The year with the highest sustained rainfall events was 1983 (93 times), and the year with the lowest was 2002 (6 times).
- (5)
- Using the rainstorm threshold in southwest China, the early warning threshold of rainstorm disasters can be adjusted, which combines more closely with the local weather and climate characteristics. Using the temporal and spatial characteristics of rainstorm events since 1961, the changes in rainstorm events under global warming can be analyzed to provide data to support the response of southwest China to climate change.
4.2. Discussion
Author Contributions
Funding
Institutional Review Board Statement
Informed Consent Statement
Data Availability Statement
Conflicts of Interest
References
- Ehsan, E.; Zainab, K.; Zhixin, Z. Understanding farmers’ intention and willingness to install renewable energy technology: A solution to reduce the environmental emissions of agriculture. Appl. Energy 2022, 309, 118459. [Google Scholar] [CrossRef]
- Elahi, E.; Khalid, Z.; Tauni, M.Z.; Zhang, H.; Lirong, X. Extreme weather events risk to crop-production and the adaptation of innovative management strategies to mitigate the risk: A retrospective survey of rural Punjab, Pakistan. Technovation 2021, 117, 102255. [Google Scholar] [CrossRef]
- Abbas, A.; Waseem, M.; Ullah, W.; Zhao, C.; Zhu, J. Spatiotemporal Analysis of Meteorological and Hydrological Droughts and Their Propagations. Water 2021, 13, 2237. [Google Scholar] [CrossRef]
- Wijeratne, V.P.I.S.; Li, G.; Mehmood, M.S.; Abbas, A. Assessing the Impact of Long-Term ENSO, SST, and IOD Dynamics on Extreme Hydrological Events (EHEs) in the Kelani River Basin (KRB), Sri Lanka. Atmosphere 2023, 14, 79. [Google Scholar] [CrossRef]
- Zhang, Q.; Li, Y. Climatic Variation of Rainfall and Rain Day in Southwest China for Last 48 Years. Plateau Meteorol. 2014, 33, 372–383. [Google Scholar] [CrossRef]
- Luo, Y.; Fan, G.; Zhou, D.; Hua, W.; Li, J. Extreme precipitation trend of Southwest China in recent 41 years. J. Meteorol. Sci. 2015, 35, 581–586. [Google Scholar] [CrossRef]
- Lu, J.; Yan, J.; Cao, Y. Spatial Distribution Characteristics of Precipitation and Flood Index in Southwestern China during 1961–2015. Resour. Environ. Yangtze Basin 2017, 26, 1711–1720. [Google Scholar]
- Xie, Q.; Gu, X.; Li, G.; Tang, T.; Li, Z. Variation Characteristics of Rainstorms and Floods in Southwest China and Their Relationships with Atmospheric Circulation in the Summer Half-Year. Atmosphere 2022, 13, 2103. [Google Scholar] [CrossRef]
- Xu, Y.; Gao, X.; Giorgi, F. Regional variability of climate change hot-sports in East Asia. Adv. Atmos. Sci. 2009, 26, 783–792. [Google Scholar] [CrossRef]
- Abu Hammad, A.H.Y.; Salameh, A.A.M.; Fallah, R.Q. Precipitation Variability and Probabilities of Extreme Events in the Eastern Mediterranean Region (Latakia Governorate-Syria as a Case Study). Atmosphere 2022, 13, 131. [Google Scholar] [CrossRef]
- Yu, X.; Ma, Y. Spatial and Temporal Analysis of Extreme Climate Events over Northeast China. Atmosphere 2022, 13, 1197. [Google Scholar] [CrossRef]
- Liao, R.; Liu, G.; Chen, J.; Zhang, L. Interdecadal Variability of Summer Extreme Rainfall Events over the Huaihe River Basin and Associated Atmospheric Circulation. Atmosphere 2022, 13, 1189. [Google Scholar] [CrossRef]
- Yang, J.; Zhang, Q.; Wang, J.; Yao, Y.; Shang, J. Extreme and persistent feature of drought and flood of Southwest China in past 60 years. Sci. Geogr. Sin. 2015, 35, 1336–1340. [Google Scholar]
- Lu, S.; Hu, Z.; Wang, B.; Qin, P.; Wang, L. Spatio-temporal Patterns of Extreme Precipitation Events over China in Recent 56 Years. Plateau Meteorol. 2020, 39, 683–693. [Google Scholar] [CrossRef]
- Wang, R.; Xiao, T. Tempord and Spatial Distribution and Prediction Experiment of Precipitation in Southwest China during the Rainy Season. J. Meteorol. Sci. 2020, 40, 354–362. [Google Scholar]
- Tan, X.; Zhou, Y.; Li, M.; Liu, P. The Variation Characteristics of Summer Sustained Precipitation in Southwest China from 1979 to 2016. Plateau Mt. Meteorol. Res. 2020, 40, 1–10. [Google Scholar]
- Yuan, Y.; Zhai, P. Latest Understanding of Extreme Weather and Climate Events Under Global Warming and Urbanization Influences. Trans. Atmos. Sci. 2022, 45, 161–166. [Google Scholar] [CrossRef]
- Li, Y.; Zhou, J.; He, J.; Lu, C.; Xiang, B. Characteristics of Water Vapor Transport Associated with Abnormal Precipitation over the East of Southwestern China in June and July 2020. Chin. J. Atmos. Sci. 2022, 46, 309–326. [Google Scholar] [CrossRef]
- Zhou, J.; Zhao, J.; Li, Y.; Zou, X. Objective Identification and Variation Characteristics of Regional Heavy Rainfall Events in the East of Southwestern China. Plateau Meteorol. 2021, 40, 789–800. [Google Scholar] [CrossRef]
- Jiang, J.; Zhou, T.; Zhang, W. Temporal and Spatial Variations of Extreme Precipitation in the Main River Basins of China in the Past 60 Years. Chin. J. Atmos. Sci. 2022, 46, 707–724. [Google Scholar] [CrossRef]
- GB/T 28592-2012; Grade of Precipitation. CMA: Beijing, China, 2012.
- Zhuo, G. Analysis of rainstorm, drought, flood and rainstorm weather system in the middle and upper reaches of the Yarlung Zangbo River. Tibet. Sci. Technol. 2006, 2, 29–35. [Google Scholar] [CrossRef]
- Yang, Y.; Luo, S.; Nimaji; Tsering, Y. Rainstorm indices and spatio-temporal change of torrential rain events in Tibet. Torrential Rain Disasters 2013, 32, 369–373. [Google Scholar] [CrossRef]
- Ren, Z.; Yu, Y.; Zou, F.; Xu, Y. Quality Detection of Surface Historical Basic Meteorological Data. J. Appl. Meteorol. Sci. 2012, 23, 739–747. [Google Scholar]
- QX/T 442-2018; Persistent Rainstorm Event. CMA: Beijing, China, 2018.
- Fu, G.; Yu, J.; Yu, X.; Ouyang, R.; Zhang, Y.; Wang, P.; Liu, W.; Min, L. Temporal variation of extreme rainfall events in China, 1961–2009. J. Hydrol. 2013, 487, 48–59. [Google Scholar] [CrossRef]
- Sun, J.; Zhang, F. Daily extreme precipitation and trends over China. Sci. China Earth Sci. 2017, 60, 2190–2203. [Google Scholar] [CrossRef]
- Chen, Z.; Wang, L.; Li, X.; Xue, Y.; Jia, H. Spatiotemporal Change Characteristics of Extreme Precipitation in South-Western China and Its Relationship with Intense ENSO Events. Plateau Meteorol. 2022, 41, 604–616. [Google Scholar] [CrossRef]
- Zhang, Q.; Fan, B. Report of the Damage Caused by Disaster in China; China Statistics Press: Beijing, China, 1996; pp. 20–52. [Google Scholar]


| Accuracy Rate | Suspicious Rate | Error Rate | Missing Measure Rate | |
|---|---|---|---|---|
| TOTAL | 99.9708 | 3.20 × 10⁻³ | 1.30 × 10⁻⁵ | 2.56 × 10⁻² |
| YN | 99.9922 | 7.31 × 10⁻⁴ | 0 | 7.00 × 10⁻³ |
| GZ | 99.9456 | 4.48 × 10⁻² | 0 | 9.70 × 10⁻³ |
| SC | 99.9883 | 2.06 × 10⁻⁴ | 2.93 × 10⁻⁵ | 1.15 × 10⁻² |
| XZ | 99.9056 | 2.30 × 10⁻² | 1.17 × 10⁻⁴ | 7.13 × 10⁻² |
| CQ | 99.9861 | 4.10 × 10⁻³ | 0 | 9.80 × 10⁻³ |
| Rt (mm) | 0~14.9 | 15~24.9 | 25~50 | 50 | |
|---|---|---|---|---|---|
| Num | |||||
| YN | 0 | 14 | 25 | 82 | |
| GZ | 0 | 4 | 0 | 75 | |
| SC | 4 | 34 | 0 | 104 | |
| XZ | 8 | 10 | 0 | 0 | |
| CQ | 0 | 0 | 0 | 34 | |
| YN | GZ | SC | XZ | CQ | |
|---|---|---|---|---|---|
| Trend in rainstorm events at single station (times · (10a)−1) | −0.03 | 0.10 | 0.07 | 0.17 | 0.11 |
| Trend of single-station rainstorm frequency (% · (10a)−1) | 0.12 | 0.08 | 0.11 | 0.03 | 0.09 |
Disclaimer/Publisher’s Note: The statements, opinions and data contained in all publications are solely those of the individual author(s) and contributor(s) and not of MDPI and/or the editor(s). MDPI and/or the editor(s) disclaim responsibility for any injury to people or property resulting from any ideas, methods, instructions or products referred to in the content. |
© 2023 by the authors. Licensee MDPI, Basel, Switzerland. This article is an open access article distributed under the terms and conditions of the Creative Commons Attribution (CC BY) license (https://creativecommons.org/licenses/by/4.0/).
Share and Cite
Liu, Y.; Liao, J.; Zhao, Y. Spatial and Temporal Characteristics of Rainstorm Events in Southwest China from 1961 to 2021. Atmosphere 2023, 14, 1134. https://doi.org/10.3390/atmos14071134
Liu Y, Liao J, Zhao Y. Spatial and Temporal Characteristics of Rainstorm Events in Southwest China from 1961 to 2021. Atmosphere. 2023; 14(7):1134. https://doi.org/10.3390/atmos14071134
Chicago/Turabian StyleLiu, Yujia, Jie Liao, and Yufei Zhao. 2023. "Spatial and Temporal Characteristics of Rainstorm Events in Southwest China from 1961 to 2021" Atmosphere 14, no. 7: 1134. https://doi.org/10.3390/atmos14071134
APA StyleLiu, Y., Liao, J., & Zhao, Y. (2023). Spatial and Temporal Characteristics of Rainstorm Events in Southwest China from 1961 to 2021. Atmosphere, 14(7), 1134. https://doi.org/10.3390/atmos14071134