Abstract
Urban travel is a major component of urban transport, and the total carbon emissions of urban transport can be effectively reduced if the carbon emissions of residents’ travel can be reasonably controlled. Based on the questionnaire data of many different types of residential areas in Guangzhou, the daily travel behaviour of residents was analysed and their travel carbon emissions were calculated. The differences in travel characteristics and travel carbon emissions of residents in different types of residential areas were compared. The influencing factors of residents’ travel carbon emissions were divided into three categories: individual socio-economic factors, built environment, and residents’ travel behaviour. On this basis, a structural equation model is established to study the impact mechanism of residents’ travel carbon emissions. The path relationship between endogenous variables and endogenous variables, as well as the path relationship between exogenous variables and endogenous variables were investigated. The interactions between various influencing factors of residents’ travel carbon emissions were examined. The results show that: (1) there are significant differences in residents’ travel carbon emissions in different types of municipalities. Residents’ travel carbon emissions in Guangzhou are closer to the 60/20 distribution; (2) compared with individual socio-economic factors, the impact of the built environment on travel carbon emissions is more obvious; (3) travel distance and travel mode are the factors that directly affect residents’ travel carbon emissions. Proposals have been made to reduce the carbon emissions of residents travelling.
1. Introduction
According to the latest research report by the International Energy Agency (IEA), transportation has become the second largest CO2 emission sector in the world [1]. The energy consumption and carbon emissions of the transport sector are growing the fastest, and is regarded as the most difficult sector in which to achieve carbon emission reduction [2,3]. Reducing transport carbon emissions is a major challenge to achieving the goal of mitigating climate change [4]. China has become the world’s largest carbon emitter, and the total carbon emissions of the transport sector rank second in the world [5]. With social and economic development and the popularity of cars, China’s traffic carbon emissions will continue to grow in the future [6]. At present, China is in the process of rapid urbanization. Many cities have entered the stage of sprawling development. The use of cars by urban residents has been increasing, resulting in a sharp increase in carbon emissions from transportation [7]. Urban travel is a major component of urban traffic, and the total carbon emissions of urban traffic can be reduced if the carbon emissions of residents’ travel can be reasonably controlled.
The built environment affects the carbon emissions of residents’ travel through its impact on residents’ travel behaviour. These travel behaviours are measured in a variety of ways, including travel mode selection, travel distance, travel frequency, travel purpose, or travel time [8]. Since the 1990s, many researchers have found that traffic carbon emissions are related to the built environment [9]. Macro level research is mainly based on national time series data and urban cross-section data, and uses aggregate analysis methods to analyze the relationship between urban form, transportation energy consumption, and carbon emissions [10,11,12]. Hughes et al. found that city size is the most powerful determinant of travel carbon emissions [13]. Hong found that there is a nonlinear relationship between density and travel carbon emissions, and the emission reduction effect of population density is not significant, to some extent [14]. In other studies, the correlation between residential density and travel carbon emissions is not significant [15]. Zahabi et al. found that the density, public transport accessibility, and land use mixing degree will increase by 10%, and the travel carbon emissions will decrease by 0.5%, 5.8%, and 2.5%, respectively [16]. J. Nicolas et al. found that residents living in urban and central areas produce more carbon emissions, while suburban and rural areas have lower carbon emissions [17]. Ko J. et al. found that the carbon emissions of the Seoul metropolitan area is higher than that of Seoul by using tree regression and the LOGISTIC model [18]. Through multiple OLS regression analysis, Büchs M. et al. pointed out that British rural households tend to produce higher carbon emissions than urban households, with 16% higher emissions [19].
Micro level research is primarily based on questionnaire data. Based on U.S. household travel survey data, Brownstone et al. found that the residential population density will decrease by 1000 households per square mile, the annual driving mileage of family cars will increase by 1200 miles, and the fuel for cars will increase by 65 gallons [20]. Some scholars also found that the density of working places plays a greater role in reducing traffic carbon emissions than the density of residential places [21,22,23]. In addition, many researchers also pay attention to the impact of residents’ socio-economic factors on residents’ travel carbon emissions [24]. Some scholars pointed out that men produce higher traffic carbon emissions than women [25]. Middle aged people produce higher traffic carbon emissions than other age groups [26]. High income groups are prone to higher carbon emissions [27]. Residents with fixed jobs produce higher traffic carbon emissions than those without jobs [28]. In general, existing studies focus on analyzing the distribution characteristics and related factors of carbon emissions of many countries and regions. Through the study of city space and the residents’ travel CO2 emissions, scholars confirmed that the city space environment characteristics, such as land use, traffic planning, and urban morphology, determine the spatial distribution of residents’ living, employment, and recreation, as well as influence the travel mode, direction, distance, and changes of CO2 emissions. For cities in the process of urbanization in China, the influencing factors of resident travel carbon emissions have their own characteristics. Studying the characteristics and impact mechanism of residents’ travel carbon emissions from the micro level, and exploring its internal mechanism, can provide a reference for low-carbon city construction and traffic carbon emission reduction strategy formulation.
This paper examines the influencing mechanism of urban travel carbon emissions from the perspective of the residential area built environment. The characteristics of urban travel carbon emissions were revealed in several aspects. A structural equation model (SEM) was developed to examine the effects of individual socio-economic factors, built environment, and travel behaviour on urban travel CO2 emissions. A series of primary conclusions and policy recommendations were provided to benefit policymakers who seek to implement low-carbon transportation improvement measures.
2. Materials and Methods
2.1. The Source of the Data
This study selects Guangzhou as a case city. The data primarily come from the first-hand data obtained from the questionnaire survey of daily travel activities of Guangzhou residents, from October to December 2018. The sample plots are selected from the stratified space of the residential areas (see Table 1) and the type of residential areas (Table 2). A total of 2331 households are selected from 33 residential communities (see Table 2) as survey samples. The questionnaire includes the following two parts: one is the individual socio-economic factors, including demographic characteristics, economic characteristics, and family vehicle ownership characteristics; the other is the survey of the residents’ travel behaviour, including travel purposes, travel tools, travel time, etc.

Table 1.
The description of spatial location and types of residential area in Guangzhou.

Table 2.
Basic information of the communities.
2.2. Calculation Formula of Residents’ Travel CO2 Emissions
Based on the questionnaire of residents’ travel, the method of travel in the coefficient method is used to measure the carbon emission of residents. Residents’ travel carbon emissions in one day are calculated as follows:
is residents’ travel carbon emissions in one day(g). i is the transportation method. is total distance traveled by way of i (km). is the intensity of carbon emissions per unit distance by way of travel i (g/person·km). n is the total number of travel methods taken by the residents to complete their daily travel.
The various modes of transport carbon emission coefficients are sorted according to the related literature [29] (Table 3).

Table 3.
CO2 emission intensity by transport modes (g/person.km).
2.3. Structural Equation Model (SEM)
Residents’ travel carbon emissions have a direct impact on travel variables. The built environment and individual socio-economic factors indirectly affect residents’ daily travel CO2 emissions, constituting a relationship, as shown in Figure 1. Residents’ travel characteristics are the result of the individual selection of many factors, and are influenced by social and economic attributes.
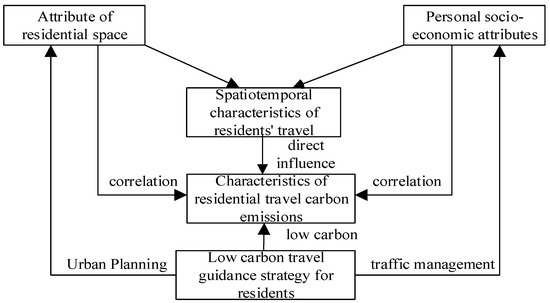
Figure 1.
Research Framework of Residents’ Travel CO2 emissions.
Through the structural equation model, 7 endogenous variables, such as individual socio-economic factors and built environment, and 2 exogenous variables, travel distance and travel frequency, are selected. The selected variables are shown in Table 4.

Table 4.
Processing and interpretation of variables.
The structural equation model contains two models: the measurement model and the structural model. The structural equation model of this study can be expressed as:
y is the exogenous variable, represented by the vector composed of endogenous indicators; x is the endogenous variable, represented by the vector composed of exogenous indicators; B is the internal relation between variables, represented by random relation matrix; Γ is the exogenous variable effects on endogenous variables, represented by the direct random effect matrix; ζ is the residual structural equation, the part of which the y equation fails to reflect [30].
3. Characteristics of Residents’ Travel Carbon Emissions in Different Types of Residential Areas
3.1. Travel Carbon Emissions of Residents with Different Distances from Community to CBD
As shown in Figure 2, there is a positive correlation between the distance from community to CBD and the carbon emissions of residents’ travel. The farther away the community from the CBD, the higher the carbon emissions of residents’ travel.
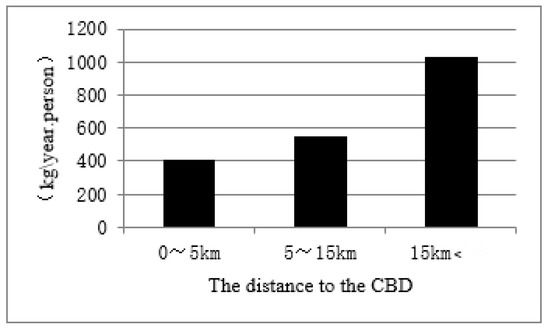
Figure 2.
Travel carbon emissions of residents with different distances from community to CBD.
3.2. Travel Carbon Emissions of Residents under Different Ground Bus Accessibility
As shown in Figure 3 and Figure 4, there is a negative correlation between the accessibility of community public transport and the carbon emissions of residents’ travel. The more bus and subway lines there are within 1 km, the lower the carbon emissions of residents.
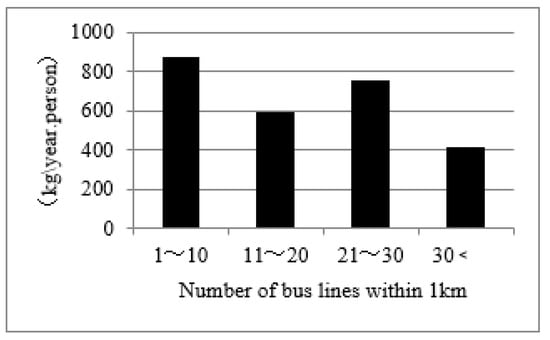
Figure 3.
Travel carbon emissions of residents under different ground bus accessibility.
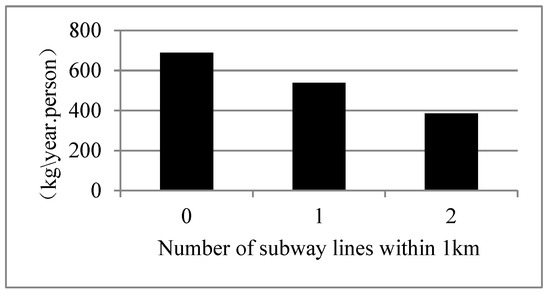
Figure 4.
Travel carbon emissions of residents under different subway accessibility.
3.3. Travel Carbon Emissions of Residents in Different Types of Communities
As shown in Figure 5, there are significant differences in the carbon emissions of residents’ trips in different types of communities. As the community distance from the city center increases, the grade of the community increases as well, and the greater the carbon emissions of residents’ travel in the community.
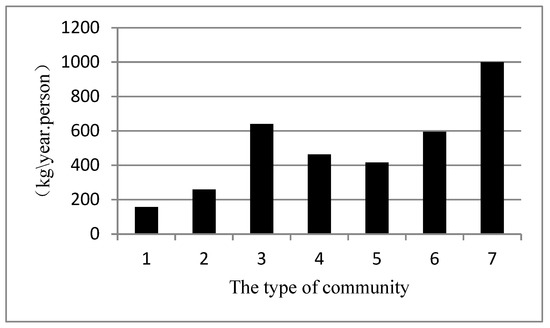
Figure 5.
Travel carbon emissions of residents in different types of communities. Notes: 1. core area new garden community, 2. core area old residential area, 3. core area unit compound, 4. central district new garden community, 5. central district old residential area, 6. central district unit compound, 7. new garden community in outer suburbs.
3.4. Grading Distribution of Residents’ Travel CO2 Emissions
To compare the distribution structure of residents’ daily travel in seven different types of residential areas, the CO2 emissions of residents’ daily travel in Guangzhou are classified into zero carbon emission, low carbon emission (0–2000 g), medium carbon emission (2000–6000 g), and high carbon emission (6000 g, max). As shown in Table 5, residents’ trips in Guangzhou residential areas are mainly low-carbon trips; the proportion of low-carbon trips is 46% of the total, while the proportion of high-carbon trips is only 2% of the total. Comparing the seven representative residential areas, the proportion of low-carbon residents in the central and core areas is over 45%, the old residential areas in the central area is as high as 55%, and the new garden community in the outer suburbs is only 41%. In terms of zero carbon emissions, the new garden community in the outer suburbs is much lower than the other six residential areas. At the same time, in the outer suburbs of the new garden community, the proportion of residents with high carbon travel is much higher than in the other six types of estate. Residents’ travel carbon emissions show significant differentiation at the urban spatial scale, showing that residents in the core and central areas account for a lower low carbon and zero carbon ratio, while the medium and high carbon ratios in the outer suburbs are relatively high.

Table 5.
Grading distribution of residents’ travel daily carbon emissions in different types of communities.
The travel CO2 emissions of the residents in the different types of residential areas are sorted in ascending order, and the cumulative percentage of the total carbon emissions of the residents is calculated. The Lorenz curve of travel carbon emissions is plotted in Figure 6. From Figure 6, we can see that the daily travel CO2 emissions of the residents of Guangzhou city are close to the 60/20 distribution. That is, about 60% of the carbon emissions are generated by 20% of the residents with high carbon emissions. The core area of the new garden community, the new community garden community, and the new garden suburb area are closer to the 80/40 distribution. The old residential areas in the core area are closer to the 80/20 distribution, and their residents’ travel CO2 emissions are more unequal.
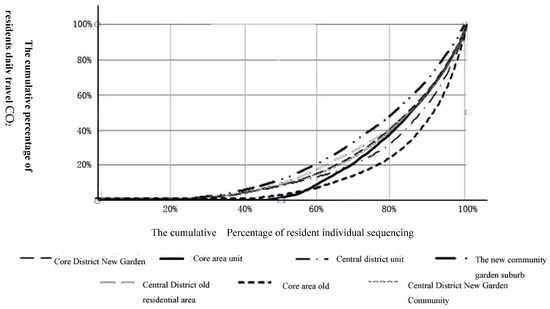
Figure 6.
Lorenz curve of residents’ travel carbon emissions in different types of communities.
4. The Influence Mechanism of Urban Travel Carbon Emissions in Guangzhou
Running the programme in AMOS21.0 software, through the test and revision of the initial model, we obtain the final model with 17 degrees of freedom. The chi-squared goodness of fit value is 25.51, the significant probability value is 0.084 (more than 0.05), and the chi-squared ratio is less than 2 degrees of freedom, which shows that the goodness of fit of the model is better. Further analysis of the goodness of fit index of the model shows that the RMSEA value is 0.038 (less than 0.08), the goodness of fit index GFI is 0.038 (less than 0.08), the goodness of fit index GFI is 0.994 (more than 0.9), and the comparative fit index CFI is 0.999 (more than 0.9), all of which explain that the final model is a good fitting model in the statistical sense.
4.1. Path Relationships between Endogenous Variables and Endogenous Variables
Most of the hypothetical paths between the endogenous variables are statistically significant. The path diagram of the effects of the endogenous variables is shown in Figure 7:
- (1)
- Travel distance has a significant effect on travel mode. The increase in travel distance has an obvious discouraging effect on slow traffic, and the increase in travel distance has an obvious encouraging effect on public transport trips, but the effect on car trips is not significant. The model results show that the probability of slow traffic decreases significantly with the increase in travel distance (the total effect is −0.26), and the probability of subway travel increases significantly with the increase in travel distance (the total effect is 0.29).
- (2)
- As travel distance increases, the increase in the probability of car travel leads to a significant increase in CO2 emissions. Travel distance and car travel have a clear positive effect on travel CO2 emissions. The overall effect of travel distance on travel CO2 emissions comes mainly from the direct effects. The increase in travel distance will significantly increase the probability of car travel.
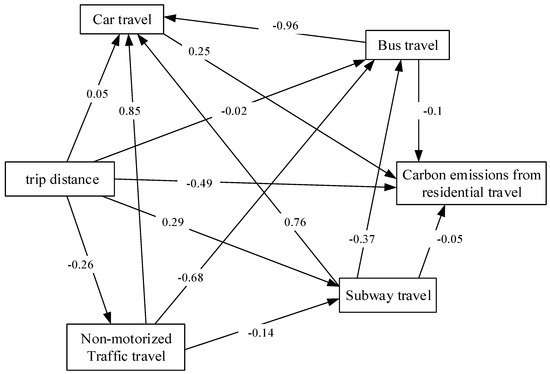
Figure 7.
Endogenous variable effect path. Note: 1. the path coefficient is 0.1, which means 1 standard deviation of the independent variable affects 0.1 standard deviations of the dependent variable. 2. A → B → C means that A affects C through affecting B, and the indirect effect is the product of the coefficients of each path.
4.2. Path Relationships between Exogenous Variables and Endogenous Variables
The direct, indirect, and total effects of residents’ socio-economic factors and the built environment on residents’ travel behaviour are shown in Table 6. As shown in Table 6:
- (1)
- The relationship between housing attribute variables and endogenous variables
- ➀
- Housing type has a significant negative effect on residents’ travel CO2 emissions, while location and distance from CBD has a significant positive effect. Most units are located in the urban core, and the closer to the city centre, the lower the travel CO2 emissions. The further away the municipality is from the core area and the urban CBD, the higher the CO2 emissions. As for the specific impact path, communities close to the city centre can reduce the probability of car travel and increase the probability of slow traffic travel, thus leading to the reduction of carbon emissions of residents’ travel.
- ➁
- The accessibility of public transport and subway travel has a significant negative effect on the CO2 emissions of residents’ travel, which means that the increase of public transport can promote the reduction of CO2 emissions.
- (2)
- Path relationships between individual socio-economic factor variables and endogenous variables
- ➀
- The impact of gender and occupation on carbon emissions from travel is not significant. Regardless of the direct effect, the indirect effect, or the overall effect of the model, the gender and occupation of the individual socio-economic factor variables have no significant effect on any of the endogenous variables. Age and education level have some influence on travel behaviour, including distance travelled and mode of travel, but the indirect and total effects on carbon emissions from travel are not significant.
- ➁
- Family income and car ownership are the main factors influencing travel CO2 emissions. The impact of income on travel distance and public transport is not significant, but the impact on car and slow traffic is significant. Increasing income will increase the likelihood of car travel, and reduce the likelihood of slow traffic. The increase in household car ownership will increase the likelihood of car travel, and have an important impact on residents’ travel options and travel CO2 emissions.
Overall, from both the indirect effect and the total effect, all of the built environment variables in the model have significant effects on the statistics for travel CO2 emissions. The path coefficient is large, which shows that in terms of individual socio-economic factors, the influence of the built environment on travel carbon emissions is more obvious.

Table 6.
Total, direct, and indirect effects of exogenous variables on endogenous variables.
Table 6.
Total, direct, and indirect effects of exogenous variables on endogenous variables.
| Exogenous Variable | Effect | Travel Distance | By Car | By Bus | By Underground | Slow Traffic | Travel CO2 Emissions |
|---|---|---|---|---|---|---|---|
| Gender | Total effect | 0 | 0 | 0 | 0.004 | 0 | 0.085 |
| Direct effect | 0 | 0 | 0 | 0.004 | 0 | 0.085 | |
| Indirect effect | 0 | 0 | 0 | 0 | 0 | 0 | |
| Age | Total effect | 0.014 | 0.061 | −0.037 | −0.08 | 0.109 | −0.078 |
| Direct effect | 0.014 | 0.061 | 0 | −0.037 | 0.105 | −0.064 | |
| Indirect effect | 0 | 0 | −0.037 | −0.042 | 0.004 | −0.014 | |
| Degree of education | Total effect | 0.06 | 0 | −0.066 | −0.066 | 0.251 | −0.245 |
| Direct effect | 0.06 | 0 | −0.067 | −0.061 | 0.251 | −0.246 | |
| Indirect effect | 0 | 0 | 0.001 | −0.005 | 0 | 0.002 | |
| Occupation | Total effect | 0.071 | 0.062 | −0.099 | −0.11 | 0.362 | −0.231 |
| Direct effect | 0.071 | 0.062 | −0.075 | −0.062 | 0.362 | −0.228 | |
| Indirect effect | 0 | 0 | −0.024 | −0.048 | 0 | −0.003 | |
| Monthly income | Total effect | −0.033 | −0.224 | −0.038 | 0.173 | 0.002 | 0.079 |
| Direct effect | −0.033 | −0.224 | −0.136 | 0.033 | 0 | 0.07 | |
| Indirect effect | 0 | 0 | 0.097 | 0.141 | 0.002 | 0.009 | |
| The number of family cars | Total effect | 0 | 0.373 | 0.034 | −0.266 | 0.098 | −0.044 |
| Direct effect | 0 | 0.373 | 0.214 | −0.028 | 0.101 | 0 | |
| Indirect effect | 0 | 0 | −0.181 | −0.238 | −0.003 | −0.044 | |
| Residential area type | Total effect | −0.97 | −0.146 | 0.08 | −0.058 | 0.093 | −0.17 |
| Direct effect | 0 | −0.096 | 0 | −0.031 | −0.007 | −0.384 | |
| Indirect effect | 0 | −0.12 | 0.001 | −0.052 | −0.007 | −0.113 | |
| Residential location | Total effect | 0.102 | 0.11 | −0.084 | 0.058 | −0.064 | 0.145 |
| Direct effect | 0.102 | 0.009 | −0.083 | 0.004 | −0.072 | 0.036 | |
| Indirect effect | 0 | 0.1 | −0.001 | 0.055 | 0.008 | 0.109 |
5. Discussion
Taking Guangzhou as an example, the travel characteristics of urban residents and the factors influencing carbon emissions were analysed. Income and family car ownership are the main factors influencing travel carbon emissions, and both are positively correlated with travel carbon emissions. Gender, age, education level, and occupation have no significant impact on the carbon emissions of residents’ travel. The above estimated results of the individual socio-economic influencing factors are generally consistent with the conclusions of existing research [31]. According to the survey, residents with higher incomes and car ownership are more likely to travel by car, even though the communities they live in have higher levels of public transport availability. The reason for this is that many people in Guangzhou do not want to wait a long time for buses when the environmental temperatures are high.
The type of residential area has a significant negative effect on travel carbon emissions, while the location of the residential area has a significant positive effect on residents’ travel carbon emissions. Both travel mode and travel distance have significant positive effects on residents’ travel carbon emissions. These conclusions are generally consistent with existing studies [20,32]. Compared to individual socio-economic factors, the built environment has a greater impact on travel carbon emissions.
The following suggestions are proposed for low-carbon travel guidance for urban residents:
- (1)
- In urban development, it should be beneficial to reduce the carbon emissions of residents’ travel through mixed land use, compact use, and balance of work and living space.
- (2)
- Where long-distance travel is unavoidable, public transport resources should be allocated rationally and effectively, according to the location and type of the residential area. The level of service provided by public transport should be continuously improved in order to reduce the overall carbon emissions of transport.
- (3)
- The increase in vehicle ownership and use is the main reason for the increase in carbon emissions from transport. It is proposed to strictly control the ownership and use of private cars in large cities, vigorously promote new energy vehicles, and promote advanced technologies, such as intelligent transportation.
There has been a great deal of useful theoretical research on the travel characteristics of residents and the study of low-carbon cities. Only by thoroughly exploring the interrelationship between urban spatial structure, individual behaviour, and carbon emissions can we achieve low-carbon development and build a low-carbon society and urban space. In addition, urban spatial structure and information technology will have a great impact on carbon emissions from residential travel, which is the future research direction.
6. Conclusions
In recent years, urban land planning and population growth in China have led to longer urban commutes and increased total carbon emissions from transport. This unsustainable development model is likely to be replicated in other developing countries. Therefore, it is important to use Chinese cities as a study area. Using data from 2018 in Guangzhou, China, this study reveals the characteristics of urban traffic carbon emissions in several aspects, digs out the internal relationship between individual behaviour, the built environment, and residents’ traffic behaviour, and deeply analyses the mechanism of residents’ traffic carbon emissions by using the structural equation model. The conclusions of our research and policy implications include the following:
- (1)
- There is a negative correlation between the distance between the community and the CBD and the carbon emissions of residents’ trips; there is a negative correlation between the accessibility of public transport in the community and the carbon emissions of residents’ trips. There are significant differences in the carbon emissions of residents’ travel in different types of communities. The carbon emissions of residents’ trips in Guangzhou are closer to the 60/20 distribution, and most of the carbon emissions of residents’ trips are uneven, with a few people emitting large amounts of carbon.
- (2)
- The characteristics of the residential area have a more significant impact on residents’ travel carbon emissions than individual socio-economic factors. The spatial location of residential areas affects the carbon emissions of residents. As for the type of residential areas, the higher the general community grade is, the higher the residents’ carbon emissions will be. Optimising the urban spatial structure is the key method to reduce residents’ carbon emissions. We should make use of land mixing, compact use, and the balance between occupation and the built environment to reduce residents’ carbon emissions. Under the background of China’s current rapid urban suburbanization, more space behaviour organisation and behaviour planning should be used to guide residents to reduce long-distance travel, such as making daily travel concentrated in a small range and branched network, in order to build a compact urban space system of low-carbon travel.
- (3)
- Travel distance and travel mode are the factors that directly influence the carbon emissions of residents’ travel. Individual socio-economic factors and the built environment influence carbon emissions of travel, through travel distance and travel mode. The increase in the number and use of motor vehicles is the main reason for the increase in CO2 emissions. On the one hand, it is recommended to strictly control the ownership and use of private cars in big cities. On the other hand, it is recommended to improve the service level of public transport, and strive to optimise the transport structure in order to achieve an overall reduction of CO2 emissions.
Funding
This research was funded by the science and technology research project of the Education Department of Jiangxi Province (GJJ211928), the project of high-level talent introduction of the scientific research of the Nanchang Institute of Technology (Grant No. 2021kyqd022), and the Jiangxi Provincial University humanities and social science research and planning project (Grant No. GL22229, GL21126).
Data Availability Statement
No applicable.
Conflicts of Interest
The authors declare no conflict of interest.
References
- IEA. CO2 Emissions from Fuel Combustion Highlights 2016; IEA: Paris, France, 2016. [Google Scholar] [CrossRef]
- Ma, J.; Liu, Z.; Chai, Y. The impact of urban form on CO2 emission from work and non-work trips: The case of Beijing, China. Habitat Int. 2015, 47, 1–10. [Google Scholar] [CrossRef]
- Marsden, G.; Rye, T. The governance of transport and climate change. J. Transp. Geogr. 2010, 18, 669–678. [Google Scholar] [CrossRef]
- Schwanen, T.; Banister, D.; Anable, J. Scientific research about climate change mitigation in transport: A critical review. Transp. Res. Part A Policy Pract. 2011, 45, 993–1006. [Google Scholar] [CrossRef]
- IEA. CO2 Emissions from Fuel Combustion Highlights 2018; IEA: Paris, France, 2018. [Google Scholar]
- Yang, W.; Li, T.; Cao, X. Examining the impacts of socio-economic factors, urban form and transportation development on carbon emissions from transportation in China: A panel data analysis of China’s provinces. Habitat Int. 2015, 49, 212–220. [Google Scholar] [CrossRef]
- Zhao, P. Sustainable urban expansion and transportation in a growing megacity: Consequences of urban sprawl for mobility on the urban fringe of Beijing. Habitat Int. 2010, 34, 236–243. [Google Scholar] [CrossRef]
- Ewing, R.; Cervero, R. Travel and the built environment: A synthesis. Transp. Res. Rec. J. Transp. Res. Board 2001, 1780, 87–114. [Google Scholar] [CrossRef]
- Modarres, A. Commuting and energy consumption: Toward an equitable transportation policy. J. Transp. Geogr. 2013, 33, 240–249. [Google Scholar] [CrossRef]
- Newman, P. The environmental impact of cities. Environ. Urban. 2006, 18, 275–295. [Google Scholar] [CrossRef]
- Shim, G.E.; Rhee, S.M.; Ahn, K.H.; Chung, S.B. The relationship between the characteristics of transportation energy consumption and urban form. Ann. Reg. Sci. 2006, 40, 351–367. [Google Scholar] [CrossRef]
- Hankey, S.; Marshall, J.D. Impacts of urban form on future US passenger-vehicle greenhouse gas emissions. Energy Policy 2010, 38, 4880–4887. [Google Scholar] [CrossRef]
- Hughes, B.; Chambers, L.; Lansdell, H.; White, R. Cities, area and transport energy. Road Transp. Res. 2004, 13, 72–84. [Google Scholar]
- Hong, J. Non-linear influences of the built environment on transportation emissions: Focusing on densities. J. Transp. Land Use 2017, 10, 229–240. [Google Scholar] [CrossRef]
- Barla, P.; Miranda-Moreno, L.F.; Lee-Gosselin, M. Urban travel CO2 emissions and land use: A case study for Quebec City. Transp. Res. Part D Transp. Environ. 2011, 16, 423–428. [Google Scholar] [CrossRef]
- Zahabi, S.A.H.; Miranda-Moreno, L.; Patterson, Z.; Barla, P.; Harding, C. Transportation greenhouse gas emissions and its relationship with urban form, transit accessibility and emerging green technologies: A Montreal case study. Procedia Soc. Behav. Sci. 2012, 54, 966–978. [Google Scholar] [CrossRef]
- Nicolas, J.; David, D. Passenger Transport and Carbon Emissions: What Does the French Transport Survey Tell Us? Atmos. Environ. 2009, 43, 1015–1020. [Google Scholar] [CrossRef]
- Ko, J.; Park, D.; Lim, H.; Hwang, I. Who Produces the Most Carbon Emissions for Trips in the Seoul Metropolis Area? Transp. Res. Part D Transp. Environ. 2011, 16, 358–364. [Google Scholar] [CrossRef]
- Büchs, M.; Schnepf, S. Who Emits Most? Associations Between socio-economic factors and UK Households’ Home Energy, Transport, Indirect and Total Carbon Emissions. Ecol. Econ. 2013, 90, 114–123. [Google Scholar] [CrossRef]
- Brownstone, D.; Golob, T.F. The impact of residential density on vehicle usage and energy consumption. J. Urban Econ. 2009, 65, 91–98. [Google Scholar] [CrossRef]
- Ding, C.; Wang, Y.; Xie, B.; Liu, C. Understanding the role of built environment in reducing vehicle miles traveled accounting for spatial heterogeneity. Sustainability 2014, 6, 589–601. [Google Scholar] [CrossRef]
- Chai, Y.; Xiao, Z.; Liu, Z. Comparative analysis on CO2 emission per household in daily travel based on spatial behavior constraints. Sci. Geogr. Sin. 2011, 31, 843–849. [Google Scholar]
- Ma, J.; Chai, Y.; Liu, Z. The mechanism of CO2 emissions from urban transport based on individuals’ travel behavior in Beijing. Acta Geogr. Sin. 2011, 66, 1023–1032. [Google Scholar]
- Brand, C. “Hockey Sticks” made of carbon unequal distribution of greenhouse gas emissions from personal travel in the United Kingdom. Transp. Res. Rec. 2009, 2139, 88–96. [Google Scholar] [CrossRef]
- Brand, C.; Goodman, A.; Rutter, H.; Song, Y.; Ogilvie, D. Associations of Individual, Household and Environmental Characters with Carbon Dioxide Emissions from Motorized Passenger Travel. Appl. Energy 2013, 4, 158–169. [Google Scholar] [CrossRef]
- Brand, C.; Boardman, B. Taming of the Few—The Unequal Distribution of Greenhouse Gas Emissions From Personal Travel in the UK. Energy Policy 2008, 36, 225–230. [Google Scholar] [CrossRef]
- Susilo, Y.; Stead, D. Individual Carbon Dioxide Emissions and Potential for Reduction in the Netherlands and the United Kingdom. Transp. Res. Rec. J. Transp. Res. Board 2009, 2139, 142–152. [Google Scholar] [CrossRef]
- Carlsson-Kanyama, A.; Lindén, A. Travel Patterns and Environmental Effects Now and in the Future: Implications of Differences in Energy Consumption Among Socio-Economic Groups. Ecol. Econ. 1999, 30, 405–417. [Google Scholar] [CrossRef]
- Huang, X.; Li, P.; Cao, X. Characteristics and Mechanism of CO2 Emissions from Urban Commuting in Guangzhou. Urban Environ. Urban Ecol. 2014, 27, 32–38. [Google Scholar]
- Hou, T.; Wen, Z.; Cheng, Z. Structural Equation Modeling and Its Application; Educational Science Press: Beijing, China, 2004; pp. 1–3. [Google Scholar]
- Cao, X.; Yang, W. Examining the effects of the built environment and residential self-selection on commuting trips and the related CO2 emissions: An empirical study in Guangzhou, China. Transp. Res. Part D Transp. Environ. 2017, 52, 480–494. [Google Scholar] [CrossRef]
- Alford, G.; Whiteman, J. Macro-urban form and transport energy outcomes: Investigations for Melbourne. Road Transp. Res. 2009, 18, 53–67. [Google Scholar]
Disclaimer/Publisher’s Note: The statements, opinions and data contained in all publications are solely those of the individual author(s) and contributor(s) and not of MDPI and/or the editor(s). MDPI and/or the editor(s) disclaim responsibility for any injury to people or property resulting from any ideas, methods, instructions or products referred to in the content. |
© 2023 by the author. Licensee MDPI, Basel, Switzerland. This article is an open access article distributed under the terms and conditions of the Creative Commons Attribution (CC BY) license (https://creativecommons.org/licenses/by/4.0/).