Abstract
Wave-mean flow interaction is usually regarded as accounting for the origin of the Arctic Oscillation/Northern Hemisphere Annular Mode (AO/NAM). It is inferred that the combination of the local wave-mean flow interactions at the AO/NAM’s three regional centers of action on three important time scales contributes to the main behavior of the AO/NAM index. To discuss the variations of the AO/NAM indices on the three prominent time scales, we take the 2007/08 and 2009/10 winters as two comparative examples to analyze the local wave-mean flow interactions at the AO/NAM’s three centers. The following three facets are identified: (1) Synoptic-scale wave breakings in the North Atlantic can explain the variances of the AO/NAM index on a time scale of 10–20 days. In the 2007/08 winter, there were both cyclonic and anticyclonic synoptic wave breakings, while in the 2009/10 winter, cyclonic synoptic wave breaking was dominant, and the flow characteristics were strikingly similar to the blocking. (2) In the 2007/08 and 2009/10 winters, the signals of the AO/NAM indices on the time scale of 30–60 days are mainly from the interactions between the upward propagating quasi-stationary waves and the polar vortex in the stratosphere. (3) This work also demonstrates that the AO/NAM is linked to the El Niño–Southern Oscillation (ENSO) by the Pacific–North American pattern (PNA) on the winter mean time scale. In the 2007/08 (2009/10) winter, La Niña (El Niño) forced the Pacific jet to shift poleward (equatorward), in favor of weakening (enhancing) the polar waveguide; thus, the polar vortex became stronger (weaker), corresponding to the positive (negative) winter mean AO/NAM index.
1. Introduction
The Arctic Oscillation (AO), also referred to as the Northern Hemisphere annular mode (NAM), is the leading mode of climate variability over the extratropical region of the Northern Hemisphere [1,2,3]. Though the AO/NAM derives its definition from the leading empirical orthogonal function (EOF) pattern of sea level pressure (SLP), a number of studies have investigated its underlying dynamics. The most important of these is found to be the interaction between the waves and the zonal mean flow [4,5,6,7,8,9,10]. In the troposphere, the AO/NAM is mainly associated with the interaction of the synoptic eddy and zonal flow on the time scale of 10–20 days, while closely associated with the interaction of the quasi-stationary planetary wave and zonal flow in the stratosphere on the time scale of 30–60 days [11]. Particularly, the wave-mean flow interaction is concentrated on three regional centers of action located in the North Atlantic, the North Pacific, and the Arctic.
In the North Atlantic, the interaction between the synoptic-scale waves and the zonal wind is intense during the synoptic wave breaking progress. Benedict et al. [6], Feldstein SB [7], and Franzke et al. [8] note that synoptic-scale waves break cyclonically for the negative North Atlantic Oscillation (NAO) phase and anticyclonically for the positive NAO phase. Feldstein and Franzke [9] further suggest that the AO/NAM and the NAO wave breaking events are indistinguishable by comparing the characteristics during the life cycles of the AO/NAM or the NAO wave breaking events. In this sense, wave breaking events are responsible for variations of the AO/NAM and the NAO on a time scale of 10–20 days. Additionally, wave breaking is considered a potentially relevant component for stratosphere-troposphere interactions [12]. Kunz et al. [12] suggest that anticyclonic (cyclonic) wave breaking is associated with a stronger (weaker) lower-stratospheric polar vortex. This analysis represents the relationship between the AO/NAM’s North Atlantic center and the Arctic stratosphere center.
In the Arctic, the AO/NAM is the dominant stratospheric variability mode, which characterizes the strength of the polar vortex. During winter, the tropospheric quasi-stationary planetary waves can propagate upward into the stratosphere, and the polar vortex can organize this chaotic wave forcing to create long-lived changes in the stratospheric circulation. In the process, the quasi-stationary planetary waves and the zonal wind interact on a relatively long time scale of about 30–60 days. Early studies found these stratospheric changes can in turn affect the pressure in the troposphere [13,14,15,16]. Recently, some work based on finite-amplitude wave interaction with the mean flow helped further demonstrate that the downward migration of extratropical wind anomalies (such as AO/NAM) following a stratospheric sudden warming and strong vortex event is largely attributable to dynamical adjustments induced by fluctuating finite-amplitude wave forcing. And the nonconservative effects contribute to maintaining the downward signals in the recovery stage within the stratosphere [17,18,19]. And the results of Chen et al. [20,21] show that the quasi-stationary planetary wave activity is closely associated with the AO/NAM. If the propagation of quasi-stationary planetary waves into the stratosphere over the high latitudes of the Northern Hemisphere is strong, its propagation to the upper troposphere over low latitudes is weak. This causes an anomalously strong convergence of E-P fluxes from quasi-stationary waves over the high latitudes and an anomalously strong divergence of the E-P fluxes over the low latitudes, leading to a weakening polar jet and a strengthening subtropical jet. Consistently, the AO/NAM index is negative or low, and vice versa [22]. Thus, the fluctuations of the polar vortex as the stratospheric AO/NAM’s regional center are driven by the interaction between upward tropospheric planetary waves and the stratospheric mean flow on the characteristic time scale of 30–60 days.
In the North Pacific, the local interaction between the synoptic-scale eddies and jet is strong in winter and is also important to the AO/NAM. At the same time, the storm track and jet stream can be reflected by the Pacific–North American pattern (PNA). The complicated relationship between the PNA and the AO/NAM can be referred to in the relevant studies [3,4,5,11,23]. It is worth noting that the wintertime variability of PNA can arise through atmospheric Rossby waves that are associated with the thermal forcing in the tropics and the El Niño–Southern Oscillation (ENSO). Some works prove that the AO/NAM and ENSO are correlated by the PNA on the winter mean time scale [24,25,26,27]. For instance, in the case of El Niño events, it is possible to predict that the positive phase of the AO/NAM might have difficulty emerging since the PNA excited by El Niño gives rise to a negative anomaly over the North Pacific. This was further confirmed by Lubis S. W. [28] and Richter J. H. [29], who showed that El Niño winters are associated with a poleward displacement of the planetary waveguide, resulting in enhanced wave convergence in the polar stratosphere and therefore a more disturbed polar vortex. For La Niña winters, the results are roughly similar to those for El Niño winters, but with the opposite signal. Their work demonstrates the dynamic relationship between two of AO/NAM’s regional centers, namely the North Pacific and polar stratosphere, forced by the wave-mean flow interaction. Moreover, the North Pacific regional center is related to the North Atlantic. There is evidence that the strength and location of the Pacific Jet and the storm track play an important role in the type of synoptic wave breaking in the downstream North Atlantic, which exerts an influence on the Atlantic center [6,7,8,10].
As pointed out in our previous work [30,31], the physical mechanism of the wave-mean flow interaction is evident and sound: the planetary Rossby wave plays a key role in the interaction among the AO/NAM’s three centers. Its horizontal propagation connects the two jet streams over the Atlantic and the Pacific, while its upward propagation in winter links the two jet streams with the stratospheric polar vortex. The three centers’ dynamical coupling is demonstrated by the climate models [32] and statistical analysis [33].
Although the AO/NAM has a very broad time spectrum ranging from weekly to seasonal to decadal scales, because of its dynamic nature, subseasonal time scales of 10–20 days and 30–60 days are essential to the AO/NAM. And many studies also focus on the winter mean time scale owing to the dynamical linkage of the AO/NAM-PNA-ENSO pattern and its strong influence on the winter climate [26,27,34].
Based on the aforementioned research, this paper investigates the local wave-mean flow activities at the three AO/NAM regional centers of action on the corresponding three different time scales, which are the 10–20 days, the 30–60 days, and the winter mean time scale. We use the AO/NAM index that reflects the activities of the AO/NAM, with each prominent time scale of the AO/NAM index corresponding to the wave-mean flow activities of the respective regional centers.
We pick two typical wintertime AO/NAM indices. In the winter of 2007/08, a La Niña occurred in the equatorial Pacific, and the AO/NAM index undulated violently (see Figure 1a). There were serious snow calamities in the southern part of China. In the winter of 2009/10, an El Niño occurred in the equatorial Pacific, and the AO/NAM index stayed negative all winter (see Figure 1b), whose absolute value was very large. The index of the winter of 2009/10 was quite unusual for the past 60 years. Contrary to the winter of 2007/08, the northern part of China experienced severe snowstorms in the winter of 2009/10. The ENSO event, the AO/NAM index, and the weather damage were almost opposite during the two winters. Many earlier studies have illustrated several mechanisms of the two low-temperature winters [35,36,37,38,39,40,41]. Here, in contrast, our focus is to examine the role played by the wave-mean flow interaction on the anomalous AO/NAM indices of the above contradistinctive winters. The results not only present further evidence on the mechanisms of teleconnection patterns for the two severe winters but also are conducive to better understanding the formation of the AO/NAM.
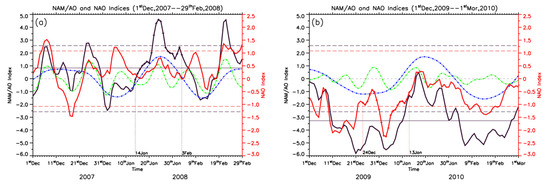
Figure 1.
(a) The AO/NAM index and the NAO index of the 2007/08 winter. The left vertical axes represent the AO/NAM index and its bandpass filters, and the right vertical axes represent the NAO index. The horizontal axes depict the data. The black (red) solid line represents the AO/NAM (the NAO) index, and the black (red) long-dashed line represents the AO/NAM’s (the NAO’s) 1.33 standard deviation thresholds. The green (blue) dash and dot line represents the band pass of 10–20 days (30–60 days) of the AO/NAM index. The black solid line represents the winter average of the AO/NAM index. The period from 14 January to 3 February 2008, is the positive AO/NAM event. (b) The AO/NAM index and the NAO index of the 2009/10 winter. The period from 24 December 2009, to 13 January 2010 is the negative NAO event.
This paper is composed of seven sections. Section 2 describes the data sources used and the methods of analysis. Section 3 shows that the AO/NAM indices of the 2007/08 and 2009/10 winters have two significant time scales. One time scale is 10–20 days, and the other is 30–60 days. Section 4 documents the explanations of the fluctuations of the AO/NAM indices of the 2007/08 winter and 2009/10 winter on a time scale of 10–20 days. The high frequency of the AO/NAM index is closely associated with the synoptic wave-breaking progress in the North Atlantic. In Section 5, it is shown that the signal of the AO/NAM index on the time scale of 30–60 days can be attributed to the polar vortex in the stratosphere. Section 6 suggests an approach to studying the dynamical interaction between the ENSO and the AO/NAM. This section shows that the AO/NAM has an indirect relationship with the ENSO via the PNA. The final section offers a synthesis and partial interpretation of the results.
2. Data and Analysis Techniques
2.1. Data
For this study, we used daily and monthly mean pressure level data from the National Centers for Environmental Prediction-National Center for Atmospheric Research (NCEP-NCAR) reanalysis. This popular data set has a 2.5° × 2.5° horizontal resolution and extends from 1000 to 10 hPa with 17 vertical pressure levels. In addition, we employ the reconstructed monthly SST data obtained from NCAR’s Data Support Section. These data are available from January 1950 to the present, with a grid of 2.0° × 2.0°. The most basic data for the analysis are the daily AO/NAM and NAO indices from the Climate Prediction Center (CPC), which can be downloaded from https://ftp.cpc.ncep.noaa.gov/cwlinks/, accessed on 16 February 2023. And we use the zonal wind average of the region (45°–80° N, 100–10 hPa) to represent the polar vortex.
Moreover, we focus on the winter means that are constructed by averaging the monthly means of December, January, and February (DJF) and the autumn means that are constructed by averaging the monthly means of September, October, and November (SON).
2.2. Analysis Techniques
In the following analysis, we briefly introduce how to consider AO, NAM, and NAO events according to the research of Benedict et al. [6]. During the synoptic wave breaking progress, the AO/NAM and the NAO are distinguishable [9]. Therefore, if either the AO/NAM index or the NAO index can satisfy the definition of Benedict et al. [6], the homologous 21-day life cycle will be regarded as an event. As to the two winters, the selected final events are from 14 January to 3 February 2008, and from 24 December to 13 January 2010. The former period is a positive event, while the latter one is a negative event.
Wavelet analysis and the Butterworth bandpass filter are adopted in this paper. We use a Matlab toolbox for performing wavelet analysis as described in Torrence C. and Compo G.P. [42] and Grinsted A. et al. [43]. The website provides a detailed description (https://noc.ac.uk/business/marine-data-products/cross-wavelet-wavelet-coherence-toolbox-matlab, accessed on 1 January 2023). The Butterworth bandpass filter is performed using NCL, whose algorithm is optimized for narrow band applications.
Furthermore, we use Eliassen-Palm (E-P) flux to measure the wave activity propagation. To indicate the eddy forcing of the zonal mean flow, the quasi-geostrophic version of E-P flux in spherical geometry is employed in the calculation of the wave activity divergence of planetary waves [44]. The E-P flux is a zonally averaged quantity and therefore can provide insight only into zonally averaged latitudinal and vertical wave propagation characteristics. Therefore, Plumb [45] developed the E-P flux into a three-dimensional formula to envision the propagation. The three-dimensional E-P flux, which is supposed to be parallel to the local group velocity in the almost plane wave limit, illustrates the three-dimensional propagation of a wave packet on the zonally uniform westerlies.
As in Chen et al. [20,21], if we introduce the residual circulation,
then the zonal-mean momentum equation becomes
The E-P flux divergence is the only eddy term here.
In the equation, u and v denote the zonal and meridional wind, respectively; θ the potential temperature; p the atmosphere’s pressure; f the Coriolis parameter; ▽·E the E-P flux divergence; square brackets the zonal mean; and primes the departures from the zonal mean. From the equation, the acceleration of the zonal wind mainly depends on the E-P flux divergence, ignoring the other two terms of the equation that are usually very small. We can use the above equation to diagnose E-P flux impacting the zonal wind.
3. Abnormity Features of the Winter AO/NAM Index
In the winter of 2007/08, the AO/NAM index undulated violently. From the middle of January 2008, the AO/NAM index turned positive, and the value of the AO/NAM index increased greatly. On the 24th of January, the AO/NAM index reached its highest point. Then, the AO/NAM index fell quickly. On the contrary, the AO/NAM index almost stayed negative in the winter of 2009/10, the absolute value of which was quite large (see Figure 1).
The power spectrum and wavelet analysis results show that the AO/NAM index of the winter of 2007/08 has two obvious time scales. One time scale is 10–20 days, and the other is 30–60 days (see Figure 2a). This was also the case for the AO/NAM index for the winter of 2009/10 (see Figure 2b). The result shows that the high-frequency time scale of the AO/NAM index of the 2007/08 winter is more prominent, while the low-frequency time scale of the AO/NAM index of the 2009/10 winter is more prominent.
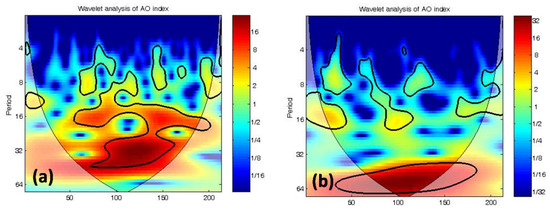
Figure 2.
(a) The wavelet power spectrum of the AO/NAM index during the period from 1 October 2007 to 30 April 2008, using the Morlet wavelet. The left axis is the Fourier period (in days), which corresponds to the wavelet scale on the right axis. The bottom axis is time (day). The thick contour encloses regions of greater than 95% confidence for a red-noise process. The dotted-line-covered regions on either end indicate the “cone of influence”, where edge effects become important. (b) The wavelet power spectrum of the AO/NAM index during the period from 1 October 2009, to 30 April 2010, using the Morlet wavelet.
To better interpret the fluctuations of the AO/NAM index, we apply Butterworth bandpass filters to the AO/NAM index. In Figure 1, the green dash and dot line represent the bandpass of 10–20 days of the AO/NAM index, while the blue dash and dot line represent the bandpass of 30–60 days. The black, thin, solid line represents the winter average of the AO/NAM index. We will interpret the vibrations of the bandpass of 10–20 days in Section 4. Section 5 will focus on the vibrations of the bandpass over the course of 30–60 days. The possible effect of ENSO on the winter mean of the AO/NAM index is discussed in Section 6.
4. The AO/NAM Index on the Time Scale of 10–20 Days: Synoptic Wave Breaking in the North Atlantic
In the North Atlantic, synoptic wave breaking influences the AO/NAM index on a time scale of 10–20 days. As in Benedict et al. [6], we use the potential temperature θ and wind fields on the 2-PVU surface to visualize the evolution of wave breaking.
Figure 3 shows the evolution of Θ on the 2-PVU surface from 14 January to 3 February 2008. At first, there was an amplifying ridge over the western part of North America with a tongue of cold air over central America. And the ridge and trough tilt from northeast to southwest. Then the synoptic waves migrated eastward and broke anticyclonically, resulting in the advection of the main body of cold air into the northwest part of the North Atlantic. On 25 January 2008, the potential temperature gradient over the North Atlantic was tightened. Thus, the positive phase pattern of the AO/NAM was established. Correspondingly, the AO/NAM index and its 10-to-20-day bandpass reached their highest point. However, at the end of the life cycle, the circulation took on the characteristics of a cyclonic wave breaking. The ridge and trough tilt from northwest to southeast, and the synoptic waves break cyclonically. There is a high-Θ region over northeastern Canada, and the AO/NAM index falls.
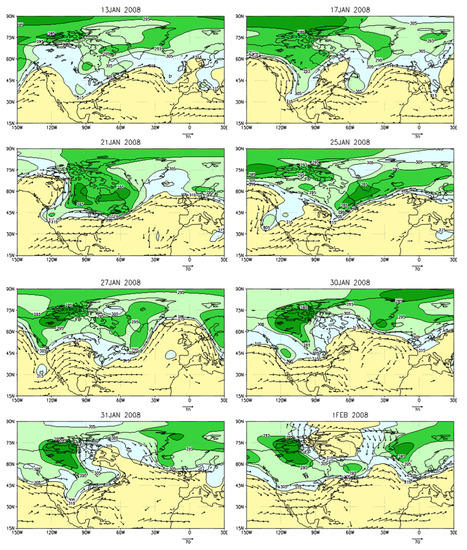
Figure 3.
Unfiltered θ wind fields on the 2-PVU surface for the positive AO/NAM event from 14 January to 3 February 2008 (θ, shaded, unit: K; the wind, vectors, unit: ms−1; the corresponding date is marked on the top of each panel).
Similarly, we illustrate the circulations of the negative event from 24 December 2009, to 13 January 2010 in Figure 4. The sequence of Θ fields in Figure 4 depicts the successive development of a North Atlantic ridge during the life cycle. There was a basinwide North Atlantic ridge several days prior to the defined starting day of the selected negative event. The slow decay of the ridge persisted through December 28. Then a moderate-amplitude ridge over central North America propagated eastward and once again revitalized the initial North Atlantic ridge on December 31. The axes of the North Atlantic ridge and associated upstream trough tilt from northwest to southeast, opposite that of the positive phase, reflecting the cyclonic wave breaking pattern. The cyclonic flow features bear a close resemblance to those of blocks but are distinctly different from the positive event. On 3 January 2010, there was a high-Θ anomaly centered over southern Greenland and a moderate low-Θ anomaly extending across the mid-latitude North Atlantic. The Θ field pattern resembles the so-called warm over cold structure. Correspondingly, the AO/NAM index and NAO index went upward at the beginning of the life cycle and later decreased, reaching the lowest point. In the termination stage of the negative events, there were two pronounced ridges over the west coast of the Pacific and over the central North Atlantic. As the synoptic waves propagate eastward, high-Θ air is entrained across central North America. And there was warm air cut off over south Greenland and the northern part of the North Atlantic, with low-Θ zones across the central North Atlantic.
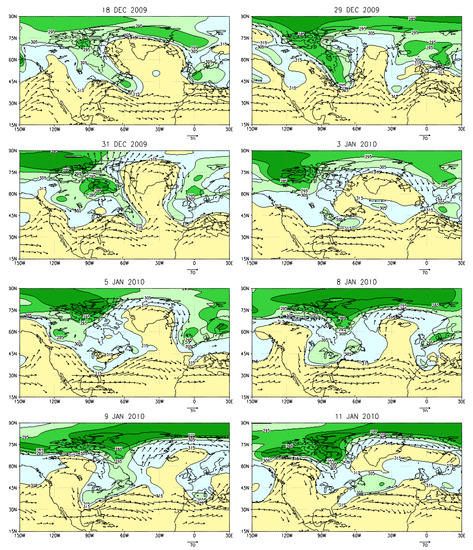
Figure 4.
Unfiltered θ fields on the 2-PVU surface for the negative NAO event from 24 December 2009, to 13 January 2010 (θ, shaded, unit: K; the wind, vectors, unit: m·s−1; the corresponding date is marked on the top of each panel).
We analyze the daily evolution of Θ and wind on the 2-PVU surface during the 2007/08 winter and find that there are both anticyclonic and cyclonic synoptic waves breaking in the North Atlantic. Synoptic-scale waves develop in North America and migrate across the North Atlantic very quickly. As a result, there are anomalous vibrations of the AO/NAM index on the time scale of 10–20 days, and the amplitude is larger compared with the 10–20 day bandpass of the AO/NAM index of the 2009/10 winter. During the 2009/10 winter, cyclonic synoptic wave breaking was prominent in the North Atlantic, and the flow characteristics are strikingly similar to the blocks, which may be one of the reasons that the AO/NAM index stayed negative during the winter. The activities of the synoptic-scale wave breaking in the North Atlantic, especially the undulations of the 10–20 day bandpass of the AO/NAM index, can explain the vibrations of the wintertime AO/NAM index. Furthermore, the 10–20-day bandpasses of the AO/NAM index and the NAO index almost coincide with each other on the time scale of 10–20 days. Thus, this finding reflects the conclusion of Feldstein and Franzke [9] that the AO/NAM and NAO are indistinguishable during the synoptic wave breaking on the time scale of 10–20 days, both of which have the same physical mechanism.
In Figure 5, it is shown that equatorward and downward planetary waves are dominant over the North Atlantic during the anticyclonic wave breaking stage of 14 January to 3 February 2008. In contrast, the upward planetary waves are intense over Baffin Bay in the cyclonic wave breaking period from 24 December 2009, to 13 January 2010, and there are more poleward planetary waves in the high latitudes of the North Atlantic on the 200 hPa level. Consistent with the wave forcing, the zonal wind is stronger centered on 50° N in the North Atlantic during the anticyclonic wave breaking progress. This reflects the northward shift of the North Atlantic jet (see Figure 6) in favor of strong polar vortices.
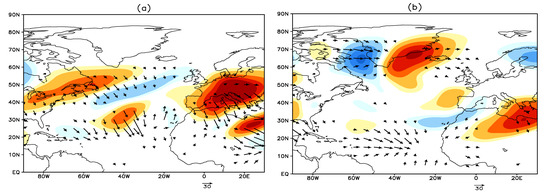
Figure 5.
Distribution of the 200 hPa horizontal flux (m2·s−2; arrows) and the vertical flux (m2·s−2; contours; upwards, blue) from (a) January 14 to February 3, 2008; (b) 24 December 2009 to 13 January 2010.
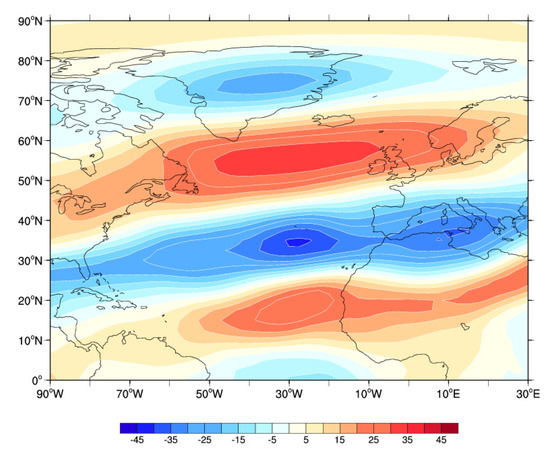
Figure 6.
Distribution of zonal wind anomalies (m·s−1) at 200 hPa (anticyclonic wave breaking period (14 January to 3 February 2008) minus cyclonic wave breaking period (24 December 2009 to 13 January 2010).
Research has shown that the phase of the breaking event depends on the latitudinal location of the storm track [8]. We examine storm tracks a few days before the onset and beginning of either phase of the wave-breaking events. The result shows that, in 2008, the maximum of the 500 hPa synoptic disturbance kinetic energy moved eastwards very quickly before the positive wave broke and the storm track shifted to the northern part of the Pacific (see Figure 7a). In contrast, during the negative wave breaking event of the 2009/10, the strength of the storm track was weak (see Figure 7b). Additionally, the storm track moved very slowly to the southern part of the Pacific. This result suggests that the Pacific storm track may play an important role in triggering the breaking waves during the positive AO/NAM event. However, the dynamic interaction between the North Pacific and the North Atlantic is very complicated, and there is no simple linear relationship between the PNA and the NAO [11].
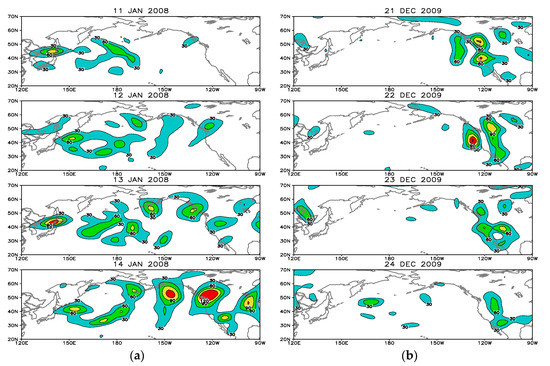
Figure 7.
Distribution of synoptic disturbance kinetic energy in 500 hPa with a contour interval of 30 m2·s−2 from (a) 11–14 January 2008; (b) 17–19 December 2009.
We analyze the daily evolution of the positive and negative AO/NAM events, respectively. The positive AO/NAM event in the 2007/08 winter was the synoptic wave breaking anticyclonically, which was characterized by two southwest-northeast tilted trough-ridge pairs in North America and the North Atlantic. Additionally, the potential temperature gradient over the North Atlantic was tightened. The North Atlantic jet shifts northward, with more equatorward and downward waves propagating. The Pacific storm track was displaced poleward prior to the onset of the positive AO/NAM phase. In contrast to the positive event, the negative phase of the 2009/10 winter cyclonic synoptic wave breaking was prominent in the North Atlantic, and the flow characteristics were strikingly similar to the blocks. The potential temperature gradient over the North Atlantic was the reverse of the positive event. And the North Atlantic jet shifts southward with more poleward and upward wave activities over the high latitudes of the North Atlantic. Prior to the onset of the negative AO/NAM phase, the Pacific storm track was displaced equatorward.
5. The AO/NAM Index on the Time Scale of 30–60 Days: Stratospheric Polar Vortex (SPV) in the Arctic
The interaction between the stationary waves and the zonal wind is quite important to the AO/NAM. The polar vortex is not only the place where the quasi-stationary planetary waves and the zonal wind interact very intensely but also the regional center of action of the AO/NAM in the stratosphere. The signal of the interaction between the quasi-stationary planetary waves and the zonal wind can propagate downward such that it could act on the circulations in the lower troposphere [13,14,15,16].
We can see from Figure 8 that the polar vortex and the AO/NAM indices have similar vibrations on the time scale of 30–60 days. This finding reflects the fact that the activity of the polar vortex can exert a significant influence on the AO/NAM index on a time scale of 30–60 days. Additionally, the SPV in the anticyclonic wave breaking period of 14 January to 3 February 2008, was stronger compared to the cyclonic wave breaking period of 24 December to 13 January 2010. The results are in accordance with the theoretical analysis in [12].
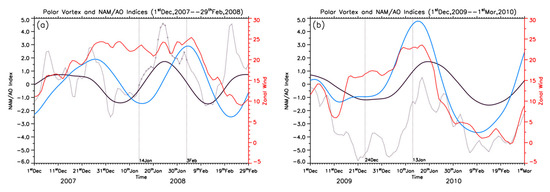
Figure 8.
(a) The Polar Vortex and AO/NAM indices of the 2007/08 winter. The left vertical axes represent the AO/NAM index and the 30–60 band pass of the zonal wind. The right vertical axes represent the zonal wind. The horizontal axes depict the data. The black short-dotted line represents the AO/NAM index, and the black line represents its 30- to 60-day band pass. The red line represents the polar vortex index, and the blue line represents its band pass of 30–60 days. The period from 14 January to 3 February 2008, is the positive AO/NAM event. (b) The Polar Vortex and AO/NAM indices of the 2009/10 winter. The period from 24 December 2009, to 13 January 2010 is the negative NAO event.
It is shown in Figure 9 that the polar vortex and the E-P flux divergence of the polar vortex region (45°–80° N, 100–10 hPa) have similar vibrations on the time scale of 30–60 days. Moreover, the variation of the E-P flux divergence is prior to the action of the polar vortex on the time scale of 30–60 days. It reflects that the activity of the polar vortex is closely associated with the upward quasi-stationary planetary waves according to Equation (2) in Section 2.2.
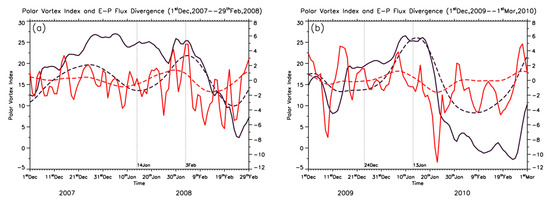
Figure 9.
(a) The Polar Vortex index and E-P flux divergence of the 2007/08 winter. The right vertical axis represents the polar vortex index. The left vertical axis represents the E-P flux divergence and the band passes of the E-P flux divergence and the polar vortex index. The red line represents the E-P flux divergence, and the red short-dotted line represents its band pass of 30–60 days. The black line represents the polar vortex index and its 30- to 60-day band pass. The period from 14 January to 3 February 2008, is the positive AO/NAM event. (b) The Polar Vortex index and E-P flux divergence of the 2009/10 winter. The period from 24 December 2009, to 13 January 2010 is the negative NAO event.
The results of Figure 8 are in good agreement with previous theoretical analyses. This proves that the polar vortex is the AO/NAM’s regional center in the stratosphere, and the activities of the AO/NAM are deeply affected by the polar vortex on a time scale of 30–60 days. The main signal of the AO/NAM index on a time scale of 30–60 days is affected by the polar vortex. Figure 9 shows that the polar vortex and the E-P flux divergence of the same region have similar vibrations on the time scale of 30–60 days. This finding means that the activity of the upward and poleward refraction of the quasi-planetary stationary waves into the stratosphere over high latitudes in the Northern Hemisphere can very strongly affect the stratospheric polar vortex.
6. The Winter Average of the AO/NAM Index: The North Pacific Jet and the ENSO
In winter, the continents are cold while the oceans are warm. An ENSO event can strengthen or weaken the thermal contrast between the oceans and landmasses, which will cause disturbances of the quasi-stationary planetary waves and affect the geopotential height during their northward propagation [46]. Chen et al. [20,21] note that the SST anomaly is correlated with the activities of the quasi-stationary planetary waves during the winter in the troposphere. Figure 10 depicts the significantly correlated region with the black frame, whose spatial structure of the SST anomaly behaved very differently between the autumns of 2007 and 2009. This was also the case with the differences in spatial structure between the 2007/08 and the 2009/10 winters. In the autumn of 2007, a La Niña occurred in the Pacific, and in the winter of 2007/08, the La Niña phenomenon strengthened, as depicted in Figure 10a,c. Whereas in the autumn of 2009, an El Niño occurred in the Pacific, and as depicted in Figure 10b,d, in the winter of 2009/10, the El Niño phenomenon strengthened.
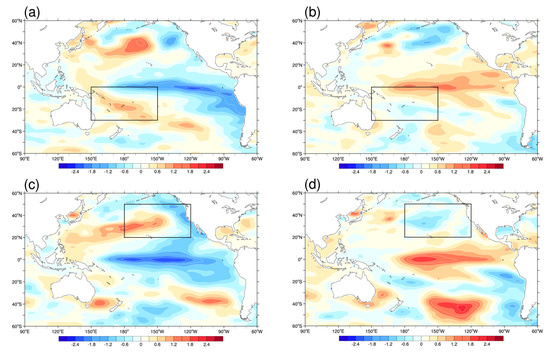
Figure 10.
The seasonal sea surface temperature anomaly for (a) 2007 autumn; (b) 2009 autumn; (c) 2007–2008 winter; and (d) 2009–2010 winter over the Pacific.
It is found that the PNA pattern is most significantly correlated with the SSTA in the middle and high latitudes of the Northeastern Pacific Ocean, as well as in the eastern Equatorial Pacific Ocean. Corresponding to the SSTA in the eastern Equatorial Pacific Ocean and eastern region of the North Pacific, the PNA index was negative in the autumn of 2007 and the winter of 2007/08, while it was positive in the autumn of 2009 and the winter of 2009/10 (see Figure 11). The four regions marked with a black frame in Figure 11 are those used to define the PNA index, using a modified pointwise method to replace the method proposed by Wallace and Gutzler [47].


Figure 11.
Distribution of geopotential height anomalies (gpm) at 500 hPa for (a) the autumn of 2007; (b) the autumn of 2009; (c) the winter of 2007–2008; and (d) the winter of 2009–2010.
According to the quasi-geostrophic equation of motion, the change of the 200 hPa geopotential height anomaly field means that the Pacific Jet was also changed. The Pacific Jet in the winter of 2007/08 shifted north, while the Pacific Jet in the winter of 2009/10 shifted south (see Figure 12). This implies the North Pacific regional center is affected because the AO/NAM is the reflection of the zonal wind [4].

Figure 12.
Distribution of zonal wind anomalies (m·s−1) at 200 hPa for (a) the winter of 2007–2008 and (b) the winter of 2009–2010.
The change in the Pacific Jet, as part of the zonal wind, will modulate the upward propagation of the quasi-stationary planetary wave. When the zonal wind is strong in the mid-latitudes, more quasi-stationary planetary waves propagate in the high latitudes of the stratosphere, weakening the polar vortex, and vice versa. In Figure 13a, we can see that in the winter of 2007/08, the propagation of quasi-stationary planetary waves into the stratosphere over high latitudes of the Northern Hemisphere weakened, while its propagation into the upper troposphere over low latitudes was strengthened, which led to the strengthening of the polar jet and the weakening of the subtropical jet (see Figure 13a). Conversely, in the winter of 2009/10, the propagation of quasi-stationary planetary waves into the stratosphere over the high latitudes of the Northern Hemisphere was strong, while its propagation into the upper troposphere over low latitudes weakened (see Figure 13b). As a consequence, there is an anomalously strong convergence of E-P fluxes of quasi-stationary waves over high latitudes in the Northern Hemisphere and a weak divergence of the E-P fluxes over low latitudes. With the interaction between waves and zonal flow, the polar jet is weakened and the subtropical jet is strengthened.
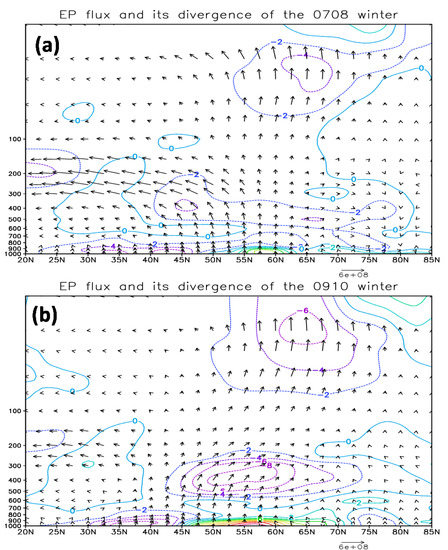
Figure 13.
(a) The EP flux (kg/s2) and its divergence (m·s−1·d−1) in the winter of 2007/08. (b) The EP flux (kg/s2) and its divergence (m·s−1·d−1) in the winter of 2009/10.
Furthermore, Figure 14 demonstrates that the North Pacific is the area where the propagation of the quasi-stationary planetary waves is very strong. Compared with the situation in the 2007/08 winter, the upward propagation of the quasi-stationary planetary waves in the 2009/10 winter was weaker, and there were more horizontal components of the quasi-stationary planetary waves propagating into the high latitude. Under the influence of the propagation of the quasi-stationary planetary waves, the zonal wind in the mid-latitude was strong during the 2007/08 winter, while the stratospheric polar vortex was very weak during the 2009/10 winter, as shown in Figure 11. The results also indicate that the winter average of the AO/NAM index for the 2007/08 winter was weakly positive and the winter average of the AO/NAM index for the 2009/10 winter was strongly negative. The results are consistent with the numerical experiments and simulations in Lubis S. W. [26] and Richter J. H. [27].
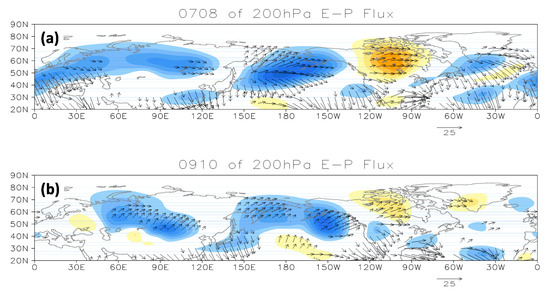
Figure 14.
Distribution of the 200 hPa horizontal flux (m2·s−2; arrows) and the vertical flux (m2·s−2; contours; upwards, blue) of (a) the winter of 2007/08 and (b) the winter of 2009/10.
In the 2007/08 winter, a La Niña occurred in the tropical Pacific, leading to a negative PNA and the North Pacific jet exhibiting a pronounced north-shift. This caused the polar waveguide to be weakened; thus, the polar vortex was strong. Consequently, the winter mean AO/NAM index was positive. In the 2009/10 winter, an El Niño occurred in the tropical Pacific, leading to a negative PNA and the Pacific jet exhibiting a pronounced south-shift. This caused the polar waveguide to be strengthened; thus, the polar vortex was very weak. Consequently, the winter mean AO/NAM index was negative with a high absolute value.
7. Conclusions
The Northern Hemisphere Annular Mode (NAM), also referred to as the Arctic Oscillation (AO), is the leading mode of wintertime variability of sea level pressure over the extratropical region of the Northern Hemisphere. It is well accepted that the AO/NAM is mainly associated with the extratropical planetary wave process, and the wave-mean flow interactions govern spatiotemporal behaviors of the AO/NAM. In the troposphere, the AO/NAM fluctuates on a time scale of 10–20 days and is associated with the interaction of the baroclinic wave and zonal flow, while on a time scale of 30–60 days, the fluctuation is associated with the interaction of the quasi-stationary planetary wave and zonal flow in the stratosphere. The tropospheric centers of wave-mean flow interaction are situated at two jets over the North Atlantic and the North Pacific and are represented by the NAO and the PNA. Another stratospheric center over the Arctic is the polar vortex, which is affected by upwardly propagating quasi-stationary waves. The local wave-flow interactions at these three intensive centers of action together can explain the variations of the AO/NAM index to a large extent.
Based on the results of prior research, this paper focused on analyzing the abnormal AO/NAM indices during the winters of 2007/08 and 2009/10, when exceptionally serious snow calamities occurred in the south and north of China, respectively. The objective of this study was to examine the local wave-mean flow interaction at AO/NAM’s different centers of action to interpret the volatility of the AO/NAM index. Schematic depictions of the key features of the two comparative winters appear in Figure 15. The conclusions are as follows:

Figure 15.
Schematic diagrams depicting the key features of (a) the winter of 2007/08 and (b) the winter of 2009/2010. The thick black contours are for the total flow, with the northern (southern) contour corresponding to ≈305 K (≈315 K), and the blue (orange) shading area is the warm and cold air in the north Atlantic corresponding to anomalies, the same as in the work of Benedict et al. [6]. The purple arrow denotes the 200-hPa zonal wind in the north Pacific. The thick, green line is the contour where the SST anomaly (SSTA) is equal to 0 °C. The blue (red) shading area in the polar region denotes negative (positive) geopotential height anomalies at level 10 hPa, corresponding to a positive (negative) SPV index. The four black frames are those used to define the PNA index. The snowflake symbol represents the cold and snowy weather.
(1) During the winter of 2007/08, there were both cyclonic and anticyclonic synoptic waves breaking in the North Atlantic. Synoptic-scale waves developed in North America and migrated rapidly across the North Atlantic. As a result, there were anomalous vibrations of the AO/NAM index on the time scale of 10–20 days. We highlighted a positive-phase event from 14 January to 3 February 2008. On the other hand, the AO/NAM index on the time scale of 30–60 days was consistent with the polar vortex index of the same time scale in the stratosphere. The upward and poleward refraction of planetary waves into the stratosphere over the high latitudes of the Northern Hemisphere was weak, such that the stratospheric polar vortex began to strengthen in December 2007 and remained strong in January and February of 2008. In the 2007/08 winter, a La Niña occurred in the tropical Pacific, leading to a negative PNA over the North Pacific Ocean and the North American continent, and the North Pacific jet exhibited a pronounced north-shift. This caused the polar waveguide to be weakened; thus, the polar vortex was strong. Consequently, the winter mean AO/NAM index was positive.
(2) During the 2009/10 winter, cyclonic synoptic wave breaking was prominent in the North Atlantic, and the flow characteristics were strikingly similar to the blocks, which caused the AO/NAM index to stay negative during the winter. We focus on a negative-phase event that occurred between 24 December 2009, and 13 January 2010. On the other hand, the AO/NAM index on the time scale of 30–60 days was consistent with the polar vortex index on the same time scale in the stratosphere. The upward and poleward refraction of planetary waves into the stratosphere over high latitudes in the Northern Hemisphere was so strong that the stratospheric polar vortex was weaker. In the 2009/10 winter, an El Niño occurred in the tropical Pacific, leading to a negative PNA over the North Pacific Ocean and the North American continent, and the North Pacific jet exhibited a pronounced south-shift. This caused the polar waveguide to be strengthened; thus, the polar vortex was very weak. Consequently, the winter mean AO/NAM index was negative with a high absolute value.
Author Contributions
Conceptualization, S.L and Y.L.; methodology, S.L.; formal analysis, S.L.; writing—original draft preparation, S.L.; writing—review and editing, Y.L. and Y.D. All authors have read and agreed to the published version of the manuscript.
Funding
This research was funded by the National Natural Science Foundation of China (Grant No. 41790471) and the Fund of Tianjin Meteorological Administration (Grant No. 202016ybxm07).
Institutional Review Board Statement
Not applicable.
Informed Consent Statement
Not applicable.
Data Availability Statement
The datasets generated and analyzed during the current study are not publicly available but are available from the corresponding author on reasonable request.
Acknowledgments
The authors thank the anonymous reviewers for their useful comments.
Conflicts of Interest
The authors declare no conflict of interest.
References
- Thompson, D.W.J.; Wallace, J.M. The Arctic Oscillation signature in the wintertime geopotential height and temperature fields. Geophys. Res. Lett. 1998, 25, 1297–1300. [Google Scholar] [CrossRef]
- Limpasuvan, V.; Hartmann, D.L. Eddies and the annular modes of climate variability. Geophys. Res. Lett. 1999, 26, 3133–3136. [Google Scholar] [CrossRef]
- Wallace, J.M. North Atlantic Oscillation/Annular Mode: Two Paradigms—One Phenomenon. Q. J. R. Meteorol. Soc. 2000, 126, 791–805. [Google Scholar] [CrossRef]
- Wallace, J.M. On the Arctic and Antarctic Oscillation; NCAR Summer Colloquium Lecture Notes. 2000. Available online: http://research.jisao.washington.edu/wallace/ncar_notes/#3Perspectives (accessed on 16 February 2023).
- Wallace, J.M.; Thompson, D.W.J. The Pacific Center of Action of the Northern Hemisphere Annular Mode: Real or Artifact? J. Clim. 2002, 15, 1987–1991. [Google Scholar] [CrossRef]
- Benedict, J.J.; Lee, S.; Feldstein, S.B. Synoptic view of the North Atlantic Oscillation. J. Atmos. Sci. 2004, 61, 121–144. [Google Scholar] [CrossRef]
- Feldstein, S.B. The dynamics of NAO teleconnection pattern growth and decay. Q. J. R. Meteorol. Soc. 2003, 129, 901–924. [Google Scholar] [CrossRef]
- Franzke, C.; Lee, S.; Feldstein, S.B. Is the North Atlantic Oscillation a Breaking Wave? J. Atmos. Sci. 2004, 61, 145–160. [Google Scholar] [CrossRef]
- Feldstein, S.B.; Franzke, C. Are the North Atlantic Oscillation and the Northern Annular Mode Distinguishable? J. Atmos. Sci. 2006, 63, 2915–2930. [Google Scholar] [CrossRef]
- Riviere, G.; Orlanski, I. Characteristics of the Atlantic Storm-Track Eddy Activity and Its Relation with the North Atlantic Oscillation. J. Atmos. Sci. 2007, 64, 241–266. [Google Scholar] [CrossRef]
- Thompson, D.W.J.; Lee, S.; Baldwin, M.P. Atmospheric Processes Governing the Northern Hemisphere Annular Mode/North Atlantic Oscillation. Geophys. Monogr. 2003, 134, 81–112. [Google Scholar]
- Kunz, T.; Fraedrich, K.; Lunkeit, F. Impact of Synoptic-Scale Wave Breaking on the NAO and Its Connection with the Stratosphere in ERA-40. J. Clim. 2009, 22, 5464–5480. [Google Scholar] [CrossRef]
- Baldwin, M.P.; Dunkerton, T.J. Propagation of the Arctic Oscillation from the stratosphere to the troposphere. J. Geophys. Res. 1999, 104, 937–946. [Google Scholar] [CrossRef]
- Baldwin, M.P.; Dunkerton, T.J. Stratospheric harbingers of anomalous weather regimes. Science 2001, 294, 581–584. [Google Scholar] [CrossRef]
- Baldwin, M.; Stephenson, D.; Thompson, D.; Dunkerton, T.; Charlton, A.; O’Neill, A. Stratospheric memory and skill of extended-range weather forecasts. Science 2003, 301, 636–640. [Google Scholar] [CrossRef] [PubMed]
- Baldwin, M.P.; Thompson, D.W.; Shuckburgh, E.F.; Norton, W.A.; Gillett, N.P. Weather from the Stratosphere? Science 2003, 301, 317–318. [Google Scholar] [CrossRef] [PubMed]
- Lubis, S.W.; Huang, C.S.; Nakamura, N.; Omrani, N.E.; Jucker, M. Role of Finite-Amplitude Rossby Waves and Nonconservative Processes in Downward Migration of Extratropical Flow Anomalies. J. Atmos. Sci. 2018, 75, 1385–1401. [Google Scholar] [CrossRef]
- Lubis, S.W.; Huang, C.S.Y.; Nakamura, N. Role of Finite-Amplitude Eddies and Mixing in the Life Cycle of Stratospheric Sudden Warmings. J. Atmos. Sci. 2018, 75, 3987–4003. [Google Scholar] [CrossRef]
- Nakamura, N.; Falk, J.; Lubis, S.W. Why Are Stratospheric Sudden Warmings Sudden (and Intermittent)? J. Atmos. Sci. 2020, 77, 943–964. [Google Scholar] [CrossRef]
- Chen, W.; Graf, H.F.; Takahashi, M. Observed interannual oscillation of planetary wave forcing in the Northern Hemisphere winter. Geophys. Res. Lett. 2002, 29, 2073. [Google Scholar] [CrossRef]
- Chen, W.; Takahashi, M.; Graf, H.F. Interannual variations of stationary planetary wave activity in the northern winter troposphere and stratosphere and their relations to NAM and SST. J. Geophys. Res. 2003, 108, 4797. [Google Scholar] [CrossRef]
- Lu, Y.; Tian, W.; Zhang, J.; Huang, J.; Zhang, R.; Wang, T.; Xu, M. The Impact of the Stratospheric Polar Vortex Shift on the Arctic Oscillation. J. Clim. 2021, 34, 4129–4143. [Google Scholar] [CrossRef]
- Zhang, R.; Fang, J.; Yang, X. What Kinds of Atmospheric Anomalies Drive Wintertime North Pacific Basin-Scale Subtropical Oceanic Front Intensity Variation? J. Clim. 2020, 33, 7011–7026. [Google Scholar] [CrossRef]
- Seager, R.; Harnik, N.; Kushnir, Y.; Robinson, W.; Miller, J. Mechanisms of Hemispherically Symmetric Climate Variability. J. Clim. 2003, 16, 2960–2978. [Google Scholar] [CrossRef]
- L’Heureux, M.L.; Thompson, D.W.J. Observed Relationships between the El Niño–Southern Oscillation and the Extratropical Zonal-Mean Circulation. J. Clim. 2006, 19, 276–287. [Google Scholar] [CrossRef]
- Derome, J.; Lin, H.; Brunet, G. Seasonal Forecasting with a Simple General Circulation Model: Predictive Skill in the AO and PNA. J. Clim. 2005, 18, 597–609. [Google Scholar] [CrossRef]
- Griffiths, M.L.; Bradley, R.S. Variations of Twentieth-Century Temperature and Precipitation Extreme Indicators in the Northeast United States. J. Clim. 2007, 20, 5401–5417. [Google Scholar] [CrossRef]
- Lubis, S.W.; Matthes, K.; Omrani, N.E.; Harnik, N.; Wahl, S. Influence of the Quasi-Biennial Oscillation and Sea Surface Temperature Variability on Downward Wave Coupling in the Northern Hemisphere. J. Atmos. Sci. 2016, 73, 1943–1965. [Google Scholar] [CrossRef]
- Richter, J.H.; Matthes, K.; Calvo, N.; Gray, L.J. Influence of the quasi-biennial oscillation and El Nino–Southern Oscillation on the frequency of sudden stratospheric warmings. J. Geophys. Res. 2011, 116, D20111. [Google Scholar] [CrossRef]
- Zhao, N.; Liang, S.; Ding, Y. Coupling Modes among Action Centers of Wave-mean Flow Interaction and Their Association with the AO/NAM. J. Clim. 2012, 25, 447–458. [Google Scholar] [CrossRef]
- Zhao, N.; Liang, S.; Ding, Y. Underlying Low-Order Dynamics of Nonlinear Interaction among Northern Hemisphere Teleconnection Patterns and Its Association with the AO/NAM. J. Clim. 2014, 27, 1315–1335. [Google Scholar]
- Gong, H.; Wang, L.; Chen, W.; Wu, R.; Zhou, W.; Liu, L.; Nath, D.; Lan, X. Diversity of the Wintertime Arctic Oscillation Pattern among CMIP5 Models: Role of the Stratospheric Polar Vortex. J. Clim. 2019, 32, 5235–5250. [Google Scholar] [CrossRef]
- Zhang, R.; Tian, W.; Zhang, J.; Huang, J.; Xie, F.; Xu, M. The Corresponding Tropospheric Environments during Downward-Extending and Nondownward-Extending Events of Stratospheric Northern Annular Mode Anomalies. J. Clim. 2019, 32, 1857–1873. [Google Scholar] [CrossRef]
- Schubert, S.D.; Chang, Y.; DeAngelis, A.M.; Koster, R.D.; Lim, Y.K.; Wang, H. Exceptional Warmth in the Northern Hemisphere during January–March of 2020: The Roles of Unforced and Forced Modes of Atmospheric Variability. J. Clim. 2022, 35, 2565–2584. [Google Scholar] [CrossRef]
- Cohen, J.; Foster, J.; Barlow, M.; Saito, K.; Jones, J. Winter 2009–2010: A case study of an extreme Arctic Oscillation event. Geophys. Res. Lett. 2010, 37, L17707. [Google Scholar] [CrossRef]
- Buchan, J.; Hirschi, J.J.; Blaker, A.T.; Sinha, B. North Atlantic SST Anomalies and the Cold North European Weather Events of Winter 2009/10 and December 2010. Mon. Weather. Rev. 2014, 142, 922–932. [Google Scholar] [CrossRef]
- Fereday, D.R.; Maidens, A.; Arribas, A.; Scaife, A.; Knight, J.R. Seasonal forecasts of Northern Hemisphere winter 2009/10. Environ. Res. Lett. 2012, 7, 034031. [Google Scholar] [CrossRef]
- Bai, X.; Wang, J.; Liu, Q.; Wang, D.; Liu, Y. Severe Ice Conditions in the Bohai Sea, China, and Mild Ice Conditions in the Great Lakes during the 2009/10 Winter: Links to El Niño and a Strong Negative Arctic Oscillation. J. Appl. Meteorol. Climatol. 2011, 50, 1922–1935. [Google Scholar] [CrossRef]
- Hong, C.; Li, T. The Extreme Cold Anomaly over Southeast Asia in February 2008: Roles of ISO and ENSO. J. Clim. 2009, 22, 3786–3801. [Google Scholar] [CrossRef]
- Bao, Q.; Yang, J.; Liu, Y.; Wu, G.; Wang, B. Roles of Anomalous Tibetan Plateau Warming on the Severe 2008 Winter Storm in Central-Southern China. Mon. Weather. Rev. 2010, 138, 2375–2384. [Google Scholar] [CrossRef]
- Wen, M.; Yang, S.; Kumar, A.; Zhang, P. An Analysis of the Large-Scale Climate Anomalies Associated with the Snowstorms Affecting China in January 2008. Mon. Weather. Rev. 2009, 137, 1111–1131. [Google Scholar] [CrossRef]
- Torrence, C.; Compo, G.P. A practical guide to wavelet analysis. Bull. Amer. Meteor. Soc. 1998, 79, 61–78. [Google Scholar] [CrossRef]
- Grinsted, A.; Moore, J.C.; Jevrejeva, S. Application of the cross wavelet transform and wavelet coherence to geophysical time series. Nonlin. Process. Geophys. 2004, 11, 561–566. [Google Scholar] [CrossRef]
- Edmon, H.J., Jr.; Hoskins, B.; McIntyre, M.E. Eliassen-Palm cross sections for the troposphere. J. Atmos. Sci. 1980, 37, 2600–2616. [Google Scholar] [CrossRef]
- Plumb, R.A. On the three-dimensional propagation of stationary waves. J. Atmos. Sci. 1985, 42, 217–229. [Google Scholar] [CrossRef]
- Shukla, J.; Wallace, J.M. Numerical Simulation of the Atmospheric Response to Equatorial Pacific Sea Surface Temperature Anomalies. J. Atmos. Sci. 1983, 40, 1613–1630. [Google Scholar] [CrossRef]
- Wallace, J.M.; Gutzler, D.S. Teleconnections in the geopotential height field during the Northern Hemisphere winter. Mon. Weather. Rev. 1981, 109, 784–812. [Google Scholar] [CrossRef]
Disclaimer/Publisher’s Note: The statements, opinions and data contained in all publications are solely those of the individual author(s) and contributor(s) and not of MDPI and/or the editor(s). MDPI and/or the editor(s) disclaim responsibility for any injury to people or property resulting from any ideas, methods, instructions or products referred to in the content. |
© 2023 by the authors. Licensee MDPI, Basel, Switzerland. This article is an open access article distributed under the terms and conditions of the Creative Commons Attribution (CC BY) license (https://creativecommons.org/licenses/by/4.0/).