Review

Knowledge Map of Climate Change and Transportation: A Bibliometric Analysis Based on CiteSpace

1
Department of Civil Engineering, Faculty of Engineering, University Putra Malaysia (UPM), Serdang 43400, Malaysia
2
Airport College, Binzhou University, Binzhou 256603, China
*
Author to whom correspondence should be addressed.
Atmosphere 2023, 14(3), 434; https://doi.org/10.3390/atmos14030434
Submission received: 19 January 2023 / Revised: 8 February 2023 / Accepted: 19 February 2023 / Published: 22 February 2023
(This article belongs to the Section Climatology)

Abstract

:
Climate change has become one of the leading problems around the world. The transport sector is one of the major contributors to climate change. At the same time, climate change is also affecting transportation facilities and travel behaviour. This study proposed a bibliometric approach to explore the structure evolution development trends of this knowledge domain with a broader search scope and more objective results compared with a manual review. A total of 4073 peer-reviewed articles were collected from the WoS core collection database to conduct scientometric analysis. The collaboration analysis shows that the US, China, and European countries dominate this field, and international organisations’ and government agencies’ reports on climate change form the basis of this research field. A total of 14 co-citation clusters were identified, and the research on climate change and transportation primarily focused on the topics of policy options, travel behaviour, the COVID-19 lockdown, environmental cost, and air quality. Keyword co-occurrence evolution analysis was also conducted to track the latest research trends. Based on the results, we propose trends in four areas for future research. This study provides a holistic knowledge map for climate change and transportation research’s past, present, and future.

1. Introduction

Climate change, commonly referred to as global warming, refers to a range of physical phenomena [1]. The impacts of climate change on the world are multifaceted [2]; therefore, climate change has become a hotspot of interdisciplinary research [3]. Human activity, which produces core GHGs, is the main driver of climate change [4]. As one of the major human activities, the transportation sector is a significant contributor to climate change [5]. Meanwhile, the transportation infrastructure and activities are also threatened by extreme weather caused by climate change [6]. Scholars have been primarily concerned with reducing the impact of transportation systems on climate change in early studies [7]. As scholars recognise that climate change is an irreversible process, their research interests have shifted from mitigation to adaptation [8]. Since climate change is a global threat, most transportation policies ultimately lead to addressing climate change to achieve sustainable transportation. Despite commitments from most countries, carbon emissions are still to reduce. Meanwhile, with global climate change, transportation infrastructure operations are severely threatened and challenged. The interdisciplinary study of the climate and transportation is increasingly diverse, and the amount of the relevant literature is proliferating.
Against this background, several studies have been conducted to review the research topics and methods in the climate change and transportation field. Based on the interdisciplinary nature of climate change and transportation research, various angles have been presented in these reviews, including emissions assessment and management in transportation [9]; urban transportation planning [10]; criteria and measurement [11]; mass public transportation in climate change mitigation [12]; and methodologies [13,14]. However, most of these reviews are expert-dependent, while focusing on a single topic in this field of study, leading to a lack of quantitative bibliometric analysis. Although there are increasing numbers of publications in this field, little is known about the overall structure of the knowledge landscape.
Scientometrics was defined by Nalimov and Mulʹchenko (1971) [15] as “the quantitative methods of the research on the development of science as an informational process.” It can be used to map knowledge structure and predict emerging trends in a research field with the analysis of citations in the academic literature. Various visualisation tools, such as CiteSpace [16], VOSviewer [17], and Histcite [18], have been widely used in scientometrics in the process of charting, mining, analysing, and displaying knowledge. Compared with other visualisation tools, we found that Citespace, which can conduct bibliometric analysis, data mining algorithms, and visualisation [19], was the most used.
Despite the popularity of knowledge domain mapping, there are still no studies, to the best of our knowledge, analysing the expanding climate change and transportation literature. With the extensive investigation of a field of study, it is necessary to conduct a systematic analysis that provides current conditions and potential future trends. In order to fully reveal the structure of the climate and transportation knowledge domain and provide reliable predictions of the research trend, we designed the present study to analyse the research in this field. This study attempts to conduct a scientometric review based on the bibliographic records in the Web of Science (WoS) core collection database, which can provide researchers with a clear knowledge structure and reliable predictions of the climate change and transportation research field. Moreover, this review also provides a structured reference for policymakers.
The remainder of this paper is organised as follows. Section 2 describes the data collection and research framework. Section 3 presents the analysis results. In Section 4, we propose the future research trend based on the findings in Section 3. Finally, we summarise the key findings and demonstrate the broad applicability of this work.

2. Materials and Methods

In order to ensure the representativeness and accessibility of the data, we selected the WoS Core Collection database as the data source, which includes the Science Citation Index Expanded (SCI-E), Social Science Citation Index (SSCI), Arts & Humanities Citation Index (A&HCI), Conference Proceedings Citation Index—Science (CPCI-S), Conference Proceedings Citation Index—Social Science & Humanities (CPCI-SSH), Emerging Sources Citation Index (ESCI), and Current Chemical Reactions (CCR). The WoS is a specialised database covering more than 12,000 leading journals, which has been the traditional source for most scientometric studies [20]. As can be seen from Table 1, the bibliographic retrieval formula in this study was as follows: TS = (climate change) and TS = (transportation). The retrieval timespan was unlimited (1900 to present), and the retrieval date was 20 September 2022. In total, 4787 papers were found in the initial topic search. After filtering out proceedings papers and notes and non-English publications, the number of records was reduced to 4073 original research papers and review papers.
Knowledge mapping, utilised in this study, is a widely used analysis method in scientometrics. By using analysis tools, such as CiteSpace [16], VOSviewer [17], and Histcite [18], the knowledge structure of a research domain can be visually presented. Among these tools, CiteSpace is the most widely used, and it is the only one that can provide burst detection, network, temporal, and geospatial analysis in one piece of software [21]. The main purpose of the software is to analyse and illustrate a knowledge domain, which is a broadly defined concept covering a field of study, usually represented by a set of bibliographic records of related publications. Therefore, in this study, CiteSpace was selected to visualise and analyse knowledge maps of the climate change and transportation research domain because of its advanced and powerful functions. As shown in Figure 1, the following three types of bibliometric technique were applied in this study: collaboration analysis, co-citation analysis, and keyword co-occurrence analysis. The main analysis procedures were as follows. First, a collaboration network was generated to explore the potential cooperation. Second, a co-citation was conducted to identify the knowledge structure of this domain. Third, we performed keyword co-occurrence analysis to trace the evolution of hotspots and discover current research hotspots. Finally, based on the above analysis results, we proposed future research directions in the climate change and transportation research domain.

3. Results

3.1. Collaboration Analysis

Collaboration analysis is an efficient method to explore the collaborative scientific network, including national, institutional and individual cooperation, which is beneficial to detect the productive researchers at the above three levels.

3.1.1. Country/Region Collaboration Network

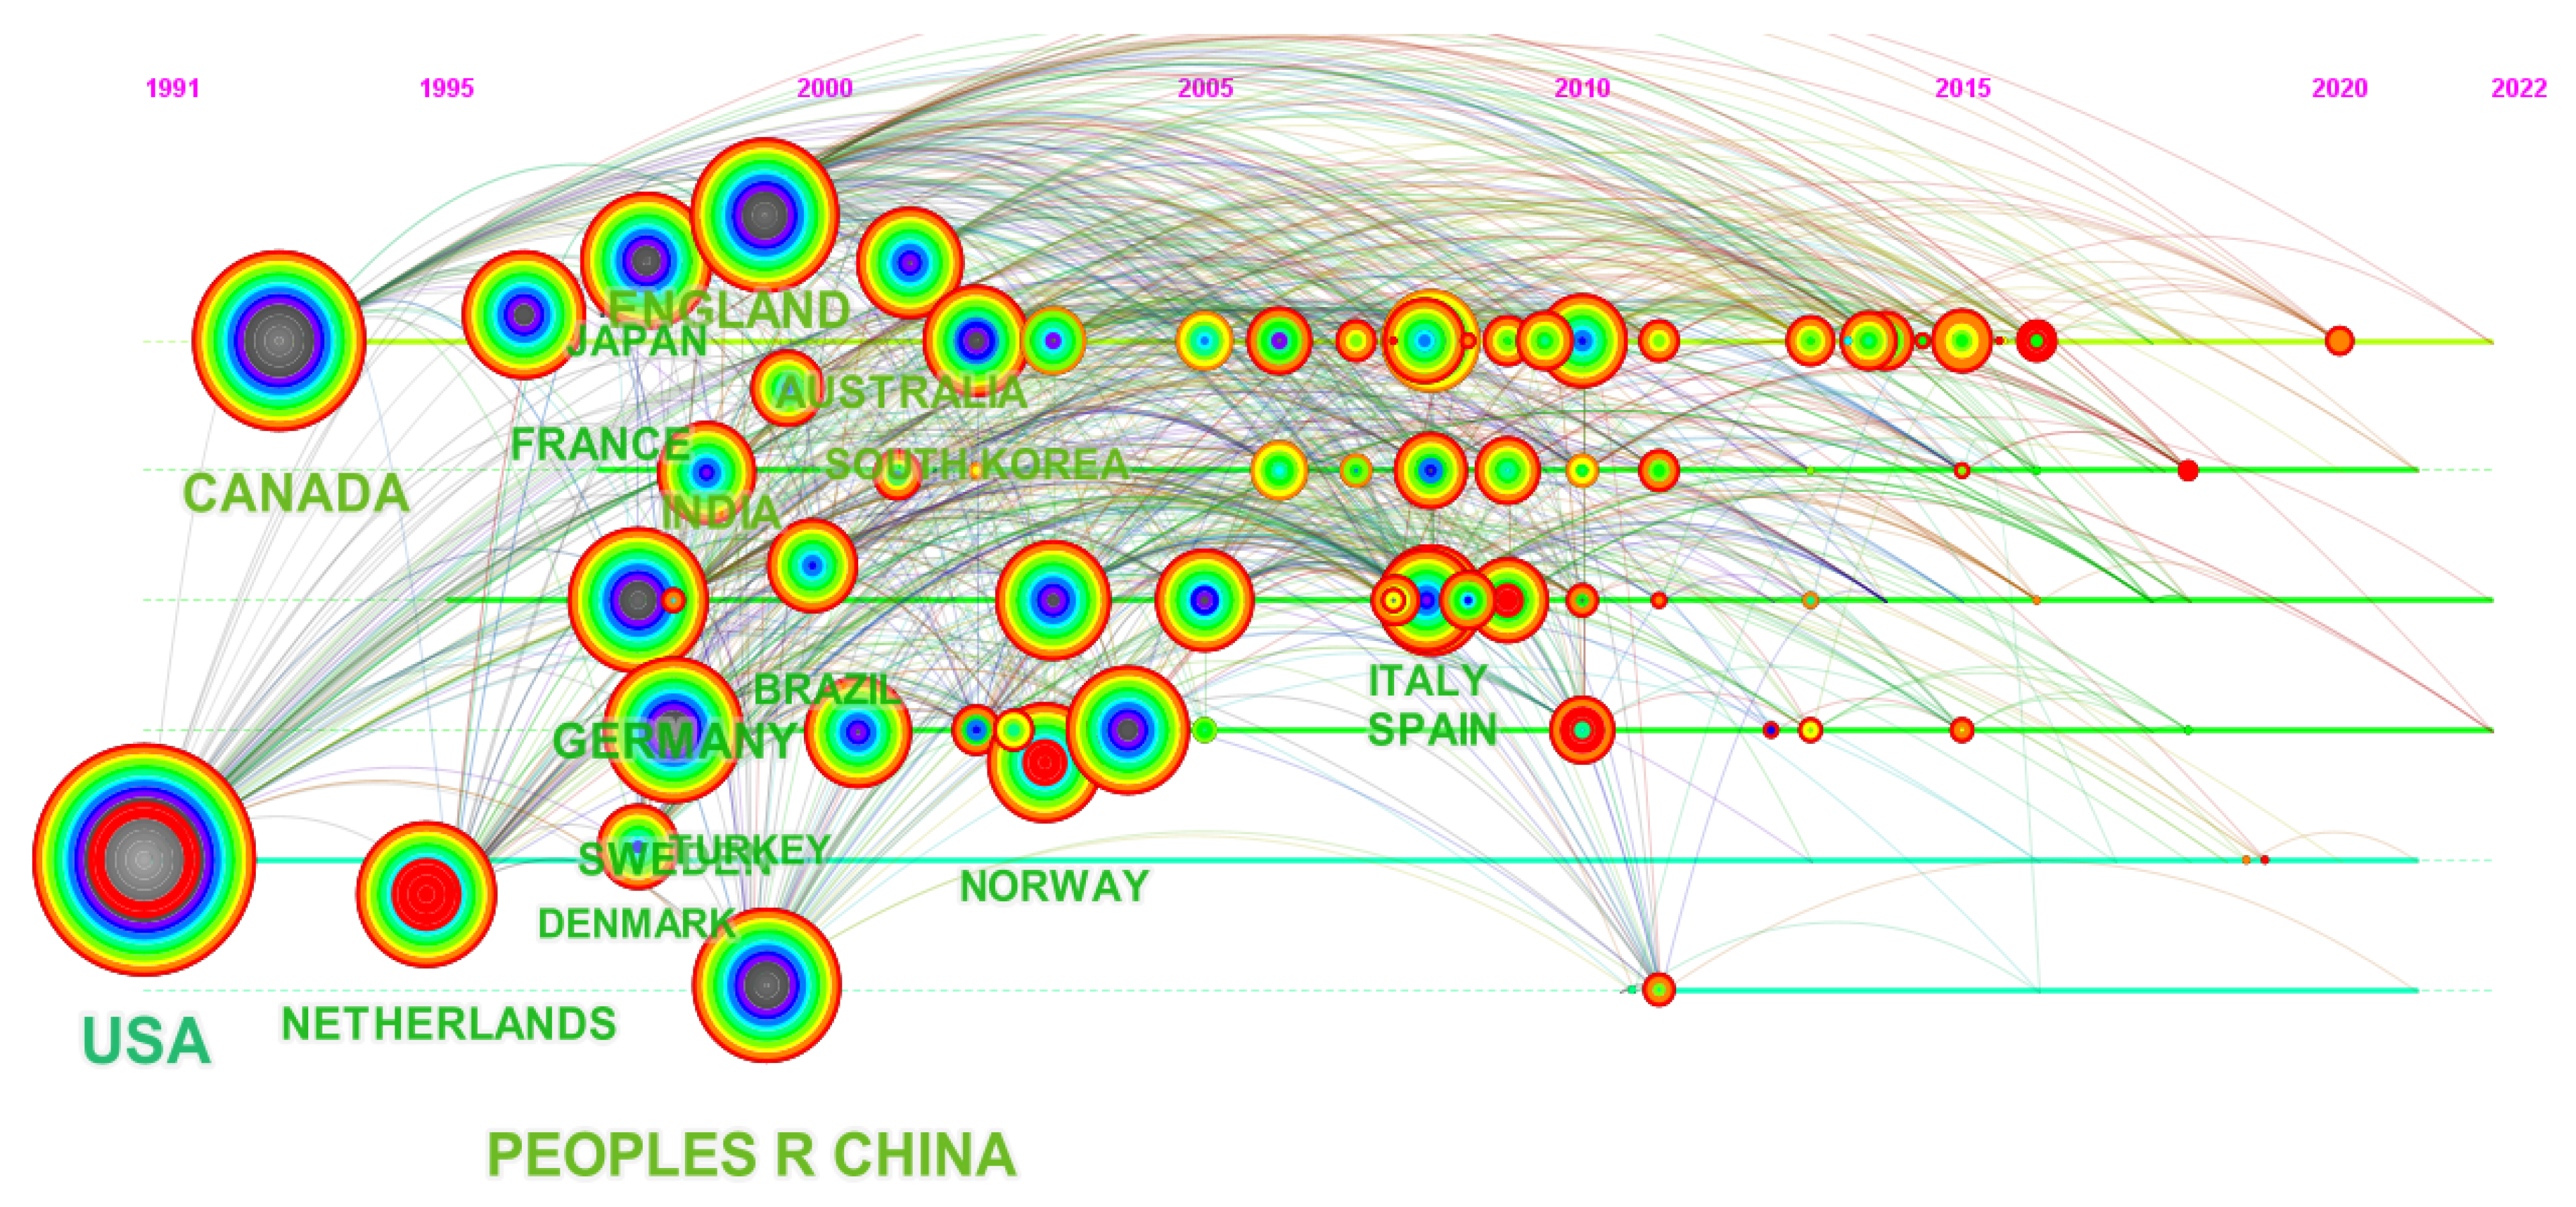
Figure 2 shows the country/region co-authorship network consisting of 126 nodes and 1105 links between 1991 and 2022, and the top 10 countries/regions based on the number of publications and betweenness centralities are also presented in Table 2. According to the paper by Chaomei Chen [19], the developer of CiteSpace, betweenness centrality represents the number of times a node acts as the shortest path between two other nodes, which shows the contribution of a node to establishing connections with other nodes in the network. The colors of the notes represent the time of publication. Early publications are in darker colors, whereas more recent ones are in yellow, orange, and other colors. The lines between the nodes indicate the cooperative relationship between the two countries. At the same time, in order to better show the time when each country started research in this field, a timeline view is shown in Figure 2. The US contributed the largest number of publications (1368) and displayed the highest centrality (0.39), both of which were significantly higher than second-placed China (721) and Germany (0.19). The number of publication records from China, Canada, and the UKC was 721, 345, and 294, respectively. Moreover, the US was the first country to start research in this field, followed by Canada. The start time of research in this field demonstrates a certain regionality. After North America, Western European countries (Netherlands, France, Germany) joined these studies, followed by several large developing countries (China, India, Brazil). In this field of research, the US is, without a doubt, the largest contributor. Developed countries are performing better research on climate change and transportation than developing countries, both in terms of the number of publications and the betweenness centrality. Only two developing countries, China and India, are among the top ten countries by the number of publications, but these two countries have low centrality values.

3.1.2. Institution Collaboration Network

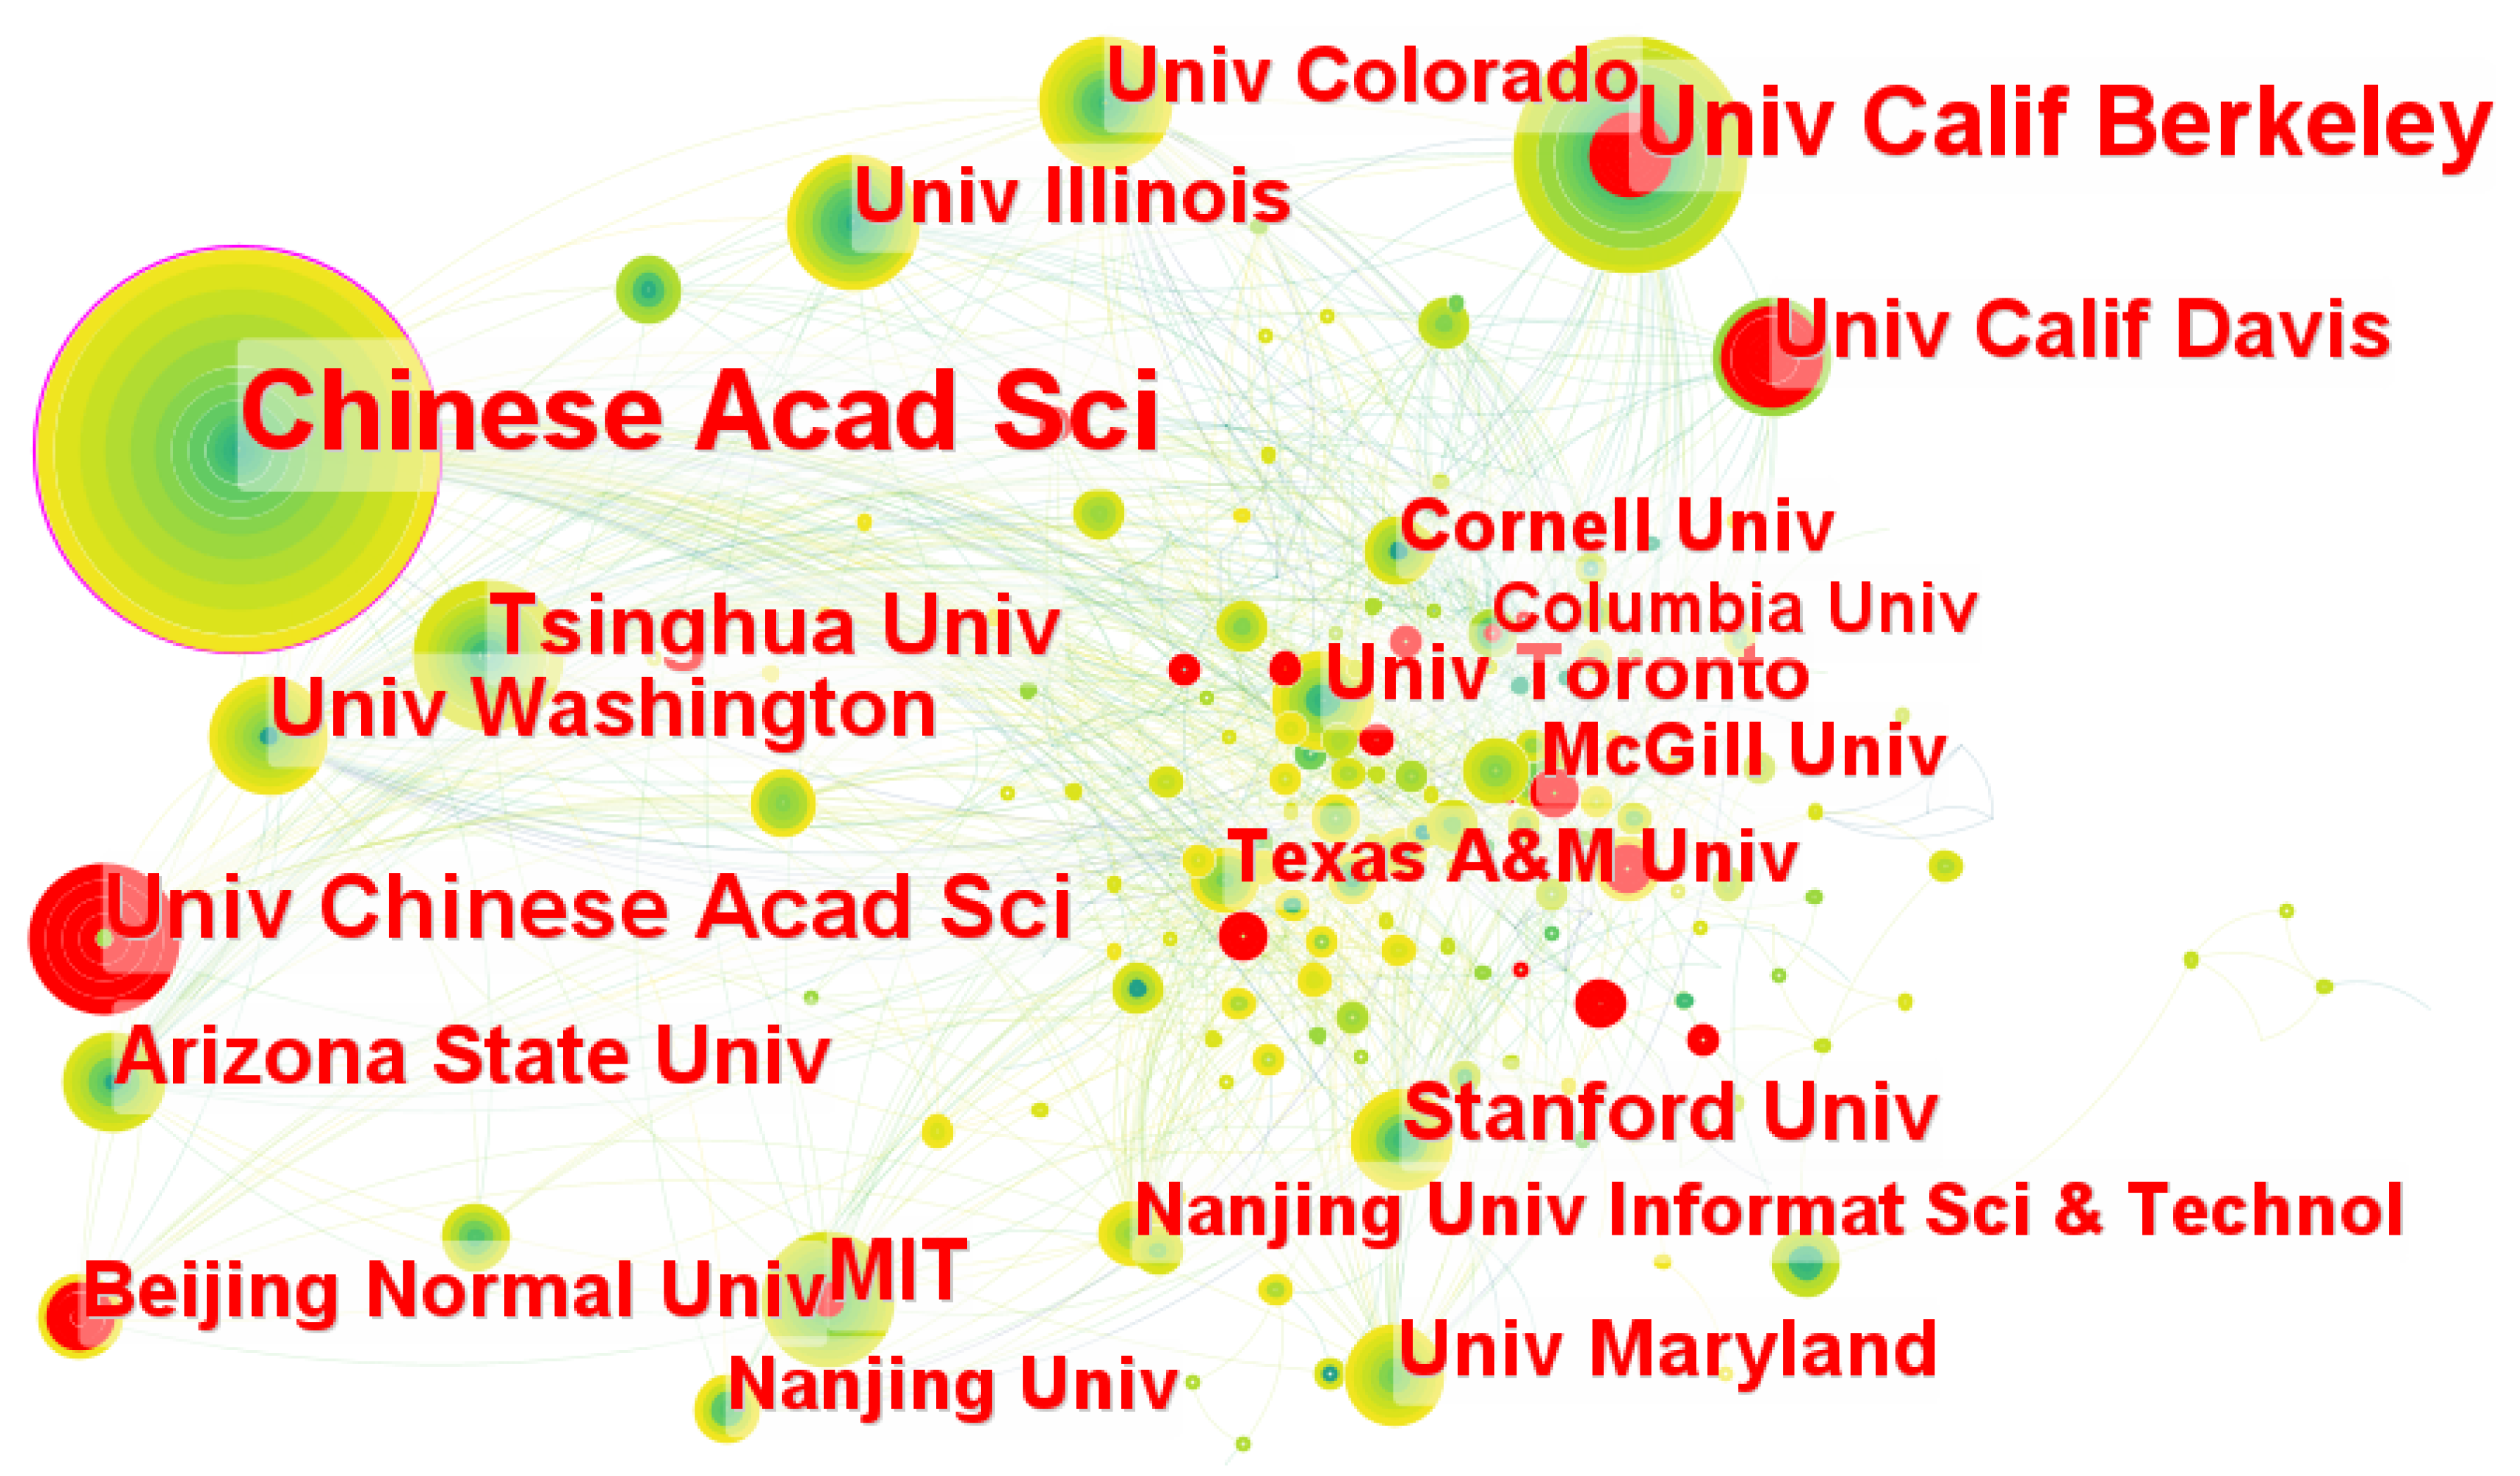
As shown in Figure 3, academic collaborations among institutions consisting of 615 nodes and 1107 links were generated. The nodes represent the number of publications, and the links between the nodes indicate the cooperation between the institutions. The top 10 institutions that contributed the most papers are listed in Table 3, such as the University of Chinese Academy of Social Sciences (161 articles), the University of California, Berkeley (75 articles), Tsinghua University (41 articles), the Massachusetts Institute of Technology (40 articles), Arizona State University (38 articles), the University of Washington (37 articles), Stanford University (35 articles), the University of California, Davis (34 articles), the University of Colorado Boulder (31 articles), and the University Of Illinois (31 articles). Among the top 10 academic institutions, except for two Chinese universities, the rest are all American universities. However, the University of Chinese Academy of Social Sciences from China ranks first in both the number of publications and the centrality. Although there are still some institutions that have not yet established cooperation with other institutions, cooperation between academic institutions in the field of climate change and transportation research has begun to take shape. Red in Figure 3 indicates the citation burst strength. Seventeen academic institutions have had bursts of citations at various times, such as University of California, Davis (10.38), University of California, Berkeley (6.63), and University of Wisconsin (5.74). The recent citation burst of Zhejiang University (3.81) deserves attention.

3.1.3. Author Collaboration Network

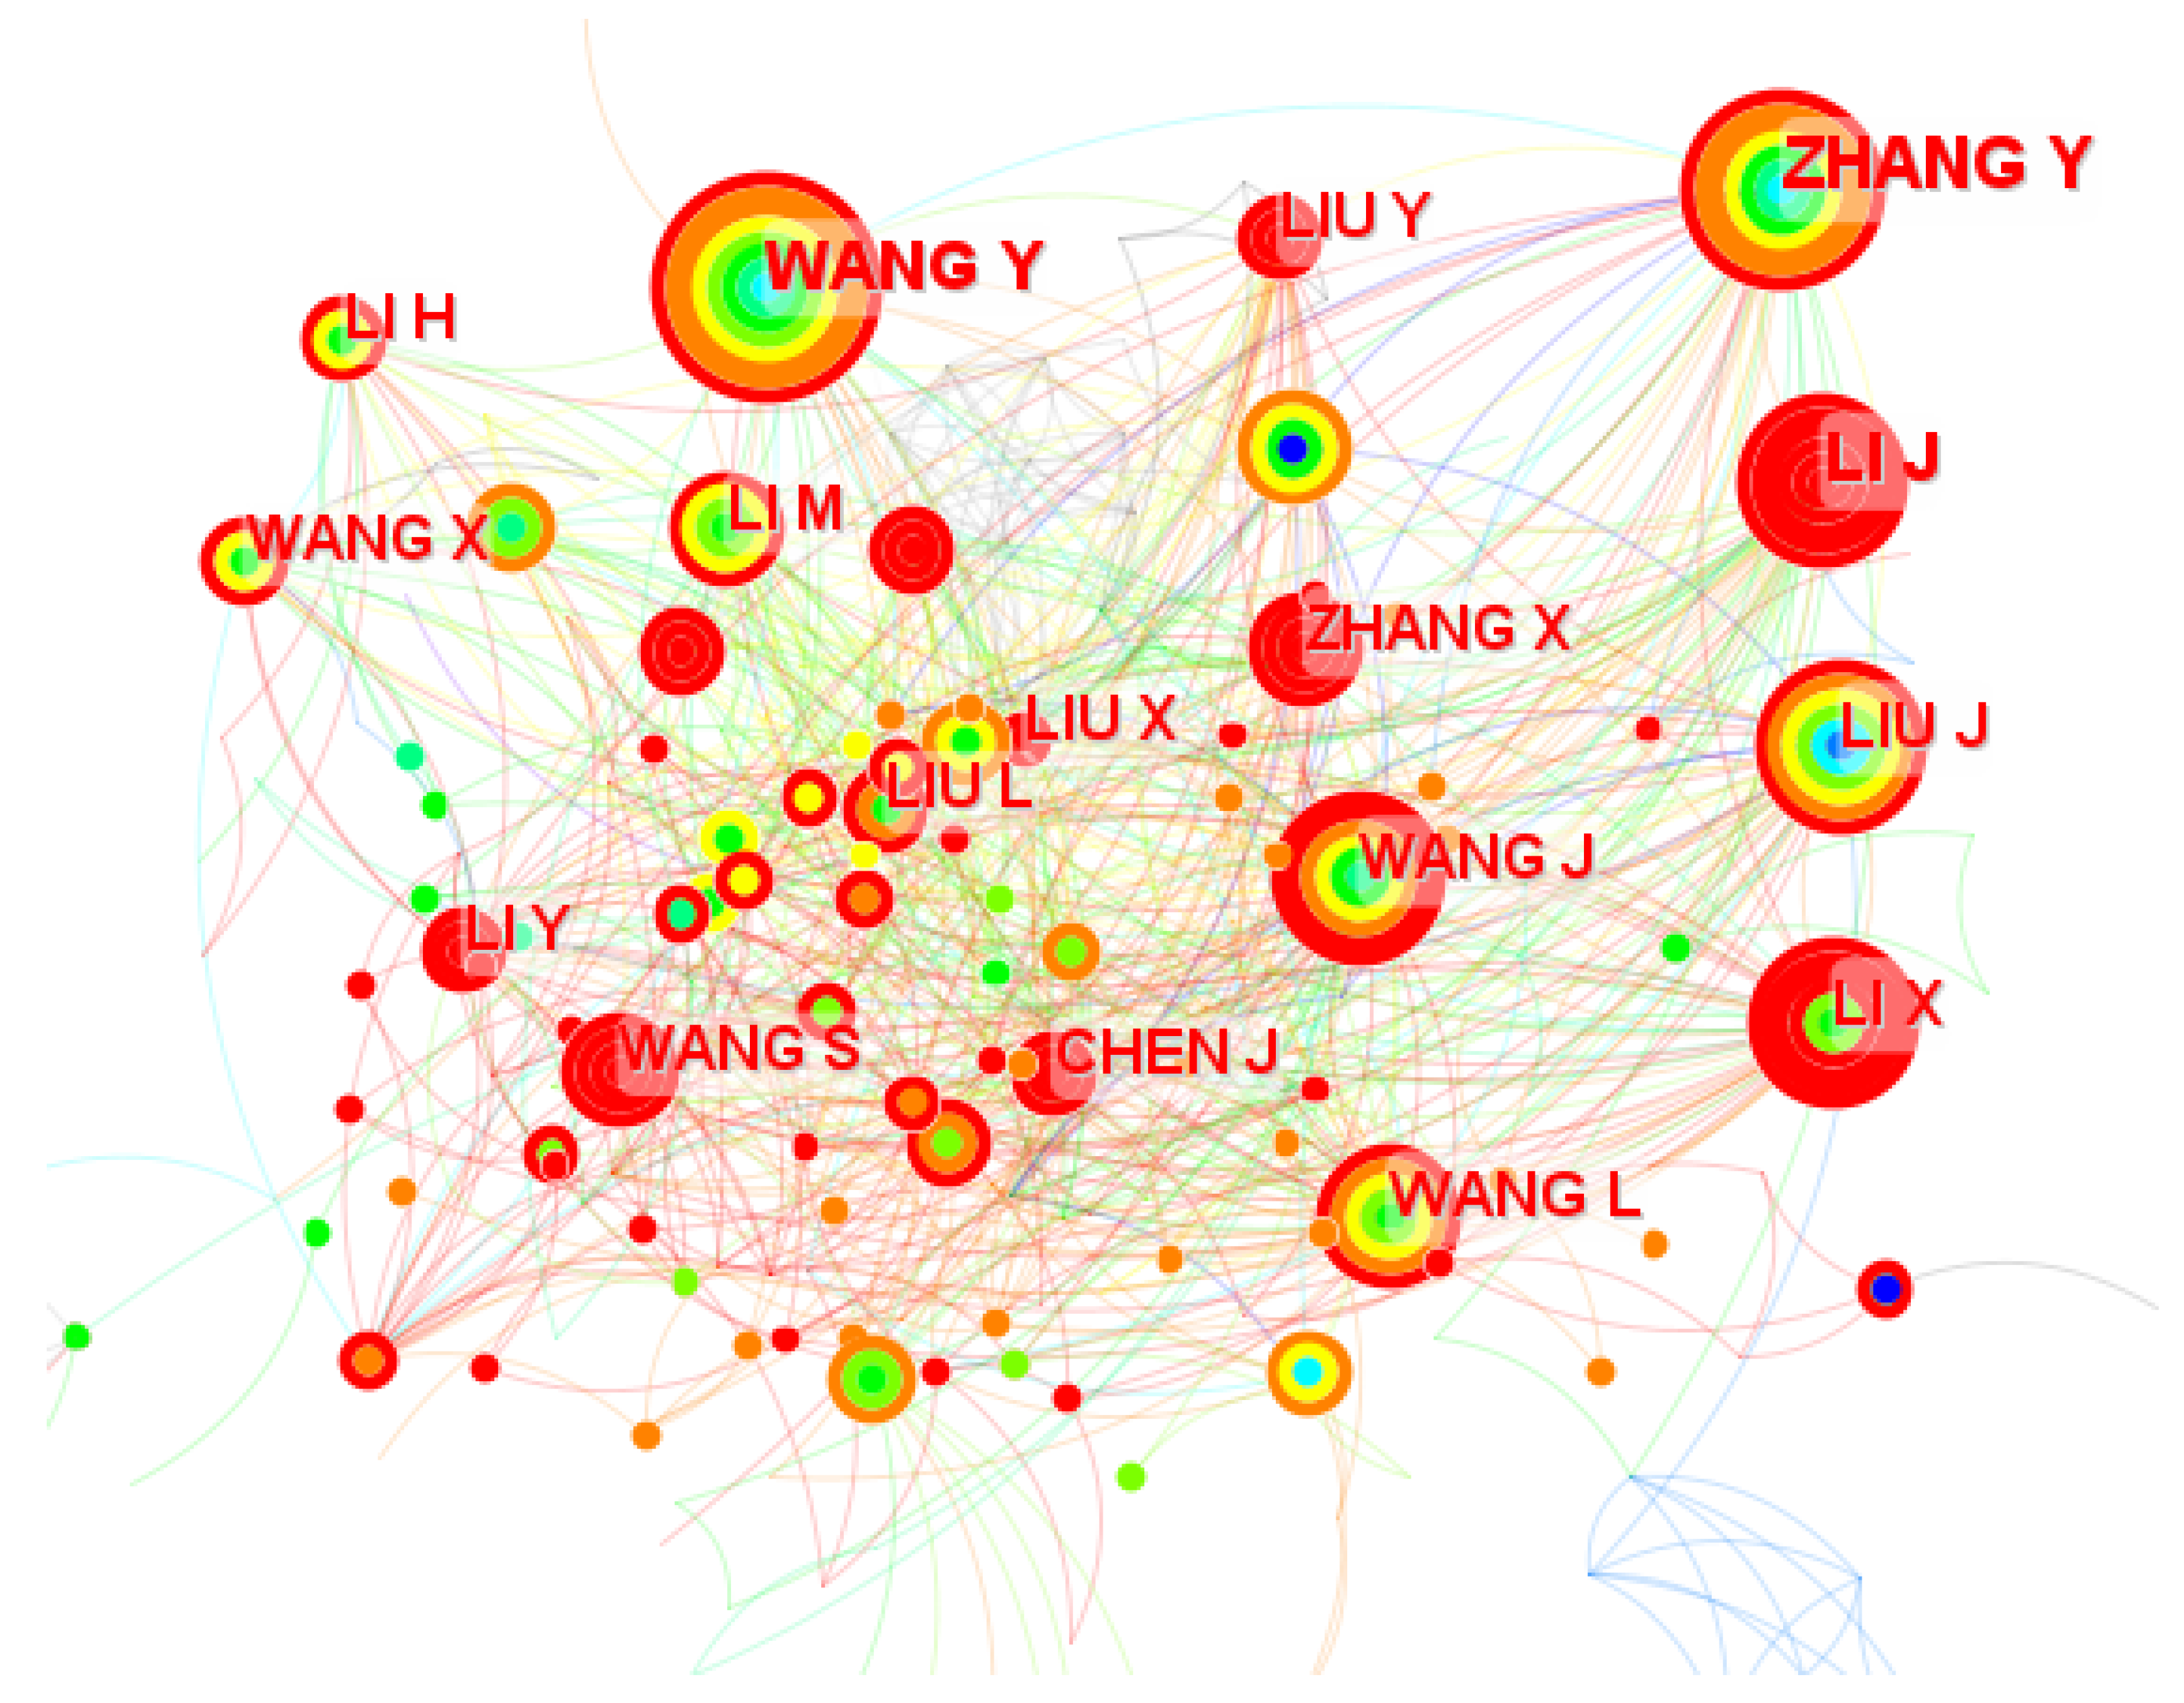
The author collaboration network consisted of 871 notes and 1390 links between 1991 and 2022, as shown in Figure 4. The relative maturity of the research community is indicated according to a certain tightly structured network. The top 10 authors that contributed the most publications are presented in Table 4. The most productive author was Zhang Yan, a scholar at the School of Environment, Beijing Normal University, publishing 35 articles in this field. It is worth noting that the top ten authors of publications in the author cooperation network are all from China. Therefore, Chinese scholars make the greatest contribution to cooperation in the field of transportation and climate change research.

3.2. Co-Citation Analysis

3.2.1. Author Co-Citation Analysis

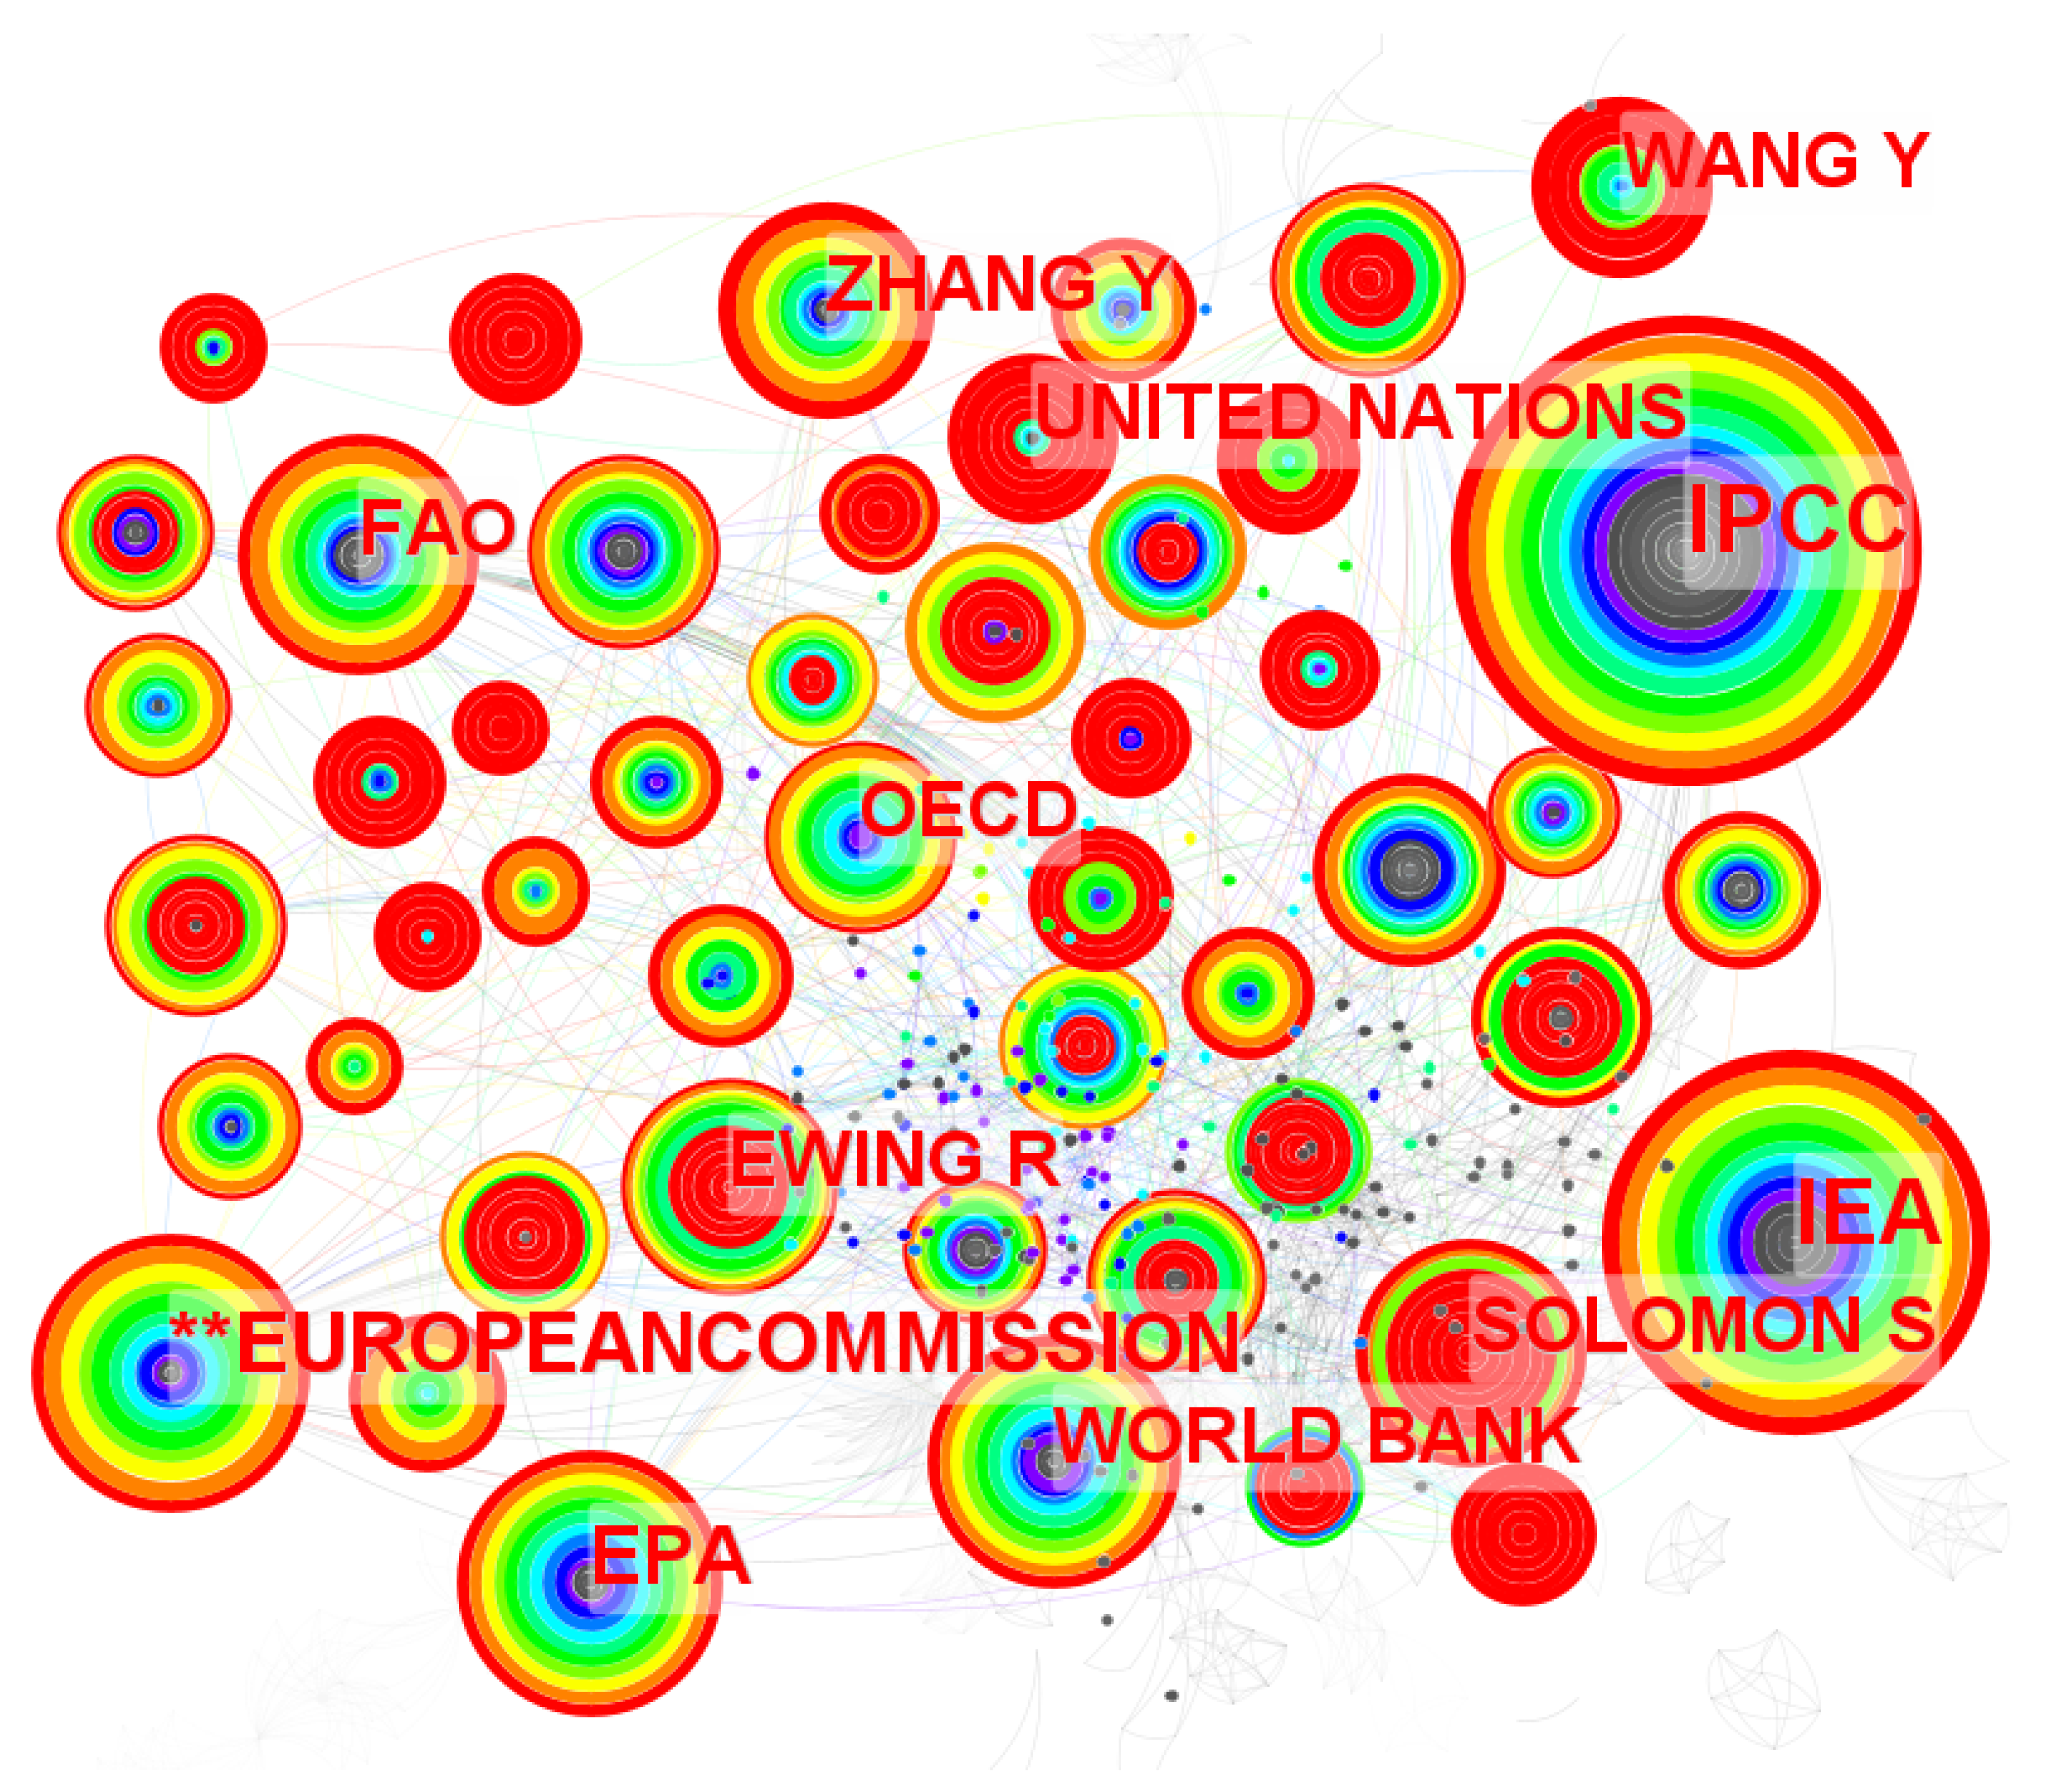
The author co-citation analysis aims to identify frequently cited authors and understand the distribution of their research topics in the climate change and transportation research area. As shown in Figure 5, the merged author co-citation network consisting of 1470 nodes and 8066 co-citation links was generated, where the nodes represent the author’s citation frequency, and the links indicate the co-citation relationship. Therefore, the most highly cited authors were identified, including the IPCC (378), IEA (248), European Commission (160), US EPA (130), World Bank (117), Yi Zhang (115), Susan Solomon (111), FAO (109), the United Nations (102), and Yue Wang (96). Most of the 10 authors are international organisations and government agencies whose reports on climate change form the basis of this research field (Table 5).

3.2.2. Reference Co-Citation Analysis

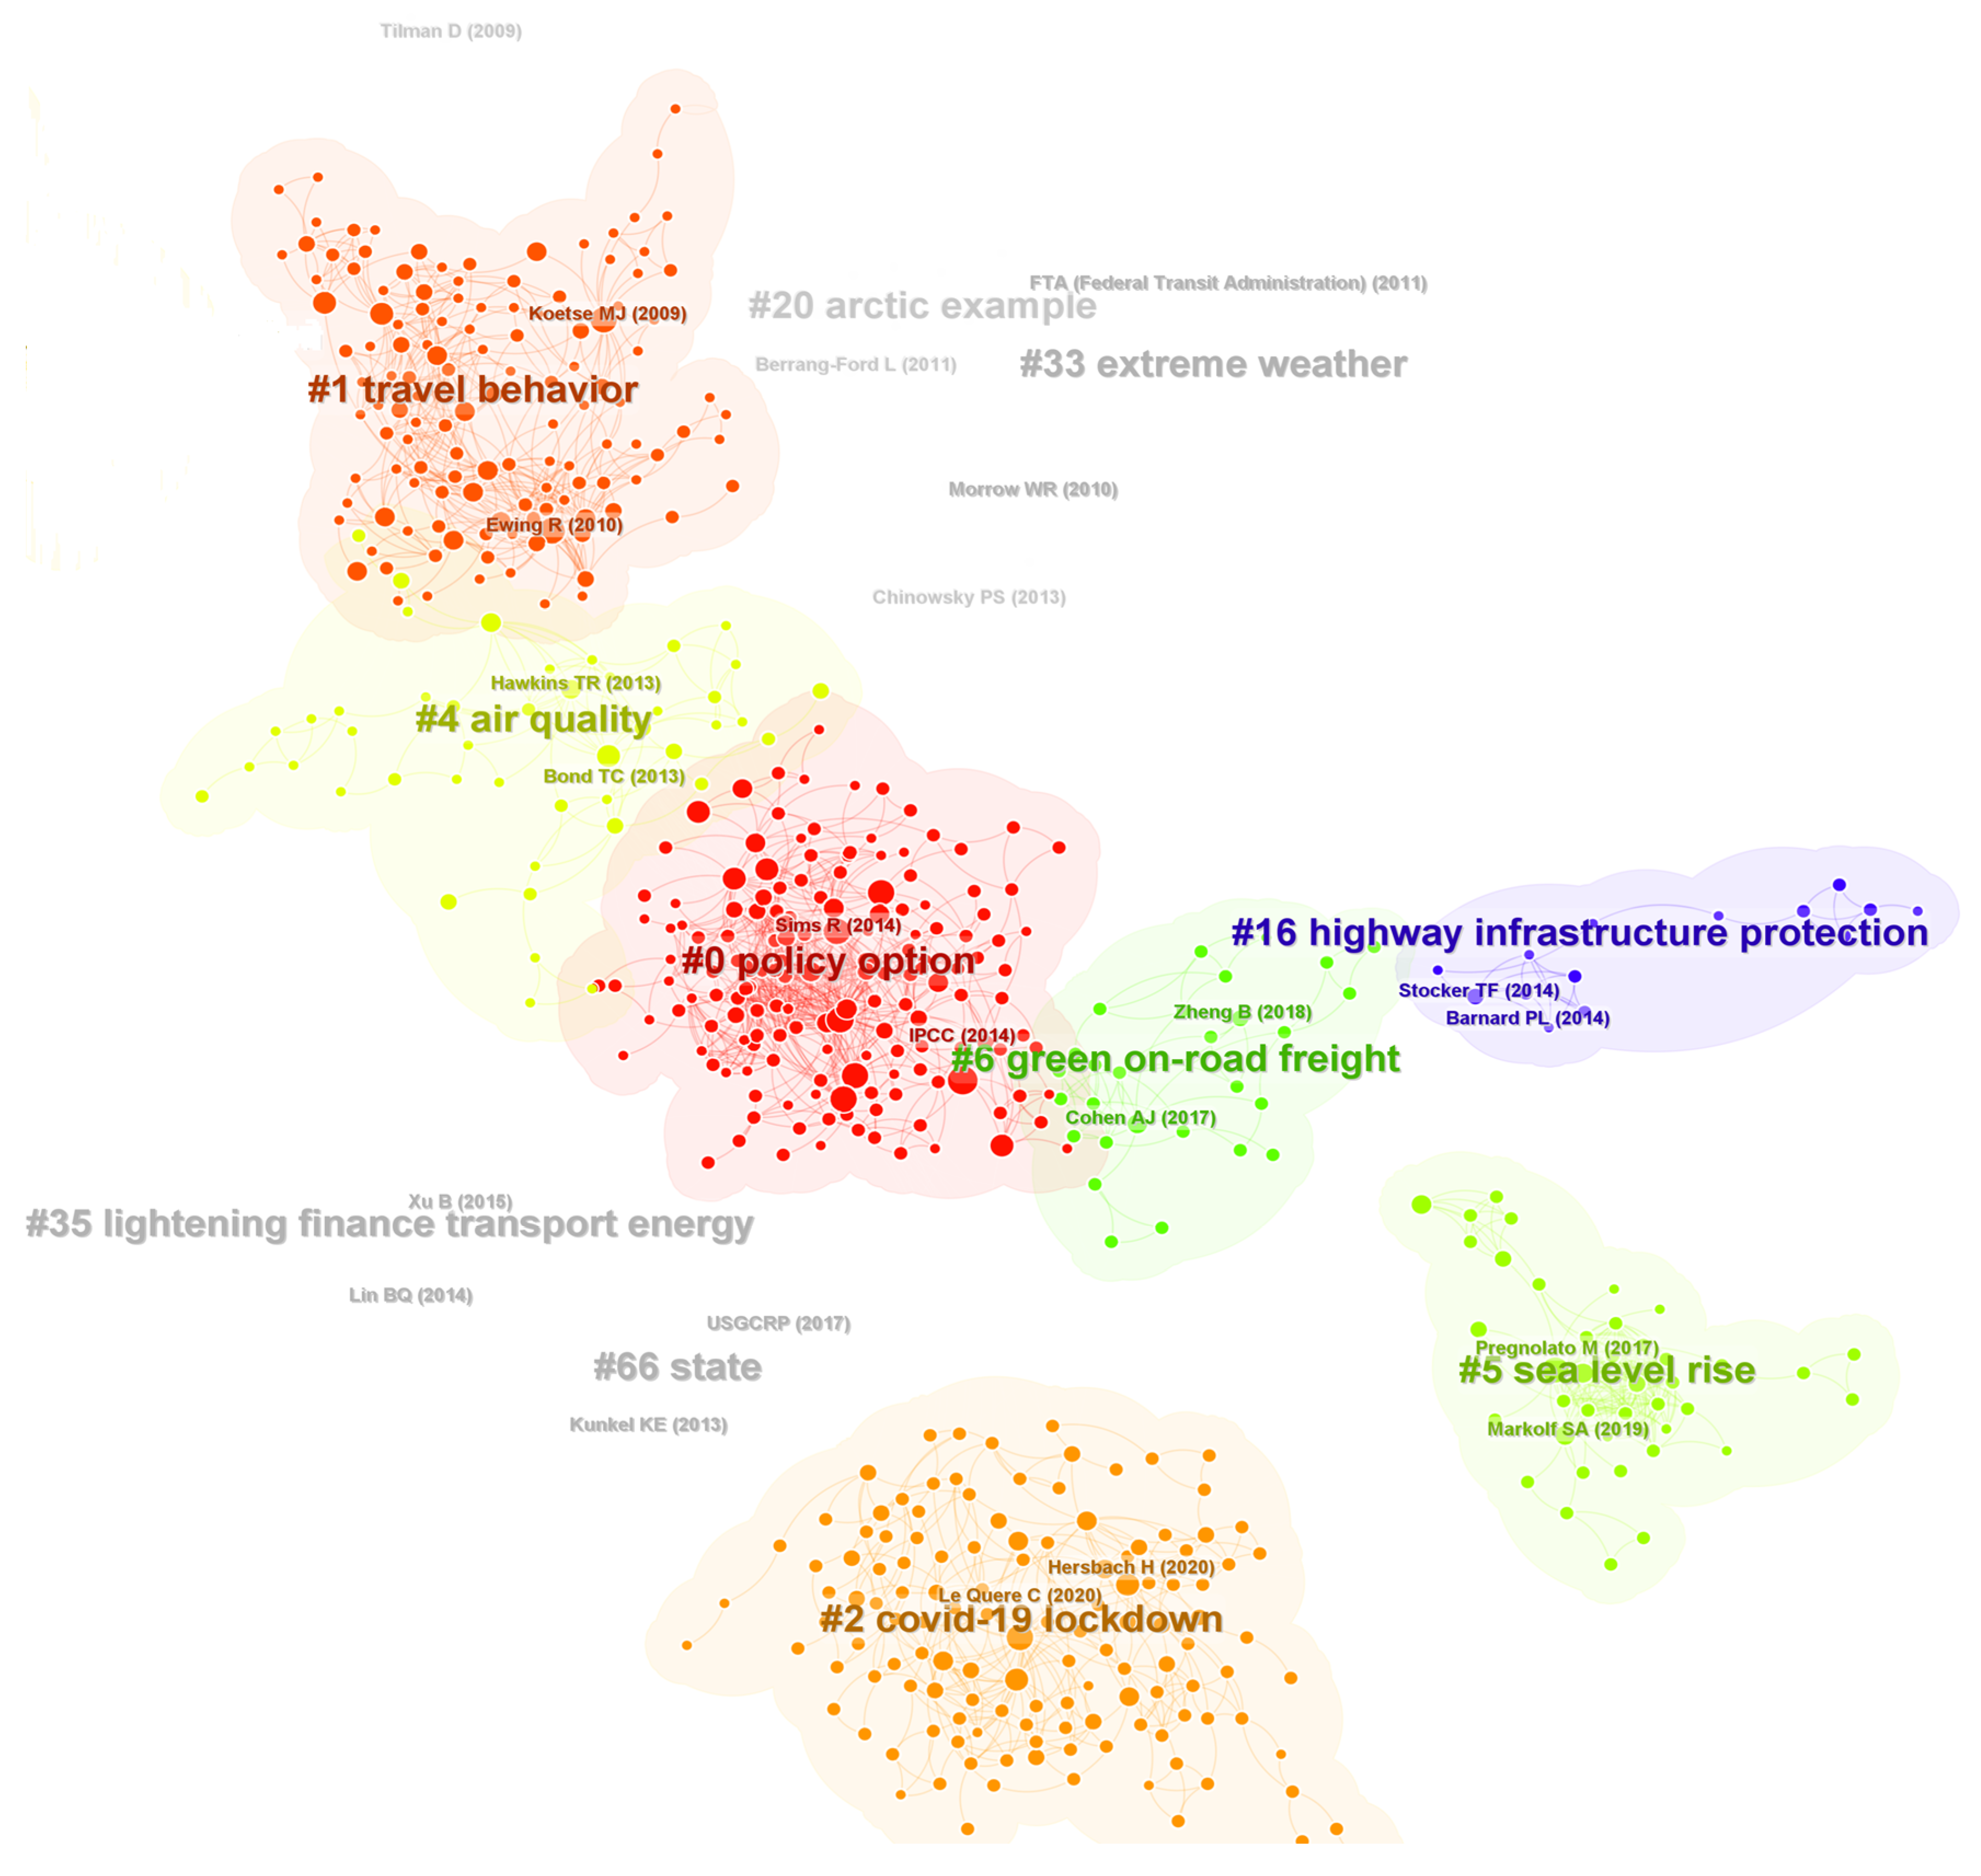
The reference co-citation network was created using CiteSpace, using a log-likelihood ratio (LLR) weighting algorithm to analyse the articles and their references in the data. LLR is an algorithm used to label the clusters with representative professional vocabulary. As shown in Figure 6, the co-citation network consists of 1404 nodes and 4144 links. The network is divided into 15 co-citation clusters, and the details of each cluster are listed in Table 6. All clusters received a high silhouette score, which indicated a good consistency of the co-citation network. The top 10 cited references are also presented in Table 7, which are often regarded as milestones due to their creative works [16].
The top terms in the clusters in Table 6 are traditional and long-lasting research topics in the climate change and transportation field. Therefore, to clarify the knowledge structure of this field, a detailed discussion of the clusters must be completed. CiteSpace identified the top 14 clusters based on the text analysis using the LLR algorithm, which usually gives the best result in terms of uniqueness and coverage [30]. In this study, we selected the top 5 clusters to explore the knowledge structure of this field, and clusters ranked 6-14 were excluded due to their small size. The details are as follows.
(1)
Policy option
The “Policy option” cluster had the largest size in the climate change and transportation field. Low-carbon fuel standards (LCFS) are generally seen as market-based policies to reduce gas emissions and increase the market penetration of renewable energy technologies in the transportation sector by specifying declining standards in a region [31]. Given the transport sector’s responsibility for global greenhouse gas emissions, policies to drive emissions reductions in this sector must play an essential role in any comprehensive carbon reduction strategy. Emissions reductions in the transport sector can be achieved in a variety of ways, such as improving the efficiency of transport technologies, reducing the carbon intensity of transport fuels, and travel demand management [25]. Hence, the literature on this cluster is extensive. Felix Creutzig (2016) [32,33] examined demand-side solutions and concluded that systemic infrastructural and behavioural change represent the path to a low-carbon society. Edelenbosch used an integrated assessment model to explore pathways of decarbonising the transport sector [34]. For the future, Yeh (2017) [35] focused on transportation models and proposed future modelling improvements, while Axsen (2018) [36] even modelled future incentive and sales mandate strategies. More policy tools to reduce greenhouse gas emissions from the transport sector will be applied in practice in the foreseeable future. LCFS is only a representative of these policy tools and is used as a cluster label. As each country accumulates experience with the adoption of LCFS programs, related research will be more in-depth.
(2)
Travel behaviour
Traffic behaviour is affected by weather conditions. Therefore, in the field of climate change and traffic research, the relationship between traffic behaviour and climate change has always been a research hotspot [37]. Climate change will have impacts on traffic management, user behaviour and operational efficiency, and most of these impacts will be negative [38]. In the context of climate change, travel demand modelling and the design of behavioural measures have changed [39]. In turn, traffic behaviour can also affect climate change. Changing public behaviour is the way to mitigate the impact of transportation on climate, which involves the development of public policy [40] and changes in public perception [41,42]. In 2011, Prillwitz (2011) [43] used a combined approach employing qualitative and quantitative methods to establish a theoretical framework of measures aiming at bringing about behavioural change to achieve sustainable mobility. Marsden (2014) [44] conducted an interesting study to explore the approaches to carbon reduction from transport taken by different users and found that dominant policy approaches do focus on individual choices. Moreover, with the increase in extreme weather in recent years, the research in this cluster has gradually increased the adaptation of travel behaviour to weather changes [45].
(3)
COVID-19 lockdown
The COVID-19 pandemic has significantly impacted the transport sector. Especially in 2020, many countries adopted strict protection measures, which dramatically changed the mobility of people in their daily lives. Despite its negative impact, the pandemic has positively impacted the natural environment. This contrast has attracted the interest of scholars [46]. Therefore, the impact of the transportation sector on the environment during the COVID-19 pandemic has become the second-largest cluster in the research field of climate change and transportation. Camargo-Caicedo Y (2021) [47] analysed the changes in the emissions from the transport sector during the COVID-19 lockdown in Colombia and found that the most significant decreases were due to the reduction in the burning of gasoline and diesel oil. AR Soni (2022) [48] revealed a significant reduction in GHG emissions due to the behavioural changes in travel. As research in this field continues, research becomes more specialised, including the impact of the COVID-19 pandemic on specific pollutant emissions [49], a particular region [50], or a certain mode of transportation [51].
(4)
Environmental cost
The cost of transportation has been receiving attention in research and policy internationally [52]. The environmental cost generated in the transportation process is an issue that has to be considered in industrial production, such as the choice of fuel [53] and plant location [54]. Environmental cost is also an important factor when analysing other transportation costs [9,55]. Matthews estimated external environmental costs and found that additional external environmental costs may range from 1% to 45% [56]. The accurate estimation of environmental costs is not only crucial for transportation companies [57], but also an important reference for the formulation of sustainable transportation policies [58,59].
(5)
Air quality
Many urban environments are under intense pressure due to population growth and increased transport activity. How to improve air quality has become a topic of concern among researchers in the field of transportation. Angelevska (2021) [60] provided an urban air quality guiding framework for road transport policy making. Costabile (2008) [61] developed a flexible framework to link transport emissions and air quality concentrations. Oxley (2009) [62] introduced structural and behavioural changes in the transport sector into integrated assessment modelling. In addition, research on air quality and transportation departments in specific cities is also a hot spot in this cluster [63,64,65].

3.3. Co-Word Analysis

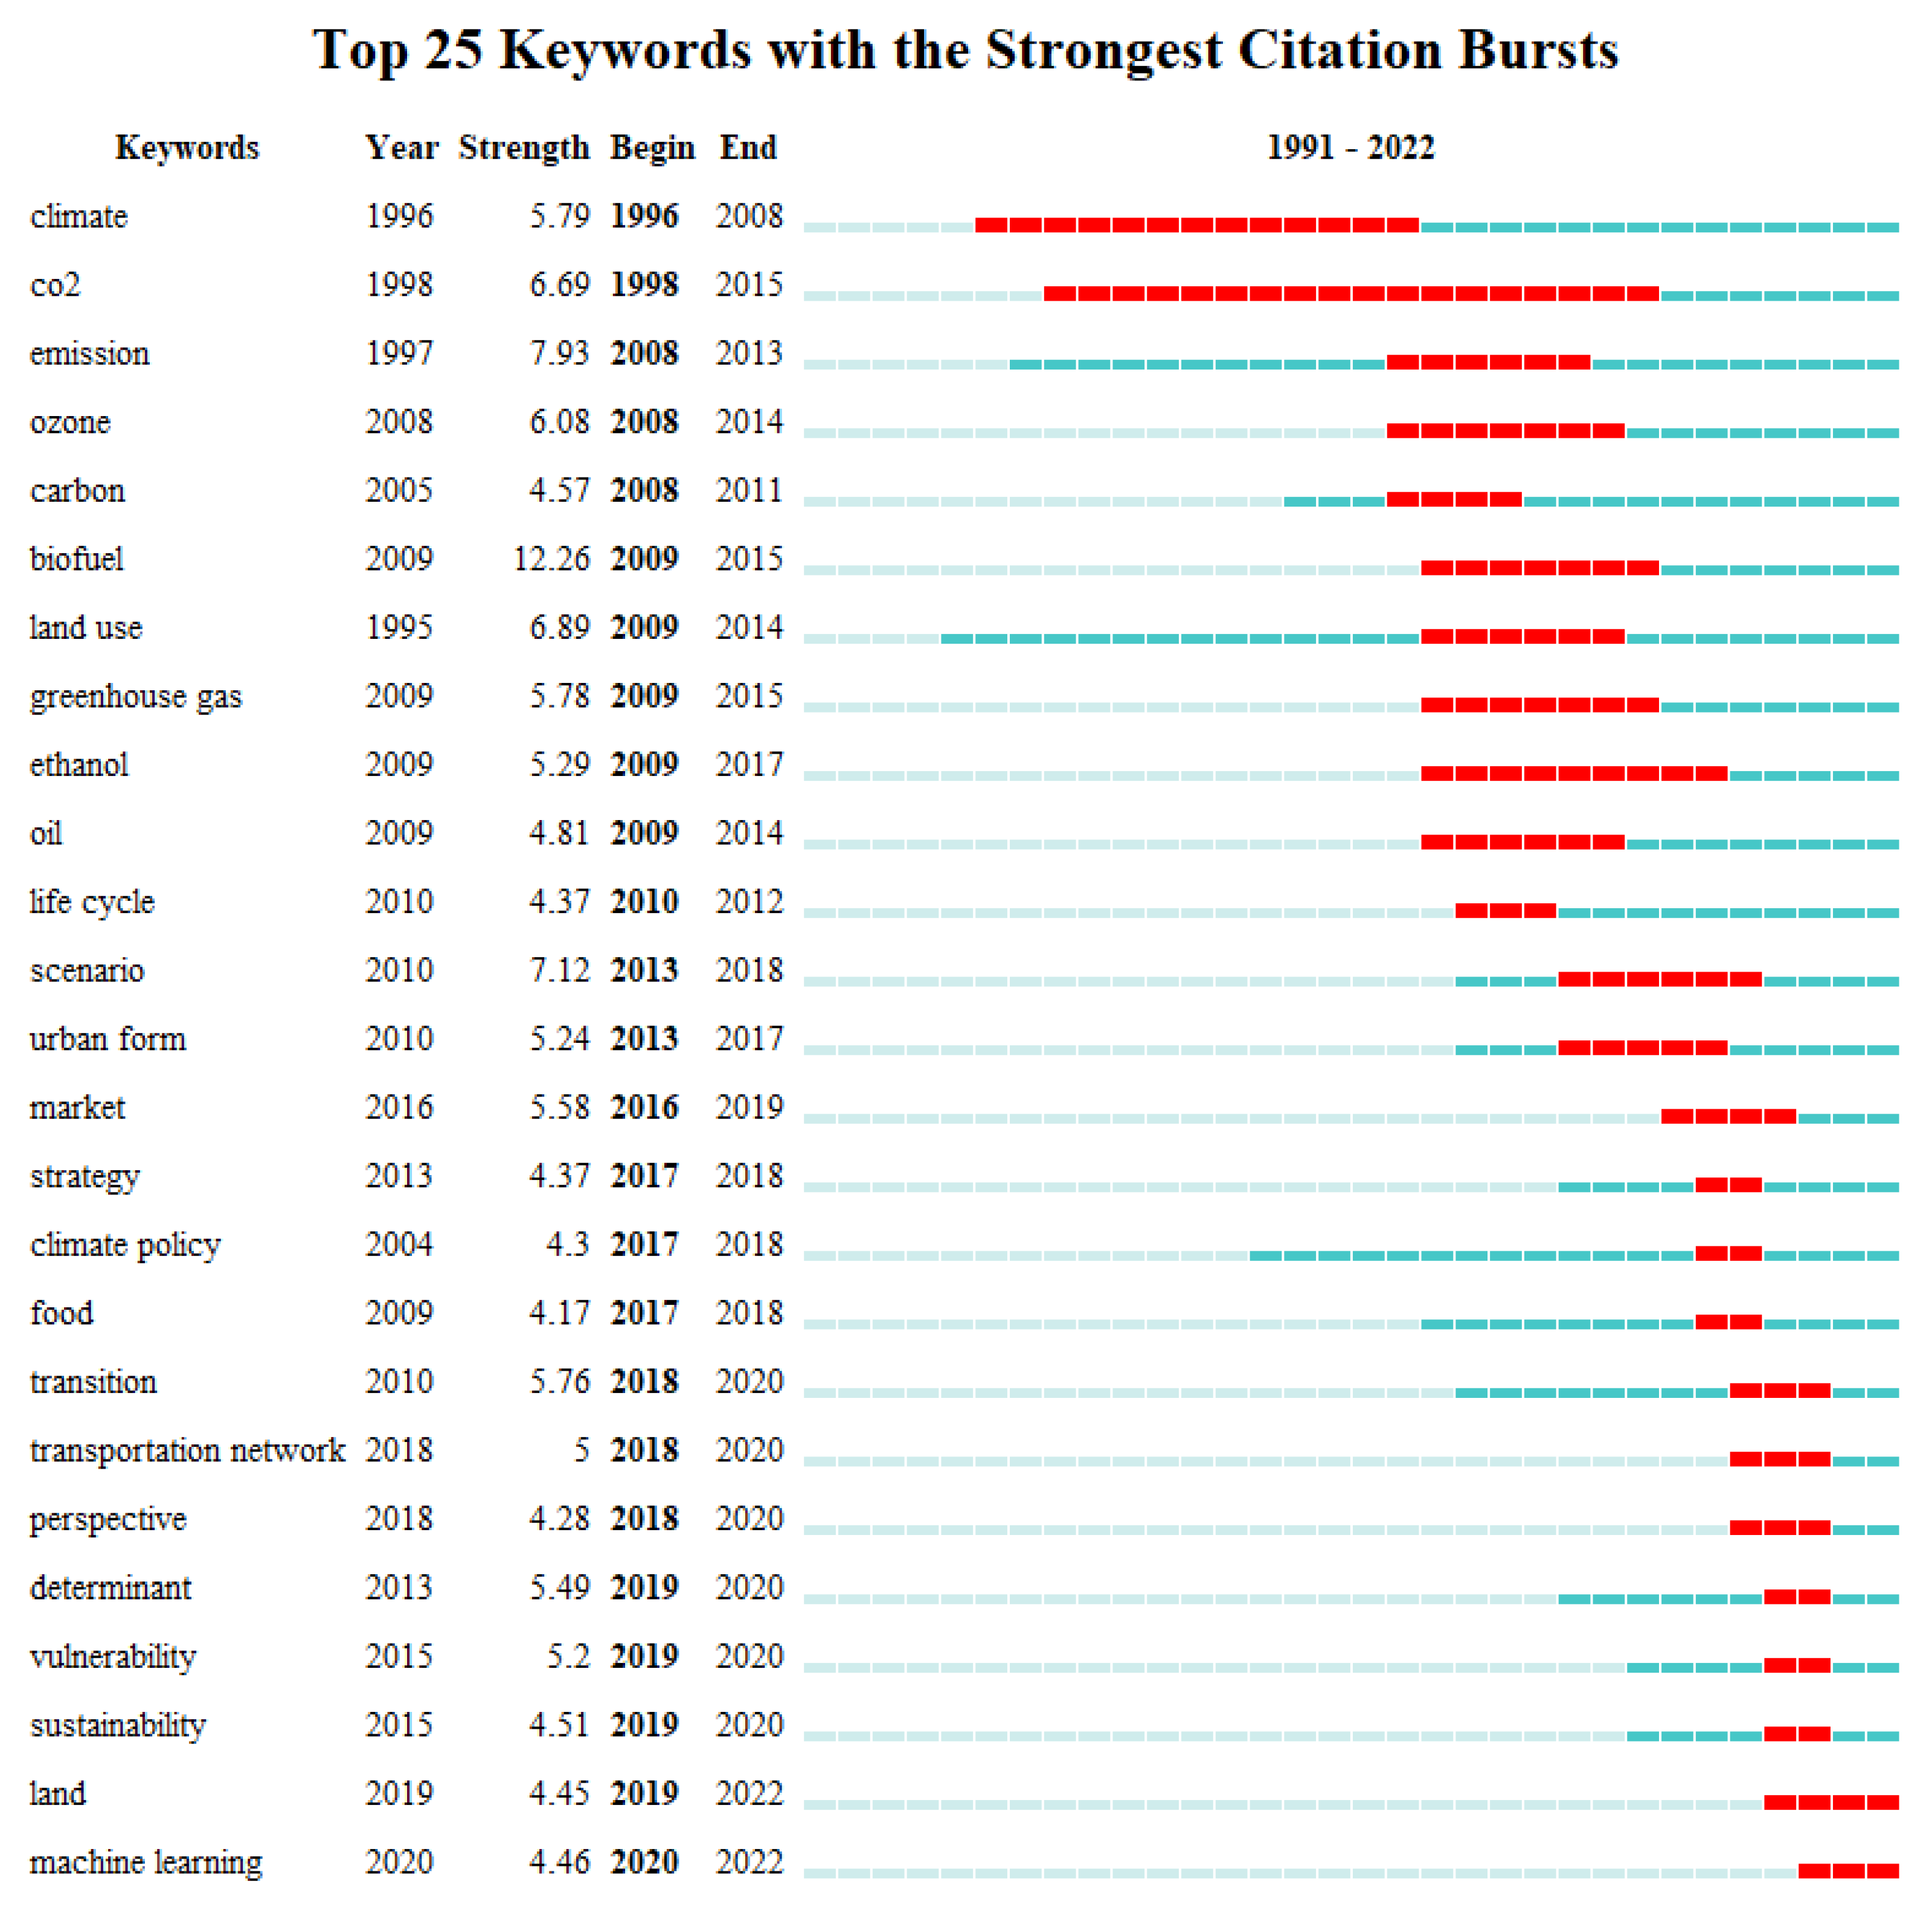
To trace the research trends and topics in the climate change and transportation research field, a keyword co-occurrence analysis was conducted, and the results are shown in Figure 7 below. The keyword co-occurrence network contained 857 nodes and 6288 links. As shown in Table 8, the top 10 keywords in co-occurrence frequency, burst strength and centrality are presented in separate columns. These keywords represent different research topics and significantly influenced the climate change and transportation research field.
As shown in Figure 7, the top 10 keywords with the strongest citation bursts are listed to trace the hotspots evaluation in this research field. Bold lines depict the duration of keywords in the research field, while a red color indicates the duration of keyword bursts. The two keywords, climate and CO2, appeared the earliest and displayed the longest bursts, marking the beginning of research in this area. During the period of 2008–2018, there was a large outbreak of keywords, including “biofuel”, “land use”, “life cycle”, “scenario”, and “transition”, with high co-occurrence frequency. In the last three years, the keywords “vulnerability” and “sustainability” gradually became a research hotspot. Furthermore, it is worth noting that in 2020, machine learning emerged and became the latest hot topic.

4. Future Research Prospects

A considerable number of studies on the climate change and transportation research field have been conducted during the past two decades. With the deepening of research, some new research perspectives and methods will inevitably be introduced. Therefore, based on the research results in Section 3, we propose the following trends for future research.
(1)
A greater focus on new opportunities brought about by new technologies and practices. New technologies related to transport can provide opportunities to address environmental issues. New-energy vehicles come with high expectations to solve the current environmental and energy dilemmas [66] and are likely to eventually form the backbone of the industry, replacing internal combustion engine vehicles [67]. Existing research will no longer provide sufficient decision support when electric vehicles gradually take up a greater market share. At the same time, autonomous vehicles and travel apps have the potential to profoundly change people’s travel behaviour and the transportation sector itself [68,69]. How the use of these new technologies in the transportation sector will affect climate change will be a focus of future research.
(2)
A greater focus on the long-term impacts of climate change on the transport sector. Due to the high level of uncertainty about future climate change, current research mostly focuses on the short-term impacts of climate change on the transport sector [3]. Most transport initiatives are organisational or planning in nature, involving top-down policy models [70]. Therefore, the long-term effects of policies are naturally one of the goals pursued by policymakers. As cities expand, environmental concerns and congestion become more serious, and many governments choose to expand their transport networks. Both land use and investment require stable decision models that allow transport infrastructure to adapt to new climate parameters.
(3)
A greater focus on developing countries. As shown in Section 3, most of the research in this field was contributed by scholars from developed countries. However, many developing countries, particularly rapidly growing countries, are experiencing more challenging environmental problems, limited access to clean technologies and well-enforced ecological regulations [71]. In future research, the effects of existing transport policies in developing countries can be assessed while focusing on the impact of new technologies in transport and energy.
(4)
A greater focus on the machine learning algorithms that can be applied in this research field. As shown in the co-word analysis section, the keyword “machine learning”, with the strongest citation burst, has received much attention in the past two years. Research on the development of sustainable transport systems has been increasing in the past 10 years, but mainly simulation and optimisation models, with few machine learning methods. Many problems arising from the impact of the transport sector on climate change can be solved by using machine learning methods, such as reducing transport activity, improvising vehicle efficiency, battery energy management, and low carbon intensity modal shift [72]. On the other hand, air quality [73] and carbon emissions [74] can also be predicted by machine learning. The application of machine learning in other research fields has been very extensive, and its application in this field will inevitably become a future trend.

5. Conclusions

This study sought to explore the current state and trends in the climate change and transportation research field. A scientometric review, based on co-authorship, co-citation, and keyword co-occurrence analysis, of a total of 4073 bibliographic records collected from the WoS core collection database was conducted to identify and visualise the intellectual structures of the climate change and transportation knowledge domain. A number of conclusions can be drawn, as follows. First, research on climate change and transportation is dominated by the US, China, Canada, the United Kingdom, and Germany, all of which have active authors and institutions. The US, China, and European countries play essential roles in cooperative relationships in this research field. Second, in the author co-citation analysis, we found that most of the top 10 authors in co-citation frequency, burst strength, and centrality are international organisations and government agencies whose reports on climate change form the basis of this research field. Third, five clusters, policy options, travel behaviour, COVID-19 lockdown, environmental cost and air quality, were identified, which formed the knowledge structure of this field. According to the co-occurrence analysis of keywords, in recent years, the keywords “vulnerability” and “sustainability” gradually became a research hotspot, and machine learning emerged and became the latest hot topic. Therefore, based on the analysis results, we proposed the potential trends as follows: (1) a greater focus on new opportunities brought about by new technologies and practices; (2) a greater focus on the long-term impacts of climate change on the transport sector; (3) a greater focus on developing countries; and (4) a greater focus on the machine learning algorithms that can be applied in this research field.

5.1. Contributions

At the theoretical level, the contribution of this study is extending past bibliometric studies of climate change and transportation research, offering insights into the disciplinary structure through the visualisation tool. The proposed knowledge map presents the knowledge evolution, domain, and frontiers of climate change and transportation. The knowledge evolution analysis traced the research milestones and development process of the research field in history. The co-citation analysis reveals the critical research areas, presenting the current knowledge structure. The proposed knowledge frontier indicates future directions for the knowledge development of climate change and transportation research. In practice, this study will assist scholars interested in climate change and transportation research in understanding the development process in depth. The funding of this study can also be used as a guidebook to find target publications that can be referred to quickly and journals to which they can submit their articles. Moreover, this review also provides a structured reference for policymakers.

5.2. Limitations

Two limitations of this study are noted. Firstly, limited by CiteSpace and language, the bibliographies in this study are peer-reviewed articles in English from the WoS core collection database. Although WoS provides high-standard studies, increasing the range of data sources in future research may lead to more accurate knowledge structures in this knowledge domain. In order to ensure the quality of articles, only articles and reviews were selected in this study, and other types of publications could also be included in a more extensive study in the future. In addition, the use of other visualisation tools to enrich the map of this knowledge area should be encouraged.
Secondly, scientometric mapping is a quantitative and objective approach to analysing knowledge domains, aiming to reduce the influence of subjectivity. However, to interpret the mapping results, the subjective experience and knowledge of experts are essential. In future research, it may be more reasonable to have independent domain experts examine the results and interpretation.

Author Contributions

Conceptualisation, W.P.; methodology, W.P.; software, W.P.; writing—original draft preparation, W.P.; writing—review and editing, N.A.H.; supervision and review of the article, N.A.H.; advice and support, A.H.A. and T.H.L. All authors have read and agreed to the published version of the manuscript.

Funding

This research received no external funding.

Institutional Review Board Statement

Not applicable.

Informed Consent Statement

Not applicable.

Data Availability Statement

Not applicable.

Acknowledgments

The authors would like to thank the Department of Civil Engineering, Faculty of Engineering, University Putra Malaysia, Serdang, Malaysia, for supporting this review paper.

Conflicts of Interest

The authors declare no conflict of interest.

References

  1. Weber, E.U.; Stern, P.C. Public Understanding of Climate Change in the United States. Am. Psychol. 2011, 66, 315. [Google Scholar] [CrossRef] [Green Version]
  2. Bandh, S.A.; Shafi, S.; Peerzada, M.; Rehman, T.; Bashir, S.; Wani, S.A.; Dar, R. Multidimensional Analysis of Global Climate Change: A Review. Environ. Sci. Pollut. Res. 2021, 28, 24872–24888. [Google Scholar] [CrossRef]
  3. Wang, T.; Qu, Z.; Yang, Z.; Nichol, T.; Clarke, G.; Ge, Y.-E. Climate Change Research on Transportation Systems: Climate Risks, Adaptation and Planning. Transp. Res. Part D Transp. Environ. 2020, 88, 102553. [Google Scholar] [CrossRef]
  4. Fiske, S.; Hubacek, K.; Jorgenson, A.; Li, J.; McGovern, T.; Rick, T.; Schor, J.; Solecki, W.; York, R.; Zycherman, A. Drivers and Responses: Social Science Perspectives on Climate Change, Part 2. In Proceedings of the Washington, DC: USGCRP Social Science Coordinating Committee. 2018. Available online: https://www.globalchange.gov/content/social-science-perspectives-climate-change-workshop (accessed on 23 September 2022).
  5. Love, G.; Soares, A.; Püempel, H. Climate Change, Climate Variability and Transportation. Procedia Environ. Sci. 2010, 1, 130–145. [Google Scholar] [CrossRef] [Green Version]
  6. Aroke, O.M.; Esmaeili, B.; Kim, S.C. Impact of Climate Change on Transportation Infrastructure: Comparing Perception Differences between the US Public and the Department of Transportation (DOT) Professionals. Sustainability 2021, 13, 11927. [Google Scholar] [CrossRef]
  7. Hendricks, J.; Righi, M.; Dahlmann, K.; Gottschaldt, K.-D.; Grewe, V.; Ponater, M.; Sausen, R.; Heinrichs, D.; Winkler, C.; Wolfermann, A. Quantifying the Climate Impact of Emissions from Land-Based Transport in Germany. Transp. Res. Part D Transp. Environ. 2018, 65, 825–845. [Google Scholar] [CrossRef]
  8. Ng, A.K.Y.; Becker, A.; Cahoon, S.; Chen, S.-L.; Earl, P.; Yang, Z. Time to Act: The Criticality of Ports in Adapting to the Impacts Posed by Climate Change. In Climate Change and Adaptation Planning for Ports; Routledge: London, UK, 2015; pp. 33–40. ISBN 1315756811. [Google Scholar]
  9. Van Fan, Y.; Perry, S.; Klemeš, J.J.; Lee, C.T. A Review on Air Emissions Assessment: Transportation. J. Clean. Prod. 2018, 194, 673–684. [Google Scholar] [CrossRef]
  10. Feng, Q.; Gauthier, P. Untangling Urban Sprawl and Climate Change: A Review of the Literature on Physical Planning and Transportation Drivers. Atmosphere 2021, 12, 547. [Google Scholar] [CrossRef]
  11. Kraus, L.; Proff, H. Sustainable Urban Transportation Criteria and Measurement—A Systematic Literature Review. Sustainability 2021, 13, 7113. [Google Scholar] [CrossRef]
  12. Kwan, S.C.; Hashim, J.H. A Review on Co-Benefits of Mass Public Transportation in Climate Change Mitigation. Sustain. Cities Soc. 2016, 22, 11–18. [Google Scholar] [CrossRef]
  13. Rebally, A.; Valeo, C.; He, J.; Saidi, S. Flood Impact Assessments on Transportation Networks: A Review of Methods and Associated Temporal and Spatial Scales. Front. Sustain. Cities 2021, 3, 732181. [Google Scholar] [CrossRef]
  14. Lee, P.T.-W.; Chung, Y.-S.; Lam, J.S.L. Transportation Research Trends in Environmental Issues: A Literature Review of Methodology and Key Subjects. Int. J. Shipp. Transp. Logist. 2016, 8, 612–631. [Google Scholar] [CrossRef]
  15. Nalimov, V.V.; Mulʹchenko, Z.M. Measurement of Science. Study of the Development of Science as an Information Process; U.S. Air Force Systems Command, Foreign Technology Division: Virginia, CA, USA, 1971. [Google Scholar]
  16. Chen, C.; Hu, Z.; Liu, S.; Tseng, H. Emerging Trends in Regenerative Medicine: A Scientometric Analysis in CiteSpace. Expert Opin. Biol. Ther. 2012, 12, 593–608. [Google Scholar] [CrossRef]
  17. van Eck, N.J.; Waltman, L. Software Survey: VOSviewer, a Computer Program for Bibliometric Mapping. Scientometrics 2010, 84, 523–538. [Google Scholar] [CrossRef] [PubMed] [Green Version]
  18. Garfield, E. From the Science of Science to Scientometrics Visualizing the History of Science with HistCite Software. J. Informetr. 2009, 3, 173–179. [Google Scholar] [CrossRef] [Green Version]
  19. Chen, C. CiteSpace II: Detecting and Visualizing Emerging Trends and Transient Patterns in Scientific Literature. J. Am. Soc. Inf. Sci. Technol. 2006, 57, 359–377. [Google Scholar] [CrossRef] [Green Version]
  20. Mingers, J.; Leydesdorff, L. A Review of Theory and Practice in Scientometrics. Eur. J. Oper. Res. 2015, 246, 1–19. [Google Scholar] [CrossRef] [Green Version]
  21. Bankar, R.S.; Lihitkar, S.R. Science Mapping and Visualization Tools Used for Bibliometric and Scientometric Studies: A Comparative Study. J. Adv. Libr. Sci. 2019, 6, 382–394. [Google Scholar]
  22. Searchinger, T.; Heimlich, R.; Houghton, R.; Dong, F.; Elobeid, A.; Fabiosa, J.F.; Tokgoz, S.; Hayes, D.J.; Yu, T. Factoring Greenhouse Gas Emissions from Land Use Change into Biofuel Calculations. Science 2008, 29, 1238–1240. [Google Scholar] [CrossRef] [PubMed]
  23. Fargione, J.; Hill, J.; Tilman, D.; Polasky, S.; Hawthorne, P. Land clearing and the biofuel carbon debt. Science 2008, 319, 1235–1238. [Google Scholar] [CrossRef] [Green Version]
  24. Farrell, A.E.; Plevin, R.J.; Turner, B.T.; Jones, A.D.; O’hare, M.; Kammen, D.M. Ethanol Can Contribute to Energy and Environmental Goals. Science 2006, 311, 506–508. [Google Scholar] [CrossRef] [PubMed] [Green Version]
  25. Change, I.C. Mitigation of Climate Change. Contrib. Work Group III Fifth Assess. Rep. Intergov. Panel Clim. Chang. 2014, 1454, 147. [Google Scholar]
  26. Le Quéré, C.; Jackson, R.B.; Jones, M.W.; Smith, A.J.P.; Abernethy, S.; Andrew, R.M.; De-Gol, A.J.; Willis, D.R.; Shan, Y.; Canadell, J.G. Temporary Reduction in Daily Global CO 2 Emissions during the COVID-19 Forced Confinement. Nat. Clim. Chang. 2020, 10, 647–653. [Google Scholar] [CrossRef]
  27. Rogelj, J.; Den Elzen, M.; Höhne, N.; Fransen, T.; Fekete, H.; Winkler, H.; Schaeffer, R.; Sha, F.; Riahi, K.; Meinshausen, M. Paris Agreement Climate Proposals Need a Boost to Keep Warming Well below 2 C. Nature 2016, 534, 631–639. [Google Scholar] [CrossRef] [PubMed] [Green Version]
  28. Ewing, R.; Cervero, R. Travel and the Built Environment: A Meta-Analysis. J. Am. Plan. Assoc. 2010, 76, 265–294. [Google Scholar] [CrossRef]
  29. Masson-Delmotte, V.; Zhai, P.; Pörtner, H.-O.; Roberts, D.; Skea, J.; Shukla, P.R.; Pirani, A.; Moufouma-Okia, W.; Péan, C.; Pidcock, R. Global Warming of 1.5 C. IPCC Spec. Rep. Impacts Glob. Warm. 2018, 1, 43–50. [Google Scholar]
  30. Chen, C.; Dubin, R.; Kim, M.C. Emerging Trends and New Developments in Regenerative Medicine: A Scientometric Update (2000–2014). Expert Opin. Biol. Ther. 2014, 14, 1295–1317. [Google Scholar] [CrossRef] [Green Version]
  31. Lade, G.E.; Lawell, C.-Y.C.L. The Design and Economics of Low Carbon Fuel Standards. Res. Transp. Econ. 2015, 52, 91–99. [Google Scholar] [CrossRef] [Green Version]
  32. Creutzig, F.; Fernandez, B.; Haberl, H.; Khosla, R.; Mulugetta, Y.; Seto, K.C. Beyond Technology: Demand-Side Solutions for Climate Change Mitigation. Annu. Rev. Environ. Resour. 2016, 41, 173–198. [Google Scholar] [CrossRef] [Green Version]
  33. Creutzig, F. Evolving Narratives of Low-Carbon Futures in Transportation. Transp. Rev. 2016, 36, 341–360. [Google Scholar] [CrossRef]
  34. Edelenbosch, O.Y.; McCollum, D.L.; Van Vuuren, D.P.; Bertram, C.; Carrara, S.; Daly, H.; Fujimori, S.; Kitous, A.; Kyle, P.; Broin, E.Ó. Decomposing Passenger Transport Futures: Comparing Results of Global Integrated Assessment Models. Transp. Res. Part D Transp. Environ. 2017, 55, 281–293. [Google Scholar] [CrossRef] [Green Version]
  35. Yeh, S.; Mishra, G.S.; Fulton, L.; Kyle, P.; McCollum, D.L.; Miller, J.; Cazzola, P.; Teter, J. Detailed Assessment of Global Transport-Energy Models’ Structures and Projections. Transp. Res. Part D Transp. Environ. 2017, 55, 294–309. [Google Scholar] [CrossRef] [Green Version]
  36. Axsen, J.; Wolinetz, M. Reaching 30% Plug-in Vehicle Sales by 2030: Modeling Incentive and Sales Mandate Strategies in Canada. Transp. Res. Part D Transp. Environ. 2018, 65, 596–617. [Google Scholar] [CrossRef]
  37. Böcker, L.; Dijst, M.; Prillwitz, J. Impact of Everyday Weather on Individual Daily Travel Behaviours in Perspective: A Literature Review. Transp. Rev. 2013, 33, 71–91. [Google Scholar] [CrossRef]
  38. Taylor, M.A.P.; Philp, M. Adapting to Climate Change-Implications for Transport Infrastructure, Transport Systems and Travel Behaviour. Road Transp. Res. A J. Aust. N. Z. Res. Pract. 2010, 19, 66–79. [Google Scholar]
  39. Avineri, E. On the Use and Potential of Behavioural Economics from the Perspective of Transport and Climate Change. J. Transp. Geogr. 2012, 24, 512–521. [Google Scholar] [CrossRef]
  40. Cohen, S.A.; Higham, J.E.S.; Reis, A.C. Sociological Barriers to Developing Sustainable Discretionary Air Travel Behaviour. J. Sustain. Tour. 2013, 21, 982–998. [Google Scholar] [CrossRef]
  41. Howarth, C.; Waterson, B.; McDonald, M. Public Understanding of Climate Change and the Gaps between Knowledge, Attitudes and Travel Behaviour. In Proceedings of the 88th Transport Research Board Annual Meeting Washington, Washington, DC, USA, 11–15 January 2009. [Google Scholar]
  42. Fletcher, J.; Higham, J.; Longnecker, N. Climate Change Risk Perception in the USA and Alignment with Sustainable Travel Behaviours. PLoS ONE 2021, 16, e0244545. [Google Scholar] [CrossRef]
  43. Prillwitz, J.; Barr, S. Moving towards Sustainability? Mobility Styles, Attitudes and Individual Travel Behaviour. J. Transp. Geogr. 2011, 19, 1590–1600. [Google Scholar] [CrossRef]
  44. Marsden, G.; Mullen, C.; Bache, I.; Bartle, I.; Flinders, M. Carbon Reduction and Travel Behaviour: Discourses, Disputes and Contradictions in Governance. Transp. Policy 2014, 35, 71–78. [Google Scholar] [CrossRef]
  45. Lu, Q.-C.; Zhang, J.; Peng, Z.-R.; Rahman, A.B.M.S. Inter-City Travel Behaviour Adaptation to Extreme Weather Events. J. Transp. Geogr. 2014, 41, 148–153. [Google Scholar] [CrossRef]
  46. Gkatzelis, G.I.; Gilman, J.B.; Brown, S.S.; Eskes, H.; Gomes, A.R.; Lange, A.C.; McDonald, B.C.; Peischl, J.; Petzold, A.; Thompson, C.R. The Global Impacts of COVID-19 Lockdowns on Urban Air Pollutiona Critical Review and Recommendations. Elem. Sci. Anthr. 2021, 9, 176. [Google Scholar] [CrossRef]
  47. Camargo-Caicedo, Y.; Mantilla-Romo, L.C.; Bolaño-Ortiz, T.R. Emissions Reduction of Greenhouse Gases, Ozone Precursors, Aerosols and Acidifying Gases from Road Transportation during the COVID-19 Lockdown in Colombia. Appl. Sci. 2021, 11, 1458. [Google Scholar] [CrossRef]
  48. Soni, A.R.; Amrit, K.; Shinde, A.M. COVID-19 and Transportation of India: Influence on Infection Risk and Greenhouse Gas Emissions. Environ. Dev. Sustain. 2022, 25, 1–16. [Google Scholar] [CrossRef] [PubMed]
  49. Restrepo, C.E. Nitrogen Dioxide, Greenhouse Gas Emissions and Transportation in Urban Areas: Lessons from the COVID-19 Pandemic. Front. Environ. Sci. 2021, 204, 689985. [Google Scholar] [CrossRef]
  50. Wong, Y.J.; Shiu, H.-Y.; Chang, J.H.-H.; Ooi, M.C.G.; Li, H.-H.; Homma, R.; Shimizu, Y.; Chiueh, P.-T.; Maneechot, L.; Sulaiman, N.M.N. Spatiotemporal Impact of COVID-19 on Taiwan Air Quality in the Absence of a Lockdown: Influence of Urban Public Transportation Use and Meteorological Conditions. J. Clean. Prod. 2022, 365, 132893. [Google Scholar] [CrossRef]
  51. Kallbekken, S.; Sælen, H. Public Support for Air Travel Restrictions to Address COVID-19 or Climate Change. Transp. Res. Part D: Transp. Environ. 2021, 93, 102767. [Google Scholar] [CrossRef]
  52. Zhang, A.; Boardman, A.E.; Gillen, D.; Waters, I. Towards Estimating the Social and Environmental Costs of Transportation in Canada. Rep. Transp. Can. 2004, 7. [Google Scholar]
  53. Hill, J. Environmental Costs and Benefits of Transportation Biofuel Production from Food-and Lignocellulose-Based Energy Crops: A Review. Sustain. Agric. 2009, 125–139. [Google Scholar]
  54. Ko, S.; Lautala, P.; Fan, J.; Shonnard, D.R. Economic, Social, and Environmental Cost Optimization of Biomass Transportation: A Regional Model for Transportation Analysis in Plant Location Process. Biofuels Bioprod. Biorefin. 2019, 13, 582–598. [Google Scholar] [CrossRef]
  55. Litman, T. Land Use Impact Costs of Transportation. World Transp. Policy Pract. 1995, 1, 9–16. [Google Scholar] [CrossRef]
  56. Matthews, H.S.; Hendrickson, C.; Horvath, A. External Costs of Air Emissions from Transportation. J. Infrastruct. Syst. 2001, 7, 13–17. [Google Scholar] [CrossRef] [Green Version]
  57. Schipper, Y. Environmental Costs in European Aviation. Transp. Policy 2004, 11, 141–154. [Google Scholar] [CrossRef]
  58. Litman, T. Transportation Cost Analysis for Sustainability. Transportation 1999, 1996, 97. [Google Scholar]
  59. Song, Y.; Miller, H.J.; Stempihar, J.; Zhou, X. Green Accessibility: Estimating the Environmental Costs of Network-Time Prisms for Sustainable Transportation Planning. J. Transp. Geogr. 2017, 64, 109–119. [Google Scholar] [CrossRef]
  60. Angelevska, B.; Atanasova, V.; Andreevski, I. Urban Air Quality Guidance Based on Measures Categorization in Road Transport. Civ. Eng. J. 2021, 7, 253–267. [Google Scholar] [CrossRef]
  61. Costabile, F.; Allegrini, I. A New Approach to Link Transport Emissions and Air Quality: An Intelligent Transport System Based on the Control of Traffic Air Pollution. Environ. Model. Softw. 2008, 23, 258–267. [Google Scholar] [CrossRef]
  62. Oxley, T.; Valiantis, M.; Elshkaki, A.; ApSimon, H.M. Background, Road and Urban Transport Modelling of Air Quality Limit Values (the BRUTAL Model). Environ. Model. Softw. 2009, 24, 1036–1050. [Google Scholar] [CrossRef]
  63. Sun, C.; Zhang, W.; Fang, X.; Gao, X.; Xu, M. Urban Public Transport and Air Quality: Empirical Study of China Cities. Energy Policy 2019, 135, 110998. [Google Scholar] [CrossRef]
  64. Ravindra, K.; Wauters, E.; Tyagi, S.K.; Mor, S.; Van Grieken, R. Assessment of Air Quality after the Implementation of Compressed Natural Gas (CNG) as Fuel in Public Transport in Delhi, India. Environ. Monit. Assess. 2006, 115, 405–417. [Google Scholar] [CrossRef] [Green Version]
  65. Ault, A.P.; Moore, M.J.; Furutani, H.; Prather, K.A. Impact of Emissions from the Los Angeles Port Region on San Diego Air Quality during Regional Transport Events. Environ. Sci. Technol. 2009, 43, 3500–3506. [Google Scholar] [CrossRef]
  66. Liu, Z.; Hao, H.; Cheng, X.; Zhao, F. Critical Issues of Energy Efficient and New Energy Vehicles Development in China. Energy Policy 2018, 115, 92–97. [Google Scholar] [CrossRef]
  67. Ren, J. New Energy Vehicle in China for Sustainable Development: Analysis of Success Factors and Strategic Implications. Transp. Res. Part D Transp. Environ. 2018, 59, 268–288. [Google Scholar] [CrossRef]
  68. Winston, C.; Karpilow, Q. Autonomous Vehicles: The Road to Economic Growth? Brookings Institution Press: Washington, DC, USA, 2020; ISBN 0815738587. [Google Scholar]
  69. Cohen, P.; Hahn, R.; Hall, J.; Levitt, S.; Metcalfe, R. Using Big Data to Estimate Consumer Surplus: The Case of Uber; National Bureau of Economic Research: Cambridge, MA, USA, 2016. [Google Scholar]
  70. Koetse, M.J.; Rietveld, P. Adaptation to Climate Change in the Transport Sector. Transp. Rev. 2012, 32, 267–286. [Google Scholar] [CrossRef] [Green Version]
  71. Li, S.; Xing, J.; Yang, L.; Zhang, F. Transportation and the Environment in Developing Countries. Annu. Rev. Resour. Econ. 2020, 12, 389–409. [Google Scholar] [CrossRef]
  72. Rolnick, D.; Donti, P.L.; Kaack, L.H.; Kochanski, K.; Lacoste, A.; Sankaran, K.; Ross, A.S.; Milojevic-Dupont, N.; Jaques, N.; Waldman-Brown, A. Tackling Climate Change with Machine Learning. ACM Comput. Surv. (CSUR) 2022, 55, 1–96. [Google Scholar] [CrossRef]
  73. Wang, A.; Xu, J.; Tu, R.; Saleh, M.; Hatzopoulou, M. Potential of Machine Learning for Prediction of Traffic Related Air Pollution. Transp. Res. Part D Transp. Environ. 2020, 88, 102599. [Google Scholar] [CrossRef]
  74. Khan, M.J.U.R.; Awasthi, A. Machine Learning Model Development for Predicting Road Transport Ghg Emissions in Canada. WSB J. Bus. Financ. 2019, 53, 55–72. [Google Scholar] [CrossRef] [Green Version]
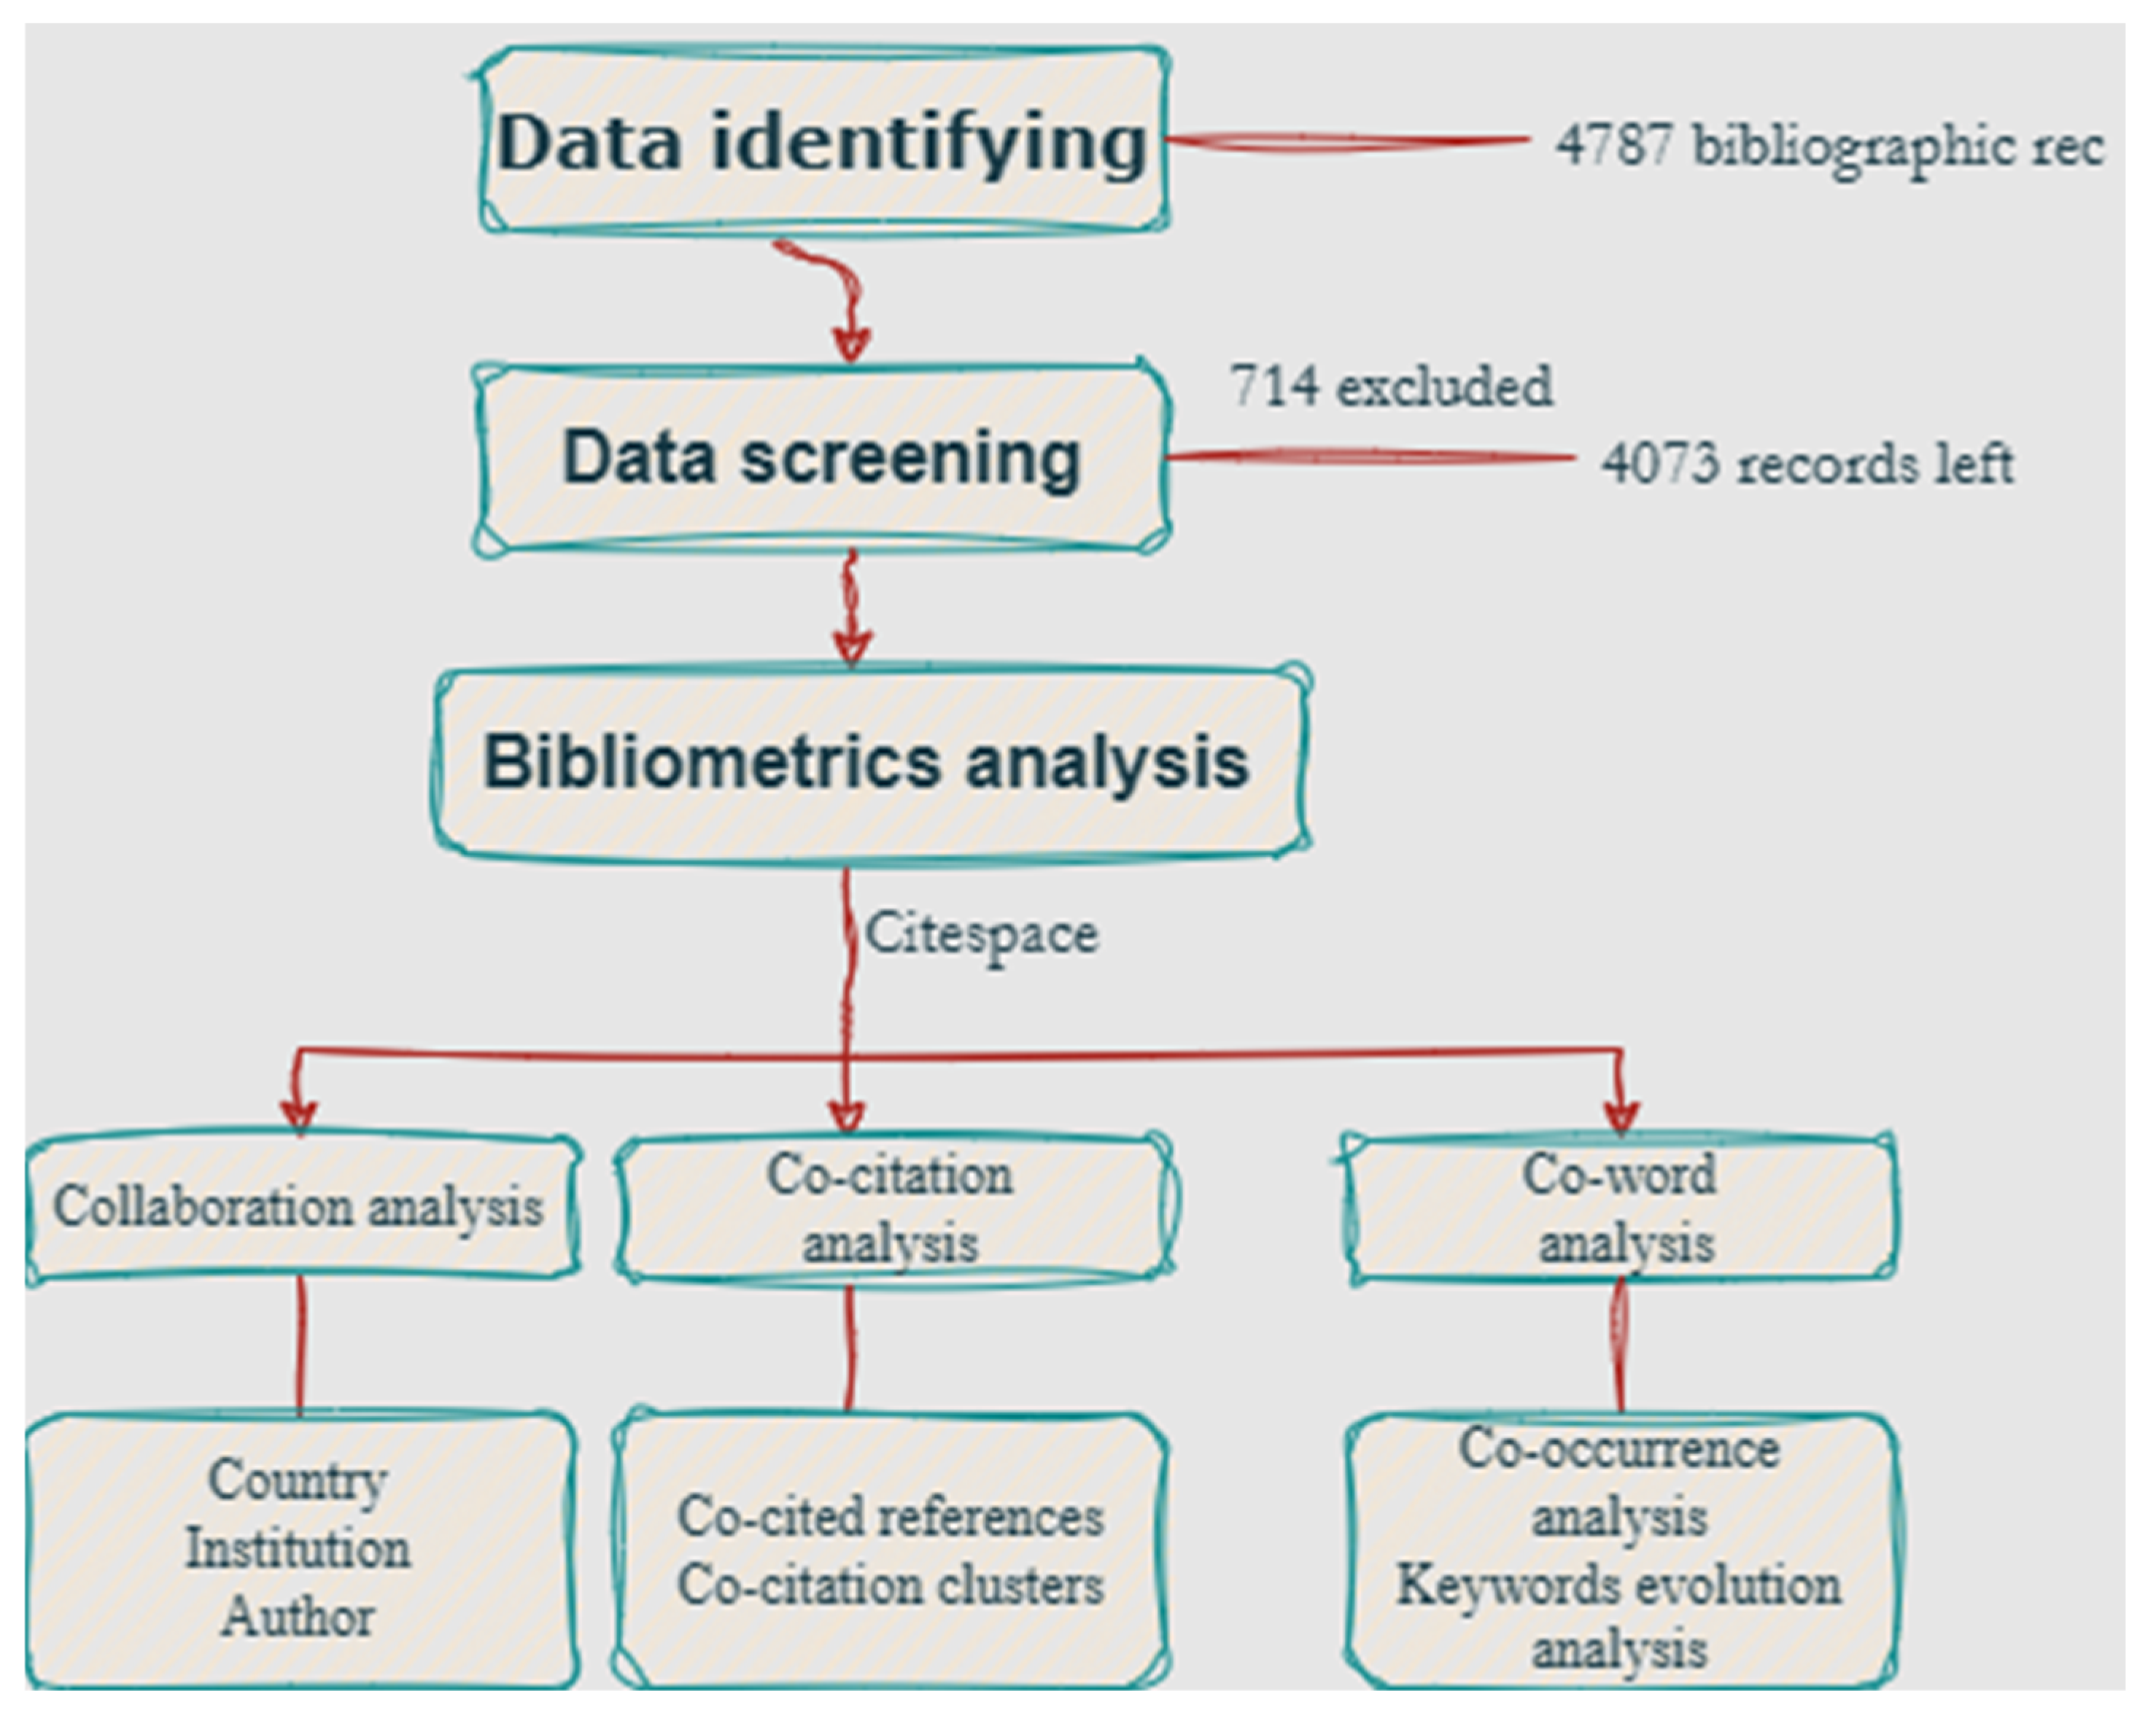
Figure 1. Research framework.
Atmosphere 14 00434 g001
Figure 2. Country/region collaboration network: a timeline view.
Atmosphere 14 00434 g002
Figure 3. Institution collaboration network.
Atmosphere 14 00434 g003
Figure 4. Institution collaboration network.
Atmosphere 14 00434 g004
Figure 5. Author/organisation co-citation network.
Atmosphere 14 00434 g005
Figure 6. Reference co-citation network.
Atmosphere 14 00434 g006
Figure 7. Top 10 keywords with the strongest citation bursts.
Atmosphere 14 00434 g007
Table 1. The search query used in this study.
Data SourceWoS
Search queryTS = (climate change) and TS = (transportation)
Retrieval time20 September 2022
Time spanUnlimited
Quality measurePeer-reviewed research papers in English
No of records4073
Table 2. Top 10 countries/regions based on the number of publications.
CountryPublicationsCentralityCountryPublicationsCentrality
US13680.39India1620.01
China7210.07Australia1400.08
Canada 3450.11Sweden1310.05
United Kingdom2940.12France1280.13
Germany2110.19Spain1220.08
Table 3. Top 10 institutions based on the number of publications.
InstitutionPublicationsCentralityCountry/Region
University of Chinese Academy of Social Sciences1610.19China
University of California, Berkeley750.05US
Tsinghua University410.04China
Massachusetts Institute of Technology400.01US
Arizona State University380.03US
University of Washington370.06US
Stanford University350.05US
University of California, Davis340.01US
University of Colorado Boulder310.03US
University Of Illinois310.01US
Table 4. Top 10 authors based on the number of publications.
AuthorPublicationsCentralityAuthorPublicationsCentrality
Zhang Yan350.02L. Wang240.01
Y. Wang330.01J. Wang220.02
J. Li310.01Y. Liu210.01
J. Liu260.02X Zhang190.02
X. Li260.02Y. Liu180.01
Table 5. Top 10 authors/organisations in co-citation frequency, burst strength, and centrality.
Top 10
Authors/Organisations in Co-Citation Frequency
Top 10
Authors/Organisations in Burst Strength
Top 10
Authors/Organisations in Centrality
IPCC (378)Farrell, Alexander E (21.19)Stacy Davis (0.12)
IEA (248)IEA (17.45)IEA (0.09)
European Commission (160)US EPA (17.33)IPCC (0.07)
US EPA (130)Timothy Searchinger (17.08)Hao Wang (0.07)
World Bank (117)Joseph Fargione (16.74)James E. Hansen (0.06)
Yi Zhang (115)US DOE (15.16)Reid Ewing (0.06)
Susan Solomon (111)IPCC (13.81)Lee Chapman (0.05)
FAO (109)Andreas Schafer (13.58)European Commission (0.05)
United Nations (102)Robert Socolow (13.26)Wang, Zhichao (0.05)
Yue Wang (96)David Pimentel (13.20)FAO (0.05)
Table 6. Top 10 cited references.
No.Citation CountsReferencesSource Journal/Publisher
134Factoring greenhouse gas emissions from land use change into biofuel calculations [22]Science
231Climate change 2014 synthesis report [22]IPCC
330Land clearing and the biofuel carbon debt [23]Science
428Ethanol Can Contribute to Energy and Environmental Goals [24]Science
523Mitigation of climate change [25]IPCC
622Temporary reduction in daily global CO2 emissionsduring the COVID-19 forced confinement [26]Nature climate change
7221Paris Agreement climate proposals needa boost to keep warming well below 2 °C [27]Nature
821Travel and the built environment: A meta-analysis [28]Journal of the American planning association
918Climate change 2013: the physical science basis: Working Group I contribution to the Fifth assessment report of the Intergovernmental Panel on Climate ChangeCambridge university press
1018Global warming of 1.5 °C [29]IPCC
Table 7. Top 14 co-citation clusters.
Cluster IDSizeSilhouetteMean (Year)Top Terms (Log-Likelihood Ratio)
01590.932014Policy option
11290.8712009Travel behaviour
21290.9432018COVID-19 lockdown
3820.966207Environmental cost
4450.9422011Air quality
5290.9832017Sea level rise
6280.992016Green on-road freight
13160.9992001Oil dependence carbon emission
16140.9972015Sea level
20120.9952011Arctic example
25100.9962008Marine resource
33912011Extreme weather
3580.9962014Lightening finance Transport energy
6640.9982014State
Table 8. Top 10 keywords in co-occurrence frequency, burst strength, and centrality.
Top 10 Keywords in Co-Occurrence FrequencyTop 10 Keywords in Burst StrengthTop 10 Keywords in Centrality
Climate change (1310)Biofuel (12.26)Climate change (0.17)
Impact (530)Emission (7.93)Climate (0.13)
Emission (251)Scenario (7.12)Air pollution (0.08)
Energy (249)Land use (6.89)Bioma (0.07)
Model (244)CO2 (6.69)United states (0.06)
Life cycle assessment (242)Ozone (6.08)Evolution (0.06)
Greenhouse gas emission (229)Climate (5.79)Land use (0.05)
System (211)Greenhouse gas emission (5.78)CO2 (0.05)
Transportation (183)Transition (5.76)Carbon (0.05)
Cliamte (181)Market (5.58)Biofuel (0.05)
Disclaimer/Publisher’s Note: The statements, opinions and data contained in all publications are solely those of the individual author(s) and contributor(s) and not of MDPI and/or the editor(s). MDPI and/or the editor(s) disclaim responsibility for any injury to people or property resulting from any ideas, methods, instructions or products referred to in the content.