Abstract
The climate of the Qinghai–Tibet Plateau is distinct. Given the large temperature difference between day and night, drought in perennial years, low rainfall and large evaporation volume, the frozen soil in some areas of the Qinghai–Tibet Plateau will occur in soil salt. The presence of salt in frozen soil salt changes the water thermal characteristics of the frozen soil, which will affect the changes in its activity layer. In this paper, the Beiluhe area of the Qinghai–Tibet Plateau was selected as the research object, and the numerical calculation model of water, heat and salt of salinised frozen soil was established. Considering the influence of salt crystallisation and salt on the freezing temperature of the active layer, the effects of different salt concentrations, water contents and salt type on the temperature of frozen soil and the thickness of the active layer were compared and analysed. Therefore, the salt of soil degenerates frozen soil under the action of sodium chloride and sodium sulphate, and the presence of sodium chloride and sodium sulphate is not conducive to the stability of frozen soil for many years. During soil salinisation, the content of sodium chloride in frozen soil increases; the temperature of permafrost initially decreases and then increases; the initial freezing time of the active layer is postponed in the freezing and cooling stages, the time when the water in the active layer with a salt concentration of 0.2–0.8% was delayed by 21, 32, 54 and 65 days; the temperature of the active layer decreases, which is the opposite in the thawing and heating stages, and the thickness of the active layer increases with the increase in salt concentration. During soil salinisation, the content of sodium sulphate in frozen soil increases; the freezing temperature of the active layer initially decreases and then increases and finally decreases, which is contrary to the temperature of the active layer in the warm season. The thickness of the active layer initially increases (with a maximum increase in 0.82 m) and then decreases and finally increases with the increase in salt concentration. The content of sodium sulphate in frozen soil has little effect on the initial freezing time of the active layer. High water content is conducive to the stability of permafrost. When the content of sodium chloride in frozen soil is constant, the water content increases; the temperature change of frozen soil is smaller; the temperature of the active layer in the warm season is lower; the thickness of the active layer is smaller, and the frozen soil tends to be more stable. When the content of sodium sulphate is constant, the increase in water content generally reduces the warm-season temperature of the active layer and the thickness of the active layer (−6 m the temperature of 30% and 40% water content in −6 m is 0.17 °C and 0.24 °C lower than that of 20% water content). However, analysis of the thickness of the active layer of the frozen soil containing sodium sulphate must combine the influence of water content and freezing temperature.
1. Introduction
The soil layer that freezes and thaws seasonally within a few meters of the surface layer above permafrost is known as the active layer [1]. The active layer is the main area for the exchange of surface–atmosphere energy and water between the permafrost and the external environment, which is sensitive to changes in the external environment. When the active layer freezes and thaws seasonally [2], the thermodynamic parameters of the soil change during the ice–water phase transition [3], resulting in changes in the temperature distribution of the frozen soil. Therefore, verifying the variation law and characteristics of the active layer is important when analysing the temperature field of frozen soil [4,5].
The maximum melting depth of permafrost at the end of the warm season is known as active layer thickness. The water and heat exchange between the active layer and external environment will lead to the change in the thickness of the active layer [6], which can reflect the water and heat condition of the active layer. The change in the water and heat condition of the active layer is an important condition to predict the thaw settlement of the roadbed in the permafrost region [7,8]. Consequently, analysing the factors [9] affecting the thickness of the active layer can provide a reference for the stability analysis of the permafrost roadbed.
There are many factors affecting the thickness of the active layer, which can be divided into external factors and internal factors. External factors can also be divided into climatic factors such as temperature [10], rainfall [11,12,13,14,15,16,17,18,19], snowfall [20] and environmental factors [21], such as vegetation type [22,23,24,25,26,27] and landform. Internal factors generally include soil type [28], water content [29], organic matter and other soil conditions; internal and external factors affect the thickness of the active layer [30]. Amongst the internal factors affecting the thickness of the active layer, the moisture content of the soil [31] greatly affects its thermodynamic properties [3,32]. On the one hand, the moisture content of the soil can delay the heat transfer of the active layer soil because of the high heat capacity of liquid water and the latent heat of phase change, which is conducive to the stability of permafrost [9]. On the other hand, after the water phase becomes ice, the thermal conductivity will also increase. Compared with the soil with lower water content, the heat conduction rate of the active layer with higher water content is faster. Clayton et al. [29] studied the effect of water content on the thickness of the active layer. The result showed that, when the water content increases under other conditions, the high heat capacity of water and the latent heat of phase change have a more evident effect on the changes in soil temperature than thermal conductivity, and it can also delay the freezing and thawing of the soil, making the permafrost more stable and reducing the thickness of the active layer.
Only few studies have been conducted on the influence of soil salinisation on the temperature change in frozen soil and its active layer by scholars at home and abroad. In the field investigation and experiment [7], the salt in the Beiluhe area of the Qinghai–Tibet Plateau is primarily sodium chloride and sodium sulphate [33], in which sodium chloride will change the freezing temperature of the soil and the initial freezing time and water phase variables of the active layer [34]. Sodium sulphate will precipitate and crystallise during freezing, thereby releasing heat, reducing the liquid water content of the active layer and changing the freezing temperature of the soil. Freezing affects the water content and temperature changes of the active layer, thereby affecting the changes in permafrost. Therefore, this paper takes water content, sodium chloride content and sodium sulphate content as variables to analyse the influence of the increase in sodium chloride and sodium sulphate content and high water content on frozen soil temperature and its active layer, which provides reference for the study of water and heat in frozen soil.
2. Hydrothermal Salt Model and Its Control Equation
Hydrothermal Salt Model
In this paper, the measured parameters of soil in the Beiluhe area of the Qinghai–Tibet Plateau [35] were selected, and the mass content and water content of NaCl and Na2SO4 in soil [33] were used as variables. Considering the crystallisation of salt and the influence of salt on the freezing temperature of active layer soil, the numerical calculation of water, heat and salt in saline frozen soil was carried out. The subgrade model is as shown in Figure 1: The height of the subgrade is 2 m; the slope is 1:1.5; the natural ground on both sides is 20 m, and the thickness of the soil layer below the subgrade is 30 m. Both sides of the model are thermal insulation boundaries. The soil parameters are shown in Table 1 and Table 2.
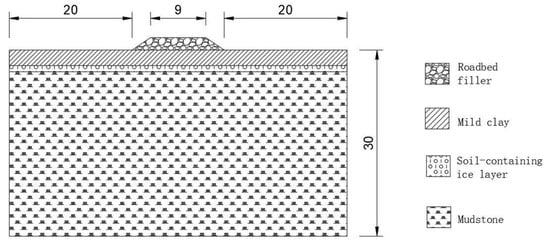
Figure 1.
Roadbed model.

Table 1.
Basic parameters of the soil layer.
Table 2.
Soil thermal parameters.
As shown in the table, B, α and n are constants, which are related to soil parameters; θr is the residual volumetric water content of soil; θs is the saturated volumetric water content of soil; Ks is the permeability coefficient of saturated soil, unit m/s.
The establishment of the subgrade model considers the boundary layer effect and simplifies the measured ground temperature in the Beiluhe area of the Qinghai–Tibet Plateau into a trigonometric function form. The temperature boundary conditions of the subgrade model [36] are as follows:
where T is the temperature, unit °C; t is the time, unit h.
Natural ground: T0 = −1.5 + 12sin(2πt/8760 + π/2)
Subgrade surface temperature: T1 = 1.5 + 15sin(2πt/8760 + π/2)
Slope temperature: T2 = 0.7 + 13sin(2πt/8760 + π/2)
Considering the influence of soil salinisation on frozen soil and its active layer, the model is simplified as follows:
- (1)
- The model calculation does not consider the impact of the main direction of wind, global warming, atmospheric warming and shady and sunny slope [37,38,39,40].
- (2)
- The salt concentration of the active layer is constant during calculation, namely the freezing temperature of the active layer is always equal to the initial freezing temperature; when the initial salt concentration is given, the initial concentration is the salt concentration calculated by the initial salt concentration, corresponding to the initial freezing temperature; in the initial field, the active layer has melted some salt; the frozen part does not contain salt; the thickness of the active layer increases; the salt concentration of the increased part is the initial salt concentration, and the freezing temperature of the increased part changes from 0 °C to the initial freezing temperature with the increase in salt.
- (3)
- The solubility of NaCl is large, and the change is small; thus, the precipitation of NaCl is not considered in the calculation process. NaCl only changes the freezing temperature, and it does not consider the effect of crystallisation. The solubility of Na2SO4 varies greatly with temperature, and the liquid water content in the soil decreases while releasing heat during precipitation. The change in freezing temperature and crystallisation are considered in the calculation process.
3. Control Equation of the Model
3.1. Temperature Field Control Equation
Based on the Fourier’s law, the ice-water phase transition is treated as a heat source, and the heat transfer equation of frozen soil is as follows [41]:
where ∇ is the operator; T is the soil temperature (°C); t is time (h); θi is the volume ice content in the pores; ρ and ρi are the soil density and ice density, respectively; Li is the latent heat of ice-water phase change; λ is the thermal conductivity W/(m · °C); C is the volume heat capacity J/(kg · °C).
3.2. Water Field Control Equation
Moisture migration in frozen soil follows Darcy’s law, and the differential equation of water migration is as follows [41]:
where θu is the volume content of unfrozen water in frozen soil; ρw is the density of water; ρi is the density of ice; D(θu) is the diffusivity of water; k(θu) is the permeability coefficient of thawed soil.
3.3. Hydrothermal Equation of Saline Soil
The hydrothermal equation of NaCl is not modified; Na2SO4 crystallises and releases heat. The latent heat of crystallisation is used as heat source. According to the law of conservation, the hydrothermal equation of Na2SO4 is modified as follows:
where θn is the volumetric salt concentration; ρn is the density of salt crystal (kg/m3), and Ln is the latent heat of salt crystal.
Na2SO4·10H2O and Na2SO4·7H2O are produced when Na2SO4 is crystallised. Na2SO4·7H2O is unstable; thus, only the formation of Na2SO4·10H2O is considered to simplify the calculation, and the water field equation of Na2SO4 is deduced as follows [42]:
where Mw is the molar molecular mass of the bound water in the salt crystal, and its value is 180; Mn is the molar molecular mass of the salt crystal with a value of 322 (g/mol).
3.4. Hydrothermal Contact Equation
Based on the experimental data [1], Xu Xuezu provided the following empirical formula of unfrozen water:
where Tf is the freezing temperature of soil (°C); W is the initial water content; Wu is the unfrozen water content at temperature T; B is the constant, which is a parameter related to the soil and is generally measured experimentally.
A ‘solid–liquid ratio’ is introduced to represent the ratio of pore ice volume to unfrozen water volume in frozen soil [41]:
The smoothing function H1 is expressed as follows:
The thermal conductivity and heat capacity of frozen soil are obtained by smooth step function H1:
where λf is the thermal conductivity of soil after being completely frozen; λu is the thermal conductivity of the soil after complete melting.
where Cf is the heat capacity of soil after being completely frozen; Cu is the heat capacity of soil after complete melting.
The function of Na2SO4 concentration changing with temperature is presented as follows:
where ηNa2SO4 is the saturated concentration at a certain temperature (mol/kg).
The concentration of Na2SO4 in soil C′ is expressed as follows:
where C0 is the initial salt concentration of soil (mol/kg).
Thus, the volumetric salt concentration of soil is presented as follows:
The thermal conductivity and heat capacity of the soil increase with the increase in water content, and the equivalent thermal conductivity is calculated by using the following empirical formula [43]:
where λeff is the equivalent thermal conductivity; θs is the volume content of soil particles; λs is the thermal conductivity of soil particles; θg is the volume content of air; λg is the thermal conductivity of air.
Soil heat capacity is calculated by using the following empirical formula [1]:
where Cs is the heat capacity of soil particles; Cw is the heat capacity of water; Ci is the heat capacity of ice; θ is the total water content.
4. Effect of Sodium Chloride Content on the Active Layer of Frozen Soil
Using the established model, the 30-year seasonal freeze–thaw calculation of the non-salt subgrade was carried out, and the maximum permafrost limit of the natural ground after 30 years was obtained at −2.04 m, which was consistent with the range of 2–3 m measured in the literature [35]. Therefore, the established model was considered reasonable.
4.1. Effect of Sodium Chloride Content on Frozen Soil Temperature
The freezing temperature of the curve refers to the conclusion of the Wan [44] laboratory test. As shown in Figure 2 [44]. Relationship between freezing temperature and salt concentration of sodium chloride solution., the freezing temperature decreases linearly with the increase in sodium chloride concentration, and the content of sodium chloride has a great influence on the freezing temperature. According to Zhang, the content of sodium chloride in the Qinghai–Tibet Plateau measured by Zhang [33] is between 0% and 1.5%. Thus, the salt concentration range of 0–1.0% is selected for calculation (Table 3).
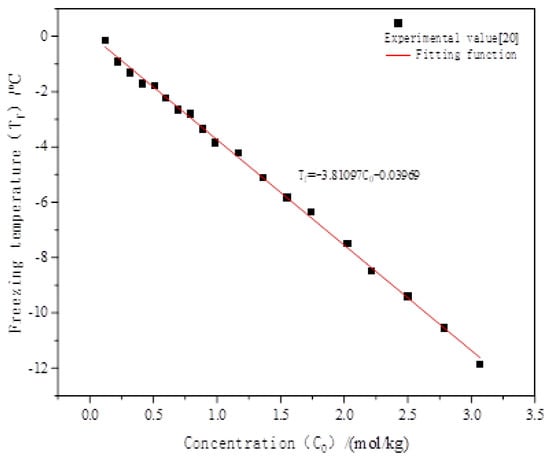
Figure 2.
Relationship between freezing temperature and salt concentration of sodium chloride solution [44].
Table 3.
Sodium chloride content and freezing temperature of each water content active layer.
As shown in Figure 3, non-salt roadbed (salt concentration 0.0%) is due to the heat absorption of asphalt pavement, which is relative to the natural ground. The permafrost temperature below the roadbed increased, −0.5 °C isotherm decreased to −2.89 m, −1 °C isotherm increased to −8.36 m below the natural ground, forming a high temperature groove below the roadbed. With the increase in NaCl content, the isotherm moved downwards; the high-temperature area developed downwards, and the temperature of frozen soil increased as a whole. When the salt concentration was 1.2%, the −0.5 °C isotherm decreased to 1.73 m, and the −1 °C isotherm decreased to 2.66 m.
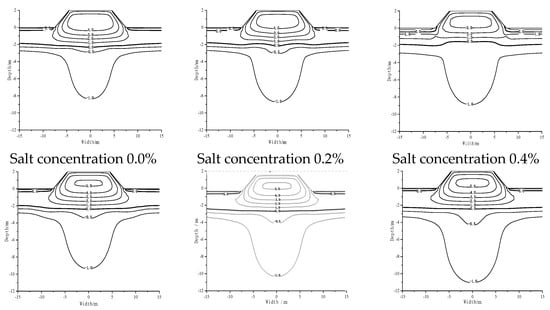
Figure 3.
Temperature distribution of subgrade with different contents of sodium chloride after 30 years on 1 October.
After 30 years, the subgrade temperature is stable. During the freeze–thaw process for 29–30 years, the temperature below the subgrade centre line changes with time (Figure 4). The freezing temperature of the non-salt subgrade (salt concentration 0.0%) is 0 °C. In the middle of November on the 28th year, the water in the active layer below the subgrade centre line began to freeze; at the beginning of February on the 29th year, the water in the active layer was completely frozen, and the freezing time lasted until the end of May on the 29th year. At this time, the external temperature began to rise, and the active layer began to melt from top to bottom. With the increase in NaCl content, the freezing temperature decreased, and the initial freezing time of the water in the active layer below the centre line of the subgrade was delayed. Compared with the initial freezing time of the unsalted frozen soil, the time when the water in the active layer with salt concentration of 0.2–0.8% was delayed by 21, 32, 54 and 65 days. The freezing temperature of the active layer with salt concentration of 1.0% was −5.5 °C, and the water was always in a liquid state. During freezing and cooling, the water in the active layer below the subgrade centre line begins to freeze, and the freezing depth increases with the downward movement of the freezing front.
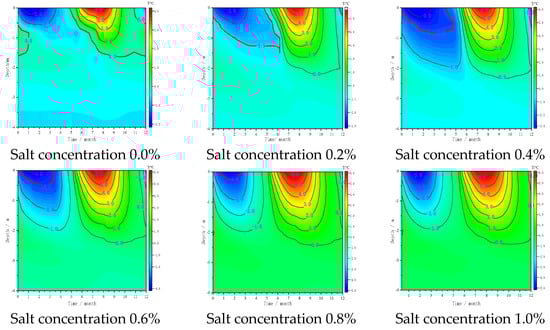
Figure 4.
Relationship between the temperature of the subgrade centre and time under different sodium chloride contents in 29–30 years.
During seasonal freezing and thawing, the freezing front of the non-salt subgrade continues to move down to the upper limit of the frozen soil, and the moisture of the active layer in the centre of the subgrade is completely frozen. The freezing temperature decreases with the increase in NaCl content, and an unfrozen melting interlayer is observed between the frozen part of the active layer and the permafrost. The higher the salt concentration, the greater the thickness of the melting interlayer. The thickness of the melting interlayer below the centre line of the active layer subgrade with salt concentration of 0.2% to 1.0% is 0.85, 1.49, 1.89, 2.16 and 2.43 m, respectively. The greater the thickness of the melting layer, the smaller the depth of seasonal freezing, and the less frozen water. During heating and melting, the lower the freezing temperature of the active layer, the earlier the initial melting time. At the end of May on the 29th year, the water of the active layer in the centre of the subgrade without salt frozen soil began to melt, and the time of the water of the active layer with 0.2–0.8% salt concentration began to melt 11, 22, 32 and 65 days in advance, whereas the water of the active layer with 1.0% salt concentration was always in a liquid state.
When the active layer contains salt, the subgrade temperature changes dramatically in zero–three years, slows down in 3–10 years, slows down in 10–25 years and reaches a stable trend in 25–30 years. In studying the influence of soil salinisation on subgrade temperature, analysis of 0–3 years with severe temperature change and 27–30 years with basically stable temperature at −1.6 m below the centre line of the subgrade (near the upper limit of the original frozen soil) was selected.
Figure 5a shows the temperature change of zero–three years at −1.6 m of the subgrade centre line under different sodium chloride contents. As shown in the figure, the salt-free subgrade after three years of seasonal freezing and thawing, subgrade centre −1.6 m temperature changes significantly, hovering around 0 °C. The highest temperature is 0.05 °C, and the lowest temperature is −0.46 °C. Compared with the frozen soil without salt, the temperature change range at −1.6 m increases with the increase in salt concentration, and the change range reaches the maximum when the salt concentration is 1.0%. The maximum temperature is 1.26 °C, and the minimum temperature is −1.84 °C. During freezing and cooling, the water phase of the active layer becomes ice, which releases a large amount of latent heat, reduces the temperature gradient of the active layer and delays the downward movement of the freezing front. The higher the salt concentration, the lower the freezing temperature, the less the water phase variable, the less the latent heat of the phase change released, and the faster the freezing front moves down. Therefore, when the active layer contains salt, the temperature of −1.6 m below the centre line of the subgrade begins to decrease with the decrease of the external temperature. The higher the salt concentration, the faster the temperature drop rate at −1.6 m. During melting and heating, the ice in the active layer began to absorb heat and melt, delaying the rate of melting front downward movement. The ice content decreased with the increase in salt concentration. In addition, the rate of melting front downward movement and the temperature at −1.6 m increased.
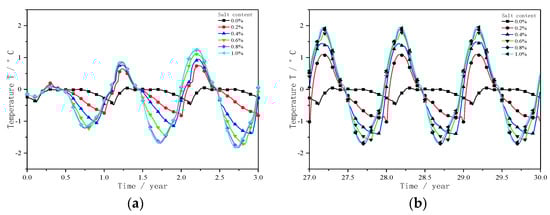
Figure 5.
Temperature change at −1.6 m of the subgrade centre line with different sodium chloride contents. (a) Temperature change in 0–3 years. (b) Temperature change in 27–30 years.
Figure 5b shows the temperature change of 27–30 years at −1.6 m of the subgrade centre line under different sodium chloride contents. As shown in the figure, after 27 years of seasonal freezing and thawing, the temperature at −1.6 m remained stable, and the minimum temperature was −0.46 °C. Compared to the non-salt subgrade, the lowest temperature of different salt concentrations in the centre of the subgrade at −1.6 m is −1.15 °C, −1.4 °C, −1.6 °C, −1.76 °C, −1.75 °C; the time to reach the lowest temperature at −1.6 m in the centre of the subgrade is 43, 80, 116, 156 and 157 days earlier than that of the non-salt frozen soil. During freezing and cooling, the temperature at −1.6 m in the centre of the subgrade generally decreases with the increase in salt concentration. The water in the active layer with 1.0% salt concentration does not freeze in the freezing stage, and the freezing depth of the active layer with 0.8% salt concentration is only 0.25 m. The water phase variables under the two salt concentrations are not different. Considering that the thermal conductivity of the freezing state is greater than the thermal conductivity of the melting state, the temperature of the salt concentration of 0.8% is slightly smaller than the temperature of the salt concentration of 1.0%; therefore, the salt concentration is 0.8% The minimum temperature value reached −1.6 m in the centre of the subgrade, which is smaller. From July to October of the 28th year, the temperature at −1.6 m in the centre of the subgrade began to increase. Given the influence of the latent heat of phase change of ice, the higher the salt concentration, the faster the rate of temperature increase. For the non-salt frozen soil, the ice melting heat absorption slows down the speed of the melting front downward because of the basic freezing of 0 to −1.6 m water. Therefore, in October of the 28th year, the temperature at −1.6 m reached the maximum value of 0.05 °C. Compared with the non-salt roadbed, the maximum temperatures of different salt concentrations at the centre of the roadbed −1.6 m are 1.1 °C, 1.5 °C, 1.8 °C, 1.9 °C and 2.0 °C. The soil at −1.6 m of the salt-containing frozen soil is always in a melting state. The thermal conductivity of the molten soil is the same. The time to reach the highest temperature is related to the temperature of the roadbed surface. The temperature of the roadbed surface is the same, and the time to reach the highest temperature is 43 days earlier than that of the non-salt frozen soil.
4.2. Effect of Sodium Chloride Content on the Permafrost Active Layer
Figure 6 shows the influence of different sodium chloride contents on the thickness of the active layer in the 30-year seasonal freeze–thaw period. As shown in the figure, during the 30-year seasonal freeze–thaw period, the thickness of the active layer increased at a greater rate in zero–five years. The increasing rate of active layer thickness decreases gradually from 5 to 20 years; the increase rate of active layer thickness in 20–30 years is basically stable. Compared with the thickness of the active layer without salt, the thickness of the active layer below the centre line of the salty subgrade increases, and the thickness of the active layer increases with the increase in the salt concentration when it reaches a stable state, with a maximum increase in 0.82 m. In addition, the increase rate of the thickness of the active layer during the whole freeze–thaw period increases with the increase in the salt concentration, reaching the maximum when the salt concentration is 1.0%. When the salt concentration is 0.8% and 1.0%, the difference in the thickness of the active layer is small because the freezing temperatures corresponding to the two salt concentrations are −4.4 °C and −5.5 °C. Therefore, the water in the active layer below the central line of the subgrade is frozen less or basically not frozen. Salinity changed the freezing temperature of the active layer soil; the salt concentration increased; the initial freezing time of the active layer water was delayed; the ice content decreased during freezing; the unfrozen water content increased; the latent heat of ice water phase change decreased, and the cold season temperature decreased. When the warm season melts, the ice content decreased, the temperature increases, and the active layer thickness increases.
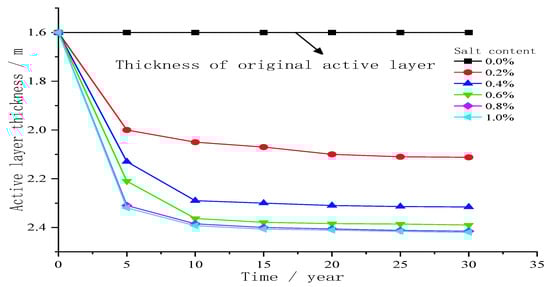
Figure 6.
Influence of different sodium chloride contents on the active layer thickness in the freeze–thaw season of 30 years.
5. Effect of Sodium Sulphate on the Active Layer of Frozen Soil
5.1. Effect of Sodium Sulphate Content on Frozen Soil Temperature
The relationship between the freezing temperature of Na2SO4 and the concentration of Na2SO4 is based on the experimental results of Reference [44]. As shown in Figure 7, the freezing temperature of Na2SO4 initially decreases, then increases and finally decreases with the increase in Na2SO4 concentration.
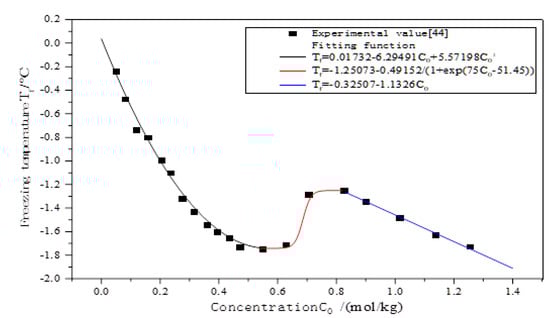
Figure 7.
Relationship between freezing temperature and concentration of Na2SO4.
The Na2SO4 content selected in the calculation is 0.2%, 0.5%, 1.0%, 1.5% and 2.1%. The freezing temperature selected when the salt concentration is 1.0% and 1.5% is near the two extreme points shown in Figure 7. The parameter values are shown in Table 4.
Table 4.
Salt concentration and freezing temperature of the active layer of sodium sulfate frozen soil with different water contents.
Figure 8 shows the temperature distribution of different sodium sulphate contents on October 1 after 30 years. As shown in the figure, the absence of salt roadbed (salt concentration of 0.0%) because of the endothermic effect of asphalt pavement, relative to the natural ground, subgrade permafrost temperature increase, 0 °C isotherm maximum down to −2.34 m, −1 °C isotherm maximum to −9.37 m below the natural ground, formed a high temperature groove below the roadbed. With the increase in salt concentration, the isotherm below the subgrade initially moves down, then increases and finally decreases. The 0 °C isotherm of different salt concentrations below the central line of the subgrade is located at −2.01, −2.10, −2.3, −2.19 and −2.37 m. The freezing temperature of Na2SO4 initially decreases, then increases and finally decreases with the increase in salt concentration. The lower the freezing temperature, the higher the temperature in the warm season. For the subgrade, frozen soil with the same freezing temperature, the higher the salt concentration, the greater the freezing depth. However, the increase is not evident because the precipitation of a small amount of Glauber’s salt crystal reduces the liquid water content when it is not frozen, and the water phase variable of the active layer during freezing is also reduced. The latent heat of water phase change hinders the downward movement of the freezing front, thereby increasing the freezing depth.
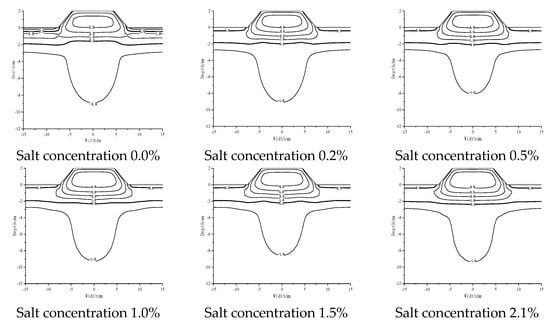
Figure 8.
Temperature distribution of frozen soil with different sodium sulphate contents on 1 October after the freeze–thaw season in 30 years.
After 30 years, the temperature of the roadbed is stable. The relationship between the temperature below the centre line of the roadbed and the time during the 29–30-year seasonal freezing and thawing is shown in Figure 9. The temperature of the active layer changes with the temperature of the external environment, particularly during cooling and freezing from January to June and during melting and warming from June to December. During cooling and freezing, the freezing temperature initially decreases, then increases and finally decreases with the salt concentration. The lower the freezing temperature, the greater the freezing depth and the delay of the initial freezing time of the saline frozen soil in the centre of the subgrade. Compared with the non-salt subgrade, the initial freezing time of the active layer of the saline frozen soil was delayed by 20, 27, 31, 27 and 30 days. Given the different freezing temperatures, the freezing depth of the active layer is also different during cooling and freezing. The freezing depth of the active layer initially decreases, then increases and finally decreases with the increase in salt concentration. The freezing depths below the subgrade centre line are 1.54, 1.20, 1.01, 1.26 and 1.08 m. When the freezing temperature of the saline subgrade is the same, such as the frozen soil with salt concentration of 0.5% and 1.5%, as well as 1.0% and 2.1%, the higher the salt concentration, the greater the freezing depth, but the increase is not evident. Considering that the precipitation of a small amount of mirabilite crystal decreases the liquid water content when it is not frozen, the water phase variable of the active layer decreases when it is frozen, and the phase change latent heat of water hinders the downward movement of the freezing front. The effect is weakened, resulting in an increase in the freezing depth.
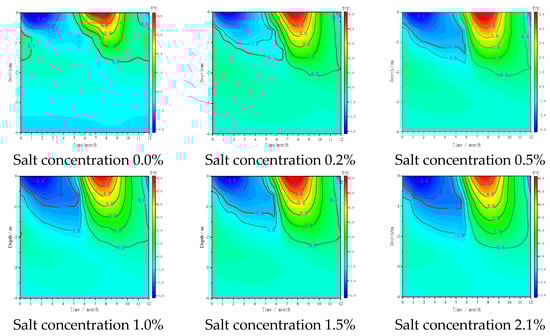
Figure 9.
Variation of temperature of the subgrade centre with time under different sodium sulphate contents during seasonal freezing–thawing period in 29–30 years.
5.2. Effect of Sodium Sulphate Content on the Permafrost Active Layer
Figure 10 shows the relationship between the thickness of the active layer with different sodium sulphate content and time. As shown in the figure, during the 30-year seasonal freeze–thaw period, the active layer thickness increased at a greater rate in 0–5 years; the increasing rate of active layer thickness in 5–15 years decreases gradually. The increasing rate of active layer thickness in 15–30 years is basically stable. Soil salinisation has a great influence on the thickness of the active layer. Compared with the thickness of the active layer without salt, the thickness of the active layer below the centre line of the subgrade with salt increases. When it reaches stability, the thickness of the active layer initially increases, then decreases and finally increases with the increase in salt concentration. The thickness of the active layer in the centre of the subgrade under different salt concentrations is 2.01, 2.10, 2.3, 2.19 and 2.37 m, respectively, which is 0.41, 0.50, 0.70, 0.59 and 0.77 m higher than the initial active layer thickness (1.6 m). When the salt concentration is 2.1%, the thickness of the active layer reaches the maximum, and the freezing temperature of the soil is the lowest. With the precipitation of Na2SO4, the liquid water content in the active layer decreases, and the latent heat of phase change of water decreases, thereby increasing the thickness of the active layer. During the whole freeze–thaw period, the increase rate of active layer thickness increases with the increase in salt concentration and reaches the maximum when the salt concentration is 2.1%.
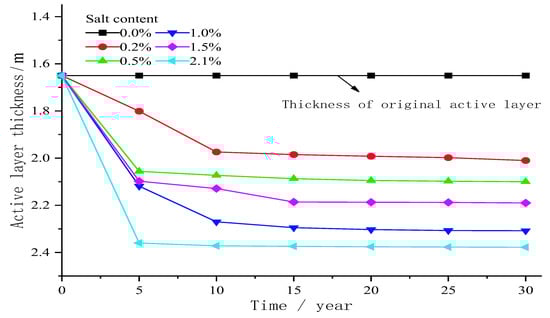
Figure 10.
Variation of active layer thickness with time under different sodium sulphate contents in seasonal freeze–thaw cycles in 30 years.
6. Influence of Water Content on the Active Layer of Frozen Soil
Yin Guoan [45] research shows that the Qinghai–Tibet Plateau, Beilu River area, have developed Xiushui River, Beilu River, Beilu River terraces, wide and shallow riverbed, river overflow and frequent diluvial in recent years, with increase in temperature and summer rainfall, resulting in the increased water content in the Beilu River area. The volumetric water content can reach up to about 50% [46]. The high heat capacity, high thermal conductivity and high phase change latent heat of water also affect the thickness of the active layer of frozen soil. Therefore, when analysing the influence of water content on the active layer of saline frozen soil, the water content of the active layer is increased to 30% and 40%. The temperature and active layer thickness of the frozen soil subgrade containing sodium chloride and sodium sulphate under different water contents are shown in Table 5 and Table 6, respectively.
Table 5.
Temperature and active layer thickness of the frozen soil subgrade containing sodium c.
Table 6.
Temperature and active layer thickness of the frozen soil subgrade containing sodium sulphate under different water contents.
6.1. Effect of Water Content on Frozen Soil Containing Sodium Chloride and Its Active Layer
Figure 11 shows the temperature change with depth of different water contents below the centre line of the frozen soil subgrade containing sodium chloride after 30 years. As shown in the figure, when the salt concentration is the same, the temperature of the active layer below the centre line of the subgrade decreases with the increase in water content (0 to −2 m). With the increase in depth, the temperature of different water contents has the same downward trend, and the rate of decline is the same. At −2 to −3 m, with the increase in depth, the temperature line begins to appear an inflection point, and the temperature change rate slows down. At −3 to −10 m, with the increase in depth, the temperature changes gradually. When the salt concentration is 0.2%, the temperature line of 0 to −2 m basically decreases in parallel. At −1 m, the temperature of 30% and 40% water content is 0.9 °C and 1.4 °C lower than that of 20% water content, respectively. At −2 to −3 m, the temperature drop rate change is intense because the melting state of the active layer and the thermal conductivity of permafrost is different. The thermal conductivity of different soil layers is also different, resulting in a change in the rate of temperature change. From −3 to −10 m, the trend of temperature change is the same, but the depth increases, and the temperature difference in water content decreases. Taking −6 m as an example, the temperature of 30% and 40% water content is 0.17 °C and 0.24 °C lower than that of 20% water content, respectively. When the salt concentration is 0.6% and 1.0%, with the increase in water content, the temperature change law of the active layer below the subgrade centre line is similar to that of the salt concentration of 0.2%. When the water content is the same, the temperature of the active layer below the subgrade centre line increases with the increase in salt concentration.
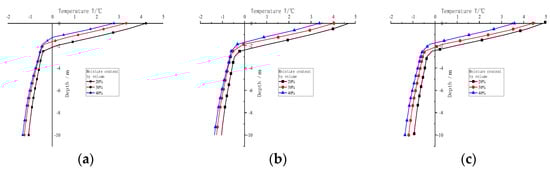
Figure 11.
Variation of temperature with depth on 1 October below the centre line of the subgrade with sodium chloride frozen soil after 30 years. (a) Salt concentration 0.2%. (b) Salt concentration 0.6%. (c) Salt concentration 1.0%.
Figure 12 shows the relationship between the thickness of the active layer of salty frozen soil in the subgrade centre line and time under different water contents. As shown in the figure, when the water content is the same, the thickness of the active layer in the centre of the subgrade increases with the increase in salt concentration. When the salt concentration is 1.0%, the thickness of the active layer reaches the maximum, and the corresponding active layer thickness is 2.43, 1.98 and 1.76 m. When the salt concentration is constant, the active layer thickness of the subgrade centre decreases with the increase in water content. When the salt concentration is high, such as 0.6%, 0.8% and 1.0%, the increase rate of the active layer thickness decreases because the active layer of water freezing decreases with the increase in salt concentration. The salt concentration continues to increase, and the freezing amount of the active layer water is less affected. Under the same conditions, the thickness of the active layer is inversely proportional to the amount of water freezing.
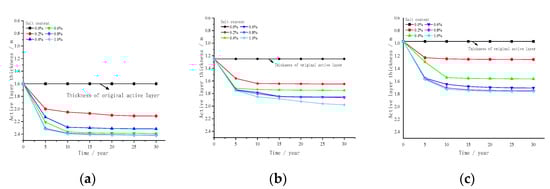
Figure 12.
Variation of active layer thickness of sodium chloride frozen soil in the subgrade centre line with time under different water contents. (a) Water content 20%, (b) Water content 30%, (c) Water content 40%.
6.2. Effect of Water Content on Sulphate-Bearing Frozen Soil and Its Active Layer
Figure 13 shows the relationship between temperature and depth on October 1 under different water contents after 30 years. As shown in the figure, the temperature of frozen soil decreases as a whole with the increase in water content. However, the temperature of frozen soil may change slightly because the freezing temperature of sodium sulphate changes nonlinearly with salt concentration. When the salt concentration is 1.0%, the temperature of frozen soil below the centre line of the subgrade decreases as a whole with the increase in water content, indicating that the increase in water content can promote the stability of permafrost. When the salt concentration is 1.5%, the temperature of 40% water content below the subgrade centre is always less than the temperature of 20% and 30% water content. However, the temperature of the active layer with 30% water content is greater than that with 20% water content, and the temperature of permafrost below the active layer is greater with 20% water content because the freezing temperatures of 20% and 30% water content are −1.3 °C and −1.7 °C, respectively, and the freezing temperature difference is 0.4 °C. In addition, the effect of freezing temperature on the active layer temperature is greater than the effect of water content increase on the active layer temperature. With regard to the permafrost, the greater the water content, the higher the latent heat of phase change that needs to be overcome for the temperature of the active layer to transfer downward. Therefore, compared with the temperature of 20% water content, the permafrost temperature of 30% water content is smaller. When the salt concentration is 2.1%, the temperature of 20% water content below the subgrade centre is always greater than that of 30% and 40% water content. However, the temperature of 30% and 40% water content is almost the same because the freezing temperatures of 30% and 40% water content are −1.3 °C and −1.6 °C, respectively. Compared with 30% water content, the freezing temperature of frozen soil with 40% water content decreases, whereas the water content increases. The effect of the two water contents on the frozen soil temperature offsets each other, resulting in almost the same temperature.
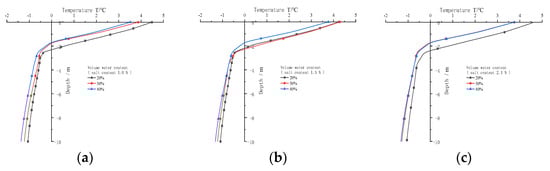
Figure 13.
Variation of temperature with depth on 1 October below the central line of the subgrade with sodium sulphate frozen soil after 30 years. (a) Salt concentration 1.0%. (b) Salt concentration 1.5%. (c) Salt concentration 2.1%.
Figure 14 shows the relationship between the thickness of the active layer of salty frozen soil in the subgrade centre line and time under different water contents. As shown in the figure, during the 30-year seasonal freeze–thaw period, the thickness of the active layer at the centre of the subgrade gradually increases with time. The increase rate of the active layer thickness is faster in 0–10 years, and the increase rate decreases in 10–20 years. Under the same water content, the active layer thickness of the subgrade centre with different salt concentrations initially increases, then decreases and increases again with the increase in salt concentration. When the water content is 20%, the active layer thickness of the subgrade centre under different salt concentrations is 2.01, 2.10, 2.30, 2.19 and 2.37 m. When the water content is 30%, the active layer thickness of different salt concentrations is 1.56, 1.62, 1.72, 1.81 and 1.66 m. When the water content is 40%, the active layer thickness of different salt concentrations is 1.23, 1.54, 1.65, 1.69 and 1.68 m. When the water content is constant, the thickness of the active layer in the centre of the subgrade initially increases, then decreases and increases again with the increase in salt concentration, which indicates that the increase in water content will not change the fact that the thickness of the active layer changes with the increase in sodium sulphate content.
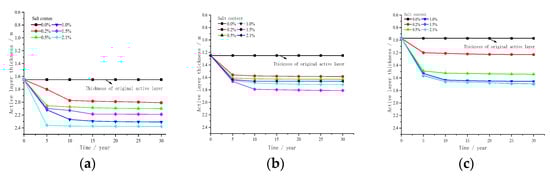
Figure 14.
Variation of active layer thickness of sodium sulphate frozen soil in the subgrade centre line with time under different water contents. (a) Water content 20%, (b) Water content 30%, (c) Water content 40%.
6.3. Effect of Water Content on Salinised Frozen Soil and Its Active Layer
As shown in Figure 12 and Figure 14, when the salt concentration is constant, the increase in water content of frozen soil containing sodium chloride will stabilise the frozen soil, that is, the greater the water content, the smaller the temperature change of frozen soil, the lower the temperature of the active layer in the warm season, and the smaller the thickness of the active layer. In general, the increase in water content in frozen soil containing sodium sulphate decreases the warm season temperature of the active layer and the thickness of the active layer. However, the freezing temperature of sodium sulphate does not change linearly with the increase in concentration, and the freezing temperature of the active layer of the frozen soil containing sodium sulphate decreases with the increase in water content. Furthermore, the thickness of the active layer changes slightly under the combined action of the two variables.
7. Conclusions
- (1)
- During salinisation of frozen soil, sodium chloride changed the temperature of frozen soil, freezing and thawing time and the thickness of the active layer, resulting in the degradation of permafrost, which is not conducive to the stability of permafrost. In the 30 years of seasonal freezing and thawing, the temperature of permafrost initially decreases and then increases with the increase in sodium chloride concentration (The temperature of permafrost is the highest when the salt concentration is 1.0%). However, with the increase insodium chloride concentration, when the water in the active layer freezes less or basically does not freeze, the continuous increase in sodium chloride concentration has little effect on the temperature change of the active layer. During freezing and cooling of frozen soil, the higher the sodium chloride concentration, the later the initial freezing time of the active layer, the less the phase variable of water, and the lower the temperature of the active layer, which are contrary to the the melting and heating stages. Compared with the frozen soil subgrade without salt, the maximum difference of the thickness of the active layer in the centre of the subgrade is 0.83 m, and the thickness of the active layer increases with the increase in sodium chloride concentration, reaching the maximum when the salt concentration is 1.0%.
- (2)
- During permafrost salinisation, sodium sulphate can also affect permafrost and its active layer changes, resulting in permafrost degradation. During the 30-year seasonal freezing and thawing, the concentration of sodium sulphate in frozen soil increased, and the crystallisation of sodium sulphate initially decreased the freezing temperature of the active layer, then increased and finally decreased, which is contrary to the temperature of the active layer in the warm season. The concentration of sodium sulphate in frozen soil has little effect on the initial freezing time of the active layer. Compared with the subgrade without salt, the thickness of the active layer in the centre of the subgrade initially increases, then decreases and finally increases with the increase in sodium sulphate concentration, and it reaches the maximum active layer thickness of 2.39 m when the salt concentration is 2.1%. The crystallisation effect of sodium sulphate on the temperature field of salty frozen soil cannot be ignored. When the concentration of sodium sulphate is different and the freezing temperature is the same, such as the frozen soil with salt concentration of 1.0% and 2.1%, the higher the concentration of sodium sulphate, the greater the precipitation of mirabilite, the higher the temperature of the active layer in the warm season, and the greater the thickness of the active layer.
- (3)
- The effect of different water contents on the change of frozen soil and its active layer cannot be ignored. In the 30 years of seasonal freezing and thawing, when the frozen soil contains sodium chloride, under the same salt concentration, the water content increases; the temperature change range of the frozen soil decreases; the temperature of the active layer in the warm season decreases; the thickness of the active layer decreases, and the frozen soil tends to stabilise. When the sodium chloride concentration is 1.0%, the thickness of the active layer with 20% water content below the centre line of the subgrade is 0.67 m thicker than that with 40% water content, indicating that high water content can promote the stability of the permafrost. When the frozen soil contains sodium sulphate, under the same salt concentration, the increase in water content decreases the warm season temperature of the active layer and the thickness of the active layer. However, the freezing temperature of sodium sulphate does not change linearly with the increase in concentration. For example, when the salt concentration is 0.83 mol/kg, the water content increases, and the freezing temperature of the active layer containing sodium sulphate decreases. Under the combined action of the two variables, the thickness of the active layer changes slightly. Therefore, when analysing the thickness of the active layer of the frozen soil containing sodium sulphate, the effects of water content and freezing temperature must be combined.
- (4)
- In order to simplify the calculation, this paper ignores the influence of subgrade wind direction, shady and sunny slope effect, organic carbon content and other factors on the active layer of salinized frozen soil. Considering these variables in the subsequent research will make the model closer to the actual project. At the same time, the analysis from the perspective of soil chemical properties may make the conclusion more reasonable.
Author Contributions
Conceptualization, Z.Z.; methodology, G.H.; software, G.H. and C.G.; validation, G.H. and C.G.; formal analysis, G.H.; investigation, G.H. and C.G.; resources, Z.Z.; data curation, G.H., C.G. and G.L.; writing—original draft preparation, G.H.; writing—review and editing, Z.Z.; visualization, G.H.; supervision, Z.Z.; project administration, Y.H. and T.F.; funding acquisition, Y.H. and T.F. All authors have read and agreed to the published version of the manuscript.
Funding
The research described in this paper was financially supported by 2020D01C025.
Data Availability Statement
The data used to support the findings of this study are included within the article.
Conflicts of Interest
The authors declare no conflict of interest.
References
- Xu, X. Physics of Frozen Soil; Science Press: Beijing, China, 2001. [Google Scholar]
- Zhao, L.; Cheng, G.; Li, S.; Zhao, X.; Wang, S. Permafrost active layer near Wudaoliang of Qinghai-Tibet Plateau. Chin. Sci. Bull. 2000, 45, 1205–1211. [Google Scholar]
- Li, R.; Zhao, L.; Ding, Y.-J.; Jiao, K.-Q.; Wang, Y.-X.; Qiao, Y.-P.; Du, E.-J.; Liu, G.-Y.; Sun, L.-C.; Xiao, Y. A Study on Soil Thermodynamic Characteristics of Active Layer in Northern Tibetan Plateau. J. Geophys. Chin. Ed. 2010, 53, 1060–1072. [Google Scholar] [CrossRef]
- Wang, Q.; Jin, H.; Zhang, T.; Wu, Q.; Cao, B.; Peng, X.; Wang, K.; Li, L. Active layer seasonal freeze-thaw processes and influencing factors in the alpine permafrost regions in the upper reaches of the Heihe River in Qilian Mountains. Chin. Sci. Bull. 2016, 61, 2742–2756. [Google Scholar] [CrossRef]
- Du, R.; Peng, X.; Jin, H.; Wei, Q.; Sun, W.; Jia, S.; Fan, C.; Wang, K.; Wei, S.; Zhao, Y.; et al. Comparative Study on Active Layer Depth Differences between Hummocks and Thermokarst Depressions in the Eboling Area of the Qilian Mountains. J. Glaciol. Geocryol. 2022, 44, 188–202. [Google Scholar]
- Wu, Q.; Zhang, T. Changes in Active Layer Thickness over the Qinghai-Tibetan Plateau from 1995 to 2007. J. Geophys. Res. Atmos. 2010, 115, D09107. [Google Scholar] [CrossRef]
- Cheng, G.; MA, W. Frozen Soil Engineering Problems in Construction of the Qinghai-Tibet Rail way. Chin. J. Nat. 2006, 28, 315–320. [Google Scholar]
- Chai, M.; Mu, Y.; Zhang, J.; Ma, W.; Liu, G.; Chen, J. Characteristics of Asphalt Pavement Damage in Degrading Permafrost Regions: Case Study of the Qinghai-Tibet Highway, China. J. Cold Reg. Eng. 2018, 32, 05018003. [Google Scholar] [CrossRef]
- Liu, W.; Xie, C.; Zhao, L.; Wu, T.; Li, R.; Wang, W.; Qiao, Y. Simulating the Active Layer Depth and Analyzing Its Influence Factors in Permafrost of the Mahan Mountain, Lanzhou. J. Glaciol. Geocryol. 2015, 37, 1443–1452. [Google Scholar]
- Wang, S.; Zhao, X. Analysis of the Ground Temperatures Monitored in Permafrost Regions on the Tibetan Plateau. J. Glaciol. Geocryol. 1999, 21, 351–356. [Google Scholar]
- Zhang, M.; Wen, Z.; Dong, J.; Wang, D.; Hou, Y.; Wang, B.; Guo, Z.; Wei, H. Mechanism of Climate Warming on Thermal-Moisture Dynamics of Active Permafrost Layer Considering Effect of Rainfall. Rock Soil Mech. 2019, 40, 1983–1992. [Google Scholar]
- Zhu, X.; Wu, T.; Zhao, L.; Yang, C.; Zhang, H.; Xie, C.; Li, R.; Wang, W.; Hu, G.; Ni, J.; et al. Exploring the Contribution of Precipitation to Water within the Active Layer during the Thawing Period in the Permafrost Regions of Central Qinghai-Tibet Plateau by Stable Isotopic Tracing. Sci. Total Environ. 2019, 661, 630–644. [Google Scholar] [CrossRef] [PubMed]
- Zhang, M.; Wen, Z.; Xue, K.; Chen, L.; Li, D. The Effects of Precipitation on Thermal-Moisture Dynamics of Active Layer at Beiluhe Permafrost Region. J. Arid. Land Resour. Environ. 2016, 30, 159–164. [Google Scholar]
- Li, D.; Wen, Z.; Zhang, M.; Xue, K.; Chen, L.; Gao, Q. The Quantitative Analysis of the Hydro-Thermal Dynamic of Permafrost Active Layer Effected by Precipitation. J. Arid. Land Resour. Environ. 2017, 31, 108–113. [Google Scholar]
- Wen, Z.; Niu, F.; Yu, Q.; Wang, D.; Feng, W.; Zheng, J. The Role of Rainfall in the Thermal-Moisture Dynamics of the Active Layer at Beiluhe of Qinghai-Tibetan Plateau. Environ. Earth Sci. 2014, 71, 1195–1204. [Google Scholar] [CrossRef]
- Douglas, T.A.; Turetsky, M.R.; Koven, C.D. Increased Rainfall Stimulates Permafrost Thaw across a Variety of Interior Alaskan Boreal Ecosystems. NPJ Clim. Atmos. Sci. 2020, 3, 28. [Google Scholar] [CrossRef]
- Zhou, Z.-X.; Zhou, F.-X.; Zhang, M.-L.; Lei, B.-B.; Ma, Z. Effect of Increasing Rainfall on the Thermal-Moisture Dynamics of Permafrost Active Layer in the Central Qinghai-Tibet Plateau. J. Mt. Sci. 2021, 18, 2929–2945. [Google Scholar] [CrossRef]
- Zhirkov, A.; Permyakov, P.; Wen, Z.; Kirillin, A. Influence of Rainfall Changes on the Temperature Regime of Permafrost in Central Yakutia. Land 2021, 10, 1230. [Google Scholar] [CrossRef]
- Zhang, M.; Wen, Z.; Dong, J.; Wang, D.; Yue, G.; Wang, B.; Gao, Q. Response of Hydrothermal Activity in Different Types of Soil at Ground Surface to Rainfall in Permafrost Region. Rock Soil Mech. 2020, 41, 1549–1559. [Google Scholar]
- Zhang, W.; Zhou, J.; Wang, G.; Wolfgang, K.; Cheng, G.; Ye, B.; He, X.; Li, H. Monitoring and Modeling the Influence of Snow Cover and Organic Soil on the Active Layer of Permafrost on the Tibetan Plateau. J. Glaciol. Geocryol. 2013, 35, 528–540. [Google Scholar]
- Xu, X.; Wu, Q.; Zhang, Z. Responses of Active Layer Thickness on the Qinghai-Tibet Plateau to Climate Change. J. Glaciol. Geocryol. 2017, 39, 1–8. [Google Scholar]
- Chang, X.; Jin, H.; Wang, Y.; Zhang, Y.; Zhou, G.; Che, F.; Zhao, Y. Influences of Vegetation on Permafrost: A Review. Acta Ecol. Sin. 2012, 32, 7981–7990. [Google Scholar] [CrossRef]
- Liu, G.-S.; Wang, G.-X.; Hu, H.-C.; Li, T.-B.; Wang, J.-F.; Ren, D.-X.; Huang, Y.-J. Influence of Vegetation Coverage on Water and Heat Processes of the Active Layer in Permafrost Regions of the Tibetan Plateau. J. Glaciol. Geocryol. 2009, 31, 89–95. [Google Scholar]
- Wang, G.; Liu, L.; Liu, G.; Hu, H.; Li, T. Impacts of Grassland Vegetation Cover on the Active-Layer Thermal Regime, Northeast Qinghai-Tibet Plateau, China. Permafr. Periglac. Process. 2010, 21, 335–344. [Google Scholar] [CrossRef]
- Luo, D.; Jin, H.; He, R.; Yang, S. Responses of Surface Vegetation on Soil Temperature and Moisture of the Active Layer in the Source Area of the Yellow River. Earth Sci. 2014, 39, 421–430. [Google Scholar]
- Chang, X.; Jin, H.; Yu, S.; Sun, H.; He, R.; Luo, D.; Sun, G.; Lv, L. Influence of Vegetation on Frozen Ground Temperatures the Forested Area in the Da Xing’anling Mountains, Northeastern China. Acta Ecol. Sin. 2011, 31, 5138–5147. [Google Scholar]
- Guo, W.; Liu, H.; Anenkhonov, O.A.; Shangguan, H.; Sandanov, D.V.; Korolyuk, A.Y.; Hu, G.; Wu, X. Vegetation Can Strongly Regulate Permafrost Degradation at Its Southern Edge through Changing Surface Freeze-Thaw Processes. Agric. For. Meteorol. 2018, 252, 10–17. [Google Scholar] [CrossRef]
- Du, Y.; Li, R.; Wu, T.; Xie, C.; Xiao, Y.; Hu, G.; Wang, T. Study of Soil Thermal Conductivity: Research Status and Advances. J. Glaciol. Geocryol. 2015, 37, 1067–1074. [Google Scholar]
- Clayton, L.K.; Schaefer, K.; Battaglia, M.J.; Bourgeau-Chavez, L.; Chen, J.; Chen, R.H.; Chen, A.; Bakian-Dogaheh, K.; Grelik, S.; Jafarov, E.; et al. Active Layer Thickness as a Function of Soil Water Content. Environ. Res. Lett. 2021, 16, 055028. [Google Scholar] [CrossRef]
- Akerman, H.J.; Johansson, M. Thawing Permafrost and Thicker Active Layers in Sub-Arctic Sweden. Permafr. Periglac. Process. 2008, 19, 279–292. [Google Scholar] [CrossRef]
- Gao, Z.; Wang, Y.; Liu, G.; Liu, M.; Luo, J.; Yin, J. Response of Soil Moisture within the Permafrost Active Layer to Different Alpine Ecosystems. J. Glaciol. Geocryol. 2014, 36, 1002–1010. [Google Scholar]
- Narita, K.; Harada, K.; Saito, K.; Sawada, Y.; Fukuda, M.; Tsuyuzaki, S. Vegetation and Permafrost Thaw Depth 10 Years after a Tundra Fire in 2002, Seward Peninsula, Alaska. Arct. Antarct. Alp. Res. 2015, 47, 547–559. [Google Scholar] [CrossRef]
- Zhang, W.; Zhang, W. Study on salty characteristics and distribution of saline soil in Qinghai-Xizang Plateau. Geotech. Eng. World 2004, 10, 74–76. [Google Scholar]
- Liu, G.; Xie, C.; Yang, S. Spatial and Temporal Variation Characteristics on the Onset Dates of Freezing and Thawing of Active Layer and Its Influence Factors in Permafrost Regions along the Qinghai-Tibet Highway. J. Glaciol. Geocryol. 2018, 40, 1067–1078. [Google Scholar]
- Zhang, M.; Wen, Z.; Xue, K.; Chen, L.; Li, D.; Gao, Q. Temperature and Deformation Analysis on Slope Subgrade with Rich Moisture of QinghaiTibet Railway in Permafrost Regions. Chin. J. Rock Mech. Eng. 2016, 35, 1677–1687. [Google Scholar]
- Yu, J. Study on Stability of Railway Subgrade in Permafrost Regions of Qinghai-Tibet Plateau. Master’s Thesis, Shijiazhuang Tiedao University, Shaoxing, China, 2018. [Google Scholar]
- Sheng, Y.; Ma, W.; Wen, Z.; Zhang, M. Analysis Of Difference In Thermal State Between South Faced Slope And North Faced Slope Of Railway Embankment In Permafrost Region. Chin. J. Rock Mech. Eng. 2005, 24, 3197–3201. [Google Scholar]
- Lan, A.; Lin, Z.; Fan, X.; Yao, M. Differences of Surface Energy and Shallow Soil Temperature and Humidity at Sunny and Shady Slopes in Permafrost Region, Beiluhe Basin, Qinghai-Tibet Plateau. Adv. Earth Sci. 2021, 36, 962–979. [Google Scholar]
- Chen, L.; Lai, Y.; Fortier, D.; Harris, S.A. Impacts of Snow Cover on the Pattern and Velocity of Air Flow in Air Convection Embankments of Sub-Arctic Regions. Renew. Energy 2022, 199, 1033–1046. [Google Scholar] [CrossRef]
- Chen, L.; Yu, W.; Zhang, T.; Yi, X. Asymmetric Talik Formation beneath the Embankment of Qinghai-Tibet Highway Triggered by the Sunny-Shady Effect. Energy 2023, 266, 126472. [Google Scholar] [CrossRef]
- Bai, Q.; Li, X.; Tian, Y.; Fang, J. Equations and numerical simulation for coupled water and heat transfer in frozen soil. Chin. J. Geotech. Eng. 2015, 37, 131–136. [Google Scholar]
- Zhang, S.; Ye, S.; Zhang, L.; Yang, X.; Chen, W. Correction of Hydrothermal Salt Force Coupled Equations for Coarse-Grained Sulphate Saline Soil Roadbed and Its Experimental Verification. J. Highw. Transp. Res. Dev. 2020, 37, 31–40. [Google Scholar]
- Zhang, M.; Lu, J.; Lai, Y.; Zhang, X. Variation of the Thermal Conductivity of a Silty Clay during a Freezing-Thawing Process. Int. J. Heat Mass Transf. 2018, 124, 1059–1067. [Google Scholar] [CrossRef]
- Wan, X. Experimental Study on Salt Crystal Precipitation, Salt Migration and Anti-Salt Expansion of Subgrade in Cold Region of Sulfate Saline Soil. Ph.D. Thesis, University of Chinese Academy of Sciences, Beijing, China, 2015. [Google Scholar]
- Yin, G. Study on the Characteristics of Permafrost and Its Response to Climate Change in Beiluhe Basin of Qinghai-Tibet Plateau. Ph.D. Thesis, University of Chinese Academy of Sciences, Beijing, China, 2017. [Google Scholar]
- Jin, X. Inversion of Soil Water Content Based on Sentinel-1A and Landsat-8 OLI Images—Beiluhe of Northern Tibet. Master’s Thesis, China University of Geosciences, Beijing, China, 2019. [Google Scholar]
Disclaimer/Publisher’s Note: The statements, opinions and data contained in all publications are solely those of the individual author(s) and contributor(s) and not of MDPI and/or the editor(s). MDPI and/or the editor(s) disclaim responsibility for any injury to people or property resulting from any ideas, methods, instructions or products referred to in the content. |
© 2023 by the authors. Licensee MDPI, Basel, Switzerland. This article is an open access article distributed under the terms and conditions of the Creative Commons Attribution (CC BY) license (https://creativecommons.org/licenses/by/4.0/).