Abstract
Hydrometeorological hazards are considered the most important phenomena affecting crop production in the Eastern regions of Mexico, where the State of Veracruz is located. However, more information about their consequences on these sites needs to be studied. This research aims to determine the effects of hydrometeorological phenomena on the most important crops cultivated in the State of Veracruz. The methodology involved analyzing the State’s crop production database from 2001 to 2020 and comparing this data with the National Hydrometeorological Disaster Declarations database. Multivariable correlation analysis and geographic information systems were applied to geographically analyze 42 rainfed crops plus the five most valuable ones in the State to determine their production related to climatic phenomena. The results found that the most affected crops are corn, soy, sorghum, beans, and rice, with more than 10,000 lost hectares. Droughts caused total damage to corn, soy, and beans and decreased productivity in corn, orange, lemon, wheat, coffee, and sesame. For the most valuable crops, tropical cyclones caused the highest production decrements in corn, sugar cane, and pineapple, while droughts caused the same effects in lemon and orange. We conclude that tropical cyclones are the most critical phenomena negatively impacting Veracruz, with high implications on the agrifood system.
1. Introduction
Agricultural activities depend highly on weather, climate, and land to thrive. Thus, they are particularly vulnerable to natural disasters. According to the Food and Agriculture Organization of the United Nations (FAO) [1], from 2005 to 2015, USD 22 billion were lost due to crop and livestock production declines in Latin America and the Caribbean following natural disasters. In this region, droughts caused the highest production loss proportion, with 30%, followed by storms, with 20%. The most affected crops were legumes, with almost USD eight billion in losses. However, this situation may vary depending on the place and the type of phenomenon causing them [2]. For example, specifically in the Caribbean countries, hurricanes are the primary problem, which may cause up to 34% of crop losses [3]. Furthermore, in temperate or cold sites, frost can cause significant damage to agricultural products [2].
Additionally, determining vulnerabilities in agriculture is difficult because the level of damage caused by hydrometeorological phenomena depends on the crops. For example, hurricanes affect agricultural products differently, with fruits, vegetables, and oily crops being the most adversely affected, while nuts and root crops are not significantly affected by hurricanes [3]. On the other hand, heat waves and excessive humidity cause more damage to root crops in temperate regions [2].
Apart from the meteorological phenomena, the type of agriculture the farmers apply, irrigated (open or in greenhouses) or rainfed, may pose different challenges to the crops. The latest data published by the FAO indicates that rainfed production covers about 80% of the global cropland [4]. In Mexico, 60% of agricultural land is rainfed [5]. Rainfed agriculture consists of planting crops based on the rainy seasons. Thus, these crops depend on the continuity of the regional climatic conditions, the producer’s knowledge of sown periods, and the more suitable crops for each period [6,7]. Under these conditions, Mexico has two productive cycles: autumn–winter and spring–summer. During these cycles, seasonal and perennial crops can be sown [5].
Veracruz, a state located on the eastern side of Mexico, is a leader in agricultural production in the country. This State holds first place in the production of sugar cane, pineapple, grapefruit, and orange; second place in coffee, tobacco, and lemon; and third place in pear and banana. Veracruz is also within the first ten states with the highest production volume of papaya, watermelon, sesame, rice, beans, mango, and apple [8]. However, in Veracruz, the percentage of rainfed agriculture is higher than the national average, with 91% of cropland being rainfed [5], which increases its vulnerability to diverse hydrometeorological phenomena. In addition, the geographical conditions in the State of Veracruz, along the coasts of the Mexican Gulf, with a surface of 745 km oriented from north to south and elevation gradients from zero to 5600 m above sea level [9,10], provide this State with an extensive climatic variety [11]. The different climatic conditions of Veracruz allow the cultivation of 94 vegetal species, of which about 42 are rainfed crops [5].
Nevertheless, every year the State of Veracruz is subjected to several meteorological hazards, such as tropical cyclones, hailstorms, coastal storm surges, floods, flash floods, droughts, heat waves, and cold spells [10,11]. As a result, Veracruz is the Mexican State with more disaster occurrences in Mexico [12]. These hazards are registered by the Mexican National System of Disaster Declarations (CENAPRED) [13] when they cause considerable losses to the State’s primary activities or human systems. For example, in the agricultural sector, a disaster declaration (DD) declares that a phenomenon was of such magnitude that it caused severe losses in the farming systems of the region. Therefore, the federal government must provide economic and logistical support [14]. For this reason, this disaster data is stored in public registers that anyone can consult [15].
In this context, the Intergovernmental Panel on Climate Change (IPCC) [16] and several independent studies indicate that climate change may generate more extreme events, such as higher-category tropical cyclones and more frequent floods [17], more intense droughts [18], and extreme temperatures [12]. However, countries such as Mexico are deficient in climatic monitoring in-site infrastructure [19], which makes it more difficult to predict the impacts of these phenomena at a regional or local level.
Nevertheless, with the CENAPRED database, we can establish that in Veracruz, 20 years of historical records indicate that the hazards causing more declarations are heavy rains, tropical cyclones, and floods, followed by droughts. During this period, heavy rains generated 120 DD yearly, followed by 78 by tropical storms, 15 by floods, and 11 by droughts [15]. However, an analysis of each specific phenomenon and its impact on the agricultural sector has not yet been estimated.
The National Service of Agrifood (SIAP) records agricultural statistics [5]. Currently, each crop data is considered independently from the others. Moreover, the system only documents the total damaged surface without its associated disaster to report damaged crops. Therefore, the hazard type and its relationships with specific crops are unknown, as is the pattern of these disasters in particular regions of the State. For example, previous research in the central part of the State found that corn is particularly vulnerable to droughts, with up to 48% losses due to this phenomenon [20]. However, there is no information about the other phenomena, nor other crops and their behavior in the State’s southern and northern regions, as there are no multiple crop studies with different hydrometeorological phenomena in the country. Besides this problem, some municipalities in the State have no meteorological information; the equipment is old, or data are not updated [19], thus making it very difficult to determine which phenomena are impacting the crops in specific sites. Therefore, other sources containing meteorological phenomena-related information, such as the disaster statistics provided by the CENAPRED, should be considered to analyze climatic effects on the agrifood systems.
A thorough analysis of the impacts of hydrometeorological phenomena on the existing trends in agricultural production is a crucial starting point for breaking the information gap and contributing to a decision-making tool based on facts. This analysis is even more critical for rainfed agriculture [21] since it contributes to the highest food production in the world [22], Mexico, and especially Veracruz [8]. Therefore, DD records could be a valuable tool to link hydrometeorological hazards with productive crop values, especially when they register decrements or losses. Furthermore, these records can be used because each DD was issued to support one specific municipality, stating the hydrometeorological phenomenon that caused the damage and the year it happened. At the same time, detailed crop statistics are reported by year and by site. Thus, we can establish relationships between DDs and productive data at a municipal level.
The use of socioeconomic governmental statistics to analyze meteorological hazards could also be replicated in other regions of the country or the world, especially in developing countries, where in-site climatic information is missing [19,23], and only catastrophic data are registered at a community level.
This research aims to use governmental databases to investigate the hydrometeorological phenomena occurring in the State of Veracruz and their relationship with the total crop production of the 42-rain feed crops available in the State’s statistics plus the five most valuable cultivars during 20 years (2001–2020) to determine which phenomenon causes the most significant damage and the most affected crops.
2. Materials and Methods
2.1. Study Region
Veracruz’s State is located on the central part of the Mexican Gulf (22°28′ N, 17°09′ S and 93°36′ E, 98°39′ W). This territory has an extension of 71,815 km2. On the State’s east, north, and south, two extensive plains are interrupted by geographical accidents (Figure 1a). In the north of the State, there are two mountain ranges: Tantima and Ototepec (20° and 21° N), with heights up to 1200 m above sea level (masl); at the center of the State, there is the eastern mountain chain (18° and 19° N), with peaks up to 5470 masl; and at the south of the State, the Los Tuxtlas mountain range is located, with heights up to 1750 masl [24,25]. Due to this orography and geographic location, the State of Veracruz has a wide climatic diversity (Figure 1b). Nevertheless, according to the Köppen–Geiger climate classification, 53% of the territory’s climate is warm sub-humid (Aw); 41% is warm-humid (Am), 3.5% has humid temperate climates, and the other percentage has temperate, semi-dry and dry climates [24].
Veracruz is divided into 212 local governmental units (municipalities), each headquartered in a prominent city or town administratively autonomous from the State. Although their land extension is diverse, the largest municipality has 3508.9 km2, and the smallest has only 4.60 km2 [26].
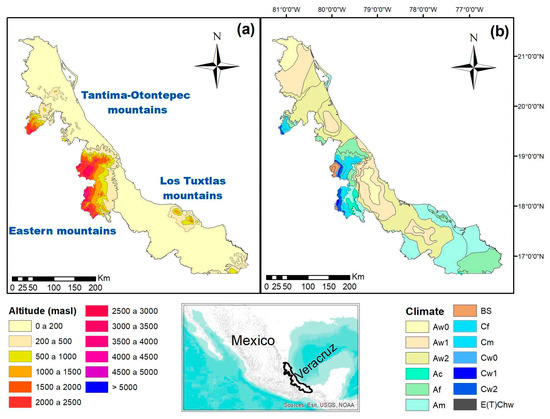
Figure 1.
Location of the State of Veracruz in Mexico; (a) altitude and (b) Köppen climate types in the territory. Sources: maps created with data from the National Institute of Statistics and Geography [24] and the National Commission for Knowledge and Use of Biodiversity [27].
2.2. Hydrometeorological Hazards Statistics
This study considered the disaster declarations (DD) caused by hydrometeorological hazards because they indicate the occurrence of each specific phenomenon affecting productive activities by municipality and year. This information was obtained from the Mexican National Center to Prevent Disasters (CENAPRED) [15]. CENAPRED has reported national municipal statistics every year since 2000. Therefore, all phenomena with 200 or more DD in the State were accounted for in the analysis.
2.3. Agricultural Statistics
Statistical agricultural information was obtained from the Mexican National Agrifood System (SIAP) [5]. The SIAP has reported yearly seasonal and rainfed production by the State since 1980, but only since 2003 has data for each municipality. These data contain the crop name, the sown surfaces (hectares ha), the harvested area (ha), the damaged crop area (ha), the production volumes (tons t), the yield (t ha−1), and the total production value (Mexican pesos MXN). Therefore, this research obtained its distribution by municipalities, sown surface, production volume, production value (converted to USD at a current change of 20 MXN to one USD), and the five crops with the highest production values.
2.4. Data Analysis
Data analysis considered the 212 municipalities of Veracruz. Hydrometeorological state-level data with the 212 municipalities were analyzed by principal component analysis (PCA) by the varimax method with multiple correlations between the phenomena with 200 or more DD and agricultural state data from 2001 to 2020. Municipality-level considered the period 2003 to 2020 because the CENAPRED and SIAP databases only coincide during this period. PCA analysis was performed with the software IBM SPSS v23. Of the 42 rainfed crops, the ones that reported damaged crop areas were selected to correlate with the DD by the Pearson correlation method with the function provided by Excel 2019. Statistical significance was evaluated at p ≤ 0.05 and p ≤ 0.01 with the t-student test.
Additionally, the five crops with the highest production values and their municipalities were chosen to correlate DD against their data. Among them, the municipalities with statistical significance were to determine the relationship between sown surface and harvested surface and the hydrometeorological phenomenon with the highest adverse effects.
Finally, the correlation value by each municipality was mapped with ArcMap 10.8 software [28].
3. Results
3.1. Hydrometeorological Hazards Causing Disaster Declarations
According to CENAPRED statistics [15], from 2001 to 2020, 212 (100%) municipalities of Veracruz had DD caused by heavy rains, 211 (99%) by tropical cyclones, 118 (56%) by droughts, 110 (52%) by low temperatures, 94 (43%) by strong winds, 89 (42%) by floods, 78 (37%) by cold spells and hailstorms, and 53 (25%) by heat waves (Figure 2). Heavy rains and floods caused the highest effects in the southwest of the State; tropical cyclones and droughts mainly affected the north and the center; cold spells, hail storms, and low temperatures affected the center and northern part of the State, where the mountain ranges are located. DD by each phenomenon and total DD by each municipality is indicated in Figure 2 from left to right down. The highest numbers of DD (41 to 55) are located along the southeastern coasts and central northern regions of the State.
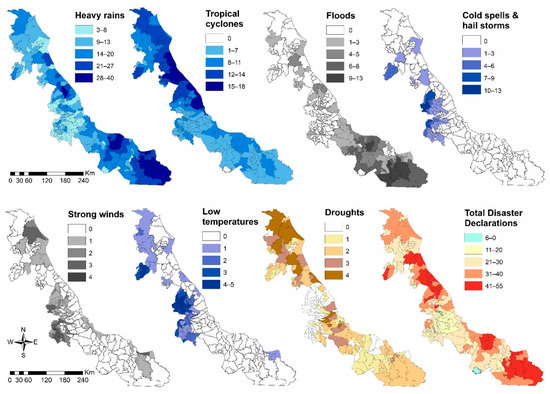
Figure 2.
Type of hydrometeorological phenomena and their associated number of disaster declarations in the State of Veracruz. Source: Graphical representation created with data from the Mexican National Center to Prevent Disasters statistics [15].
3.2. Agricultural Statistics
From 2003 to 2020, the agricultural statistics indicate that the highest volumes and production values were obtained in 23 municipalities. There are seven sites in the north, producing orange (Citrus sinensis L.), corn grain (Zea mays L.), and lemon (Citrus aurantifolia Swingle). The southwest has 12 municipalities with sugar cane (Saccharum offcinarum L.) and pineapple (Ananas comosus L.), and the southeast has four, with corn (Figure 3 right). Corn is the crop with the highest land extension, sugar cane is the crop with the highest production value concerning the sown surface, and pineapple is the fifth most valuable crop with the lowest cropland (Table 1).
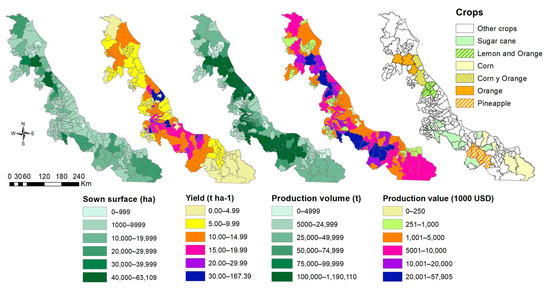
Figure 3.
Average agricultural data in the municipalities of the State of Veracruz during the period (2003–2020) and location of the entities with the five highest production values of sugar cane, lemon, orange, corn, and pineapple. Source: data projected with statistical information from the Mexican National Agrifood System [5].

Table 1.
The five crops with the highest production values, their sown surface, and their number of municipalities in Veracruz state during 2020.
3.3. Hydrometeorological Hazards and Their Effects on Agricultural Production
The principal component analysis found two components explaining 53% of the relationships between the hazards and the agricultural data variance. This data can be seen in Figure 4. First, it indicates that heavy rains and floods are related phenomena, the same as strong winds and low temperatures. In addition, tropical cyclones are highly correlated with damaged crop areas and negatively correlated with the harvested area and the harvested/sown area rate, causing the most significant damage over the sown area.
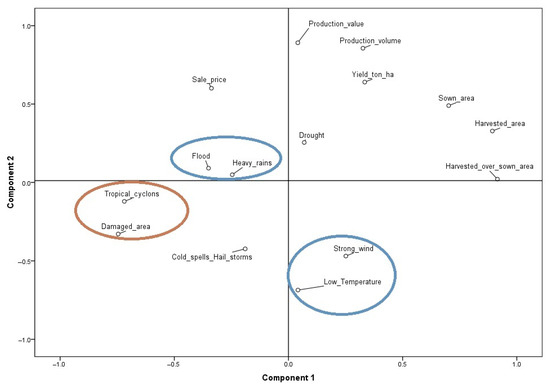
Figure 4.
Principal component analysis of hydrometeorological phenomena causing disaster declarations and agricultural production data in the State of Veracruz from 2001 to 2020. The circles indicate the most related phenomena.
Cold spells, hailstorms, low temperatures, and strong winds are related phenomena negatively correlated with the sown area and the harvested area. Likewise, droughts are negatively correlated with heavy rains and cyclones but positively correlated with the selling price. Finally, heavy rains negatively correlate with the sown area, production value, volume, and yield.
3.4. Total Crops Affected by Hydrometeorological Hazards
Of the 42 rainfed crops cultivated in the State, 21 reported damaged sown areas from 2001 to 2020. Although some crops, such as onion, coffee, pineapple, and sugar cane, only informed of damages in one or two years. The correlation analysis indicated that tropical cyclones caused the most significant damage to corn, potato, hot pepper, and pumpkin. In addition, heavy rains are negatively correlated to wheat; droughts to pineapple, rice, wheat, coffee, and sesame; floods to cucumber; low temperatures to tomato and beans; and strong winds to tomato (Table 2).

Table 2.
Correlation between damaged crop areas and hydrometeorological hazards from 2001 to 2020 in the State of Veracruz.
Of the 17 crops in Table 2, Figure 5 shows the crops with more than 400 ha of total damaged cropland in the studied period. Corn reported the highest damaged cropland, with 737,149 ha, followed by soy (36,197 ha), sorghum (31,811 ha), and beans (20,125 ha). The other crops reported less than 12,500, and only 11 cultivars had more than 1000 ha of damaged cropland (Figure 5a). The less affected crops are onion, coffee, cucumber, pineapple, vetch, and sesame, with less than 350 ha of damaged cropland during 20 years. Corn has the highest number of municipalities with damaged cropland, with 209, followed by beans, with 194, and sugar cane, with 84 (Figure 5b). Nevertheless, considering the number of entities where each crop is planted, it is noteworthy that soy is the crop with the most extensive cropland damaged by each site (18,099 ha/municipality), followed by corn (3455 ha/municipality) and sorghum (1164 ha/municipality).
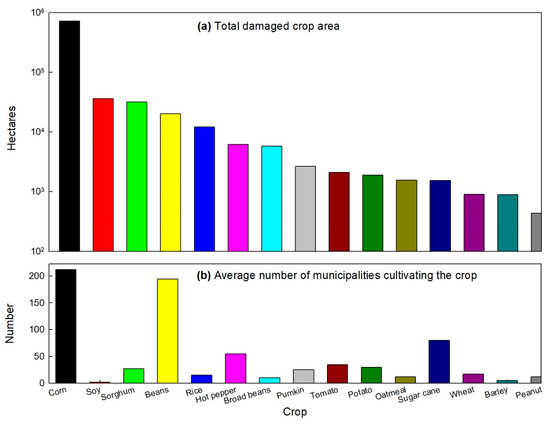
Figure 5.
Crops with more than 400 damaged hectares in the State of Veracruz from 2001 to 2020. (a) Damaged cropland, (b) average number of municipalities cultivating the crop. Source: graphs plotted with information obtained from the Mexican National Agrifood System [5].
Corn reported damaged areas yearly in the studied period (Figure 6a). The most significant damages were recorded in 2005, with 101,540 ha and 484 DD by tropical cyclones; the second highest losses occurred in 2019 (63,705 ha) when droughts generated 68 DD, and tropical storms did not happen. The second and third most affected crops were soy and sorghum, with 31,120 and 27,711 ha, respectively. Soy and sorghum lost 9117 and 8805 ha in 2007 and 2013. These years the sum of 600 DD by tropical cyclones and 305 DD by heavy rains were recorded. In contrast, in 2019, when only droughts occurred, 4912 and 4564 ha of sorghum and soy losses were reported. Beans have the fourth place in damaged cropland, with 20,507 ha. Beans had the most considerable losses in 2006 (3140 ha) when 112 DD by cold events were recorded, and in 2009 (2775 ha), when 99 DD by heavy rains occurred. With 12,205 ha damaged, rice was most affected in 2010 and 2019, when DD by rainfalls and droughts were predominant. Hot pepper, the sixth place (6593 ha damaged), had its most considerable losses (1663 ha) in 2005, with the highest number of tropical cyclones; and broad beans, the seventh place, with 5260 ha, had their most significant loss in 2012 (1253 ha), with 228 DD by heavy rains, and 2002 (1016 ha), with 70 DD by droughts. The other six crops reported losing less than 2700 ha from 2001 to 2019. The crop with the highest losses was soy, with 100% losses of the sown area in 2012 and 2019 (Figure 6b).
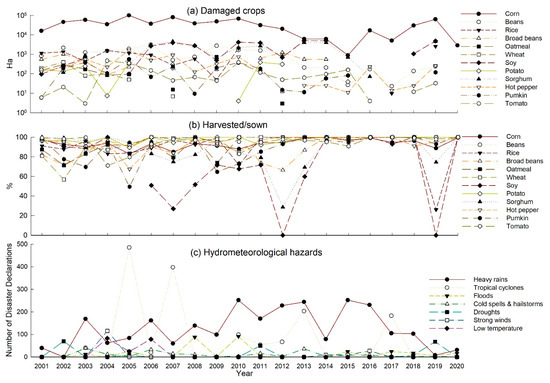
Figure 6.
Damaged crop areas and hydrometeorological phenomena with disaster declarations in the State of Veracruz from 2001 to 2020. (a) Number of damaged hectares; (b) number of disaster declarations by year. Source: based on data from the Mexican National Center to Prevent Disasters statistics [15] and the Mexican National Agrifood System [5].
In this regard, the most affected years by heavy rains were 2010, 2012, 2015, and 2016, when almost 50% of DD by excessive rainfall was recorded. On its side, tropical cyclones caused more DD during 2005, 2007, 2013, and 2017, with 82% of the total DD. Furthermore, cold spells and hailstorms had their maximum registers during 2003, 2006, and 2013, with 55% of their incidence, while low temperatures were recorded only from 2003 to 2006. Finally, the strong winds caused 116 and 27 DD in 2004 and 2016, respectively (Figure 6b).
3.5. Correlations between Production Data and Hydrometeorological Phenomena for the Five Most Valuable Crops of the State of Veracruz
Of the most important crops cultivated in the State of Veracruz, only corn and sugar cane reported damaged surfaces correlated with hydrometeorological phenomena. However, corn has the highest number of municipalities affected by these phenomena (Table 3, red numbers with one asterisk). At the same time, sugar cane only registered 17 entities, none statistically significant (Table 3, black numbers without an asterisk). Furthermore, corn has the most considerable harvested area rate affected by tropical cyclones, heavy rains, floods, and droughts compared with the other crops. These results are also reflected in corn’s production yield and values.

Table 3.
Number of municipalities cultivating the five most valuable crops affected by hydrometeorological hazards correlated with production values from 2003 to 2020 in the State of Veracruz.
3.6. Corn Production and Its Relationship with Hydrometeorological Hazards
The correlation analysis for corn indicates that tropical cyclones are causing the most significant damage in cropland, with 57 municipalities correlating values above 0.70 (Figure 7a). The municipalities in the north and south of the State are the most vulnerable. Heavy rains affected the central–southern regions more. Floods are causing more damage in the south, while droughts have higher impacts in the north. The lowest damaged cropland is related to snow and cold temperatures because 118 municipalities do not correlate with these phenomena, and only 12 in the mountain areas have negative correlations.
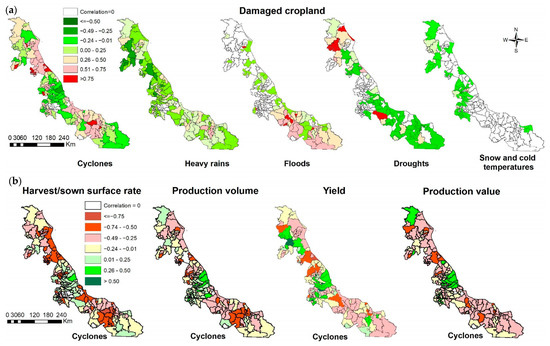
Figure 7.
(a) Damaged corn land and production values correlated with disaster declarations in the municipalities of the State of Veracruz from 2003 to 2020. (b) Corn production data with the highest correlations with disaster declarations. No correlation: sites with no correlation with the phenomena. Source: projections based on data from the Mexican National Center to Prevent Disasters statistics [15] and the Mexican National Agrifood System [5].
Regarding corn production (Figure 7b), tropical cyclones are the phenomena with the highest negative correlations. The rate of harvest/sown is the most affected data, with 54 municipalities correlating values below −0.50, followed by the volume with 22, and yield with 16. The most affected sites are located in the northern and southern regions of the State.
Figure 8 shows production values correlated with disaster declarations for sugar cane cultivation from 2003 to 2020. Only nine municipalities reported damaged cropland from 2019 to 2020, but only two had one DD by either heavy rains or floods, and none had statistical significance. Regarding the production data, tropical cyclones and excessive precipitations have the highest negative correlations, affecting the center and northwest parts of the State.
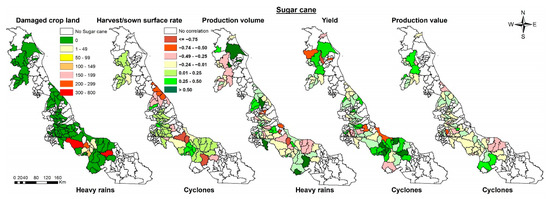
Figure 8.
Sugar cane damaged cropland and production values correlated with disaster declarations in the municipalities of the State of Veracruz from 2003 to 2020. No sugar cane: entities with no sugar cane crops. No correlation: sites with no correlation with the phenomena. Source: projections based on data from the Mexican National Center to Prevent Disasters statistics [15] and the Mexican National Agrifood System [5].
Figure 9 shows lemon production values correlated with DD in the State of Veracruz from 2003 to 2020. There is no damaged cropland reported for this crop. Droughts registered the highest negative correlations with the rate of harvest/sown, located in the south and northeastern sides of the State. Tropical cyclones negatively affect production volume and yield in the northern center, with some entities in the southern regions of the State. Heavy rains negatively affected municipalities in the center–northern and southeastern parts of the State.
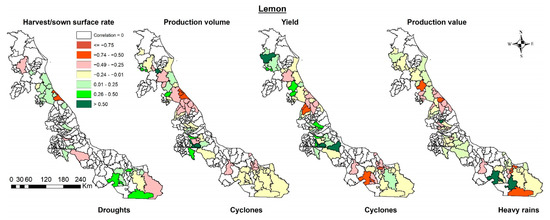
Figure 9.
Lemon crop data correlated with Disaster Declarations in the municipalities of the State of Veracruz from 2003 to 2020. No correlation: sites with no correlation with phenomena. Source: projections based on data from the Mexican National Center to Prevent Disasters statistics [15] and the Mexican National Agrifood System [5].
Figure 10 shows the correlations between orange crop data and DD in the municipalities where this crop is cultivated. Droughts have the highest negative correlations for the harvest/sown rate, with three sites in the south and six in the northern parts of the territory. Heavy rains have the highest negative correlations with production volume and yield, affecting the northern, central–south, and southwestern sides of the State. Finally, the production value was most affected by tropical cyclones in the southern and northern regions of the State.
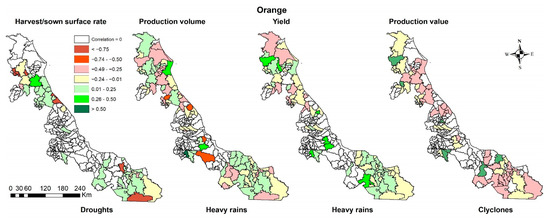
Figure 10.
Orange crop data correlated with disaster declarations in the municipalities of the State of Veracruz from 2003 to 2020. Correlation = 0: sites with no correlation with phenomena. Source: projections based on data from the Mexican National Center to Prevent Disasters statistics [15] and the Mexican National Agrifood System [5].
Figure 11 shows the pineapple production data correlated with DD in the State of Veracruz from 2003 to 2020. Only 2019 had 110 ha of damaged cropland in one municipality, which did not report DD during this period. For pineapple, tropical cyclones are the phenomena causing more decrements in the production variables (harvest over sown, volume, and yield), except by the production value, where heavy rains had the highest negative correlations with this data. Heavy rains mainly affect the production volume in one place in the center and one on the southern side of the State.
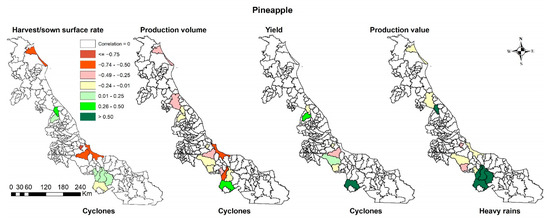
Figure 11.
Pineapple crop data correlated with disaster declarations in the municipalities of the State of Veracruz from 2003 to 2020. Correlation = 0: sites with no correlation with phenomena. Source: projections based on data from the Mexican National Center to Prevent Disasters statistics [15] and the Mexican National Agrifood System [5].
3.7. Relationship between Harvested Surface and Hydrometeorological Phenomena
Figure 12 shows the relationship between harvested/sown surface rate and the most adverse hydrometeorological phenomenon. Again, the highest correlation was found for the corn crop, where the harvested land rate decreased by 0.17%, with tropical cyclones impacting the affected sites. For lemon and orange, the harvested land can decrease by 5.3 to 0.74% with the number of droughts. In comparison, sugar cane and pineapple decreased their harvested area by 1.9 to 3.4% with tropical cyclones.
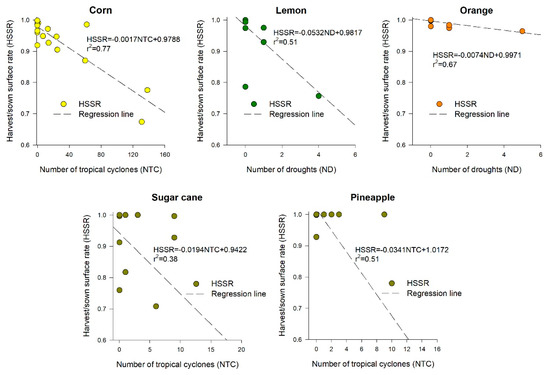
Figure 12.
Regression lines and linear equations predicting the relationship between the harvested over sown surface rate with the most adverse hydrometeorological phenomenon for the five most valuable crops in the State of Veracruz. R2 indicates the coefficient of determination.
4. Discussion
4.1. Hydrometeorological Hazards Causing Disaster Declarations
This research indicates that heavy rains are the leading causes of DD in the State of Veracruz, with their more severe consequences on the southeastern side of the territory, below the 19 parallel. In this regard, it is essential to mention that the geographic location of Veracruz state exposes it to different climatic phenomena. These phenomena are easterly ways, frontal systems, and tropical cyclones, which generate extreme regional precipitations. Additionally, this region has teleconnections with synoptic phenomena that modify average rainfall, increasing precipitations substantially [29]. Furthermore, the Inter-Tropical Convergence Zone (ITCZ) is displaced during summer to northern latitudes, reaching part of Veracruz and generating heavy precipitations in the southern part of the State [30]. Therefore, regions below the 19 parallel have constant DD due to floods and heavy rains. Thus, these territories have tropical climates (Am and Af), having precipitations up to 600 mm during the driest month, according to a Köppen–Geiger classification developed for Mexico [31], plus large water bodies, swamps, and wetlands, some transformed into agricultural lands or human settlements [24]. Some of these municipalities can receive 2500 to 4500 mm of rain yearly and up to 1200 mm during the rainiest month [11,24,32]. Thus, agricultural lands or human settlements can be flooded or receive heavy rains in short periods, saturating the soils and causing disasters to their inhabitants or crops. Therefore, special care must be taken in these areas if future infrastructures or developments are planned since flood projections in other regions of North America indicate that they may increase over time [33].
Tropical cyclones are the second cause of disasters, mainly from the center to the northern regions of the State, between the 20 and 22 parallels. The State’s location along the Gulf of Mexico makes the territory very prone to tropical cyclones that impact between the 18 and 22 parallels. Above parallel 19, tropical storms and hurricanes are the leading causes of DD, with three hurricanes (one category one, one category two, and one category three) impacting the eastern side of the State during the studied period [34].
This situation can be explained because Mexico has two cyclogenesis zones. One is in the Atlantic Ocean (the Gulf of Mexico), and the other is in the Pacific Ocean. From May to November, these regions have a surface sea temperature higher than 26 °C, which, combined with convective instabilities, low pressures, and other factors, favor tropical cyclones that can impact the Mexican coasts from the Pacific and Atlantic Oceans [10]. Regarding the Atlantic Multidecadal Oscillation (AMO), when this oscillation is located in its positive phase, it generates intense precipitations caused by a relatively substantial increase in the mid-tropospheric lapse rate, low-level humidity, potential instability, and elevated topography. [35].
The historical hurricane tracks registered by the National Oceanic and Atmospheric Administration of the United States (NOAA) from 2000 to 2020 confirm this situation (Figure 13) [34].
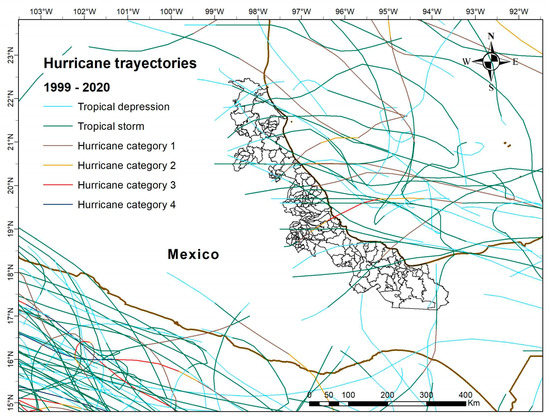
Figure 13.
Tracts of tropical cyclones affecting the State of Veracruz from 1999 to 2020. Line colors indicate their category: light blue = tropical depression, green = tropical storm, grey = hurricane category 1, orange = hurricane category 2, red = hurricane category 3, and dark blue = hurricane category 4. Source: graphical representation obtained with data provided by the NOAA [34].
Despite many hazards from heavy rains and hurricanes, droughts also affect more than 50% of Veracruz, the northern (above parallel 20) and a small part of the central side (between the 18 and 19 parallels) being the most affected. Problems with drought declarations could be related to the fact that these territories have an Aw0 climate type, considered the driest of the Aw climates, where the driest month has an average of 43 mm of rain, according to a particular study for the State [36]. In addition, previous research has found that droughts are a recurrent and cyclic phenomenon causing decrements in agricultural production and problems in social systems in these regions of the State [24,37]. Thus, new policies need to be implemented to promote sustainable and resilient agricultural strategies to avoid crop losses in the future.
Other phenomena generating DD are low temperatures, cold spells, and hailstorms. These phenomena occur from October to May in mountain regions, when cold fronts from the United States’ northwest reach the State of Veracruz [11]. Locations above 1000 m above sea level or at the northern side of the State (above parallel 19) may experience low temperatures, while cold spells and hailstorms occur in the higher altitudes (1500 m or more) in the central and northern regions of the State (Figure 2). The municipalities with higher cold spells and hail storms are located above 2000 m, with average temperatures below 16 °C and cold–dry climate types [24]. Thus, abnormally cold winters may generate DD caused by excessive snow or colder temperatures.
The phenomena identified as “strong winds” is caused by polar cold fronts carrying cold, dry masses and strong winds. Their most significant impacts are reported in the northeastern and central mountain regions of the State. According to Luna and Cavazos [38], the interaction between the front systems and the complex mountains of the oriental region creates a coastal barrier jet in the Gulf of Mexico. This jet causes the frontal cold winds that impact the northern side of the State to change their direction to the center of the territory. Later, the winds in the oriental mountain region are sent to the south, where the Tuxtlas mountain region is located. In this location, they are sent to the isthmus of Tehuantepec. In this regard, municipalities having DD by strong winds are situated near the mountains, where the paths of the winds coincide.
These winds are more frequent and stronger from November to March, when they can have gusts of winds up to 100 mk/h affecting cultivars and manufactured structures [32,39,40] that trigger DD.
4.2. Agricultural Data and Disaster Declarations
DD analysis indicates that tropical cyclones contribute to the highest damaged cropland in the State’s five most valuable crops, with decrements in the harvested surface in corn, sugar cane, orange, and pineapple. Similarly, they are associated with the highest decrements in production yields in corn, sugar cane, lemon, orange, and pineapple; and a reduction in the production value of corn. Besides this, tropical cyclones significantly correlate with damaged potato, hot pepper, and pumpkin cropland. Although the total damaged cropland of all these crops only comprised 1.48% of the entire damaged cropland of corn because this crop has the highest surface sown in the studied region [5].
Hurricanes can cause excessive precipitation, strong winds, floods, and landslides in mountain regions [40]. This study found a correlation between tropical cyclones and floods in the PCA analysis (Figure 4). Therefore, one event can trigger another that may damage extensive croplands [3], especially in the municipalities from parallel 20 and above, where tropical cyclones increase excessive rains due to the mountain ranges and hydrologic basins in this area [41].
According to the NOAA record trajectories, the State of Veracruz is vulnerable to receiving hurricane impacts directly from the Atlantic Ocean or indirectly from the Pacific Ocean [34]. In the Atlantic coasts, from south to north, tropical cyclones can impact Veracruz, while below parallel 18, tropical hurricanes from the Pacific Ocean may still reach the State.
4.3. Corn Production and Hydrometeorological Hazards
Corn production data are the most affected by tropical cyclones, as the highest negative correlations indicate (Table 3). These results correlate with the most significant extension of corn-sown areas, with more than double the second most sown crop (sugar cane) area. In addition, corn is cultivated in 98% of the entities of the State during two agricultural cycles: spring–summer (April to September) and autumn–winter (October to March) [5,42]. Both cycles when the hurricane period occurs in the Atlantic and Pacific oceans surrounding Mexico [34], which may start in the region by the end of May and finish at the beginning of November [43]. This fact can be observed in 2005 and 2007, when the highest losses in harvested hectares of corn occurred (with decrements of 12 and 17%, respectively), and the highest number of DD caused by tropical cyclones was recorded (Figure 6).
Corn is susceptible to excessive precipitations and strong winds caused by hurricanes [42]. Therefore, tropical cyclones with up to 440 mm of rain during four days and winds more than 64 km/h [41,43] may cause root lodging or break plants with partial or total crop loss [44]. For example, in 2005, when the highest disaster declarations by tropical cyclones were recorded, the affected municipalities reported 90% damaged cropland in their corn production, the most elevated damaged crop surface recorded in the Veracruz during 2001–2020. However, for the case of the year with the highest number of excessive rains (2015), the average damaged cropland was 37% below the average of 2003–2020, and its production value only decreased by 3% in the affected municipalities. This reduction may be related to the fact that rains favor corn productivity in the driest areas, such as the northern and southern regions of the State (Figure 2). This performance can be seen in Figure 7a, where the highest correlations with DD by heavy rains negatively correlate with damaged cropland in the highest quantity of the municipalities. Thus, the years with heavier rains have positive impacts in the driest places.
Drought is the other extreme phenomenon causing damaged cropland, affecting mainly the northern regions of Veracruz (Figure 7a). These regions had the highest DD due to drought, and the harvested surface decreased by 7% when the highest droughts were recorded in 2019. This phenomenon has been previously reported as affecting corn productivity in Veracruz and Mexico [45,46,47]. Although, in Veracruz, there are different corn varieties developed for each specific climate type [45], developing infrastructures to capture and store water in these municipalities to avoid damage to croplands in future drought periods is essential, especially for the northern side of the State.
4.4. Production Data and Hydrometeorological Phenomena for the Four Most Valuable Crops of the State of Veracruz
Sugar cane, lemon, orange, and pineapple do not correlate with any hydrometeorological phenomenon associated with DD and damaged cropland in the study zone. For example, one municipality declared 337 ha of damaged cropland for sugar cane in 2019, and three sites reported 1227 ha in 2019, but they did not correlate with any phenomenon. Furthermore, one place recorded 101 ha of damaged cropland for pineapple in 2020 without DD.
In Veracruz, sugar cane is cultivated in 84 municipalities along the central southern and northern regions of the State. Tropical cyclones mainly affect this crop’s harvest/sown surface rate, with up to 30% losses during the higher number of tropical cyclones recorded (Figure 12). These decrements were caused because cyclone’s strong winds can break the stalks [48]. These results are congruent with one Mexican study that has determined that sugar cane is vulnerable to hydrometeorological hazards in its harvest over sown rate and yields because these phenomena can affect not only the land but the productive and social system linked to this crop [49].
For sugar cane, heavy rains may affect their production volume in sites with Am and Aw2 climates, with higher precipitations than Aw1 or Aw0 climates. This behavior is explained because sugar cane needs higher rainfalls (1500 mm) while it is in a growing phase. However, when it should be harvested during maturity, excessive rains and humidity cause a decrement in its juice quality [48].
Lemon and orange products have no damaged land registered during 2001–2020. In this regard, we must consider that lemons and oranges are products obtained from trees [50], more resistant to excessive rains and extreme winds caused by tropical cyclones, and they are only cultivated in 29 municipalities of Veracruz. Nevertheless, their productivity was negatively impacted by tropical cyclones and excessive rainfall, mainly in the regions located above parallel 20, where more than 50% of the impact of the tropical cyclones occurred (Figure 13), decreasing up to 11% of their production value during 2005 when the highest number of tropical cyclones was recorded. Furthermore, these phenomena also can decrease production yield because excessive rains are associated with fungal diseases attacking citrus trees, such as Phytophthora citrophthora and Colletotrichum acutatum, which cause flowers and fruits to decay [51]. On the other side, citrus trees are also vulnerable to drought (Figure 12) [52], decreasing the rate of the harvest/sown area by up to 10% in sites where there are DD by this phenomenon (Figure 2, Figure 9 and Figure 10). Although there are no social studies about this issue in these regions, this situation has been reported by local newspapers [53] and perceived by local farmers in the neighboring State of Campeche, where they consider that drought is increasing due to climate change, negatively affecting lemon production [54].
Pineapple has no damaged cropland. This crop is cultivated only in 14 municipalities of Veracruz, most of them located on the southwestern side and only two on the northeastern side of the State, where Aw2 climate types are predominant. In these locations, tropical cyclones are the leading cause of decrement of up to 47% in the harvest/sown area rate (Figure 12). For example, in 2005, when the highest number of tropical cyclones were recorded, production yield and volume had their highest decrement (18%, 10%, and 7%, respectively) because most of the municipalities cultivating pineapple had two or three DD by tropical cyclones. The effects on productivity in pineapple can be related to the fact that this plant has very shallow roots (0.85 m depth); thus, it is prone to be uprooted by strong winds and heavy rains caused by cyclones.
4.5. Production Data and Hydrometeorological Phenomena for Other Crops with Lower Production Values
There are two crops with the highest damaged cropland in terms of sown cropland besides corn: soy and sorghum.
Soy (Glycine max) is cultivated in only one municipality located on the northern side of Veracruz (Pánuco, above parallel 21), and this crop had a total loss of cropland in 2012 and 2019. In 2012 there was no disaster declaration for this site; however, in 2011, there was one caused by drought, and in 2019 the same phenomena caused another. Soy requires an average of 530 mm during its maturation cycle (90–150 days) but tolerates up to 250 mm before flowering [55]. In Mexico, soy is sown during the spring–summer agricultural cycle, expecting summer precipitations before flowering [56].
Nevertheless, the site where soy is cultivated in Veracruz has the driest Aw climate type (Aw0). Therefore, it is one of the municipalities with more disaster declarations by droughts [15]. Thus, although soy can be a tolerant crop, drought seasons can cause the total loss of this cultivar during the flowering stage [56] in the northern regions of the State where it is cultivated (Figure 2 and Figure 6).
Sorghum (Sorghum vulgare L.) is sown in 29 municipalities on the southern and northern sides of the State, but the northern sites have more than 90% of the planted surface [5]. These places also have the highest number of DD by cold spells and low temperatures, coinciding with the years with the highest number of damaged croplands, followed by the drought recorded in 2019 [15]. Sorghum is more tolerant to drought than corn during its growing period (90–150 days). Nevertheless, temperatures lower than 15 °C can damage the plants [55]; thus, DD by cold spells could be associated with sorghum-damaged cropland.
Beans (Phaseolus vulgaris L.) are the fourth crop reporting damaged cropland. This crop is part of the base food chain in Mexico [50] and cultivated in 160 to 166 municipalities of Veracruz [5], with more than 50% cropland in the northern or central mountains of Veracruz. These places had recorded DD by low temperatures and cold spells in the years when 80% of the damaged cropland was recorded and 20% when droughts were reported. In Mexico, beans can be cultivated in different climate types, from warm to temperate (Aw to Cw), due to their thermic range from 2 to 27 °C. However, they do not tolerate frost or temperatures lower than 0 °C and require 350 to 500 mm of rain during their growing and maturation period (90 to 180 days), depending on the site where they grow [55]. Thus, they are susceptible to drought, and plants can wilt quickly during a drought season. Therefore, the cold temperatures and droughts recorded in the municipalities where damaged croplands are reported can be the leading causes of the losses.
Rice (Oryza sativa L.) is the fifth most damaged crop. It is cultivated in an average of 15 municipalities of Veracruz, mainly located in the southern regions of the State [5], below parallel 19, with wet–warm climates (annual rainfall exceeding 1500 mm and average temperatures above 20 °C) [24]. In Mexico, this grain requires an average of 300 mm of monthly rain during its growing period [55]; thus, it is susceptible to drought, as the highest damaged cropland during the driest years confirms (Table 2, Figure 6). Therefore, if more extended drought periods occur in the places where rice is sown, rainwater harvesting or store systems should be built to avoid losses in this crop.
4.6. Scope and Limitations of the Present Research
For this research, we used a combination of governmental disaster statistics and agricultural data to determine the relationship between hydrometeorological hazards and local crop productivity because in-site meteorological information is deficient in the study region. This way, we could find relevant information for specific species congruent with these crops’ reported performance during these phenomena. Nevertheless, some results are limited because governmental statistics depend on their local administrations, where the capabilities of their employees to report data might be implicated. Therefore, we recommend investigating other sources or instruments, such as satellite images and personal interviews with local producers, to develop better methodologies to study the effects of hydrometeorological phenomena on crops in regions with similar problems.
5. Conclusions
This research has found that disaster governmental statistics can be used to solve missing in-site climatic data to determine the impacts of hydrometeorological hazards on rainfed crops in the State of Veracruz. Seven hydrometeorological phenomena (heavy rains, tropical cyclones, floods, cold spells and hail storms, strong winds, low temperatures, and droughts) affect the State of Veracruz, causing disaster declarations. This high number of hydrometeorological phenomena is related to its vast territory along the Gulf of Mexico, between 16 and 22 parallels, crossed by three major mountain ranges.
Tropical cyclones are the primary cause of disaster declarations affecting crop productivity in the State of Veracruz. Among the five most valuable cultivars of the State, corn (the crop with the highest sown surface) is most affected by these phenomena, followed by floods, droughts, and heavy rains. Sugar cane is the second most affected by tropical cyclones, heavy rains, and droughts, followed by orange and lemon, while pineapple is most affected by tropical cyclones and droughts. We also conclude that low temperatures, cold spells, and strong winds in the mountain regions affect other minor cultivars, such as tomato, sorghum, and beans.
Author Contributions
Conceptualization, O.A.V.-R.; methodology, O.A.V.-R.; formal analysis, O.A.V.-R.; investigation, O.A.V.-R., O.M.P.-W. and F.S.-M.; resources, O.A.V.-R., O.M.P.-W. and F.S.-M.; data curation, O.A.V.-R., O.M.P.-W. and F.S.-M.; writing—original draft preparation, O.A.V.-R.; writing—review and editing, O.A.V.-R., O.M.P.-W. and F.S.-M. All authors have read and agreed to the published version of the manuscript.
Funding
This research received no external funding.
Institutional Review Board Statement
Not applicable.
Informed Consent Statement
Not applicable.
Data Availability Statement
The data used in this research belong to public Mexican agricultural databases obtained from: http://infosiap.siap.gob.mx/gobmx/datosAbiertos.php, accessed on 1 December 2022, and the Disaster Prevention Center from: http://www.atlasnacionalderiesgos.gob.mx/apps/Declaratorias/, accessed on 1 December 2022. Data processed to obtain our results can be accessed by emailing the corresponding author.
Acknowledgments
These authors acknowledge the English grammar review and improvement provided by Olga Reyes.
Conflicts of Interest
The authors declare no conflict of interest.
References
- Markova, G.; Baas, S.; Conforti, P.; Ahmed, S. 2017: The Impact of Disasters and Crises on Agriculture and Food Security; Olsen, L., Ed.; Food and Agriculture Organization of the United Nations (FAO): Rome, Italy, 2018. [Google Scholar]
- Shah, H.; Hellegers, P.; Siderius, C. Climate risk to agriculture: A synthesis to define different types of critical moments. Clim. Risk Manag. 2021, 34, 100378. [Google Scholar] [CrossRef]
- Mohan, P. Impact of Hurricanes on Agriculture: Evidence from the Caribbean. Nat. Hazards Rev. 2017, 18, 04016012. [Google Scholar] [CrossRef]
- FAO; IFAD; UNICEF; WFP; WHO. The State of Food Security and Nutrition in the World 2020: Transforming Food Systems for Affordable Healthy Diets; Food and Agriculture Organization of the United Nations: Rome, Italy, 2020. [Google Scholar]
- SIAP (Servicio de Información Agroalimentaria y Pesquera). Estadística de Producción Agrícola de 2019. 2020. Available online: http://infosiap.siap.gob.mx/gobmx/datosAbiertos.php (accessed on 31 July 2019).
- León, A.C.; Pérez-Fernández, Y.; Cervantes-Herrera, J.; Castellanos, J.A. Tecnologías tradicionales en la agricultura y persistencia campesina en México. Rev. Mex. Cienc. Agrícolas 2015, 2, 381–389. [Google Scholar]
- Delgado-Carranza, C.; Bautista, F.; Ihl, T.J.; Palma-López, D. Duración del periodo de lluvias y aptitud de tierras para la agricultura de temporal. Ecosistemas Recur. Agropecu. 2017, 4, 485–497. [Google Scholar] [CrossRef]
- SIAP (Servicio de Información Agroalimentaria y Pesquera). Panorama Agroalimentario 2020; Servicio de Información Agroalimentaria y Pesquera: Mexico City, Mexico, 2020. [Google Scholar]
- INEGI (Instituto Nacional de Estadística y Geografía). Mapas Climatológicos. Available online: https://www.inegi.org.mx/temas/climatologia/ (accessed on 31 May 2020).
- Moreno-Casasola, P.; Sánchez Vigil, G. Veracruz, Mar de Arena, 1st ed.; Gobierno del Estado de Veracruz: Xalapa, Mexico, 2014. [Google Scholar]
- Ruiz Barradas, A.; Tejeda Martínez, A.; Miranda Alonso, S.; Flores Zamudio, R.H. Climatología. In Atlas del Patrimonio Natural, Histórico y Cultural de Veracruz; Florescano, E., Ortíz Escamilla, J., Eds.; Gobierno del Estado de Veracruz: Xalapa, Mexico, 2010; pp. 65–84. [Google Scholar]
- Navarro-Estupiñan, J.; Robles-Morua, A.; Vivoni, E.R.; Zepeda, J.E.; Montoya, J.A.; Verduzco, V.S. Observed trends and future projections of extreme heat events in Sonora, Mexico. Int. J. Climatol. 2018, 38, 5168–5181. [Google Scholar] [CrossRef]
- Gobierno de Mexico. Centro Nacional de Prevención de Desastres. Available online: https://www.gob.mx/cenapred (accessed on 21 January 2023).
- SEMARNAT (Secretaría de Medio Ambiente y Recursos Naturales). Declaratorias de Desastre Natural en el Sector Agropecuario, Acuícola y Pesquero, Publicadas en el Diario Oficial de la Federación y Número de Municipios Señalados por Entidad Federativa y Tipo de Fenómeno. Available online: http://dgeiawf.semarnat.gob.mx:8080/ibi_apps/WFServlet?IBIF_ex=D1_DESASTRE00_08&IBIC_user=dgeia_mce&IBIC_pass=dgeia_mce&NOMBREENTIDAD=*&NOMBREANIO=* (accessed on 14 February 2020).
- CENAPRED (Centro Nacional de Prevención de Desastres). Sistema de Consulta de Declaratorias. Available online: http://www.atlasnacionalderiesgos.gob.mx/apps/Declaratorias/ (accessed on 31 May 2022).
- IPCC (Grupo Intergubernamental de Expertos sobre el Cambio Climático). Cambio Climático 2021: Bases Físicas; IPCC: Genéva, Switzerland, 2021. [Google Scholar]
- Emanuel, K.A. Downscaling CMIP5 climate models shows increased tropical cyclone activity over the 21st century. Proc. Natl. Acad. Sci. USA 2013, 110, 12219–12224. [Google Scholar] [CrossRef]
- Spinoni, J.; Barbosa, P.; Bucchignani, E.; Cassano, J.; Cavazos, T.; Christensen, J.H.; Christensen, O.B.; Coppola, E.; Evans, J.; Geyer, B.; et al. Future Global Meteorological Drought Hot Spots: A Study Based on CORDEX Data. J. Clim. 2020, 33, 3635–3661. [Google Scholar] [CrossRef]
- Luna-Díaz-Peon, A.; Valdés-Rodríguez, O.A. Implicaciones de las Bases de Datos Climatológicas del Estado de Veracruz Sobre Investigaciones de Cambio Climático: Tres Estudios de Caso. Quehacer Científico Chiapas 2019, 14, 15–20. [Google Scholar]
- Salas-Martínez, F.; Valdés-Rodríguez, O.A.; Palacios-Wassenaar, O.M.; Márquez-Grajales, A. Analysis of the Evolution of Drought through SPI and Its Relationship with the Agricultural Sector in the Central Zone of the State of Veracruz, Mexico. Agronomy 2021, 11, 2099. [Google Scholar] [CrossRef]
- Bakhsh, K.; Kamran, M.A. Adaptation to Climate Change in Rain-Fed Farming System in Punjab, Pakistan. Int. J. Commons 2019, 13, 833–847. [Google Scholar] [CrossRef]
- Othmani, N.I.; Sahak, N.M.; Yunos, M.Y.M. Biomimicry in agrotechnology: Future solution of water problem for the agriculture industry? IOP Conf. Ser. Earth Environ. Sci. 2021, 756, 012051. [Google Scholar] [CrossRef]
- Awolala, D.; Mutemi, J.; Adefisan, E.; Antwi-Agyei, P.; Taylor, A.; Muita, R.; Bosire, E.; Mutai, B.; Nkiaka, E. Economic value and latent demand for agricultural drought forecast: Emerging market for weather and climate information in Central-Southern Nigeria. Clim. Risk Manag. 2023, 39, 100478. [Google Scholar] [CrossRef]
- INEGI (Instituto Nacional de Estadística y Geografía). Aspectos Geográficos Veracruz; INEGI: Mexico City, Mexico, 2018. [Google Scholar]
- Medina Chena, A.; Salazar Chimal, T.; Álvarez Palacios, J.L. Fisiografía y suelos. In Atlas del Patrimonio Natural, Histórico y Cultural de Veracruz; Florescano, O., Ed.; Gobierno del Estado de Veracruz: Xalapa, Mexico, 2010; Volume I, pp. 30–43. [Google Scholar]
- INAFED. Enciclopedia de los Municipios y Delegaciones de México. 2017. Available online: https://www.derechomunicipal.org.mx/single-post/2018/07/24/enciclopedia-de-los-municipios-y-delegaciones-de-m%C3%A9xico (accessed on 22 January 2023).
- CONABIO (Comisión Nacional para el Conocimiento y Uso de la Biodiversidad). Climas. Available online: http://geoportal.conabio.gob.mx/metadatos/doc/html/clima1mgw.html (accessed on 23 June 2022).
- ESRI. About ArcGIS. Available online: https://www.sigsa.info/es-mx/arcgis/about-arcgis/overview (accessed on 29 December 2022).
- SEMARNAT (Secretaría de Medio Ambiente y Recursos Naturales). Atlas Geográfico del Medio Ambiente y Recursos Naturales; Dirección General de Estadística e Información Ambiental, Ed.; SEMARNAT: Mexico City, Mexico, 2010. [Google Scholar]
- Kucieńska, B.; Raga, G.B.; Rodríguez, O. Cloud-to-ground lightning over Mexico and adjacent oceanic regions: A preliminary climatology using the WWLLN dataset. Ann. Geophys. 2010, 28, 2047–2057. [Google Scholar] [CrossRef]
- García, E. Modificaciones al Sistema de Clasificación Climática de Köppen; Geografía, I., Ed.; Universidad Autónoma de México: Mexico City, Mexico, 2004; Volume 1. [Google Scholar]
- SMN (Servicio Meteorológico Nacional). Información Estadística Climatológica. Available online: https://smn.conagua.gob.mx/es/climatologia/informacion-climatologica/informacion-estadistica-climatologica (accessed on 20 September 2019).
- Markus, M.; Cai, X.; Sriver, R. Extreme Floods and Droughts under Future Climate Scenarios. Water 2019, 11, 1720. [Google Scholar] [CrossRef]
- NOAA (National Oceanic and Atmospheric Administration). Historical Hurricane Tracks. Available online: https://coast.noaa.gov/hurricanes/#map=5.51/20.377/-94.026&search=eyJzZWFyY2hTdHJpbmciOiJWZXJhY3J1eiwgTcOpeGljbyIsInNlYXJjaFR5cGUiOiJnZW9jb2RlZCIsIm9zbUlEIjoiMjQxNTc2MSIsImNhdGVnb3JpZXMiOlsiSDUiLCJINCIsIkgzIiwiSDIiLCJIMSIsIlRTIiwiVEQiXSwieWVhcnMiOlsiMjAyM (accessed on 29 December 2022).
- Curtis, S. The Atlantic multidecadal oscillation and extreme daily precipitation over the US and Mexico during the hurricane season. Clim. Dyn. 2008, 30, 343–351. [Google Scholar] [CrossRef]
- Valdés Rodríguez, O.A.; Pérez Vázquez, A.; García Pérez, E.; Inurreta Aguirre, H.D. Condiciones agroecológicas de procedencias nativas de Jatropha curcas L. In Energía Alterna y Biocombustibles; Perez Vazquez, A., Garcia Perez, E., Eds.; Colegio de Postgraduados: Montecillo, Mexico, 2013; pp. 143–152. [Google Scholar]
- Valdés-Rodríguez, O.A. Desastre compuesto: Sequía y Covid-19 en Veracruz, México. Interconectando Saberes 2022, 14, 15–27. [Google Scholar] [CrossRef]
- Luna-Niño, R.; Cavazos, T. Formation of a coastal barrier jet in the Gulf of Mexico due to the interaction of cold fronts with the Sierra Madre Oriental mountain range. Q. J. R. Meteorol. Soc. 2018, 144, 115–128. [Google Scholar] [CrossRef]
- Zavala-Hidalgo, J.; Romero-Centeno, R.; Mateos-Jasso, A.; Morey, S.L.; Martínez-López, B. The response of the Gulf of Mexico to wind and heat flux forcing: What has been learned in recent years? Atmósfera 2014, 27, 317–334. [Google Scholar] [CrossRef]
- García Acosta, V.; Padilla Lozoya, R. (Eds.) Historia y Memoria de los Huracanes y Otros Episodios Hidrometeorológicos Extremos en México; Universidad de Colima: Colima, Mexico; Universidad Veracruzana, Centro de Investigaciones: Veracruz, Mexico, 2021; Volume 5. [Google Scholar]
- Domínguez, C. La Actividad Ciclónica Tropical en México: Peligros y Riesgos Hidrometeorológicos Asociados; Universidad Autónoma de México: Mexico City, Mexico, 2022. [Google Scholar]
- SIAP-SADER. Aptitud Agroclimática del Maíz en México; Geoespaciales, D.d.S., Ed.; Secretaría de Agricultura y Desarrollo Rural: Jalisco, Mexico, 2018; Volume 1. [Google Scholar]
- SMN (Servicio Meteorológico Nacional). Información Histórica. Available online: https://smn.conagua.gob.mx/es/ciclones-tropicales/informacion-historica (accessed on 8 December 2022).
- Lindsey, A.J.; Carter, P.R.; Thomison, P.R. Impact of imposed root lodging on corn growth and yield. Agron. J. 2021, 113, 5054–5062. [Google Scholar] [CrossRef]
- Bada-Carbajal, L.M.; Osorio-Antonia, J.; Ramírez-Hernández, Z. Evolución de la producción del maíz en Veracruz, México. Investig. Adm. 2021, 50, 128. [Google Scholar] [CrossRef]
- González, G.S. México importará cifra récord de maíz este año por la sequía. La Jorn. 2020. Available online: https://www.jornada.com.mx/ultimas/economia/2020/01/21/mexico-importara-cifra-record-de-maiz-este-ano-por-la-sequia-8730.html (accessed on 28 December 2022).
- Salas Martínez, F.; Valdés Rodríguez, O.A.; Palacios Wassenar, O. Reducciones sobre el rendimiento del maíz en grano en la región central de Veracruz, México. In Ciencia y Tecnología Para el Campo Mexicano: Retos y Oportunidades; Zetina Lezama, R., Tosquy Valle, O.H., del Angel Pérez, A.L., Ríos Utrera, Á., Esqueda Esquivel, V.A., Eds.; INIFAP: Mexico City, Mexico, 2021; pp. 1530–1541. [Google Scholar]
- CONADESUCA (Comité Nacional para el Desarrollo Sustentable de la Caña de Azúcar). Ficha Técnica del Cultivo de la Caña de Azúcar (Saccharum officinarum L.); SAGARPA: Mexico City, Mexico, 2015. [Google Scholar]
- Badillo-Márquez, A.E.; Aguilar-Lasserre, A.A.; Miranda-Ackerman, M.A.; Sandoval-González, O.O.; Villanueva-Vásquez, D.; Posada-Gómez, R. An Agent-Based Model-Driven Decision Support System for Assessment of Agricultural Vulnerability of Sugarcane Facing Climatic Change. Mathematics 2021, 9, 3061. [Google Scholar] [CrossRef]
- SIAP (Servicio de Información Agroalimentaria y Pesquera). Panorama Agroalimentario 2021; Ornelas Ruíz, P., Ed.; Servicio de Información Agroalimentaria y Pesquera: Mexico City, Mexico, 2021. [Google Scholar]
- Ambriz Cervantes, R.; Ariza Flores, R.; Alía Tejacal, I.; Gaona García, Á. Bioestimulantes y Prácticas Para la Producción de Limón Persa en Invierno; INIFAP, Zacatepec: Morelos, Mexico, 2019. [Google Scholar]
- InfoAgro. El Cultivo de las Naranjas. Available online: https://www.infoagro.com/citricos/naranja.htm (accessed on 31 August 2022).
- Salazar, M. Sequía pone en riesgo producción de cítricos en Veracruz. D. Xalapa 2019. Available online: https://www.diariodexalapa.com.mx/local/sequia-pone-en-riesgo-produccion-de-citricos-en-veracruz-alamo-naranjas-4634644.html (accessed on 29 December 2022).
- Rosales Martínez, V.; Francisco Rubio, A.; Casanova Pérez, L.; Fraire Cordero, S.F.; Flota Bañuelos, C.; Galicia Galicia, F. Percepción de citricultores ante el efecto del cambio climático en Campeche. Rev. Mex. Cienc. Agrícolas 2020, 11, 727–740. [Google Scholar] [CrossRef]
- Ruiz Corral, J.A.; Medina García, G.; González Acuña, I.J.; Flores López, H.E. Requerimientos Agroecológicos de Cultivos; INIFAP: Mexico City, Mexico, 2013. [Google Scholar]
- García Rodriguez, J.C. Comparando la Calidad de Semilla de Soya Producida en dos Regiones Agroclimáticas de México. Available online: http://www.oleaginosas.org/art_487.shtml (accessed on 15 December 2021).
Disclaimer/Publisher’s Note: The statements, opinions and data contained in all publications are solely those of the individual author(s) and contributor(s) and not of MDPI and/or the editor(s). MDPI and/or the editor(s) disclaim responsibility for any injury to people or property resulting from any ideas, methods, instructions or products referred to in the content. |
© 2023 by the authors. Licensee MDPI, Basel, Switzerland. This article is an open access article distributed under the terms and conditions of the Creative Commons Attribution (CC BY) license (https://creativecommons.org/licenses/by/4.0/).