Article

Calibration of the Ångström–Prescott Model for Accurately Estimating Solar Radiation Spatial Distribution in Areas with Few Global Solar Radiation Stations: A Case Study of the China Tropical Zone

1
Institute of Scientific and Technical Information, Chinese Academy of Tropical Agricultural Sciences/Key Laboratory of Applied Research on Tropical Crop Information Technology of Hainan Province, Haikou 571000, China
2
Hainan Provincial Ecological and Environmental Monitoring Center, Haikou 571126, China
3
School of Geographical Sciences and Tourism, Zhaotong University, Zhaotong 657000, China
4
College of Geography and Environmental Science, Hainan Normal University, Haikou 571158, China
*
Author to whom correspondence should be addressed.
These authors contributed equally to this work and should be regarded as co-first authors.
Atmosphere 2023, 14(12), 1825; https://doi.org/10.3390/atmos14121825
Submission received: 8 October 2023 / Revised: 2 December 2023 / Accepted: 11 December 2023 / Published: 15 December 2023
(This article belongs to the Special Issue Agriculture-Climate Interactions in Tropical Regions)

Abstract

:
The Ångström–Prescott formula is commonly used in climatological calculation methods of solar radiation simulation. Aiming at the characteristics of a vast area, few meteorological stations, and uneven distribution in the tropical regions of China, in order to obtain the optimal parameters of the global solar radiation calculation model, this study proposes a suitable monthly global solar radiation model based on the single-station approach and the between-groups linkage of the A–P model, which utilizes monthly measured meteorological data from 80 meteorological stations spanning the period from 1996 to 2016 in the tropical zone of China, considering the similarity in changes of monthly sunshine percentage between stations. The applicability and accuracy of the correction parameters (a and b coefficients) were tested and evaluated, and then the modified parameters were extended to conventional meteorological stations through Thiessen polygons. Finally, the spatial distribution of solar radiation in the tropical region of China was simulated by kriging, IDW, and spline interpolation techniques. The results show the following: (1) The single-station model exhibited the highest accuracy in simulating the average annual global solar radiation, followed by the model based on the between-groups linkage. After optimizing the a and b coefficients, the simulation accuracy of the average annual global solar radiation increased by 5.3%, 8.1%, and 4.4% for the whole year, dry season, and wet season, respectively. (2) Through cross-validation, the most suitable spatial interpolation methods for the whole year, dry season, and wet season in the tropical zone of China were IDW, Kriging, and Spline, respectively. This research has positive implications for improving the accuracy of solar radiation prediction and guiding regional agricultural production.

1. Introduction

As the primary energy source for the Earth, global solar radiation (Rs) plays a crucial role in the radiation balance, energy exchange, hydrological cycle, photosynthesis, weather, and climate formation on land but also has direct connections to the physical, biological, and chemical processes occurring on Earth [1,2]. Due to the high cost of instruments and maintenance, the distribution of the Rs observing stations is limited in most regions of the world. Research on the accuracy estimation of Rs is important for agricultural industry development and clean energy utilization [3,4].
In order to meet the needs of effective solar radiation utilization and carrying out relevant scientific research, experts have developed many Rs simulation models. The models include empirical models [5,6,7], mechanism models [8,9], remote sensing inversion models [10], and machine learning models [11,12]. The Ångström–Prescott (A–P) model is recommended by the United Nations Food and Agriculture Organization for calculating solar radiation [13] and also widely used in the world under different climates [14].
Researchers have conducted a large amount of studies on the modification of the A–P model. For example, meteorological parameters except sunshine duration were added to the A–P model, such as the temperature, cloud amounts, or other meteorological parameters [15]. Alternatively, the linear A–P model has been transformed into non-linear forms such as multiple [16], exponential [17], logarithmic [18], and power function forms [19]. It is noteworthy that researchers have significantly enhanced the prediction accuracy of solar radiation by employing machine learning algorithms, such as support vector machines (SVMs) [20], artificial neural networks (ANNs) [21], or deep learning models [22,23]. This integrated approach aims to more accurately capture the intricate non-linear relationships between solar radiation and meteorological parameters, which require a greater amount of data. Nevertheless, despite the existence of various improvement strategies, a substantial body of research findings indicates that the original Ångström–Prescott (A–P) model based on sunshine hours retains advantages, including fewer parameters, ease of acquisition, and a high simulation accuracy. Consequently, it continues to be widely adopted in solar radiation estimation [24,25,26].
The accuracy of parameters a and b directly influences the A–P model for estimating Rs. Most studies on parameters a and b utilize single-station data to calculate the regression coefficients [27]. However, this approach has specific requirements for the length of the time series data, and a shorter time series can directly impact the accuracy of the regression coefficients. For instance, He et al. [28] employed datasets from 1961 to 2000 from 54 solar radiation stations in China to establish various models, yielding high accuracy, which was closely linked to the use of long time series data. Liu et al. [29] conducted a comparative analysis of the performance of models based on different sites using data from 15 radiation stations in the Tibetan Plateau and its surrounding regions from 1993 to 2010. However, due to the conservative response of the sum of the a and b coefficients to the time scale, the significant impact of the time scale on the a and b coefficients did not notably affect the accuracy of Rs estimation [30]. Another simulation method is the zoning method, which involves dividing each station into different zones based on common characteristics. This method enhances the number of regression samples and the accuracy of empirical coefficients, thereby obtaining the calculation formula for each region. For example, Xiong and Zhou [31] employed the between-groups linkage to divide 152 meteorological stations into four zones and compared the simulation accuracy with the average annual solar radiation of a single station, considering the varied terrain and complex climate in Sichuan. The results demonstrated a significant improvement in simulation accuracy after the zoning process. Xia et al. [32], utilizing the least squares regression method, calculated the monthly a and b coefficients for 38 agricultural regions in China based on meteorological observations from 121 sites, which compared and validated the relative accuracy of the calculated Rs with the values suggested by the Food and Agriculture Organization (FAO). The results indicated that the relative accuracy of Rs calculated using the regression values of a and b coefficients was superior to that of Rs calculated using the values suggested by the FAO. However, within each agricultural sub-region, the former did not outperform the latter in all months.
In summary, due to the large geographical latitude range and significant differences in dry and wet seasons, there are only 11 solar radiation meteorological stations in the tropical zone of China, which covers an area of 500,000 km2. In response to the characteristics of large area, sparse meteorological stations, and uneven distribution in the tropical regions of China, and aiming to obtain optimal parameters for global solar radiation calculation models, this study proposes a monthly global solar radiation model based on a single-station method and between-groups linkage of the Ångström–Prescott (A–P) model. Utilizing monthly meteorological data from 80 meteorological stations in the tropical regions of China from 1996 to 2016, the study considers the similarity in inter-station monthly sunshine percentage variations. The applicability and accuracy of the adjusted parameters (a and b coefficients) were tested and evaluated, and the corrected parameters were extended to conventional meteorological stations through Thiessen polygons. Finally, the spatial distribution of solar radiation in the tropical regions of China was simulated using Kriging, inverse distance weighting (IDW), and Spline interpolation techniques. This research not only enriches the calibration cases of the Ångström–Prescott formula coefficients but also enhances the accuracy of solar radiation simulation, providing valuable references for exploring the spatial distribution characteristics during the entire year and dry–wet seasons.

2. Materials and Methods

2.1. Study Area

The tropical zone in China is approximately 500,000 km², mainly distributed in provinces such as Hainan, Guangdong, Guangxi, and Taiwan (approximately between 18° N and 24° N), as well as the dry and hot valley regions of Yunnan, Guizhou, and Sichuan [33]. Those provinces and regions have diverse natural and climatic resources and rich varieties of animals and plants and are suitable for studying and protecting biodiversity. Those are important production areas of winter fruits and vegetables in China, which are important parts of agriculture. Affected by seasonal differences in monsoon and atmospheric circulation, the dry and wet seasons are distinct, and the climate change pattern is unique. The variation pattern of global solar radiation will change accordingly, which can lead to a transformation in the regional water and heat conditions, as well as the agricultural production potential.

2.2. Dataset

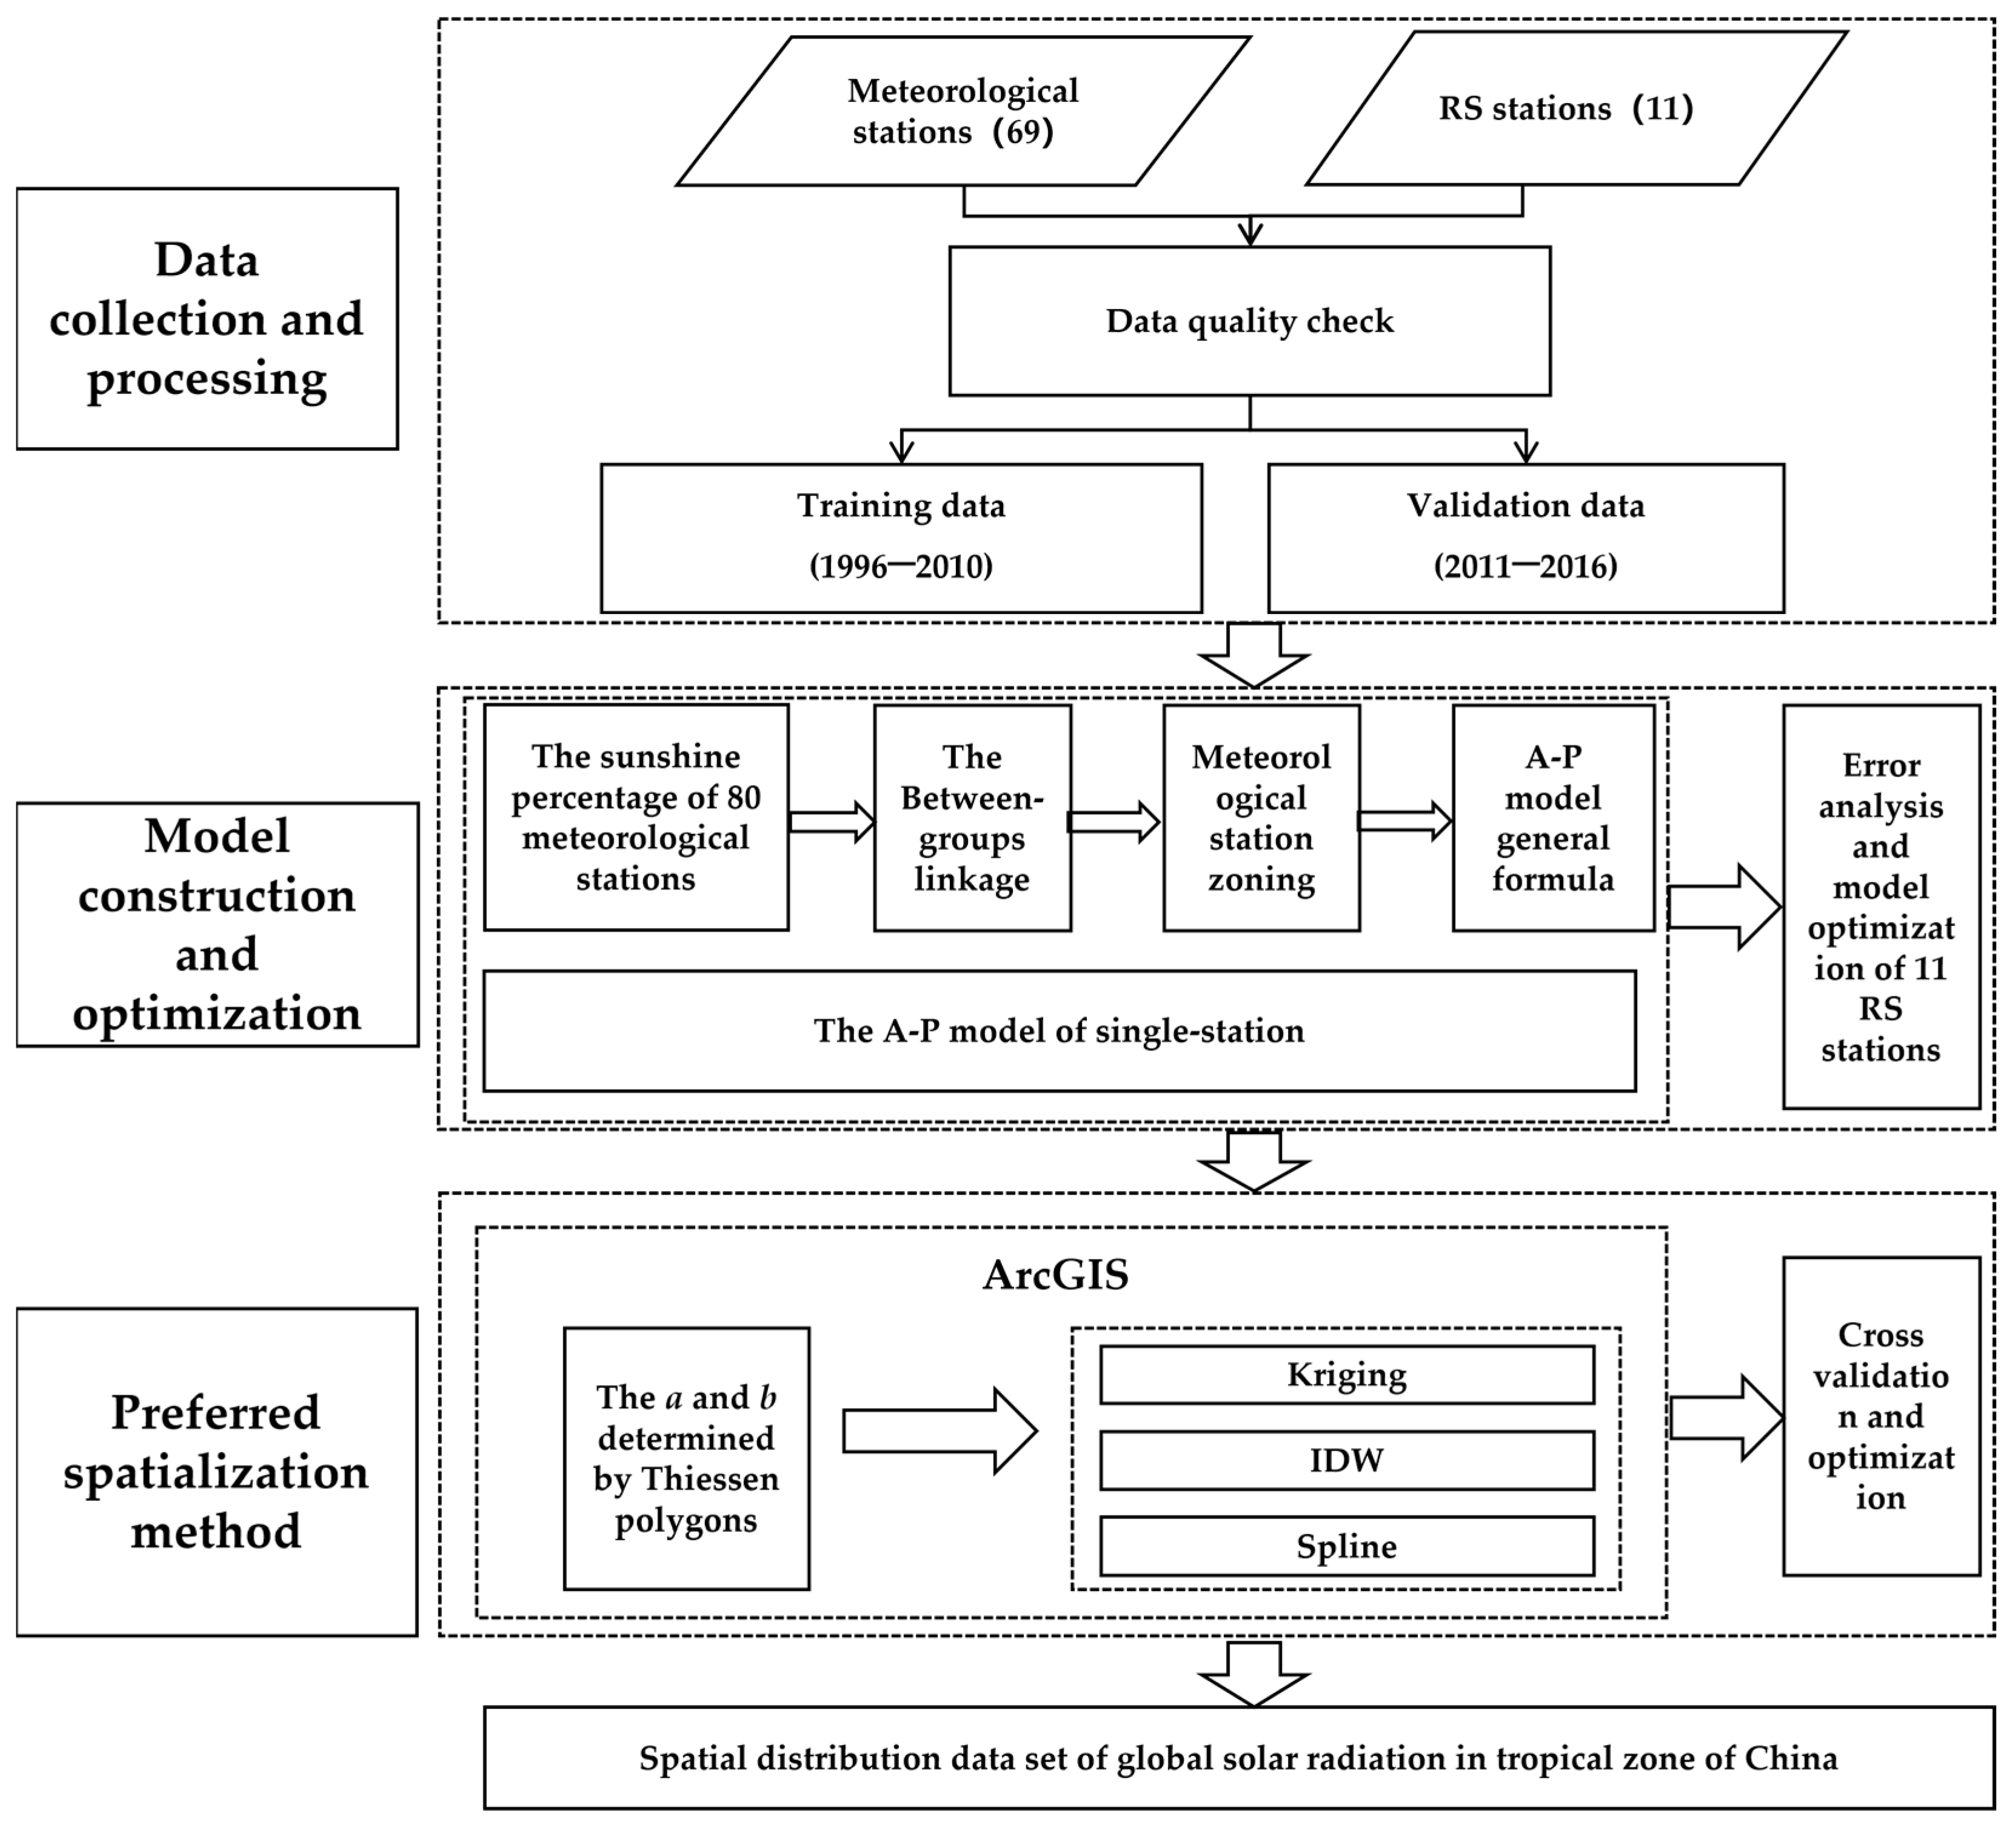
In this study, the monthly datasets of 80 meteorological stations from 1996 to 2016 in the tropical zone of China (Figure 1) were adopted (the basic information is shown in Table A1), mainly including monthly sunshine hours and Rs observation data. Among them, 11 meteorological stations covered solar radiation observation data, and the data were integral and reliable (Table 1). Linear interpolation produced very good results for short gaps similar to those found in the case studies [32]. In many cases it outperformed machine learning and deep learning techniques. Thus, for handling outliers and missing values, we employed elimination and linear interpolation methods to ensure the reliability and completeness of the data. Linear interpolation was performed using SPSS 22.0 software, with the additional constraint of ensuring that the atmospheric transmissivity coefficient (clearness index) remained consistently below 0.85. Following a thorough inspection, the data integrity was confirmed to be intact. The data were divided into two parts by time, with data from 1996 to 2010 as the training data and data from 2011 to 2016 as the validation data. Referring to Li et al. [15], the dry–wet seasons in the tropical zone of China were divided, with the period from November to April as the dry season and the period from May to October as the wet season. The flowchart representing the steps taken for modeling the global solar irradiation of the tropical zone of China is shown in Figure 2.

2.3. Methods

2.3.1. Estimation of the Global Solar Radiation under the A–P Model

We used the Ångström–Prescott model to estimate the monthly global solar radiation. The formula is as follows:
H s = H o a + b S S 0
where H s is the monthly global solar radiation on horizontal surface, MJ·m−2; H o is the astronomical radiation, MJ·m−2; S / S 0 is the fraction of sunlight received, dimensionless, with S being the number of hours of daylight and S 0 being the total number of hours; and a and b are empirical coefficients, dimensionless.
H o can be calculated by the following formula [34]:
H o = n H m
H m = T I o π ρ o ω o s i n φ s i n δ + c o s φ c o s δ c o s ω o
ω o = a c o s t a n φ t a n δ
δ = ( 0.3723 + 23.2567 sin   x + 0.1149 sin   2 x 0.1712 sin   3 x 0.758 cos   x + 0.3656 cos   2 x + 0.0201 cos   3 x ) 180 π
x = 2 π N N O 365.2422
N O = 79.6764 + 0.2422 y 1985 I N T 0.25 y 1985
where H m is the month for daily astronomical radiation (MJ·m−2·d−1); n indicates the number of days in the current month (d); T indicates the time of a day, the value of which is 1440 (min·d−1); I o is the solar constant, the value of which is 0.082 (MJ·m−2·min−1); 1/ ρ o is the mean distance between the earth and the sun, dimensionless; ω o is the solar hour angle (rad); φ is the geographical latitude (rad); δ is the declination of the sun (rad); x indicates the calculation parameter, dimensionless; N is in day order, the value of which is 365 or 366, dimensionless; N O indicates the calculation parameter, dimensionless; and y represents the calculation year, dimensionless.

2.3.2. The Between-Groups Linkage

The between-groups linkage is a commonly used clustering method in system clustering analysis. It calculates the Euclidean distance between multiple groups of data and compares them based on this distance. The closest data points are grouped into one category, and this process is repeated until all the data is categorized [31]. Taking the sunshine percentage of 80 meteorological stations of China from 1996 to 2010 as a classification factor, all meteorological stations in the study area were divided using SPSS 22.0 software to ensure that each subdivision contained at least one solar radiation station. Finally, the data of solar radiation stations in the same zone were involved in the calculation of regression coefficients a and b of the A–P model, so as to obtain the partition general formula.

2.3.3. Thiessen Polygons

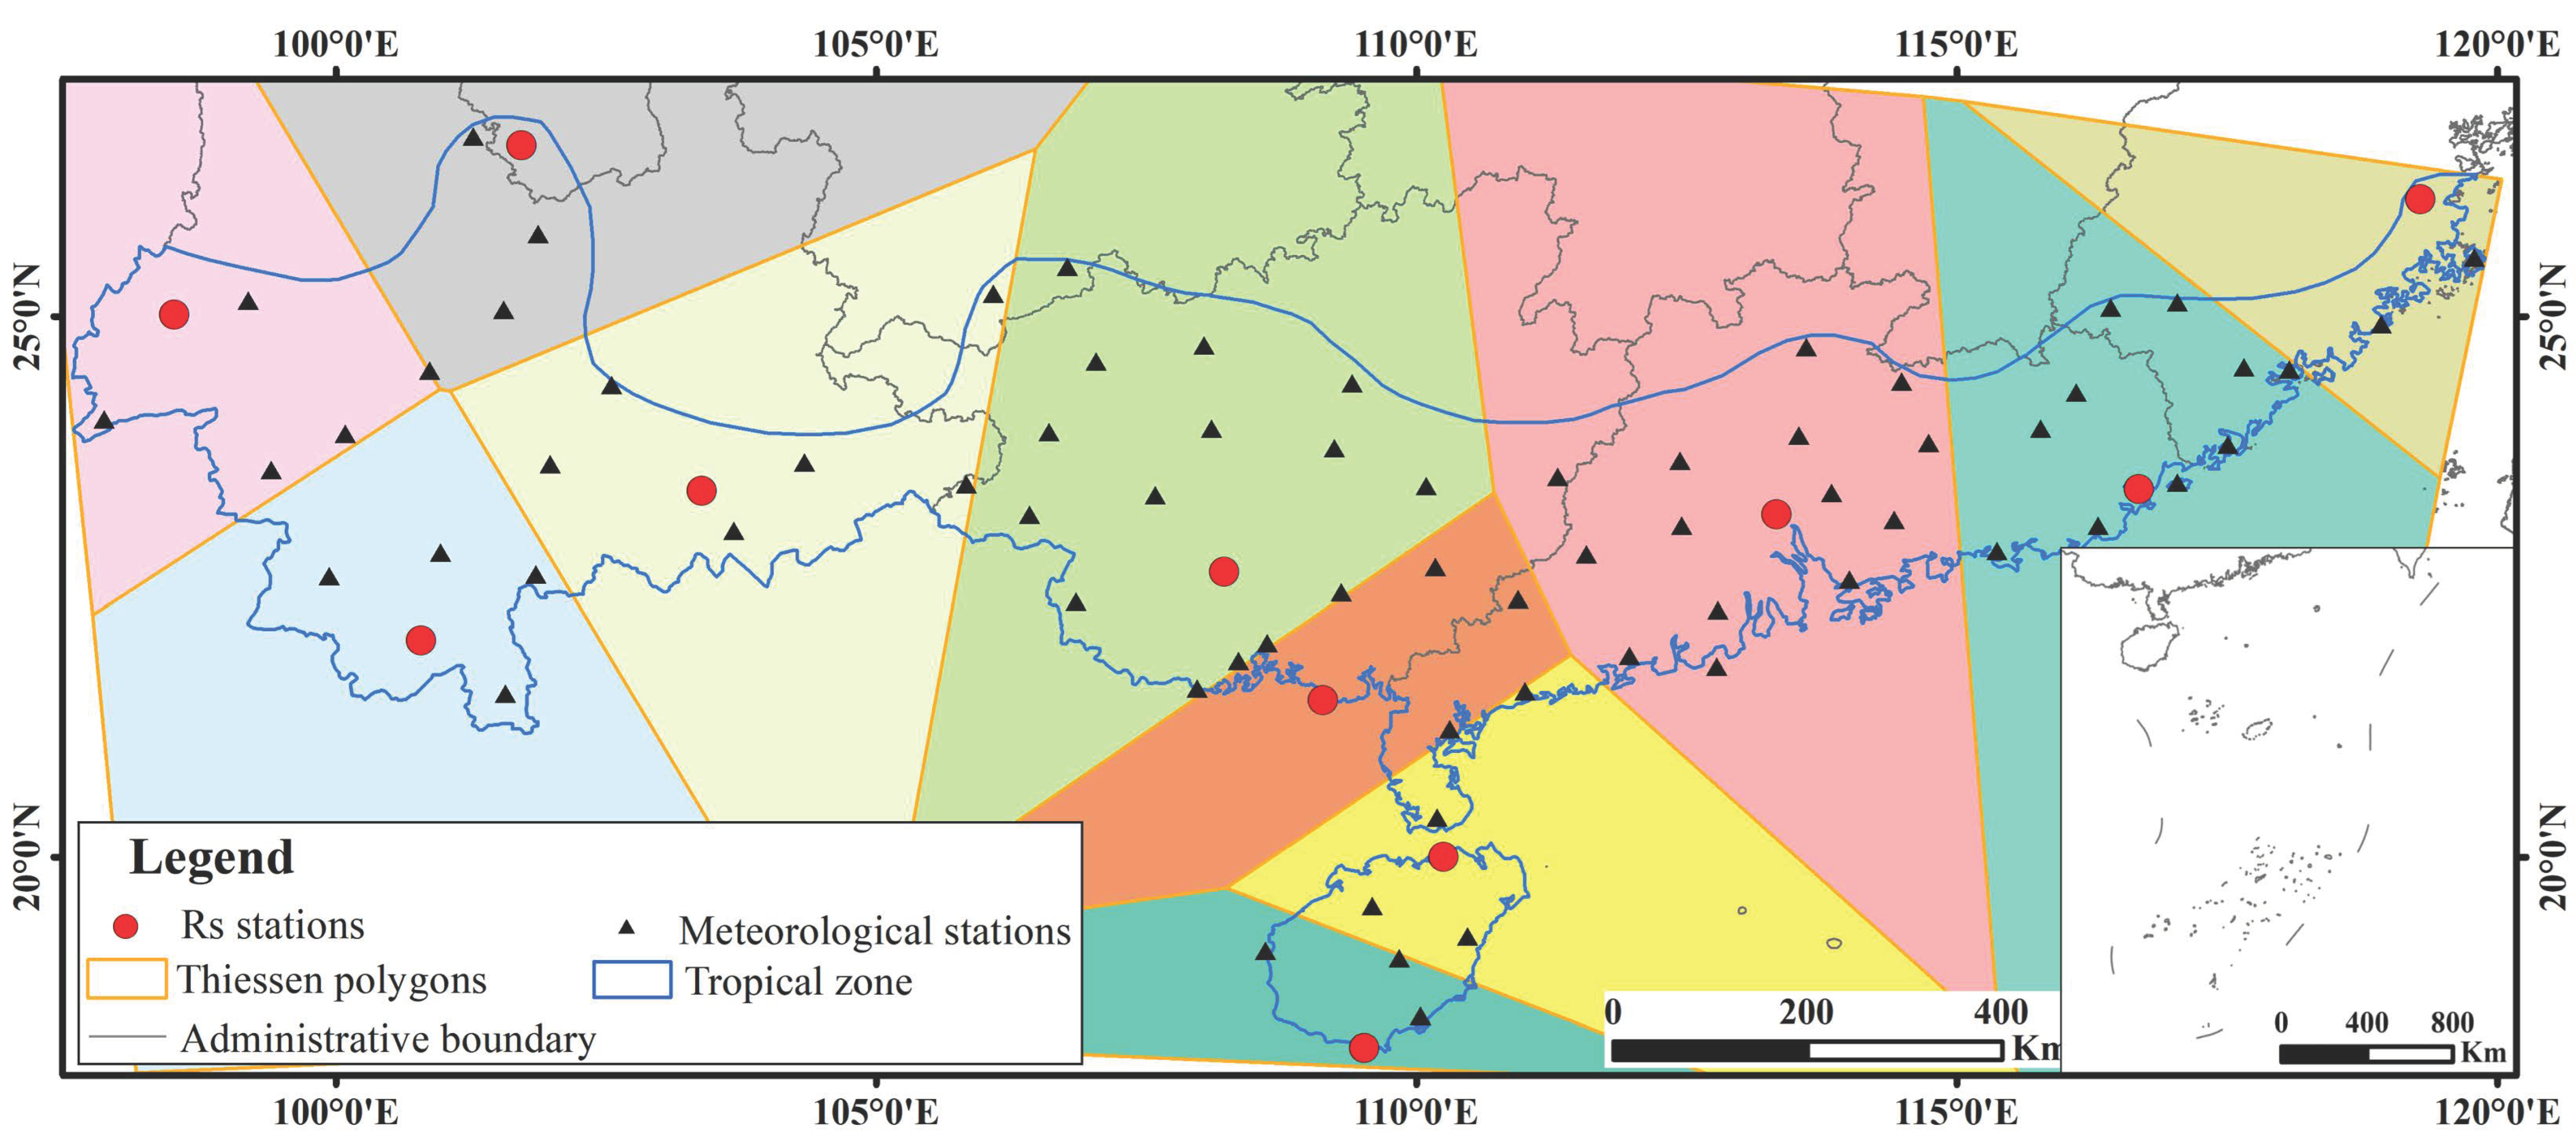
The results of the between-groups linkage were used for model establishment and error analysis. After a and b were preferred by error analysis, a and b of the general formula were not suitable for conventional meteorological stations. Therefore, the Thiessen polygons centered around 11 solar radiation stations were created, with each polygon containing only one solar radiation station. Meteorological stations within the same polygon used the same empirical coefficients [35]. Then, solar radiation simulation data from 80 meteorological stations were used for spatial interpolation.

2.3.4. Spatial Interpolation

In order to study the spatial distribution characteristics of the average annual global solar radiation in China, three widely used spatial interpolation methods were adopted to simulate the spatial distribution of global solar radiation, namely, Kriging, inverse distance weighting (IDW), and Spline. Spatial interpolation was conducted using the Spatial Analyst Tools in ArcGIS 10.2.

2.3.5. Statistical Evaluation

The mean absolute percentage error (MAPE) was used to calculate the error between each model and the measured values, and the a and b values of the A–P model with the smallest error were selected as the optimal ones. For the interpolation results, the mean absolute percentage error (MAPE), root mean squared error (RMSE), mean absolute error (MAE), mean bias error (MBE), and coefficient of determination (R²) were used to evaluate the error between the estimated and measured values of solar radiation spatial distribution. The formulas were as follows:
M A P E = 100 n i = 1 n O i E i O i
R M S E = 1 n i = 1 n O i E i 2
M A E = 1 n i = 1 n O i E i
M B E = 1 n i = 1 n O i E i
R 2 = i = 1 n   O i O i ¯ E i E i ¯ i = 1 n   O i O i ¯ 2 i = 1 n   E i E i ¯ 2 2
where O i is the observed value of solar radiation, MJ·m−2; O i ¯ is the mean of observed values, MJ·m−2; E i is the estimated value of solar radiation, MJ·m−2; and E i ¯ is the mean of estimated value, MJ·m−2. n is the corresponding number of observations.

3. Results and Discussion

3.1. Result of the Between-Groups Linkage

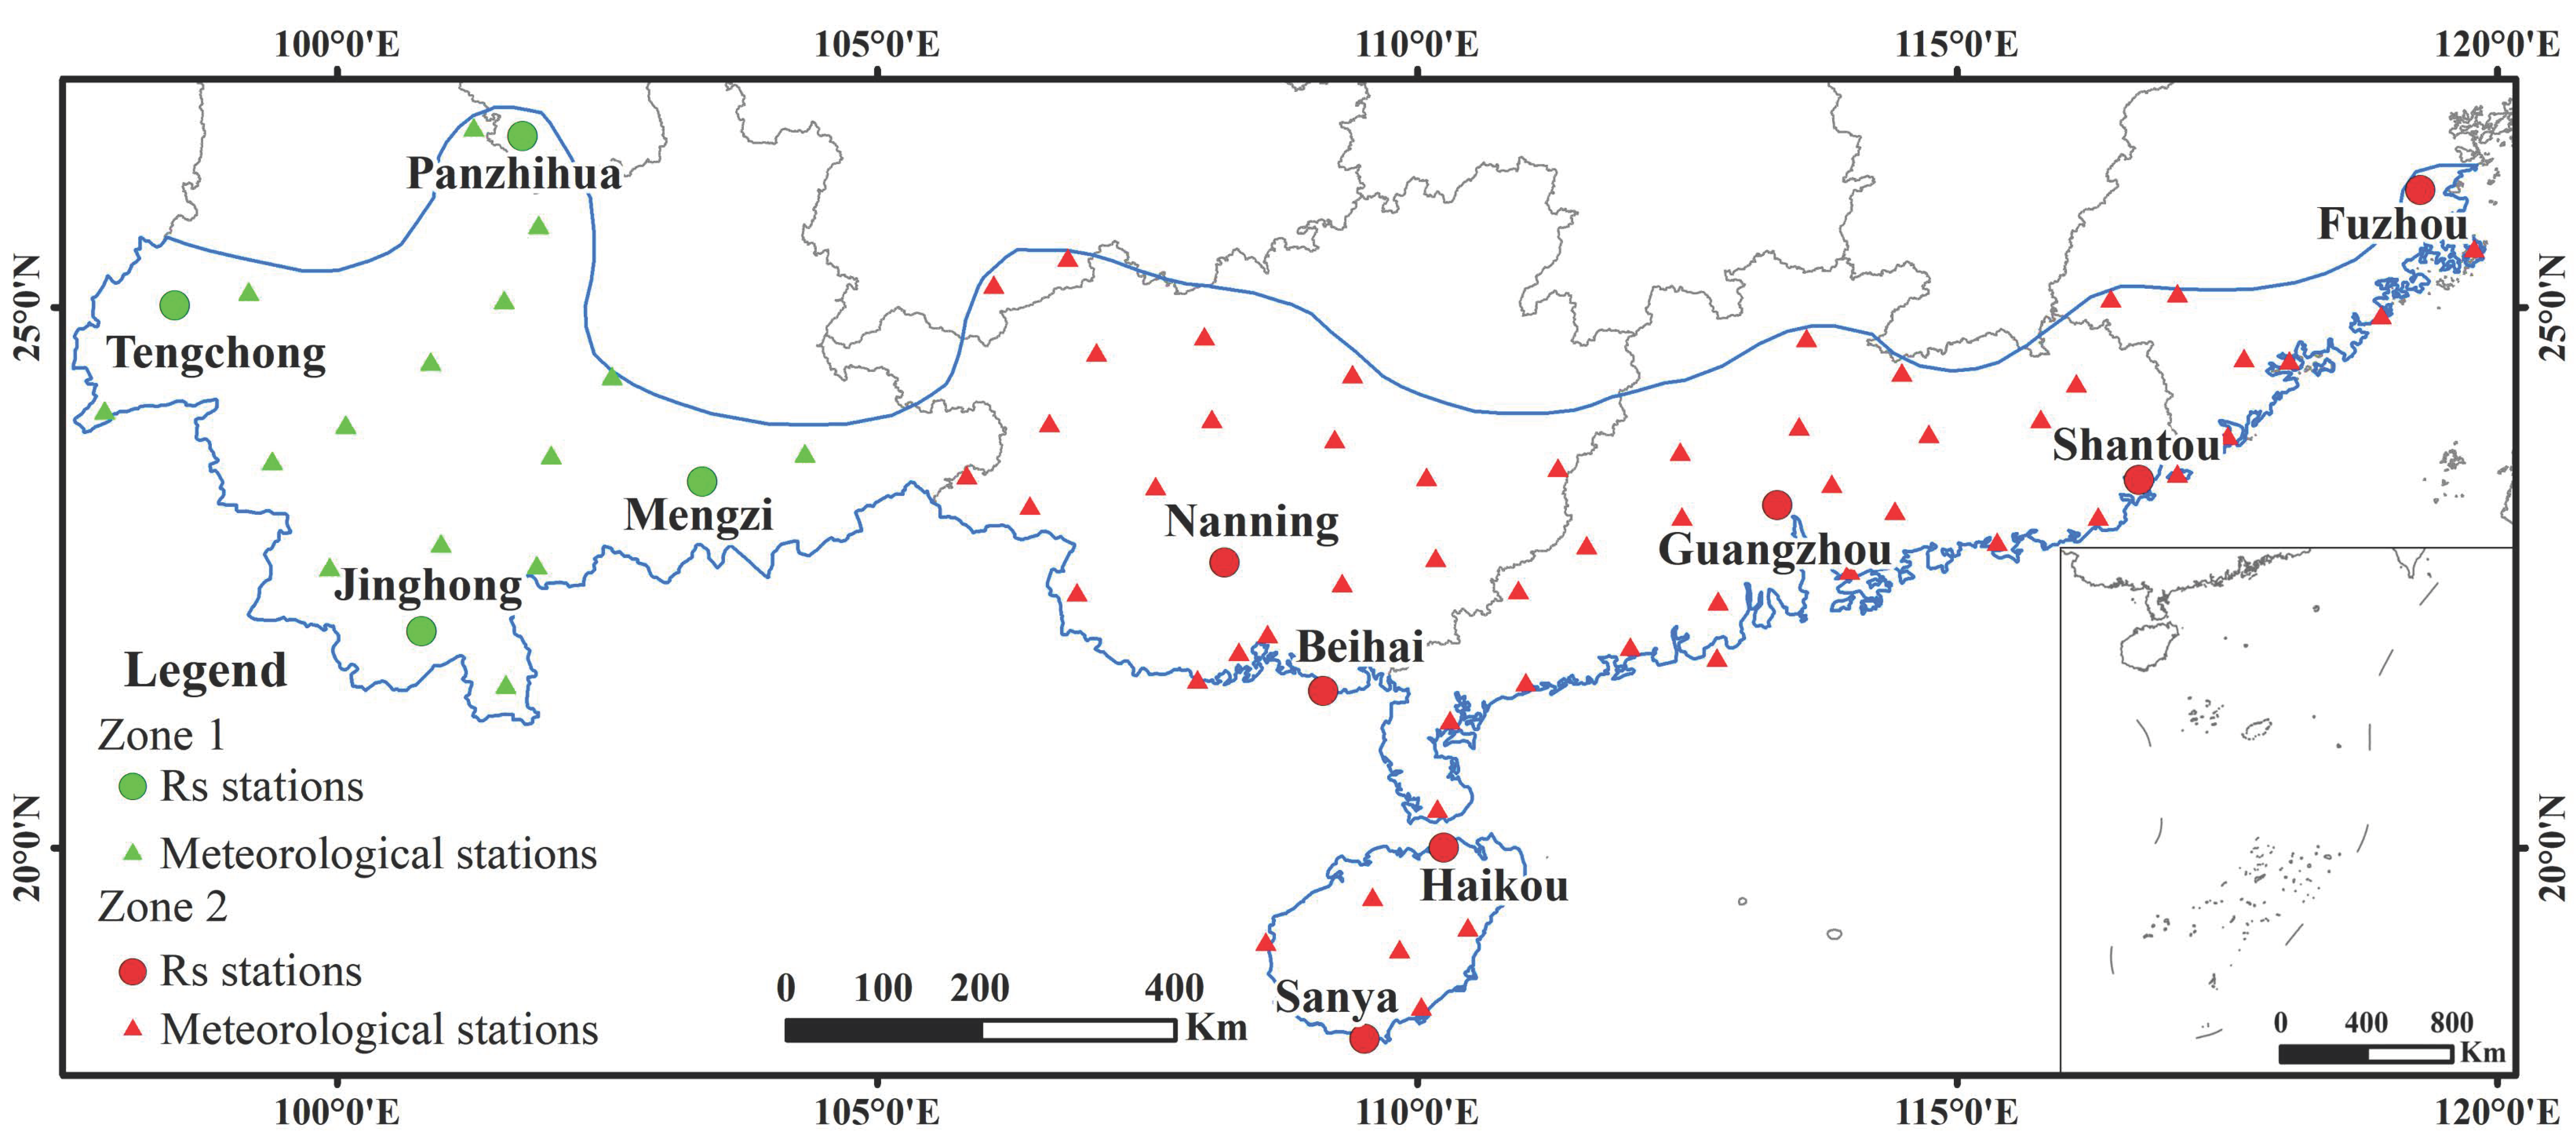
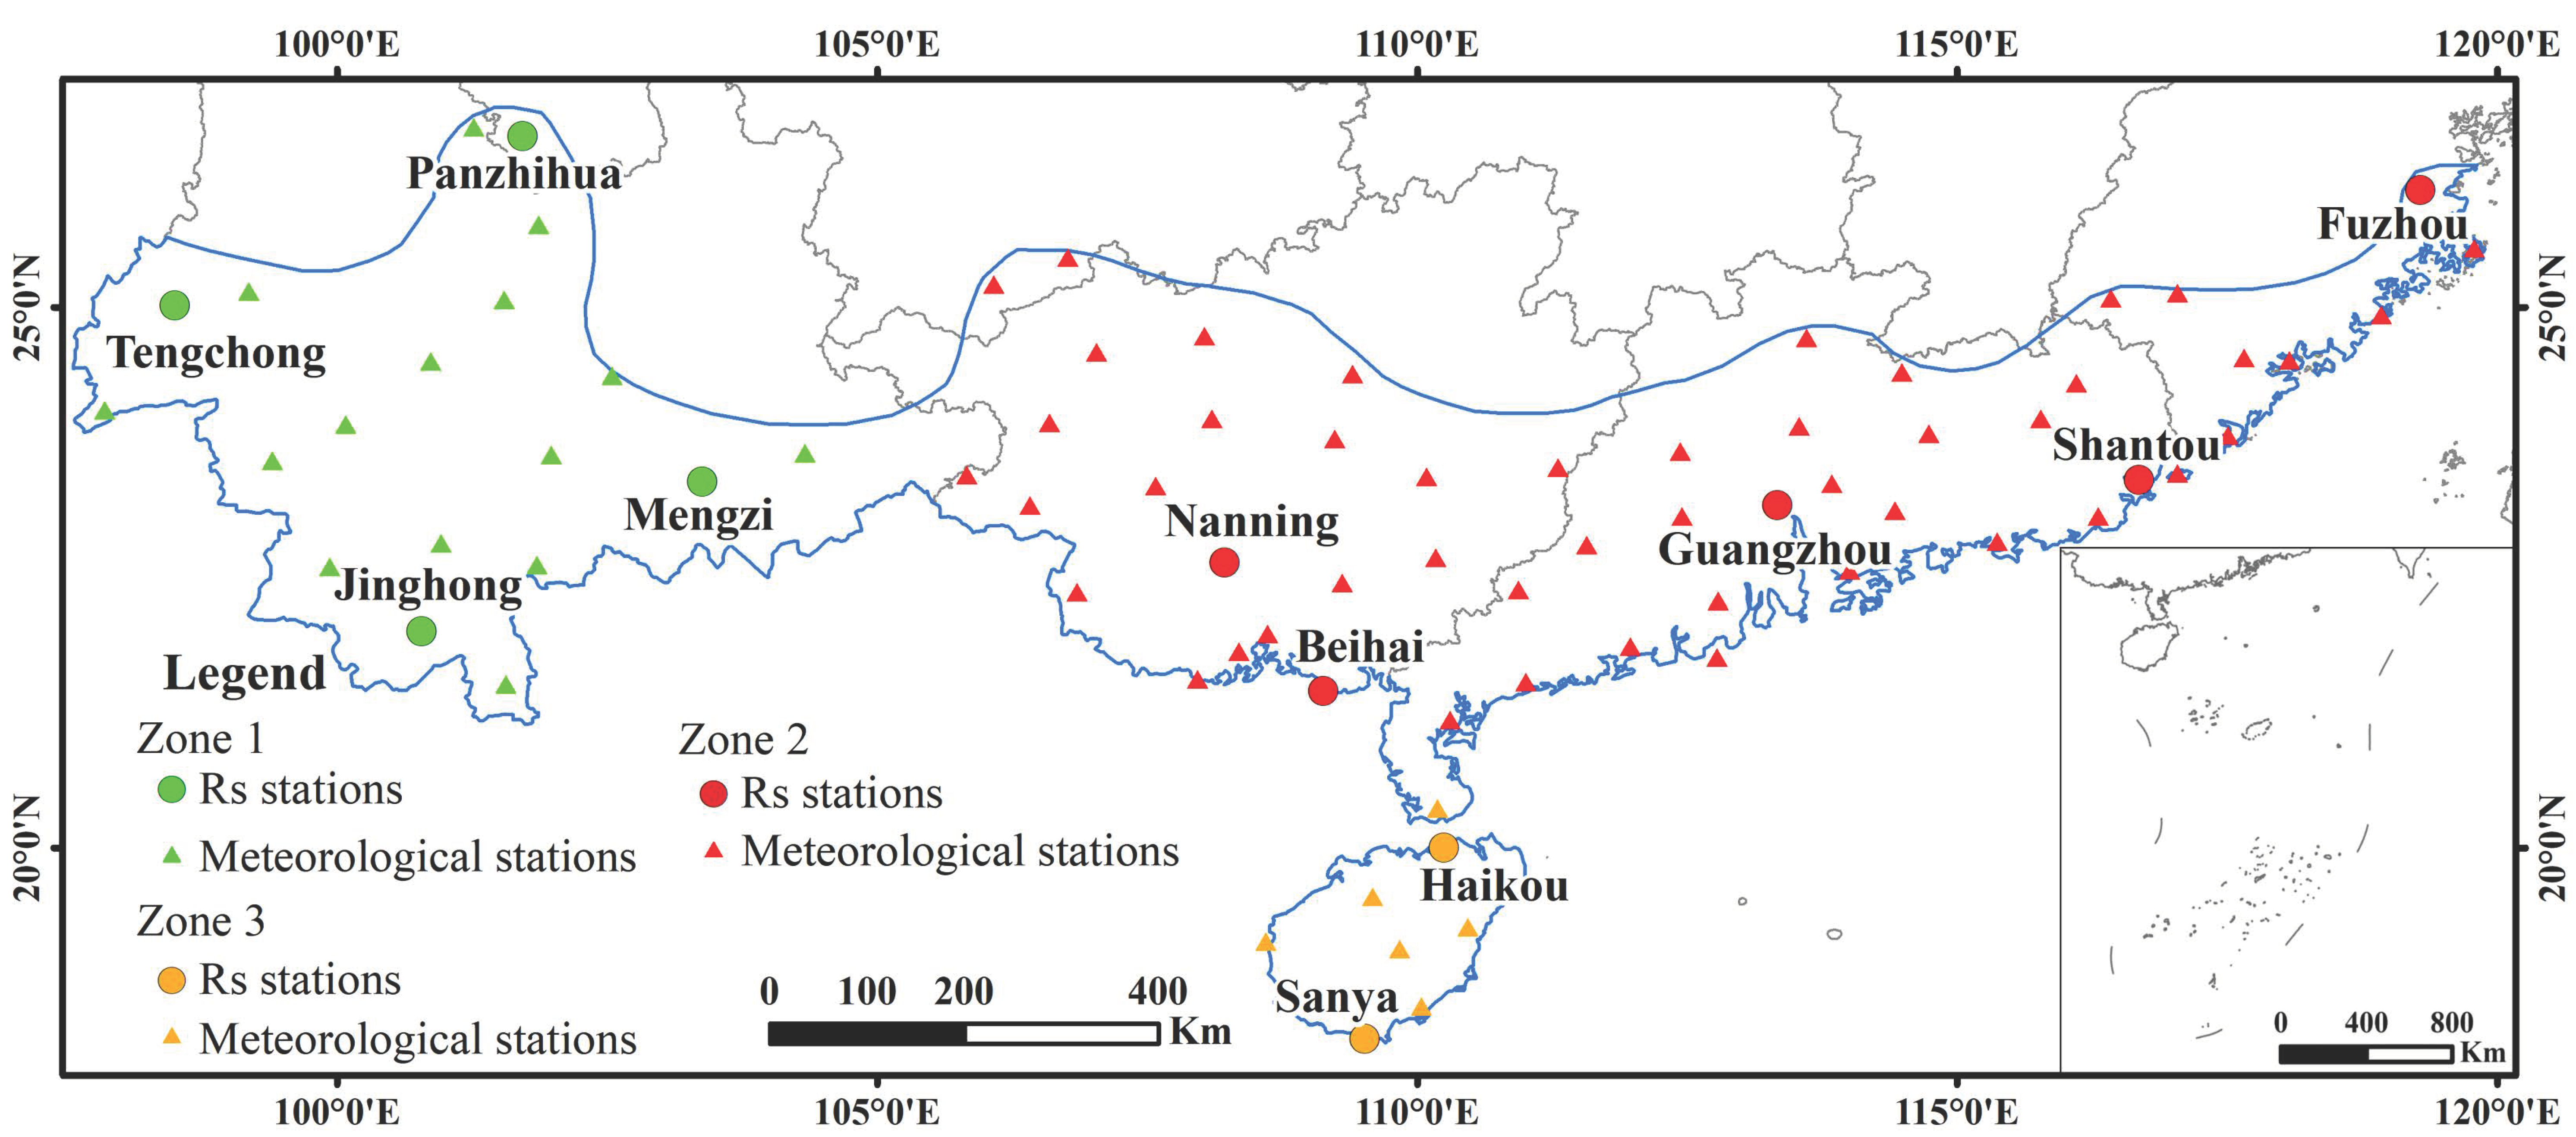
T 1 is a single site model without cluster partitioning, and only 11 solar radiation sites are applied. The T 2 and T 3 models are two clustering partition models for the tropical region of China, taking the sunshine percentage of 80 meteorological stations of China from 1996 to 2010 as a classification factor, based on the between-groups linkage (Figure 3 and Figure 4). As shown in Figure 3, the first clustering result of T 2 grouped Tengchong, Panzhihua, Jinghong, and Mengzi stations as one zone, while Nanning, Beihai, Guangzhou, Shantou, Fuzhou, Haikou, and Sanya stations were grouped into another zone. The second clustering result of T 3 divided the stations into three zones (Figure 4), with the first region being the same as the previous result. Nanning, Beihai, Guangzhou, Shantou, and Fuzhou stations were grouped into the second zone, while Haikou and Sanya stations were grouped into the third zone. All the solar radiation stations in the same zone were used to calculate a and b of the A–P model, and the results were applied to all the solar radiation stations in the region. The results of the between-groups linkage and the single-station model of T 1 were validated using solar radiation observation values from 2011 to 2016. Then monthly a and b for each solar radiation station were selected.

3.2. Error Analysis and Coefficient a and b Optimization of the A–P Model

Through the MAPE, under different models and times, the values of each station showed significant errors (Figure 5).
Figure 5 shows the monthly measured and estimated solar radiation from 2011 to 2016. It can be seen that the estimation accuracy of T 1 was the highest, whose R² was 0.931 and MAPE was 6.452%, followed by T 2 , and T 3 had the worst estimation accuracy.
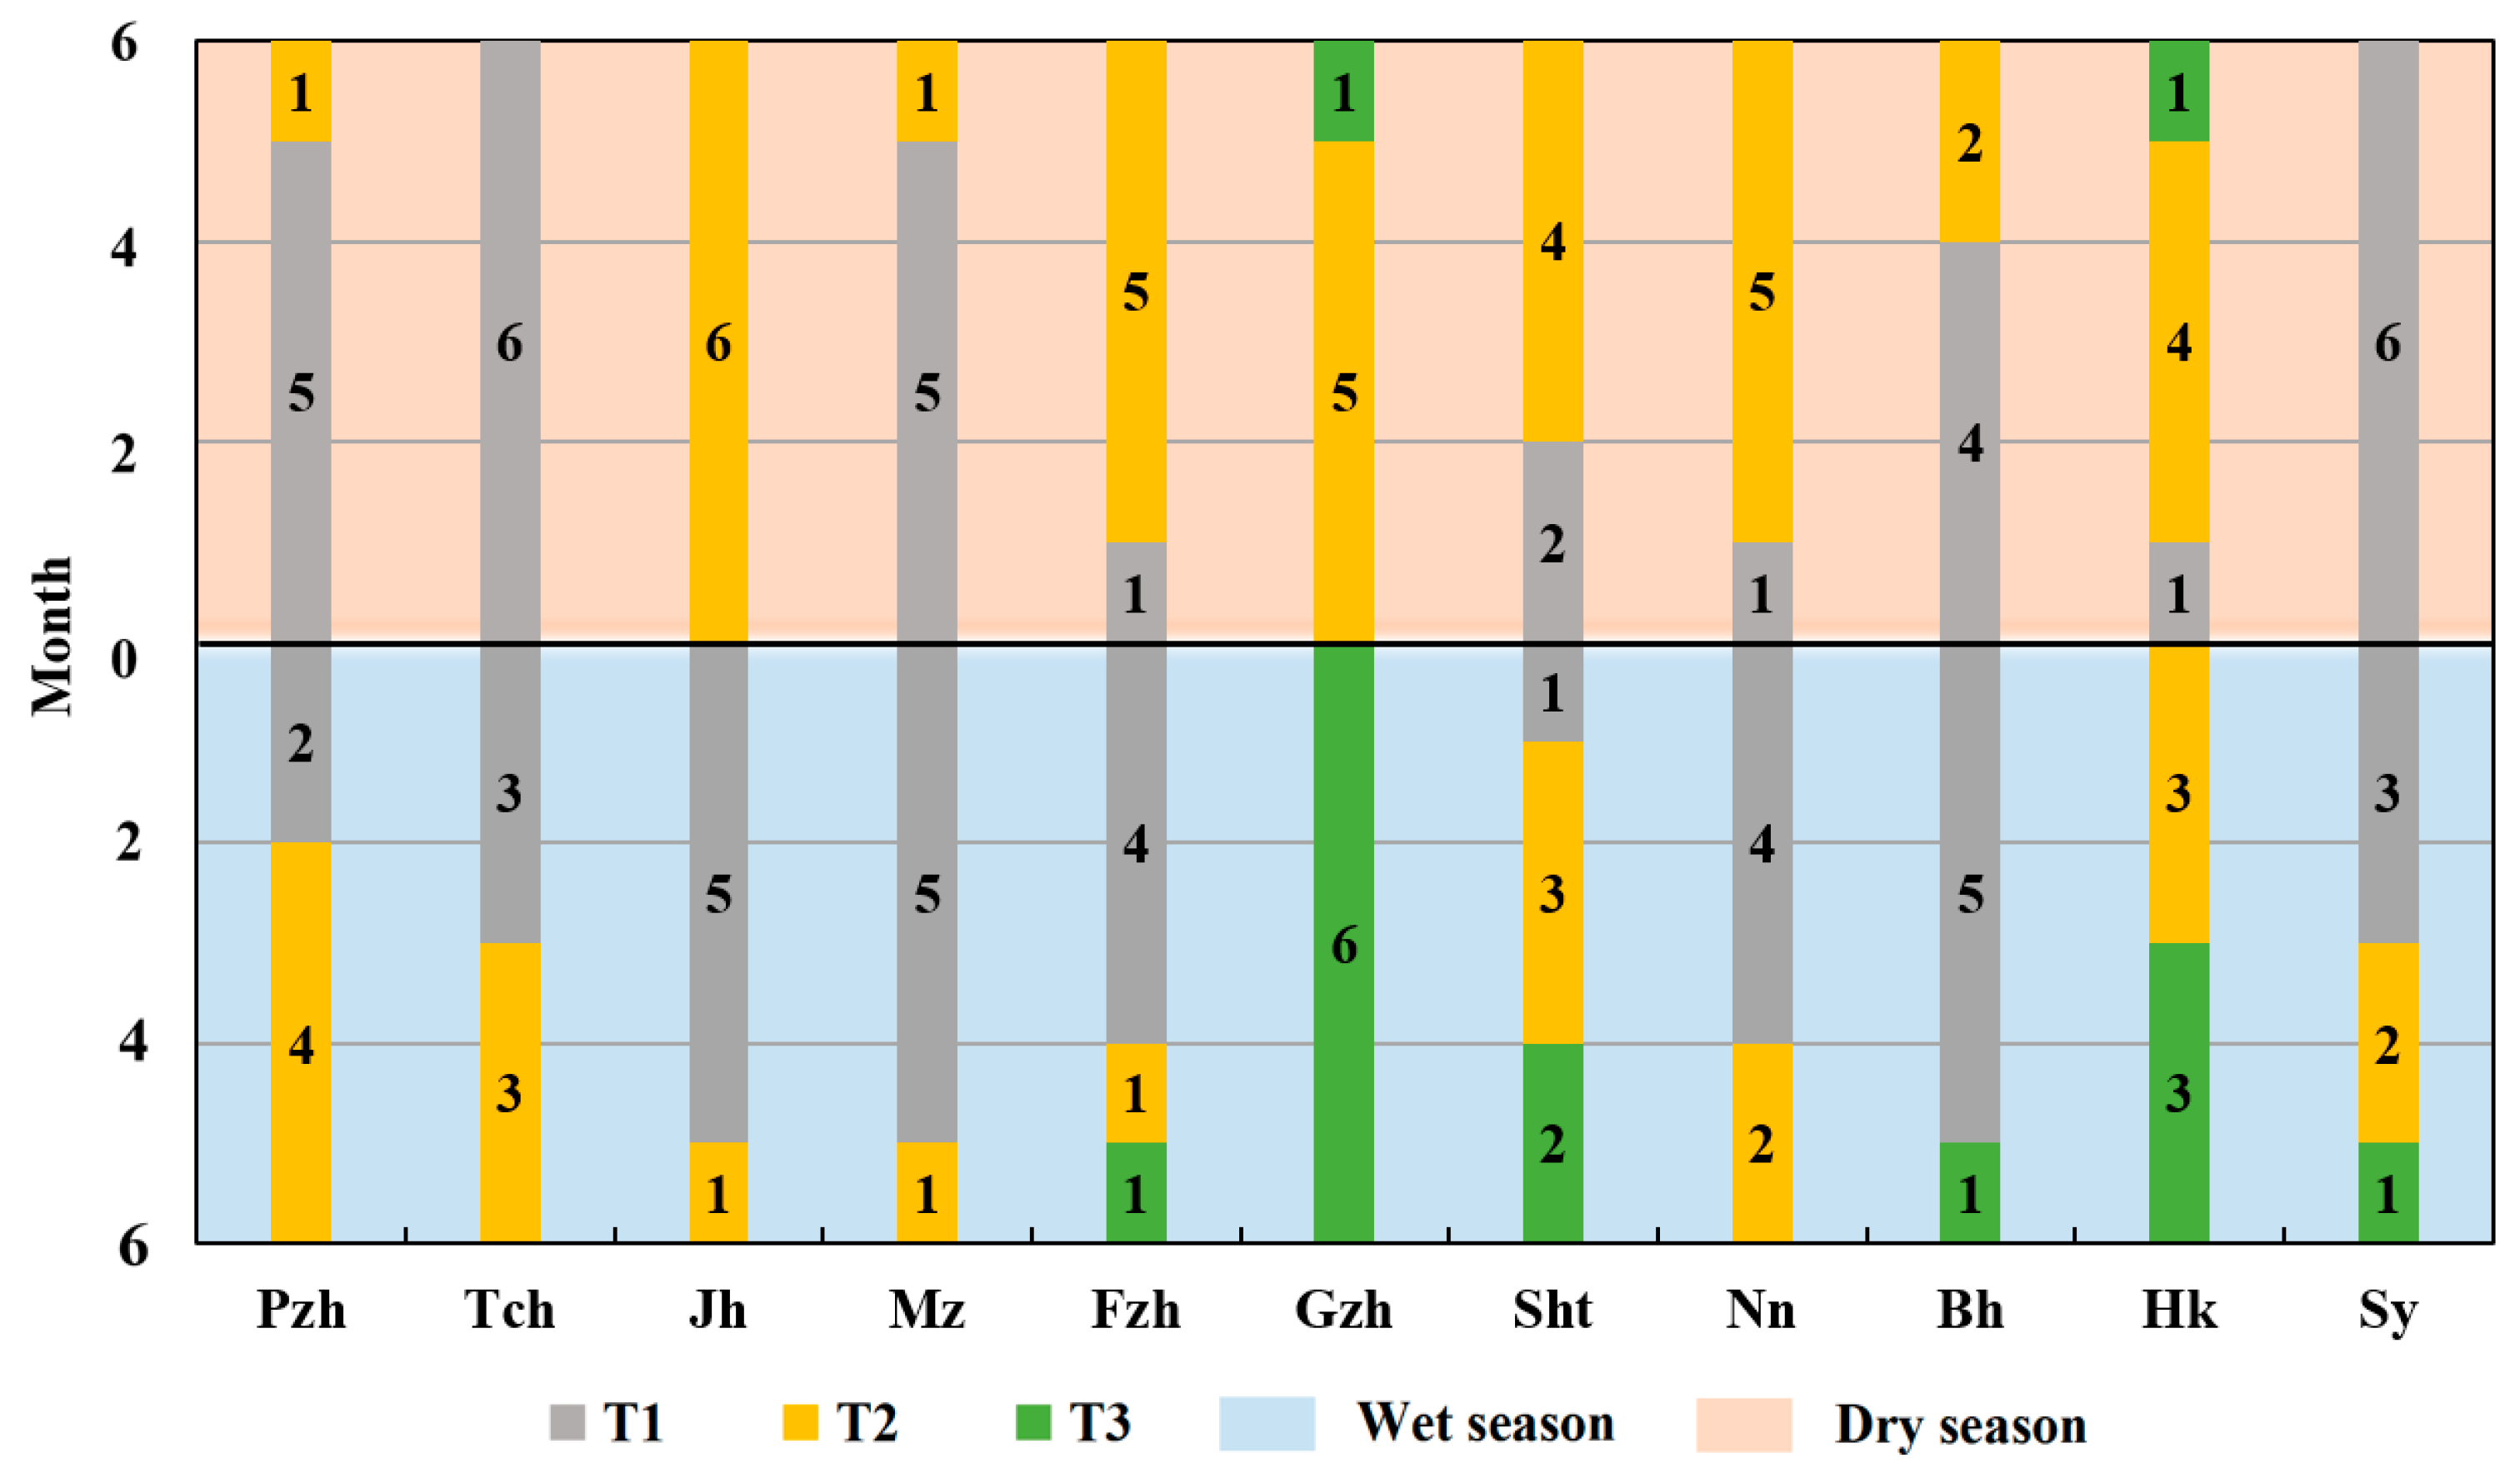
In order to further study the simulation of 11 solar radiation stations in each model, Figure 6 presents the number of preferred months of T 1 , T 2 , and T 3 .

3.2.1. The Whole Year (January–December)

Based on the error of each station, the MAPE values of each model on most stations were less than 10%. Only the error of Sanya station was large, where the MAPE values of T 2 and T 3 were more than 10%, and that of T 1 was 9.8%. Through the error analysis of each station, the a and b optimal rate of T 1 in the tropical zone of China was 47.7%, which was higher than those of T 2 (40.2%) and T 3 (12.1%). There were five stations with higher annual average global solar radiation simulation accuracies of T 1 , namely, Panzhihua, Tengchong, Mengzi, Beihai, and Sanya. There were five stations with higher simulation accuracies of T 2 , namely, Jinghong, Fuzhou, Shantou, Nanning, and Haikou. Only Guangzhou station had the highest simulation accuracy of T 3 . After the preferred combination of error analysis, the simulation accuracy of each station was increased by 0.1–5.3% relative to the simulation accuracy of one single model.

3.2.2. The Dry Season (November–April)

The a and b optimization rate of T 2 (50.0%) was higher than those of T 1 (47.0%) and T 3 (3.0%) through the error analysis. There were six stations with higher annual average solar global radiation simulation accuracies of T 2 , namely, Jinghong, Fuzhong, Guangzhou, Shantou, Nanning, and Haikou, among which Jinghong was the highest. There were five stations with higher simulation accuracies of T 1 , namely, Panzhihua, Tengchong, Mengzi, Beihai, and Sanya, among which Tengchong and Sanya were the highest. The simulation accuracy of T 3 during the dry season was significantly lower than that of the other two models. After optimizing the combination of models for each station, the overall accuracy can be increased by up to 8.1%.

3.2.3. The Wet Season (May–October)

By the error analysis, the a and b optimization rate of T 1 (48.5%) was higher than those of T 2 (30.3%) and T 3 (21.2%). There were six stations with higher annual average global solar radiation simulation accuracy of T 1 , namely, Jinghong, Mengzi, Fuzhou, Nanning, Beihai, and Sanya. Shantou had the highest simulation accuracy of T 2 . Guangzhou had the highest simulation accuracy of T 3 . After optimizing the combination of models for each station, the overall accuracy can be increased by up to 4.4%.
From the monthly error statistics of each station, it could be seen that there were differences in the accuracy of the annual average global solar radiation simulation at each station. No single station is exclusively suitable for a specific model. Therefore, the optimal values of a and b for each month were selected based on the simulation error (Table 2), which effectively improved the simulation accuracy of the annual average solar radiation at each station.
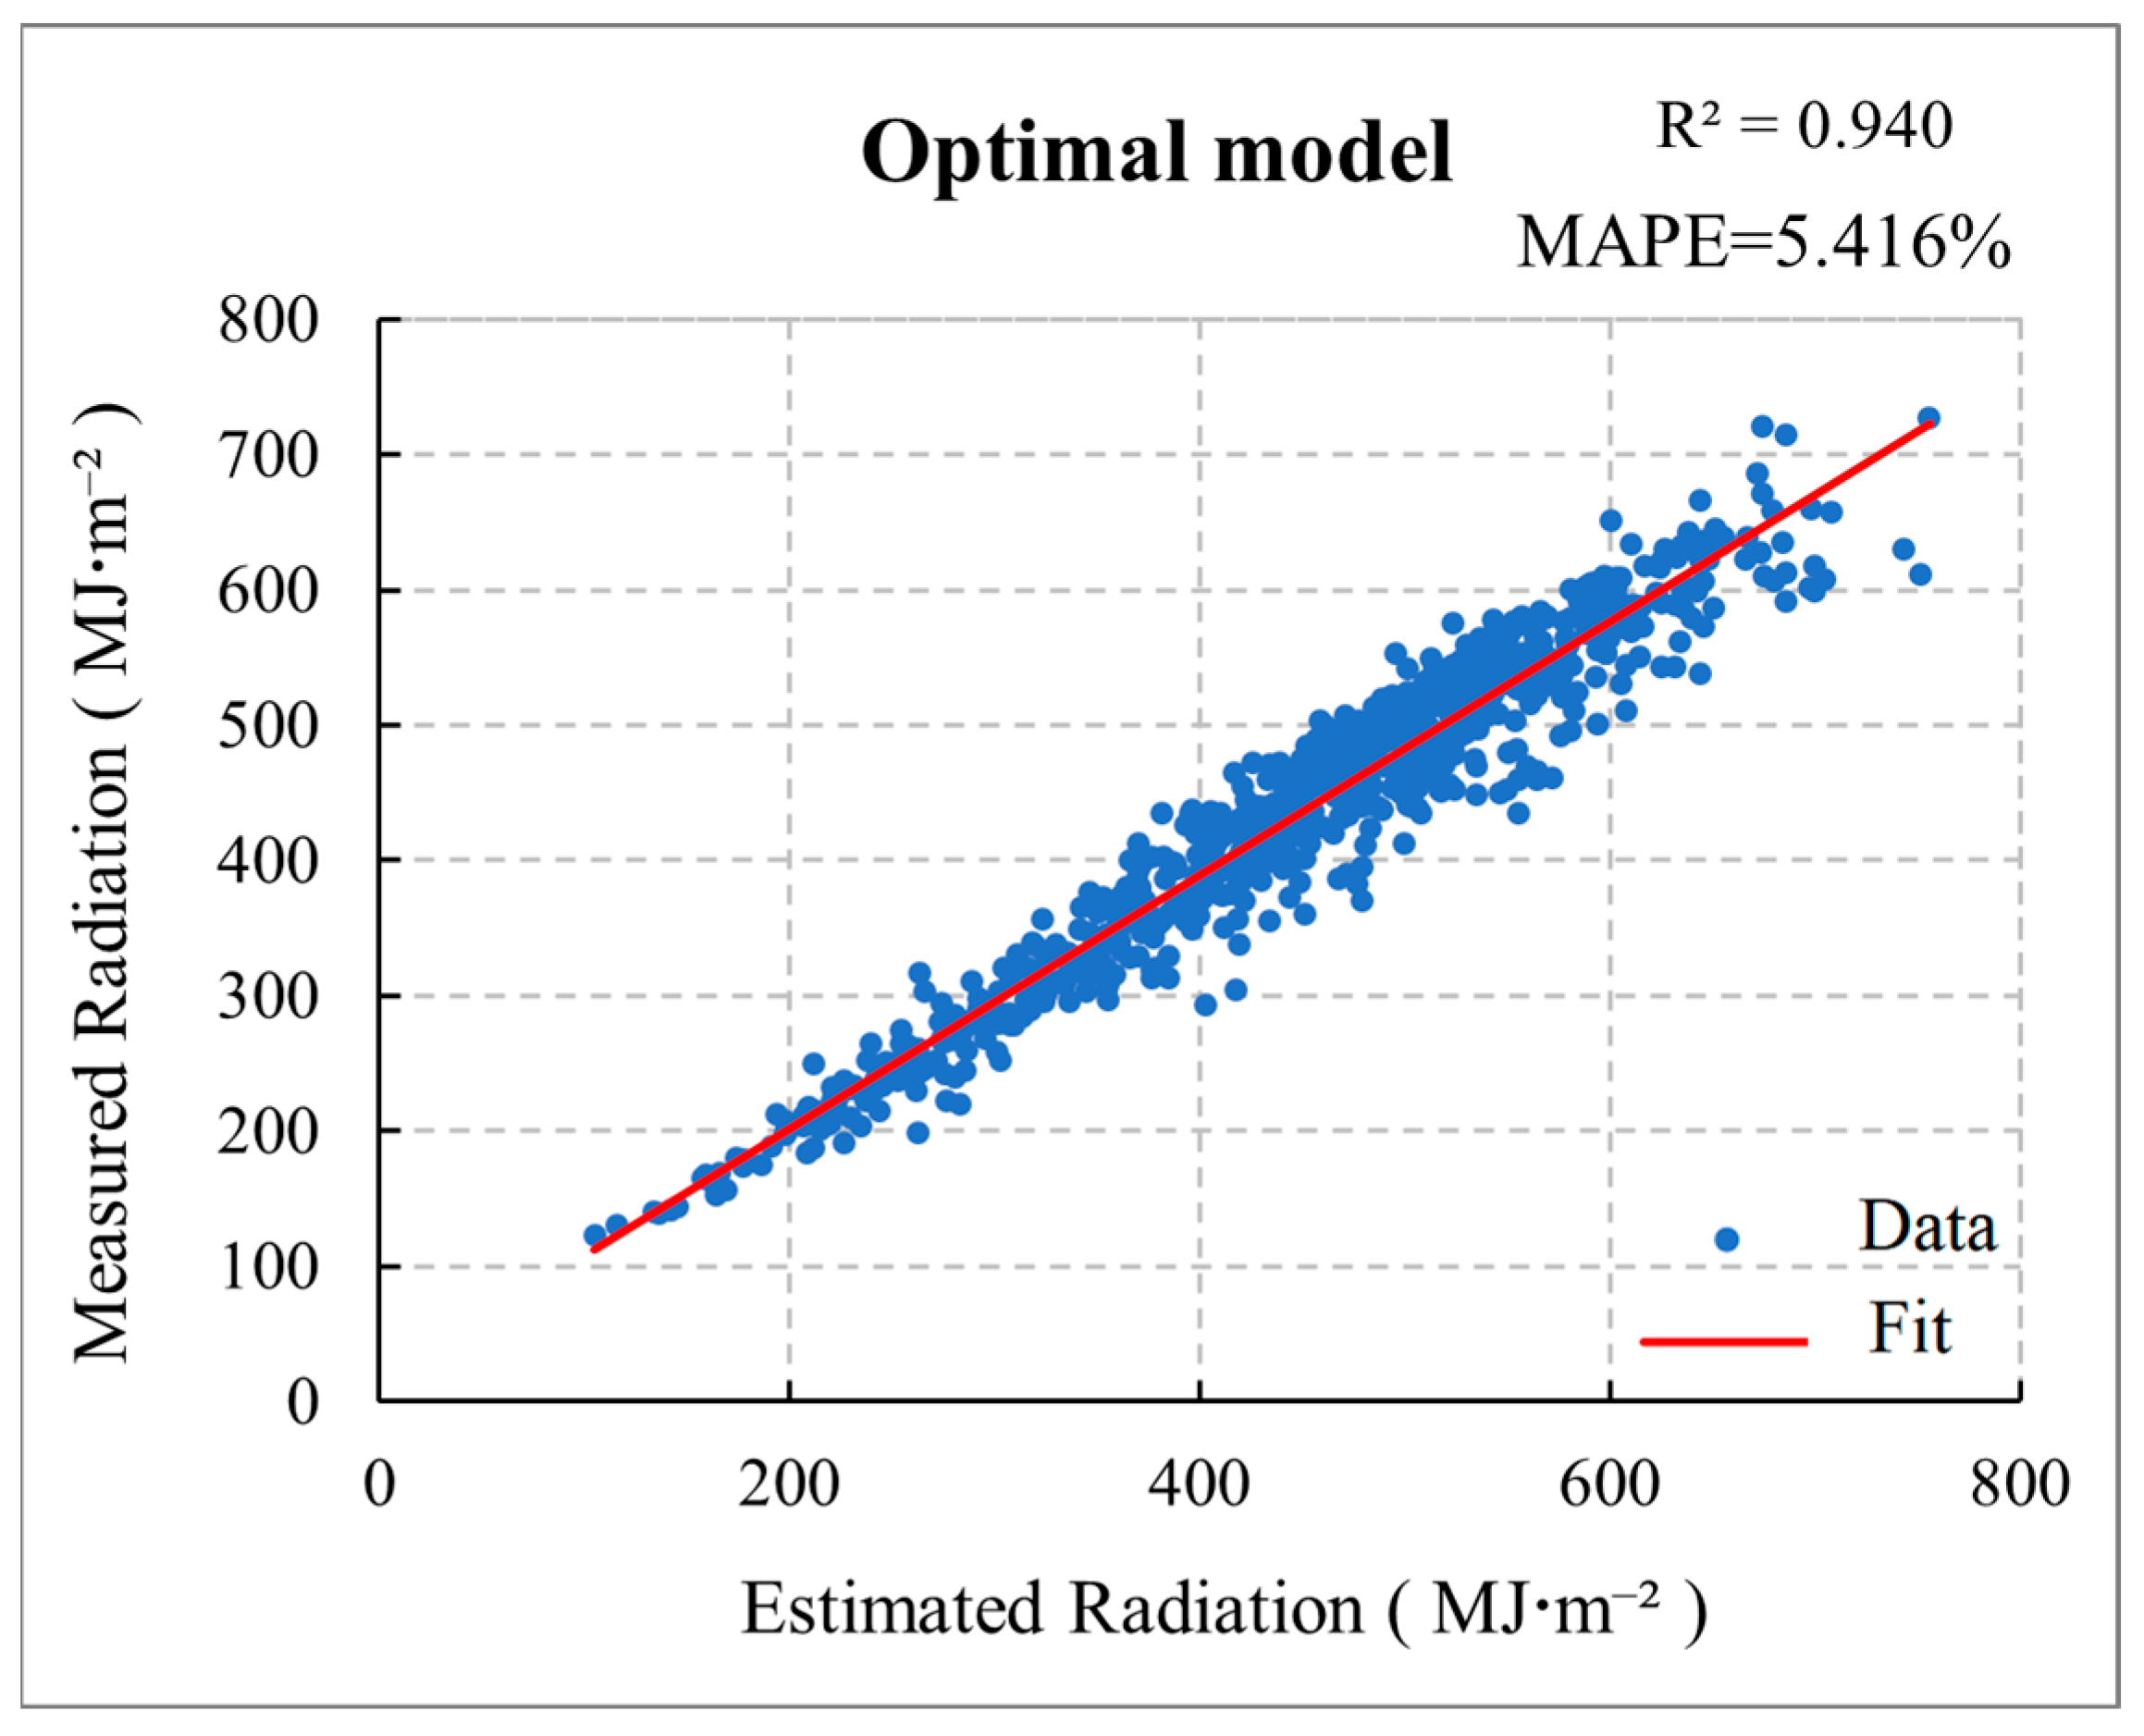
As can be seen from Figure 7, after MAPE optimization to determine the correction coefficients a and b, the optimal model obtained the highest estimation accuracy, with a MAPE value of 5.416% and R² value of 0.940.
To verify the reliability of a and b, comparisons were made with the research results of Xia et al. [32], who studied the A–P model under the agricultural comprehensive area of China. They obtained the a and b values for each station using the least squares method and extracted the average values of stations within each zone as the a and b values for that whole zone. And they compared the simulation errors of solar radiation using the fixed a and b values recommended by FAO, in order to combine and obtain the optimal coefficients. The errors between the simulation values calculated by Xia et al. [32] and the simulation values obtained in this study are compared in Table 3.
In the tropical region of China, R2 was 0.94, MAPE was 5.42%, RMSE was 33.20 MJ·m−2, MAE was 24.33 MJ·m−2, and MBE was 14.15 MJ·m−2. In the comprehensive agricultural area of China, R2 was 0.71, MAPE was 8.64%, RMSE was 79.99 MJ·m−2, MAE was 38.12 MJ·m−2, and MBE was −10.67 MJ·m−2. However, the absolute difference in MBE values between the two regions was small. Based on the single-station model, Xia et al. [32] calculated the average values, and the results met the regional consistency, at the expense of the accuracy of some stations (ignoring the differences within the zone). Therefore, considering the comprehensive metrics including MAE, MAPE, MBE, and R2, the values of “a” and “b” in this study were determined through multi-station regression within the region, increasing the sample size for regression and simultaneously optimizing the values for each station within the same region.

3.3. Result of Global Solar Radiation Zoning by the Thiessen Polygons

According to solar radiation and meteorological data, the Thiessen polygon was established for the stations, and a and b of the A–P model were applied to conventional meteorological stations within the same zone (Figure 8).

3.4. Verification of Spatial Interpolation Accuracy

Kriging, IDW, and Spline were used for spatial interpolation of the global solar radiation during the whole year and the dry–wet seasons in the tropical zone of China. Then the interpolation results were verified by cross-validation, that is, 11 solar radiation stations were removed, and the remaining 69 meteorological stations were used to simulate the results of the above three interpolation methods. The errors of the simulation results were analyzed.
The positive value of the mean bias error (MBE) indicated an overestimation of the global solar radiation by the model, while a negative value indicated underestimation, which was a reference indicator of the optimal spatial interpolation. It could be seen that three interpolation methods achieved excellent results during the dry season, with R² all above 0.85, and the highest interpolation accuracy of average annual global solar radiation was achieved by Kriging, with the lowest RMSE and MAE. In the spatial interpolation of the average annual global solar radiation during the whole year, the accuracy of IDW was the highest. During the wet season, the accuracy of Spline was the highest, but the interpolation results were inferior to those for the whole year and the dry season (Table 4).
Therefore, the error analysis results showed that IDW should be used during the whole year, Kriging should be used during the dry season, and Spline should be used during the wet season. The results are presented in Figure 9, Figure 10 and Figure 11 below.

3.4.1. The Average Annual Global Solar Radiation during the Whole Year (January–December)

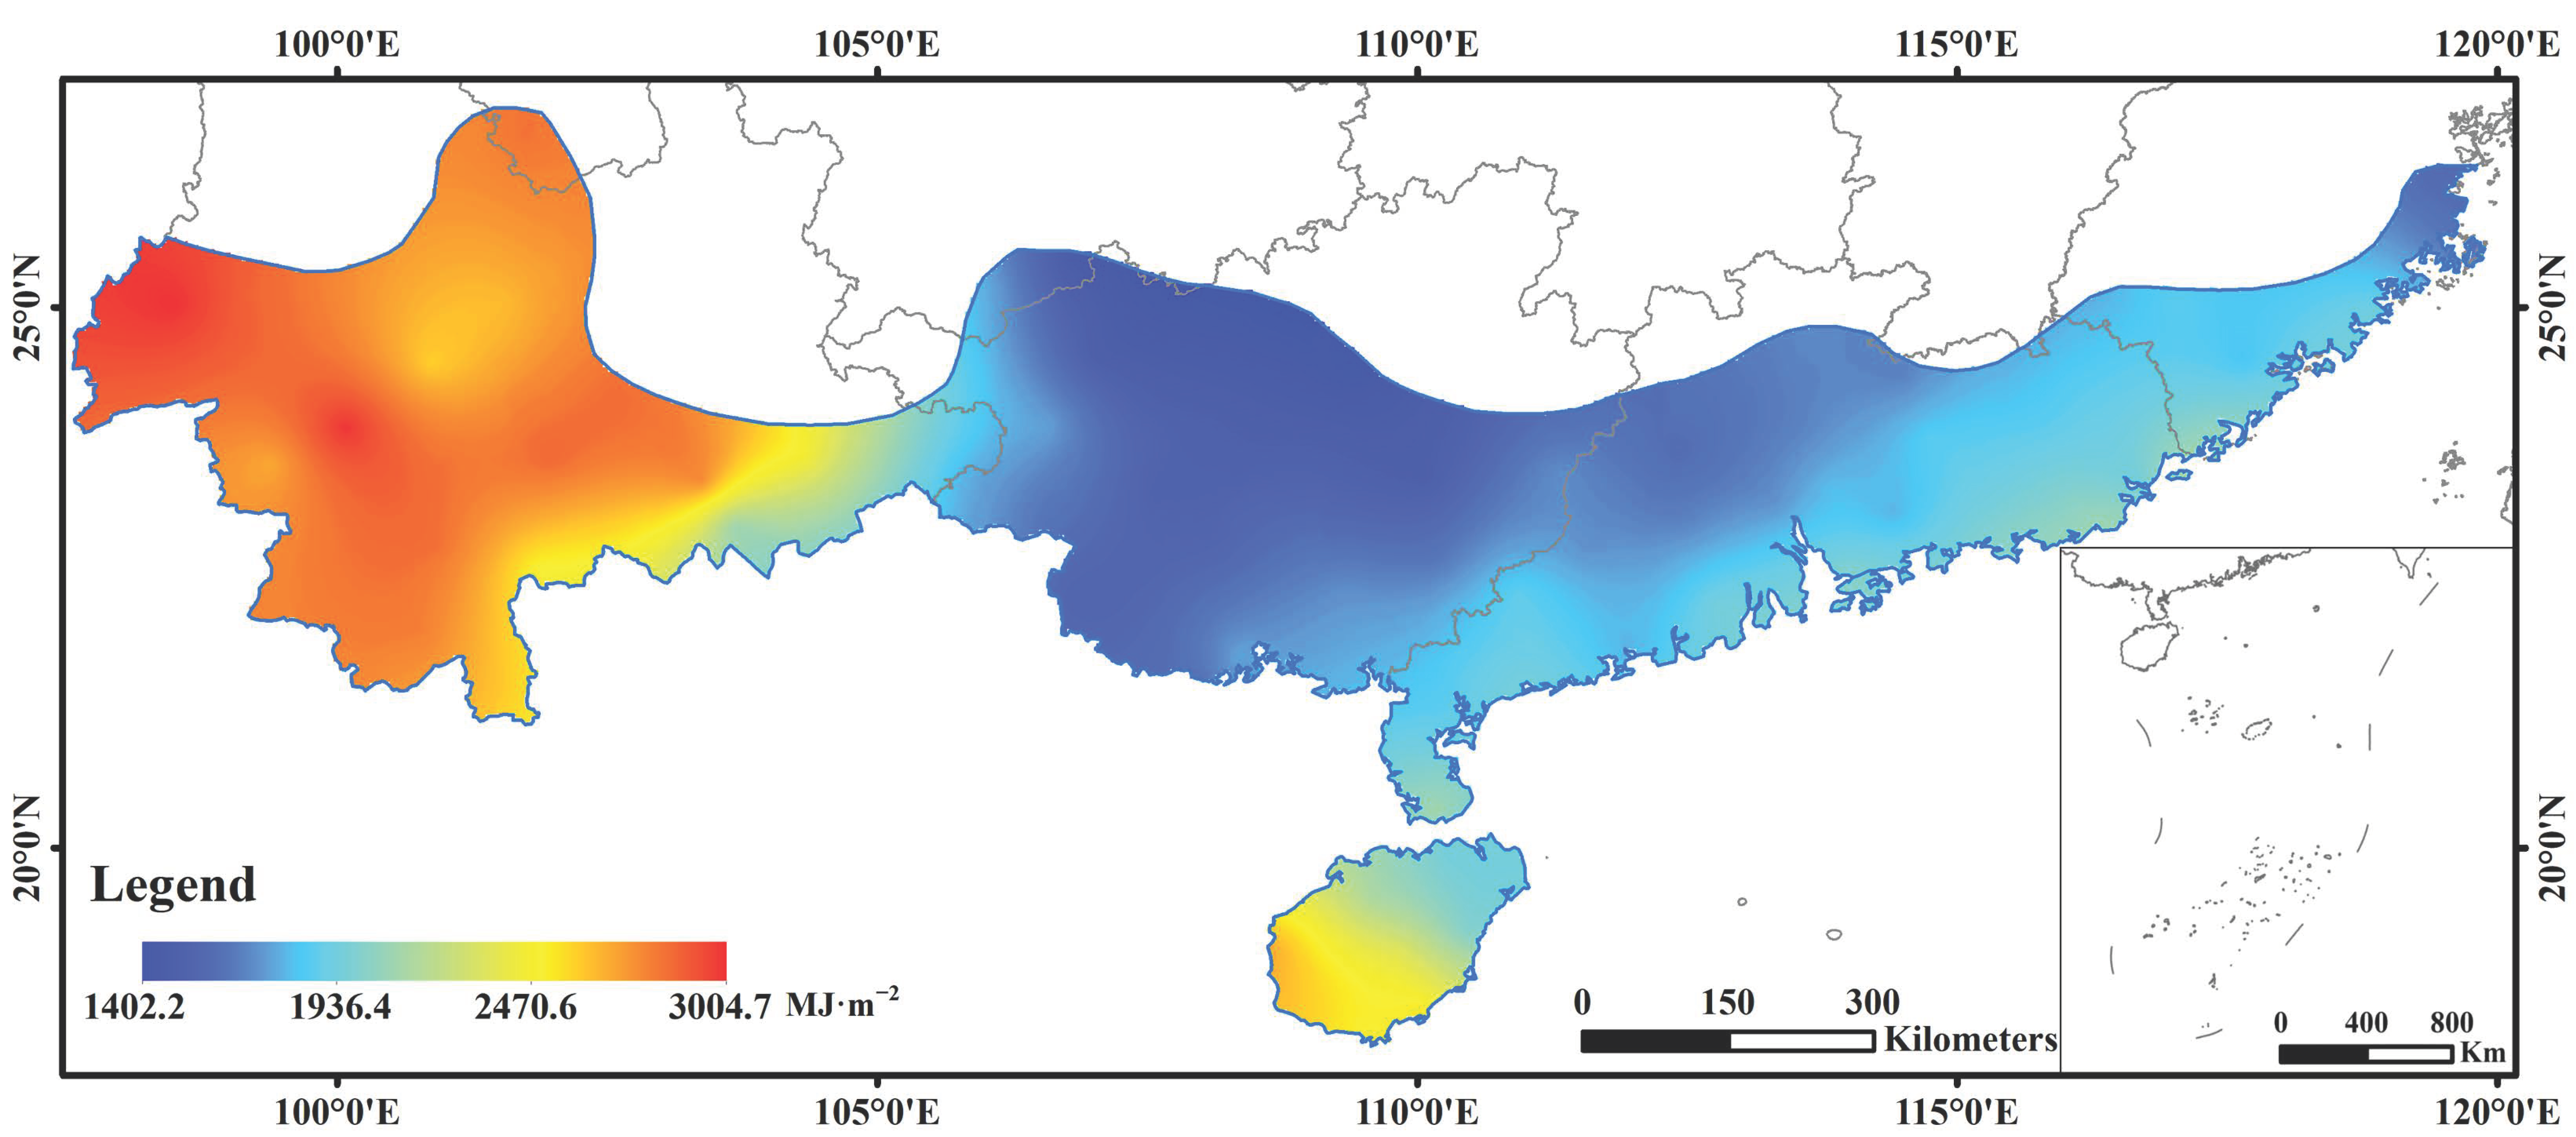
As Figure 9 shows, the average annual global solar radiation range from 2011 to 2016 was 4053.4–6148.2 MJ·m−2, and the mean value was 5045.3 MJ·m−2. The spatial distribution results showed that the average annual solar global radiation during in the whole year in the tropical zone of China decreased from west to east in Yunnan, from southwest to northeast in Hainan Island, from the coast to inland in Guangdong and Fujian. The maximum value was located in the western part of Hainan Island, and the minimum value was located in Guizhou. According to QX/T 89-2018 standard [34], the areas with highly abundant solar radiation were mainly distributed in most parts of Yunnan and Hainan Island, followed by some coastal areas of Guangdong and Fujian. The average annual global solar radiation in these areas were more than 5000 MJ·m−2, accounting for 45.2% of the total area of the tropical zone in China. The remaining areas were all classified as abundant areas, with the majority of Guangxi having relatively lower average annual global solar radiation. The range of the average annual global solar radiation in Guangdong and Fujian was mainly between 4500 and 5000 MJ·m−2.

3.4.2. The Average Annual Global Solar Radiation during the Dry Season (November–April)

The spatial distribution of the average annual global solar radiation during the dry season was similar to that of the whole year, with a range of 1402.2–3004.7 MJ·m−2 and an average value of 2093.9 MJ·m−2. The average annual global solar radiation in most parts of Yunnan and the southwest of Hainan Island was above 2300 MJ·m−2, with the highest value appearing in Yunnan. The average annual global solar radiation in the central and northern parts of Guangxi was relatively lower, with most values below 1600 MJ·m−2 (Figure 10).

3.4.3. The Average Annual Global Solar Radiation during the Wet Season (May–October)

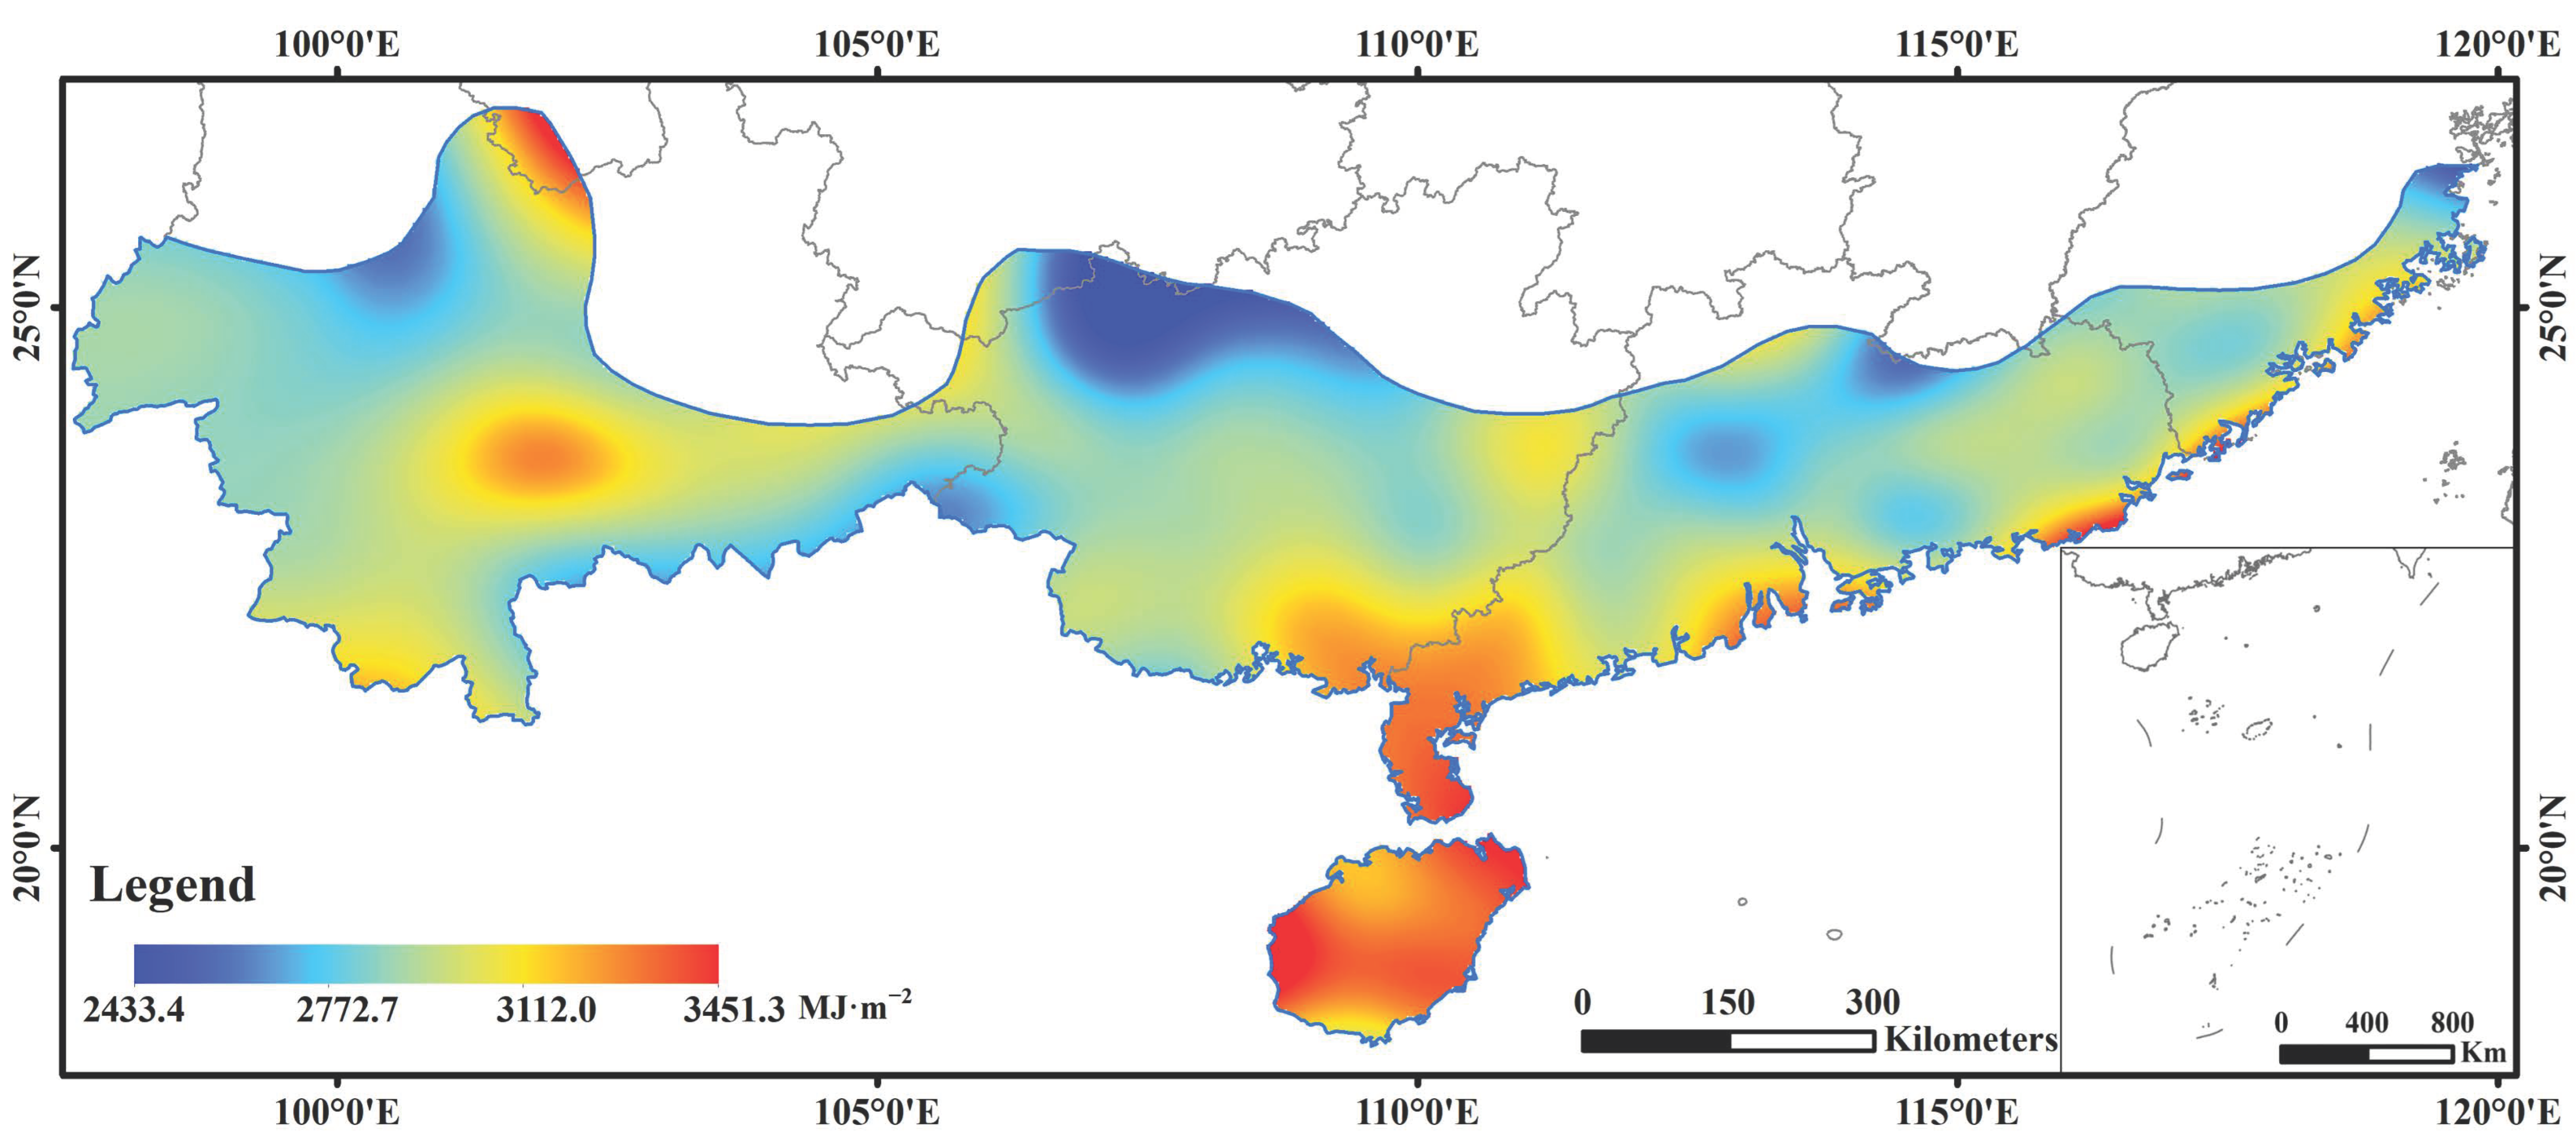
The value range of average annual global solar radiation in the wet season was generally higher than that in the dry season, with a range of 2433.4–3451.3 MJ·m−2 and an average value of 2941.5 MJ·m−2. The spatial distribution of the average annual solar radiation was different from the whole year and the dry season. The high-value areas of the average annual solar radiation in the wet season were mainly distributed on Hainan Island, the coastal areas of Guangxi, Guangdong, Fujian, and the border area of Yunnan and Sichuan, with an average annual solar radiation above 3000 MJ·m−2. The distribution pattern was gradually decreasing from coastal areas to inland areas. In addition, the average annual solar radiation in most areas was mainly distributed in the range of 2800–3000 MJ·m−2, accounting for 56.5% of the tropical zone (Figure 11).
In summary, there were certain differences in the spatial and temporal distributions of the average annual solar radiation in the tropical zone of China at different time scales. Overall, the average annual global solar radiation was relatively high in Yunnan, Hainan Island, and coastal areas during the same period, while the annual average solar radiation was relatively low in the central and northern parts of Guangxi and Guizhou.
From the perspective of latitude distribution, the annual average global solar radiation in Yunnan was higher than that in Guangdong and Fujian at the same latitude, while that in Guangxi was relatively low. Compared with other areas at the same latitude, Yunnan was at a higher elevation, resulting in a shorter transmission path for solar radiation and better atmospheric transparency, hence receiving stronger solar radiation.
Judging from the coastal distribution, the coastal areas of Guangdong, Guangxi, and Fujian had higher average annual global solar radiation than that in the inland areas.
As to the dry and wet season distribution, the average annual global solar radiation in the wet season was higher than that in the dry season, and the internal differences in solar radiation values were also more obvious.

4. Conclusions

This study used the between-groups linkage of sunshine percentage based on the A–P model to divide 11 solar radiation stations into zones and carried out monthly error analyses for each station in terms of T 1 ,   T 2 , and T 3 models. The regression coefficients with the smallest estimation error were preferably selected by comparing the errors of each model. Through analyzing the spatial interpolation error, the appropriate spatial interpolation method was determined. The main conclusions are as follows:
(1)
Based on the between-groups linkage of sunshine percentage, this study divided the meteorological stations into zones. Stations within the same zone were used for the regression coefficient calculation, which effectively increased the amount of regression sample data. This method could effectively compensate for the simulation accuracy of the regression coefficients in most months when the simulation accuracy of a single station was poor. After parameter optimization, the accuracy of the average annual global solar radiation simulation for each station during the dry and wet seasons and the whole year could be improved by 8.1%, 4.4%, and 5.3%, respectively. In addition, due to the increase in the sample number at specific stations, the multi-station simulation accuracy was lower than that of the single station.
(2)
To effectively apply the regression coefficients to non-solar radiation meteorological stations, this study used the property of the Thiessen polygons in which the distance between any point inside the polygon and the control point is the shortest. Based on this, the tropical zone of China was divided into 11 zones, and the stations in the same zone used the same a and b of the A–P model. Through validating the spatial interpolation results of solar radiation for the whole year, the dry season, and the wet season, the optimal methods for the spatial interpolation of solar radiation for the whole year were IDW, and those for the dry and wet seasons were Kriging and Spline, respectively.
Above all, this paper studied an improved A–P model based on the between-groups linkage and selected a suitable model of the average annual global solar radiation for each station at a monthly scale. The characteristics of the dry–wet seasons in the tropical zone of China were discussed in terms of the average annual global solar radiation simulation and spatial distribution. The conclusion showed the improved A–P model based on the between-groups linkage could effectively improve the accuracy of average annual global solar radiation simulation. This study not only enriched the correction cases of Ångström–Prescott formula coefficients but also improved the accuracy of solar radiation simulation, providing valuable references for exploring the spatial distribution characteristics during the entire year and dry–wet seasons in the tropical regions of China. However, the A–P model still had some limitations in calculating the empirical coefficients a and b, which warrant further exploration: (1) This study exclusively applied the least squares regression method, utilizing meteorological station data spanning from 1996 to 2016 at a monthly scale to discuss the localized determination of a and b coefficients. Future research should integrate time series prediction algorithms to enhance the predictive accuracy. (2) The study employed Thiessen polygons solely for zoning, without conducting a comprehensive comparison with alternative clustering methods. (3) The research exclusively undertook a comparison of traditional spatial interpolation techniques. Future endeavors will involve the implementation of advanced machine learning algorithms such as support vector machine (SVM), artificial neural network (ANN), or deep learning models to more precisely capture the intricate nonlinear relationships between solar radiation and meteorological parameters, thereby further elevating the predictive precision of solar radiation. Subsequent investigations can then be conducted based on this foundational work.

Author Contributions

Conceptualization, X.Y. (Xuan Yu) and M.-F.L.; methodology, X.Y. (Xuan Yu) and M.-F.L.; validation, X.Y. (Xia Yi) and M.-F.L.; formal analysis, X.Y. (Xuan Yu) and M.-F.L.; investigation, X.Y. (Xuan Yu), X.Y. (Xia Yi) and M.-F.L.; resources, X.Y. (Xuan Yu) and X.Y. (Xia Yi); data curation, S.D., H.L. (Hailiang Li) and H.L. (Hongxia Luo); writing—original draft preparation, X.Y. (Xuan Yu) and X.Y. (Xia Yi); writing—review and editing, M.-F.L.; visualization, Q.Z. and Y.H.; supervision, S.D.; funding acquisition, X.Y. (Xuan Yu), M.-F.L. and Y.H. All authors have read and agreed to the published version of the manuscript.

Funding

This research was funded by the Natural Science Foundation of Hainan, China, grant numbers 421QN0918, 421RC627, 622MS115.

Institutional Review Board Statement

Not applicable.

Informed Consent Statement

Not applicable.

Data Availability Statement

The data presented in this study are available on request from the corresponding author. The data are not publicly available due to laboratory policy and confidentiality agreement.

Conflicts of Interest

The authors declare no conflict of interest.

Appendix A

Table A1. Basic information of 80 meteorological stations.
ProvinceStationLatitude (°N) Longitude (°E) Altitude (m)
FujianShanghang25.05116.42198.00
FujianLongyan25.05117.02376.00
FujianPingtan25.52119.7832.40
FujianZhangzhou24.50117.6528.90
FujianDongshan23.78117.5053.30
FujianXiamen24.48118.07139.40
FujianChongwu24.90118.9221.80
FujianFuzhou26.08119.2884.00
GuangdongXuwen20.33110.1856.20
GuangdongShaoguan24.67113.60121.30
GuangdongFogang23.88113.5297.20
GuangdongLianping24.37114.48215.20
GuangdongMeixian24.28116.07116.00
GuangdongGuangning23.63112.4292.70
GuangdongGaoyao22.98112.4860.00
GuangdongHeyuan23.80114.7371.10
GuangdongZengcheng23.33113.8330.80
GuangdongHuiyang23.07114.37108.50
GuangdongWuhua23.92115.75135.90
GuangdongHuilai22.98116.3042.00
GuangdongNanao23.43117.038.00
GuangdongXinyi22.35110.93141.40
GuangdongLuoding22.72111.6060.00
GuangdongTaishan22.25112.7833.10
GuangdongShenzhen22.53114.0063.00
GuangdongShanwei22.80115.3717.30
GuangdongZhanjiang21.15110.3053.40
GuangdongYangjiang21.85111.9890.30
GuangdongDianbai21.55110.9831.80
GuangdongShangchuan Island21.73112.7721.90
GuangdongShantou23.38116.682.30
GuangdongGuangzhou23.22113.4870.70
GuangxiFengshan24.55107.03509.40
GuangxiHechi24.70108.03260.20
GuangxiDuan23.93108.10170.80
GuangxiLiuzhou24.35109.4096.80
GuangxiNapo23.42105.83794.10
GuangxiBaise23.90106.60174.70
GuangxiJingxi23.13106.42739.90
GuangxiPingguo23.32107.58108.80
GuangxiLaibin23.45109.0896.70
GuangxiGuiping23.40110.0842.50
GuangxiWuzhou23.48111.30114.80
GuangxiLongzhou22.33106.85128.80
GuangxiLingshan22.42109.3066.60
GuangxiYulin22.67110.12121.60
GuangxiFangcheng21.78108.3532.40
GuangxiQinzhou21.98108.6049.20
GuangxiDongxing21.57107.9556.80
GuangxiBeihai21.45109.1312.80
GuangxiNanning22.63108.22121.60
GuizhouWangmo25.18106.08566.80
GuizhouLuodian25.43106.77440.30
HainanDongfang19.10108.627.60
HainanDanzhou19.52109.58169.00
HainanQiongzhong19.03109.83250.90
HainanQionghai19.23110.4724.00
HainanLingshui18.55110.0335.20
HainanSanya18.22109.58419.40
HainanHaikou20.00110.2563.50
SichuanPanzhihua26.57101.721224.80
YunnanHuaping26.63101.271230.80
YunnanBaoshan25.1299.181652.20
YunnanYuanmou25.73101.871120.60
YunnanChuxiong25.03101.551824.10
YunnanRuili24.0097.85762.90
YunnanJingdong24.47100.871162.30
YunnanYuxi24.33102.551716.90
YunnanGengma23.5599.401104.90
YunnanLincang23.88100.081502.40
YunnanLancang22.5799.931054.80
YunnanSimao22.78100.971302.10
YunnanYuanjiang23.60101.98400.90
YunnanMengla21.47101.57633.40
YunnanJiangcheng22.58101.851120.50
YunnanYanshan23.62104.331561.10
YunnanPingbian22.98103.681414.10
YunnanMengzi23.45103.331313.60
YunnanJinghong22.00100.78582.00
YunnanTengchong24.9898.501695.90

References

  1. Zhou, Y.; Liu, Y.; Wang, D.; Liu, X.; Wang, Y. A review on global solar radiation prediction with machine learning models in a comprehensive perspective. Energy Convers. Manag. 2021, 235, 113960. [Google Scholar] [CrossRef]
  2. Fan, J.; Wu, L.; Zhang, F.; Cai, H.; Wang, X.; Lu, X.; Xiang, Y. Evaluating the effect of air pollution on global and diffuse solar radiation prediction using support vector machine modeling based on sunshine duration and air temperature. Renew. Sustain. Energy Rev. 2018, 94, 732–747. [Google Scholar] [CrossRef]
  3. Lan, K.; Wang, L.; Zhou, Y.; Zhang, Z.; Fang, S.; Cao, P. The applicability of sunshine-based global solar radiation models modified with meteorological factors for different climate zones of China. Front. Energy Res. 2023, 10, 2296-598X. [Google Scholar] [CrossRef]
  4. Ramesh, D.; Chandrasekaran, M.; Soundararajan, R.P.; Subramanian, P.P.; Palled, V.; Kumar, D.P. Solar-Powered Plant Protection Equipment: Perspective and Prospects. Energies 2022, 15, 7379. [Google Scholar] [CrossRef]
  5. Gångström, A. Solar and terrestrial radiation. Report to the international commission for solar research on actinometric investigations of sola and atmospheric radiation. Q. J. R. Meteorol. Soc. 1924, 50, 121–126. [Google Scholar] [CrossRef]
  6. Besharat, F.; Dehghan, A.A.; Faghih, A.R. Empirical models for estimating global solar radiation: A review and case study. Renew. Sustain. Energy Rev. 2013, 21, 798–821. [Google Scholar] [CrossRef]
  7. Bawonda, F.I.; Adefarati, T. Evaluation of solar energy potential in six geopolitical regions of Nigeria using analytical and sim-ulation techniques. Energy Convers. Manag. 2023, 290, 117193. [Google Scholar] [CrossRef]
  8. Bird, R.E.; Hulstrom, R.L. Simplified Clear Sky Model for Direct and Diffuse Insolation on Horizontal Surfaces; Technical Report Solar Energy Research Institute; Solar Energy Research Institute: Golden, CO, USA, 1981. [Google Scholar] [CrossRef]
  9. Maxwell, E. METSTAT—The solar radiation model used in the production of the National Solar Radiation Data Base (NSRDB). Sol. Energy 1998, 62, 263–279. [Google Scholar] [CrossRef]
  10. Aradpour, S.; Deng, Z. Remote sensing algorithm for retrieving global-scale sea surface solar irradiance. Environ. Monit. Assess. 2023, 195, 1–19. [Google Scholar] [CrossRef]
  11. Nematchoua, M.K.; Orosa, J.A.; Afaifia, M. Prediction of daily global solar radiation and air temperature using six machine learning algorithms; a case of 27 European countries. Ecol. Inform. 2022, 69, 101643. [Google Scholar] [CrossRef]
  12. Zhao, S.; Wu, L.; Xiang, Y.; Dong, J.; Li, Z.; Liu, X.; Tang, Z.; Wang, H.; Wang, X.; An, J.; et al. Coupling meteorological stations data and satellite data for prediction of global solar radiation with machine learning models. Renew. Energy 2022, 198, 1049–1064. [Google Scholar] [CrossRef]
  13. Allen, R.; Pereira, L.; Raes, D.; Smith, M.; Allen, R.G.; Pereira, L.S.; Martin, S. Crop Evapotranspiration: Guidelines for Com-puting Crop Water Requirements; FAO Irrigation and Drainage Paper 56; FAO: Rome, Italy, 1998; Volume 56, p. D05109. [Google Scholar]
  14. Paulescu, M.; Stefu, N.; Calinoiu, D.; Paulescu, E.; Pop, N.; Boata, R.; Mares, O. Ångström–Prescott equation: Physical basis, empirical models and sensitivity analysis. Renew. Sustain. Energy Rev. 2016, 62, 495–506. [Google Scholar] [CrossRef]
  15. Li, M.-F.; Guo, P.-T.; Dai, S.; Luo, H.; Liu, E.; Li, Y. Empirical estimation of daily global solar radiation with contrasting seasons of rain and drought characterize over tropical China. J. Clean. Prod. 2020, 266, 121915. [Google Scholar] [CrossRef]
  16. Mohammadi, B.; Moazenzadeh, R. Performance Analysis of Daily Global Solar Radiation Models in Peru by Regression Analysis. Atmosphere 2021, 12, 389. [Google Scholar] [CrossRef]
  17. Manzano, A.; Martín, M.; Valero, F.; Armenta, C. A single method to estimate the daily global solar radiation from monthly data. Atmos. Res. 2015, 166, 70–82. [Google Scholar] [CrossRef]
  18. Zhao, N.; Zeng, X.; Han, S. Solar radiation estimation using sunshine hour and air pollution index in China. Energy Convers. Manag. 2013, 76, 846–851. [Google Scholar] [CrossRef]
  19. Chen, J.L.; Wen, Z.; Lv, M.; Yi, X.; Wu, S.; He, L. A General Empirical Model for Estimation of Solar Radiation in Yangtze River Basin. Appl. Ecol. Environ. Res. 2018, 16, 1471–1482. [Google Scholar] [CrossRef]
  20. Jia, D.; Yang, L.; Lv, T.; Liu, W.; Gao, X.; Zhou, J. Evaluation of machine learning models for predicting daily global and diffuse solar radiation under different weather/pollution conditions. Renew. Energy 2022, 187, 896–906. [Google Scholar] [CrossRef]
  21. Ali, M.A.; Elsayed, A.; Elkabani, I.; Akrami, M.; Youssef, M.E.; Hassan, G.E. Optimizing Artificial Neural Networks for the Accurate Prediction of Global Solar Radiation: A Performance Comparison with Conventional Methods. Energies 2023, 16, 6165. [Google Scholar] [CrossRef]
  22. Guermoui, M.; Benkaciali, S.; Gairaa, K.; Bouchouicha, K.; Boulmaiz, T.; Boland, J.W. A novel ensemble learning approach for hourly global solar radiation forecasting. Neural Comput. Appl. 2021, 34, 2983–3005. [Google Scholar] [CrossRef]
  23. Narvaez, G.; Giraldo, L.F.; Bressan, M.; Pantoja, A. Machine learning for site-adaptation and solar radiation forecasting. Renew. Energy 2021, 167, 333–342. [Google Scholar] [CrossRef]
  24. Stefu, N.; Paulescu, M.; Blaga, R.; Calinoiu, D.; Pop, N.; Boata, R.; Paulescu, E. A theoretical framework for Ångström equation. Its virtues and liabilities in solar energy estimation. Energy Convers. Manag. 2016, 112, 236–245. [Google Scholar] [CrossRef]
  25. Morf, H. Regression by Integration Demonstr. on Ångström-Prescott-type relations. Renew. Energy 2018, 127, 713–723. [Google Scholar] [CrossRef]
  26. Prieto, J.-I.; García, D. Modified temperature-based global solar radiation models for estimation in regions with scarce experimental data. Energy Convers. Manag. 2022, 268, 115950. [Google Scholar] [CrossRef]
  27. Liu, X.; Xu, Y.; Zhong, X.; Zhang, W.; Porter, J.R.; Liu, W. Assessing models for parameters of the Ångström–Prescott formula in China. Appl. Energy 2012, 96, 327–338. [Google Scholar] [CrossRef]
  28. He, Q.H.; Xie, Y. Research on the Climatological Calculation Method of Solar Radiation in China. J. Nat. Resour. 2010, 9, 411–420. [Google Scholar] [CrossRef]
  29. Liu, J.; Pan, T.; Chen, D.; Zhou, X.; Yu, Q.; Flerchinger, G.N.; Liu, D.L.; Zou, X.; Linderholm, H.W.; Du, J.; et al. An Improved Ångström-Type Model for Estimating Solar Radiation over the Tibetan Plateau. Energies 2017, 10, 892. [Google Scholar] [CrossRef]
  30. Liu, X.; Mei, X.; Li, Y.; Zhang, Y.; Wang, Q.; Jensen, J.R.; Porter, J.R. Calibration of the Ångström–Prescott coefficients (a, b) under different time scales and their impacts in estimating global solar radiation in the Yellow River basin. Agric. For. Meteorol. 2009, 149, 697–710. [Google Scholar] [CrossRef]
  31. Xiong, Y.L.; Zhou, Y.J. Temporal-spatial distribution of surface total solar radiation and meteorological influencing factors over Sichuan area. Acta Energiae Solaris Sin. 2020, 41, 162–171. [Google Scholar]
  32. Xia, X.; Pan, Y.; Zhu, X.; Zhang, J. Monthly calibration and optimization of Ångström-Prescott equation coefficients for comprehensive agricultural divisions in China. J. Geogr. Sci. 2021, 31, 997–1014. [Google Scholar] [CrossRef]
  33. Dai, S.P.; Li, H.L.; Liu, H.Q.; Liu, E.P. Review on the regionalization of tropical zone in China. Guangdong Agric. Sci. 2012, 23, 205–208. [Google Scholar] [CrossRef]
  34. China Meteorological Administration. Assessment Method for Solar Energy Resource: QX/T 89—2018; The Standard Press of China: Beijing, China, 2018. [Google Scholar]
  35. Park, J.-K.; Das, A.; Park, J.-H. A new approach to estimate the spatial distribution of solar radiation using topographic factor and sunshine duration in South Korea. Energy Convers. Manag. 2015, 101, 30–39. [Google Scholar] [CrossRef]
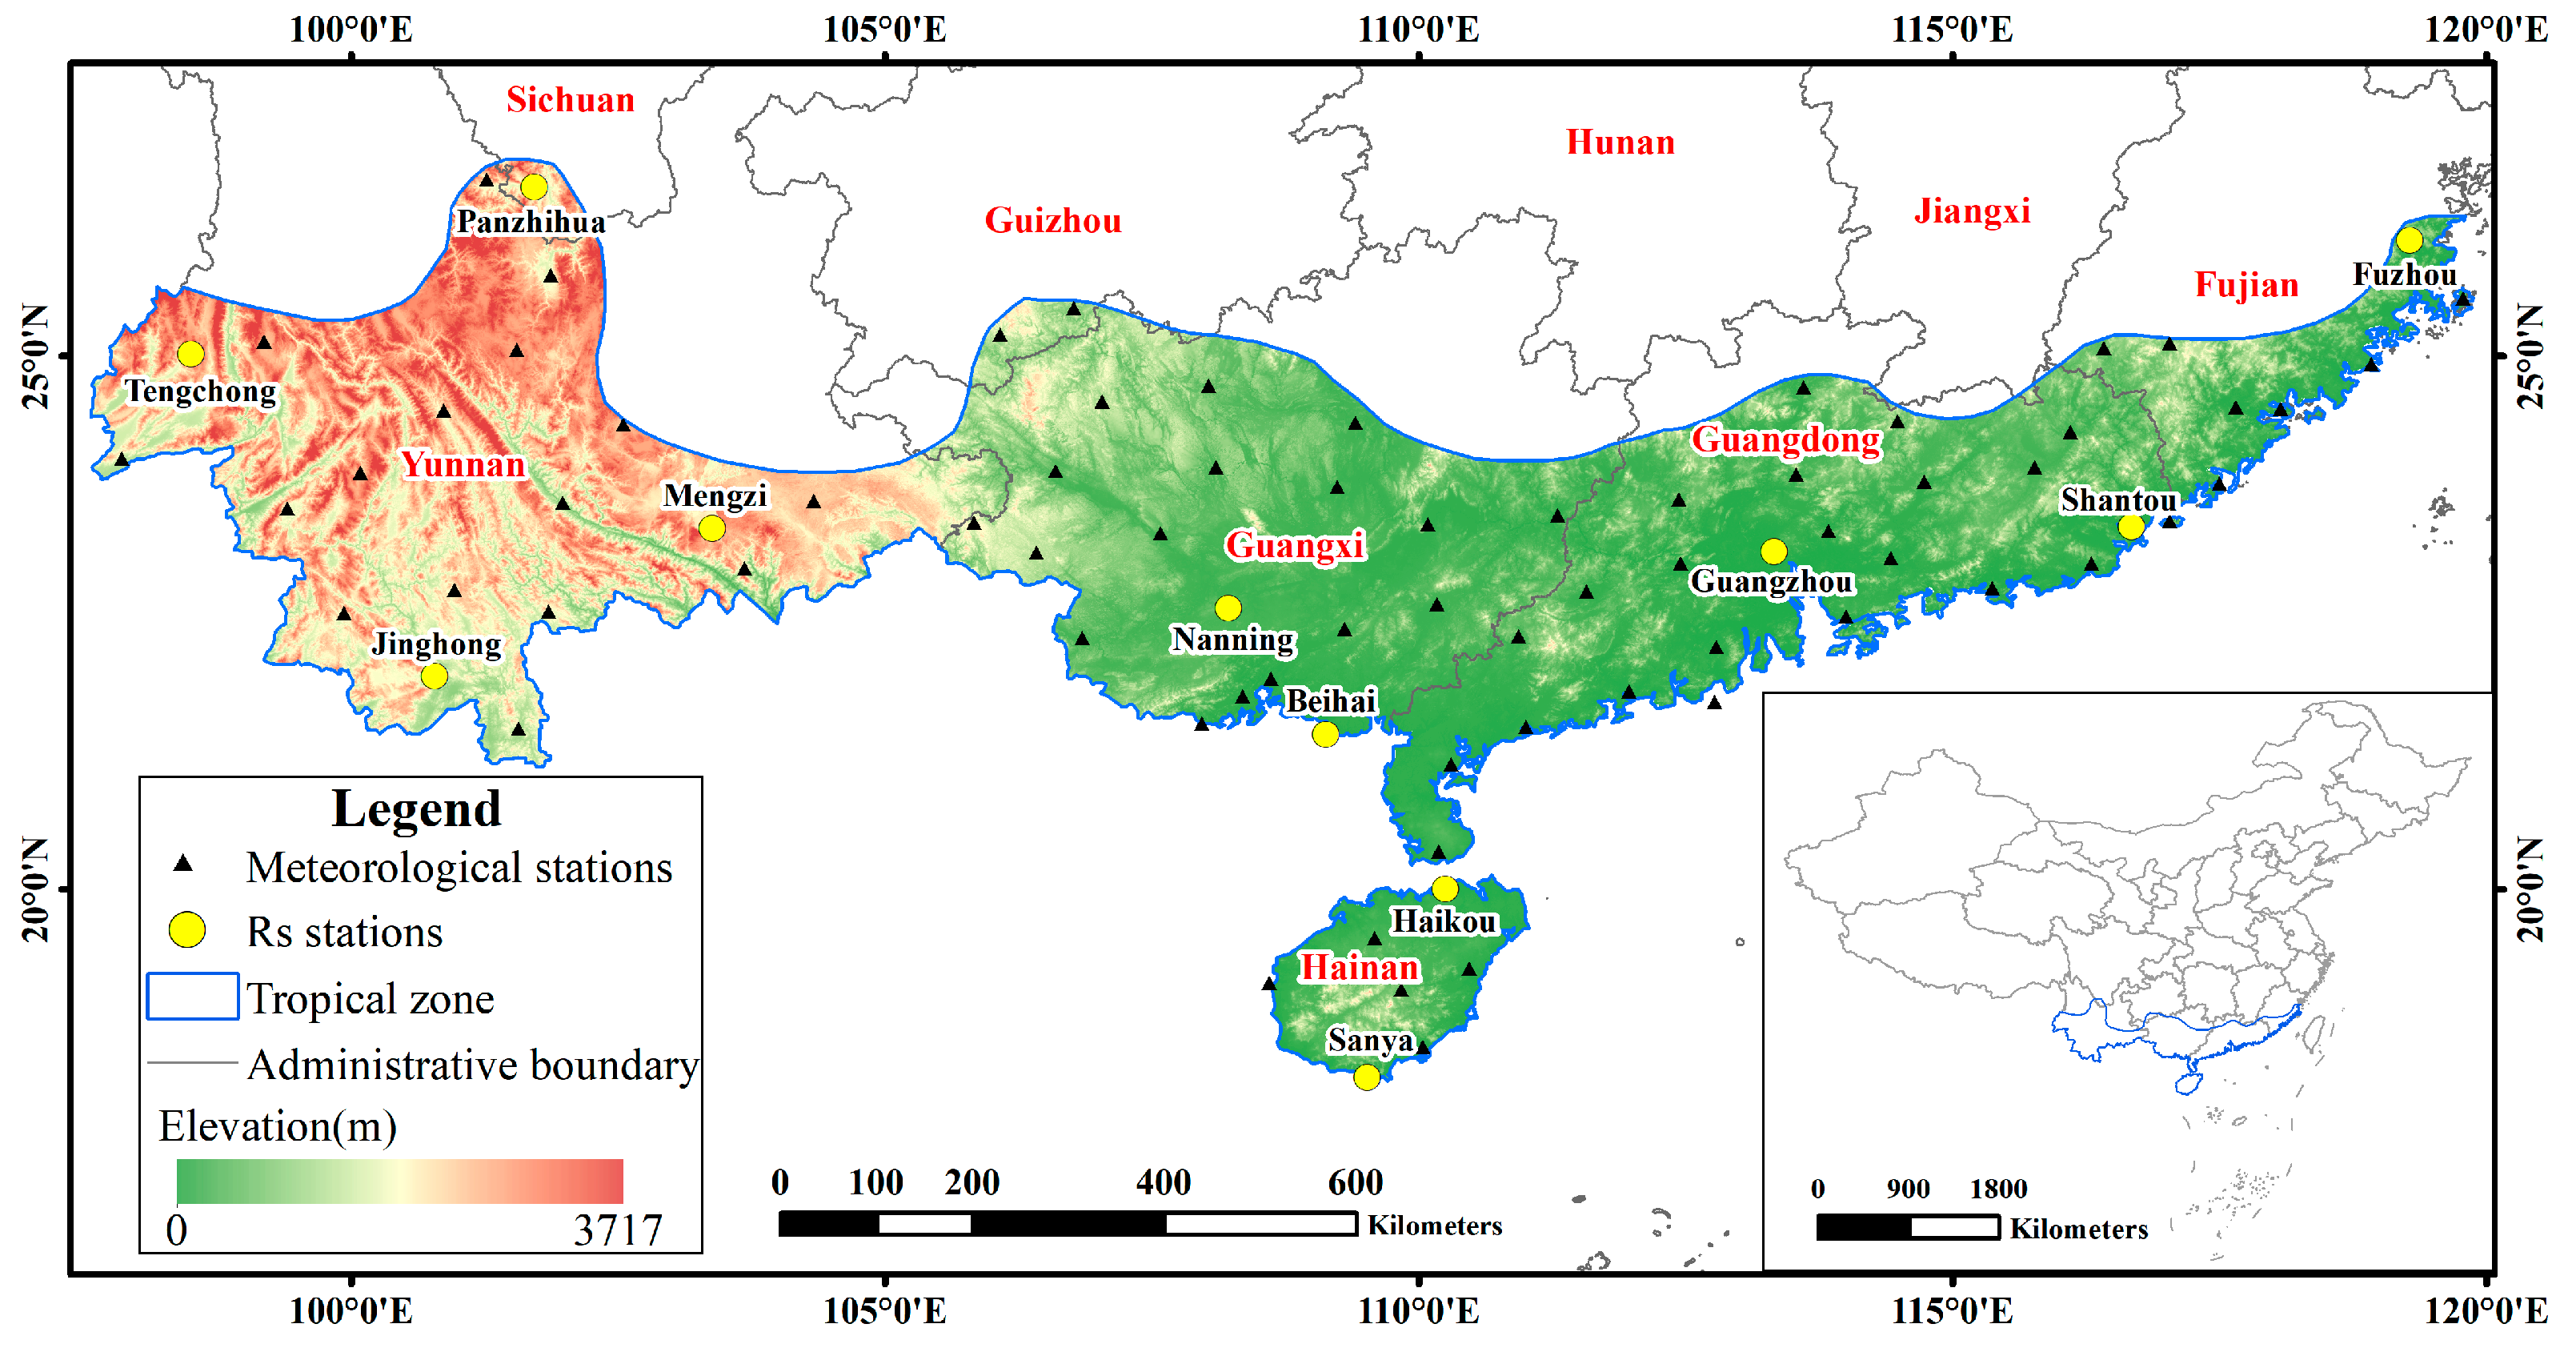
Figure 1. Map of station distribution in the study area.
Atmosphere 14 01825 g001
Figure 2. Flowchart representing the steps taken for modeling the global solar irradiation of the tropical zone of China.
Atmosphere 14 01825 g002
Figure 3. Station zoning map of model T 2 based on the between-groups linkage.
Atmosphere 14 01825 g003
Figure 4. Station zoning map of model T 3 based on the between-groups linkage.
Atmosphere 14 01825 g004
Figure 5. Comparison with the estimated values based on the T 1 , T 2 , and T 3 models’ measured values.
Atmosphere 14 01825 g005
Figure 6. Errors in simulation of solar radiation stations.
Atmosphere 14 01825 g006
Figure 7. Comparison with the estimated values based on the optimal model’s measured value.
Atmosphere 14 01825 g007
Figure 8. Distribution of the Thiessen polygons. Note: Polygons of the same color represent the same zone.
Atmosphere 14 01825 g008
Figure 9. The average annual global solar radiation during the whole year.
Atmosphere 14 01825 g009
Figure 10. The average annual solar radiation during the dry season.
Atmosphere 14 01825 g010
Figure 11. The average annual global solar radiation during the wet season.
Atmosphere 14 01825 g011
Table 1. Basic information of solar radiation meteorological stations.
ProvinceStationAbbrevLatitude (°N) Longitude (°E) Altitude (m)
YunnanTengchongTch24.9898.501695.90
JinghongJh22.00100.78582.00
MengziMz23.45103.331313.60
SichuanPanzhihuaPzh26.57101.721224.80
GuangxiNanningNn22.63108.22121.60
BeihaiBh21.45109.1312.80
GuangdongGuangzhouGzh23.22113.4870.70
ShantouSht23.38116.682.30
FujianFuzhouFzh26.08119.2884.00
HainanHaikouHk20.00110.2563.50
SanyaSy18.22109.58419.40
Table 2. Optimal a and b for A–P model of solar radiation stations in tropical zone of China.
Station
Abbrev
PzhTchJhMzFzhGzhShtNnBhHkSy
ababababababababababab
Jan0.2820.363−0.0330.8410.2140.4950.1640.6180.150.6280.150.6280.150.6280.150.6280.150.6280.150.6280.2240.52
Feb0.1950.5060.2060.5130.1950.5060.0740.7360.150.6130.150.6130.1620.5670.1450.630.1750.5630.150.6130.240.467
Mar−0.0080.7380.2270.430.250.390.3060.3320.1430.6260.1430.6260.1630.5620.1430.6260.1880.4760.190.5120.3720.156
Apr0.1880.4820.2820.320.2760.3520.2870.370.2120.4230.1560.6120.1710.5620.1710.5620.1860.540.2250.4560.3160.304
May0.2310.4510.2310.4510.2480.4240.2250.5130.1940.5290.180.5640.210.4790.1940.5290.1310.6710.3170.3030.4240.136
Jun0.2850.3270.30.190.3240.2570.2850.3270.2260.4570.1970.5050.2040.4960.2040.4960.2130.4930.2040.4960.3190.293
Jul0.2610.3890.2610.3890.2610.3890.2520.50.2630.4080.1940.5070.1950.5090.2340.4420.1810.5530.1950.5090.2710.373
Aug0.20.50.3090.2530.2840.3570.310.3020.2610.4120.2010.4990.1990.5050.2420.4480.1460.6240.1990.5050.1990.505
Sep0.1870.5320.2780.3760.3260.2830.2760.4160.2360.430.210.4860.210.4860.210.5170.1720.5790.2430.4010.2630.356
Oct0.2530.4320.2610.4350.2590.4320.2740.4190.2130.490.2130.490.2130.490.2290.4870.2130.490.2140.4740.2130.487
Nov0.1540.5440.2390.480.2130.5050.080.7930.2020.5110.2020.5110.2020.5110.2020.5110.2140.5080.2020.5110.2870.389
Dec0.0004410.7590.1290.6420.2240.4880.2240.4880.1910.5260.1910.5260.1910.5260.1910.5260.1910.5260.1910.5260.2090.538
0.9530.8640.8970.8570.9510.9710.980.9810.9380.9340.839
Notes: All coefficients a and b have been tested at a significance level of 0.05; R² represents the coefficients of determination for the calibrated equations at each station.
Table 3. Simulation accuracy comparison and verification.
Error AnalysisAgricultural Comprehensive Area of China [32]The Tropical Zone of China
0.710.94
MAPE (%) 8.645.42
RMSE (MJ·m−2) 79.9933.20
MAE (MJ·m−2) 38.1224.33
MBE (MJ·m−2) −10.6714.15
Table 4. Error analysis of spatial interpolation method.
Interpolation MethodError AnalysisThe Whole YearThe Dry SeasonThe Wet Season
KrigingRMSE (MJ·m−2) 407.90187.11202.94
MAE (MJ·m−2) 309.61132.61150.97
MBE (MJ·m−2) 203.5287.8993.45
0.720.920.44
IDWRMSE (MJ·m−2) 377.71234.62196.29
MAE (MJ·m−2) 293.42169.51143.98
MBE (MJ·m−2) 189.13111.7777.36
0.770.870.43
SplineRMSE (MJ·m−2) 413.57189.50173.09
MAE (MJ·m−2) 334.77142.17133.80
MBE (MJ·m−2) 61.6019.2742.35
0.630.890.53
Disclaimer/Publisher’s Note: The statements, opinions and data contained in all publications are solely those of the individual author(s) and contributor(s) and not of MDPI and/or the editor(s). MDPI and/or the editor(s) disclaim responsibility for any injury to people or property resulting from any ideas, methods, instructions or products referred to in the content.