
The Effect of Greening Layout on Microclimate in Urban Residential Areas in Hot Summer–Cold Winter Zones

Abstract
:1. Introduction
2. Methodology
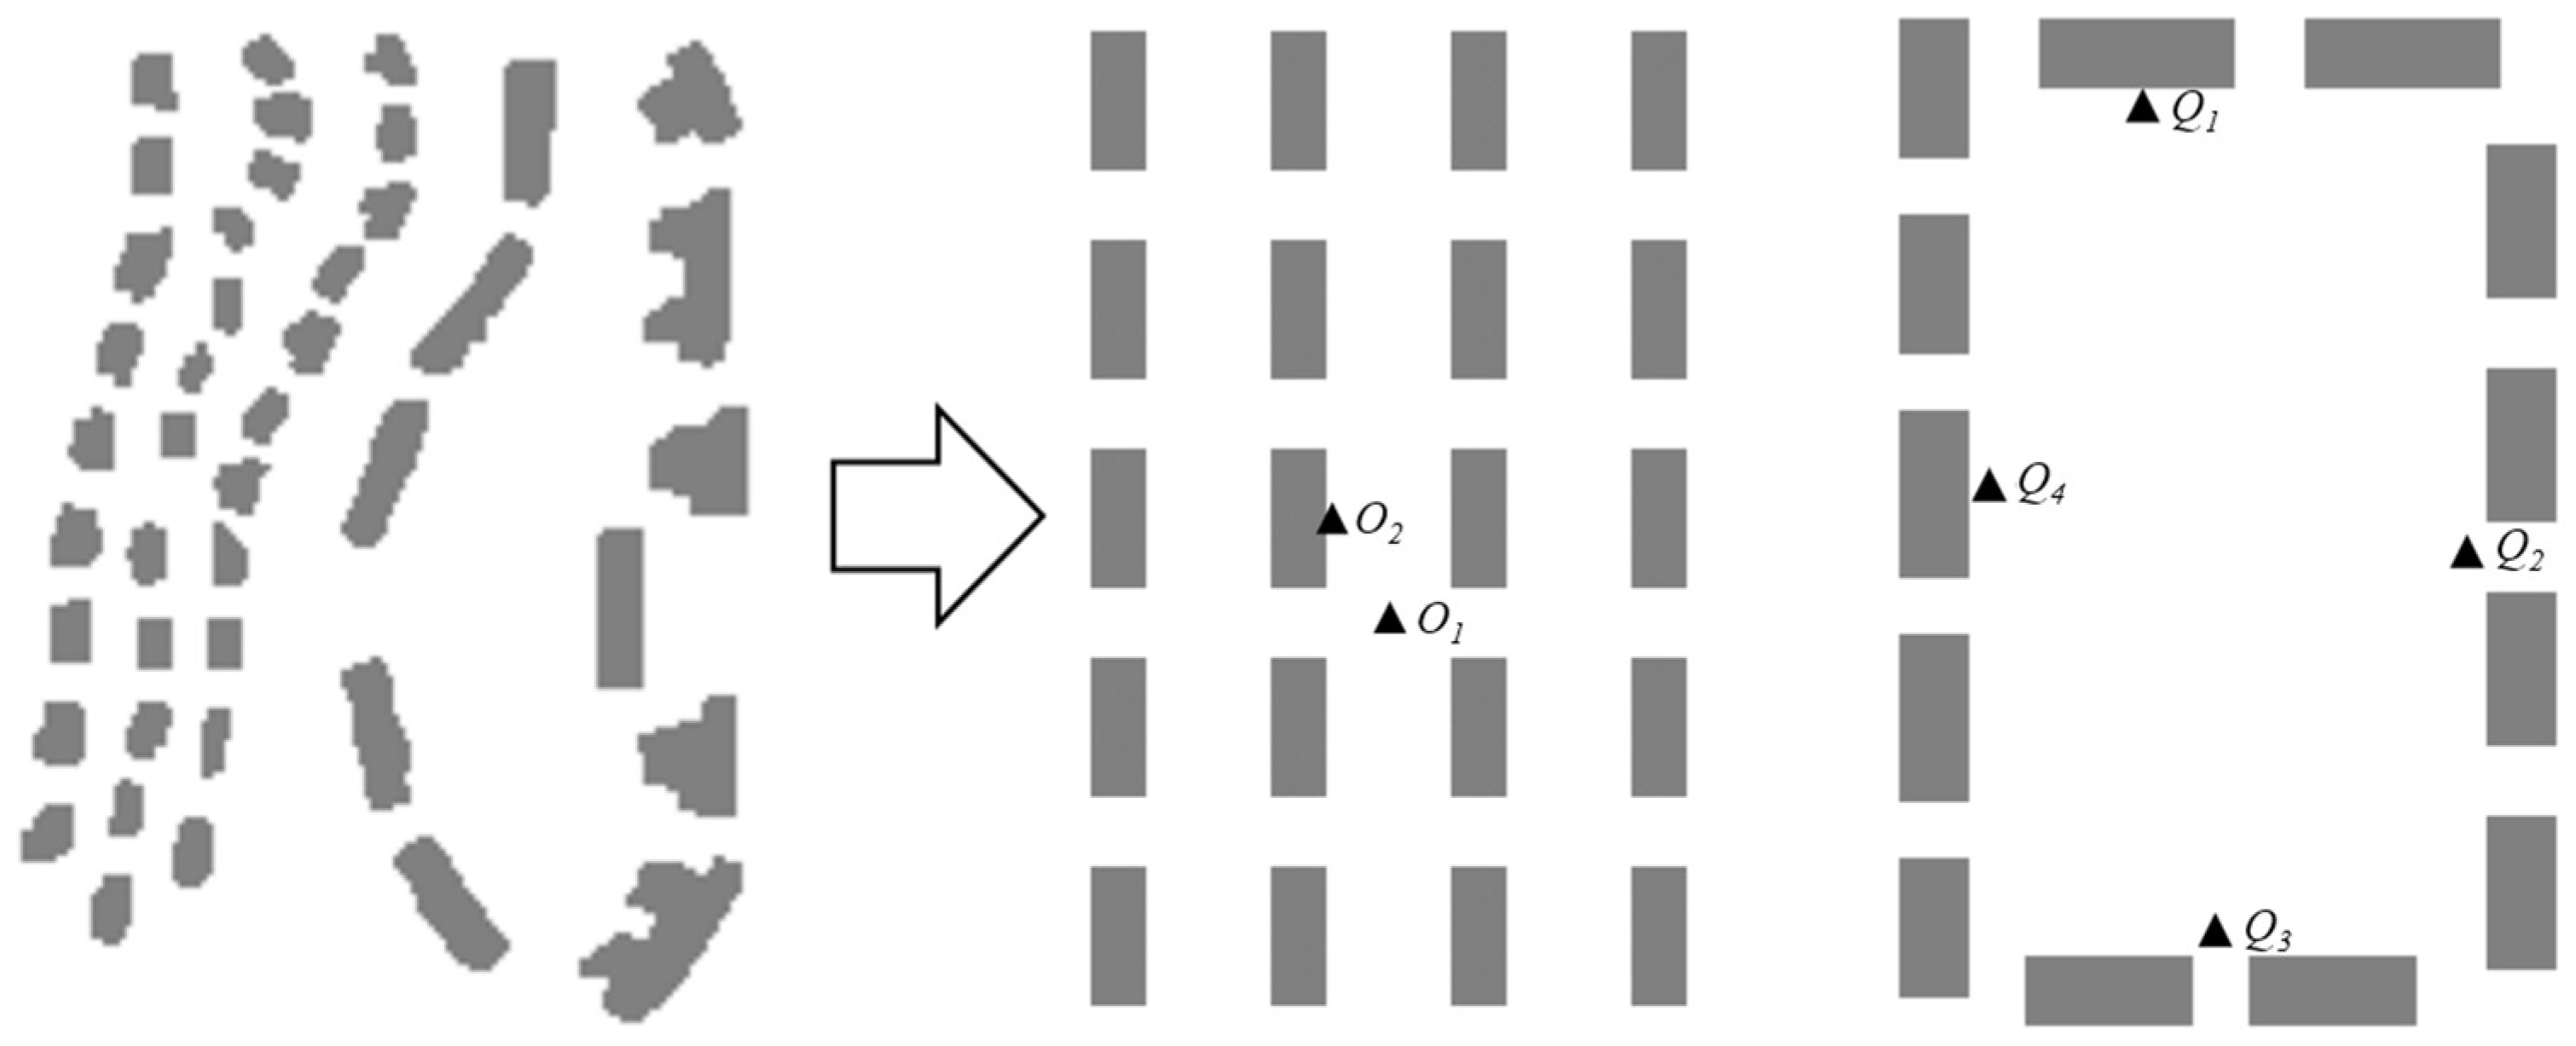
2.1. Field Measurement Sites and Method


| Test Parameter | Instrument Model [46] | Range | Accuracy | |
|---|---|---|---|---|
| Temperature/Relative humidity | ApresysTM temperature and humidity self-recording label |  | −20~60 °C 0% RH~99% RH | 0.1 °C 0.1% |
| Wind speed | WFWZY-1 universal wind speed and temperature recorder | 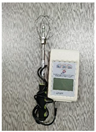 | 0~20 m/s | 0.01 m/s |
| Black bulb temperature | HQZY-1 black bulb thermometer | 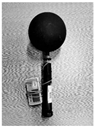 | −20 °C~+80 °C | 0.1 °C |
2.2. Model Setup
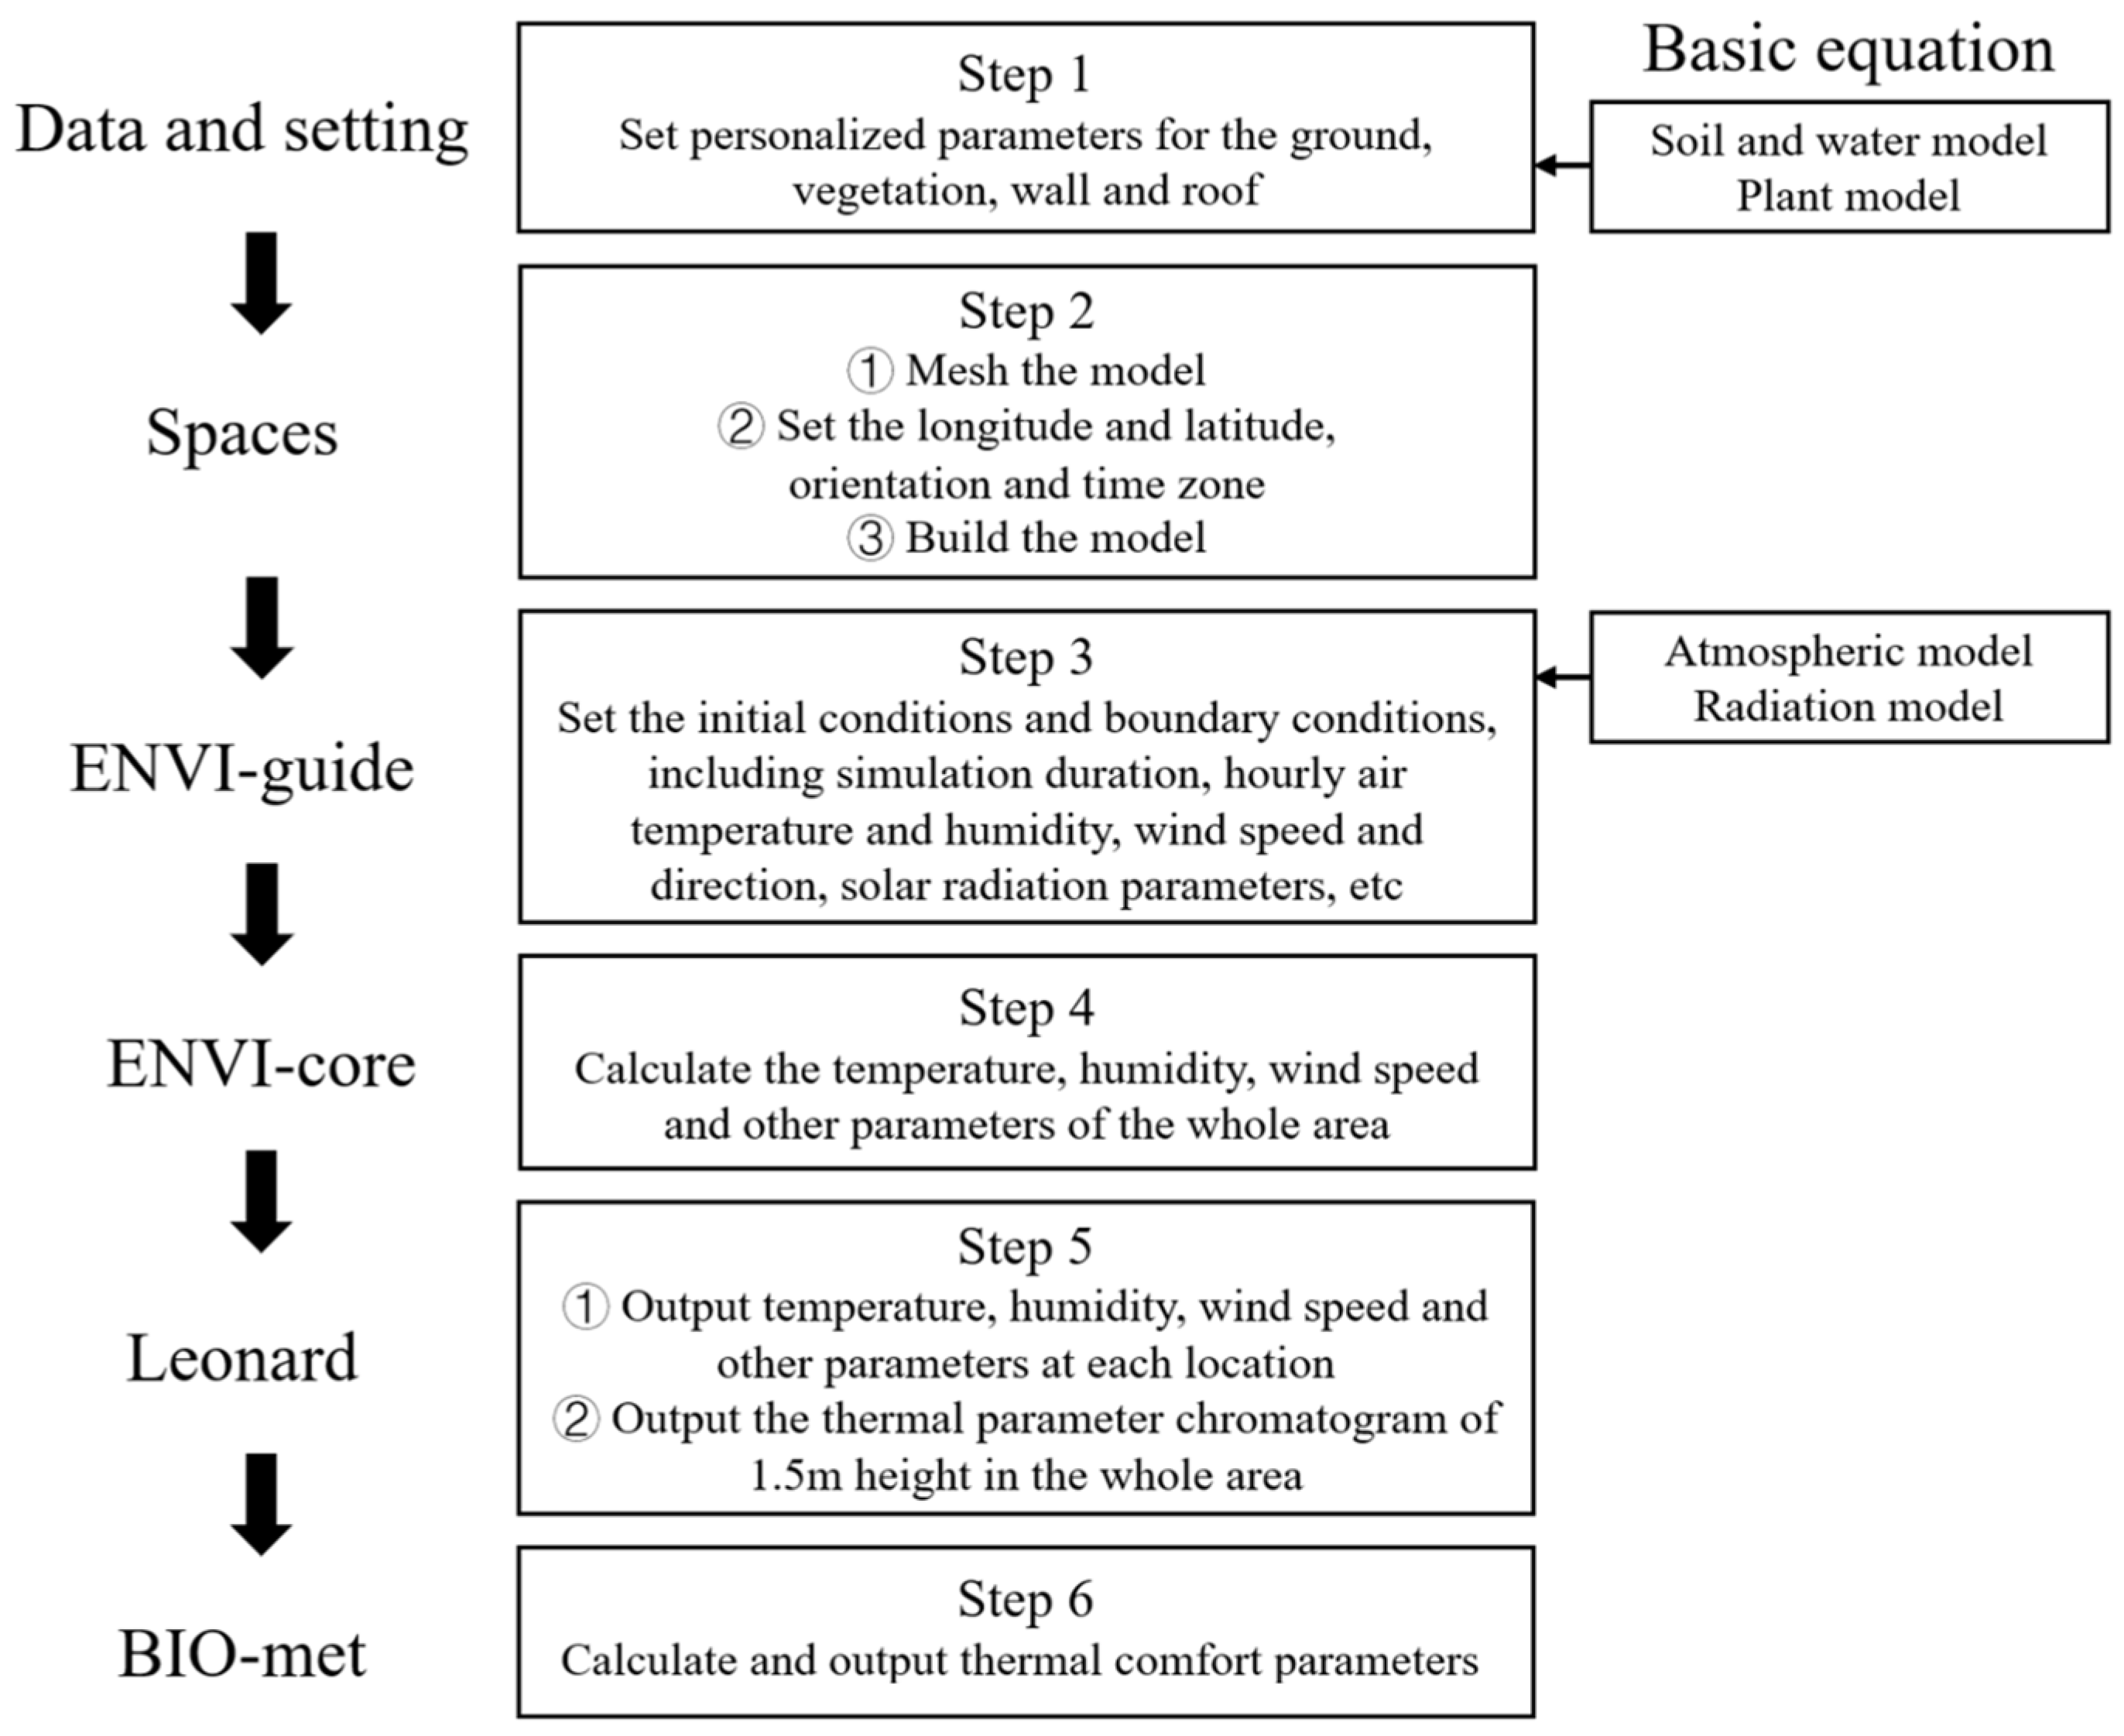
2.2.1. Model Framework and Parameter Setting
- Soil and ground;
- 2.
- Vegetation;
- 3.
- Wall and roof;
2.2.2. Model Initialization
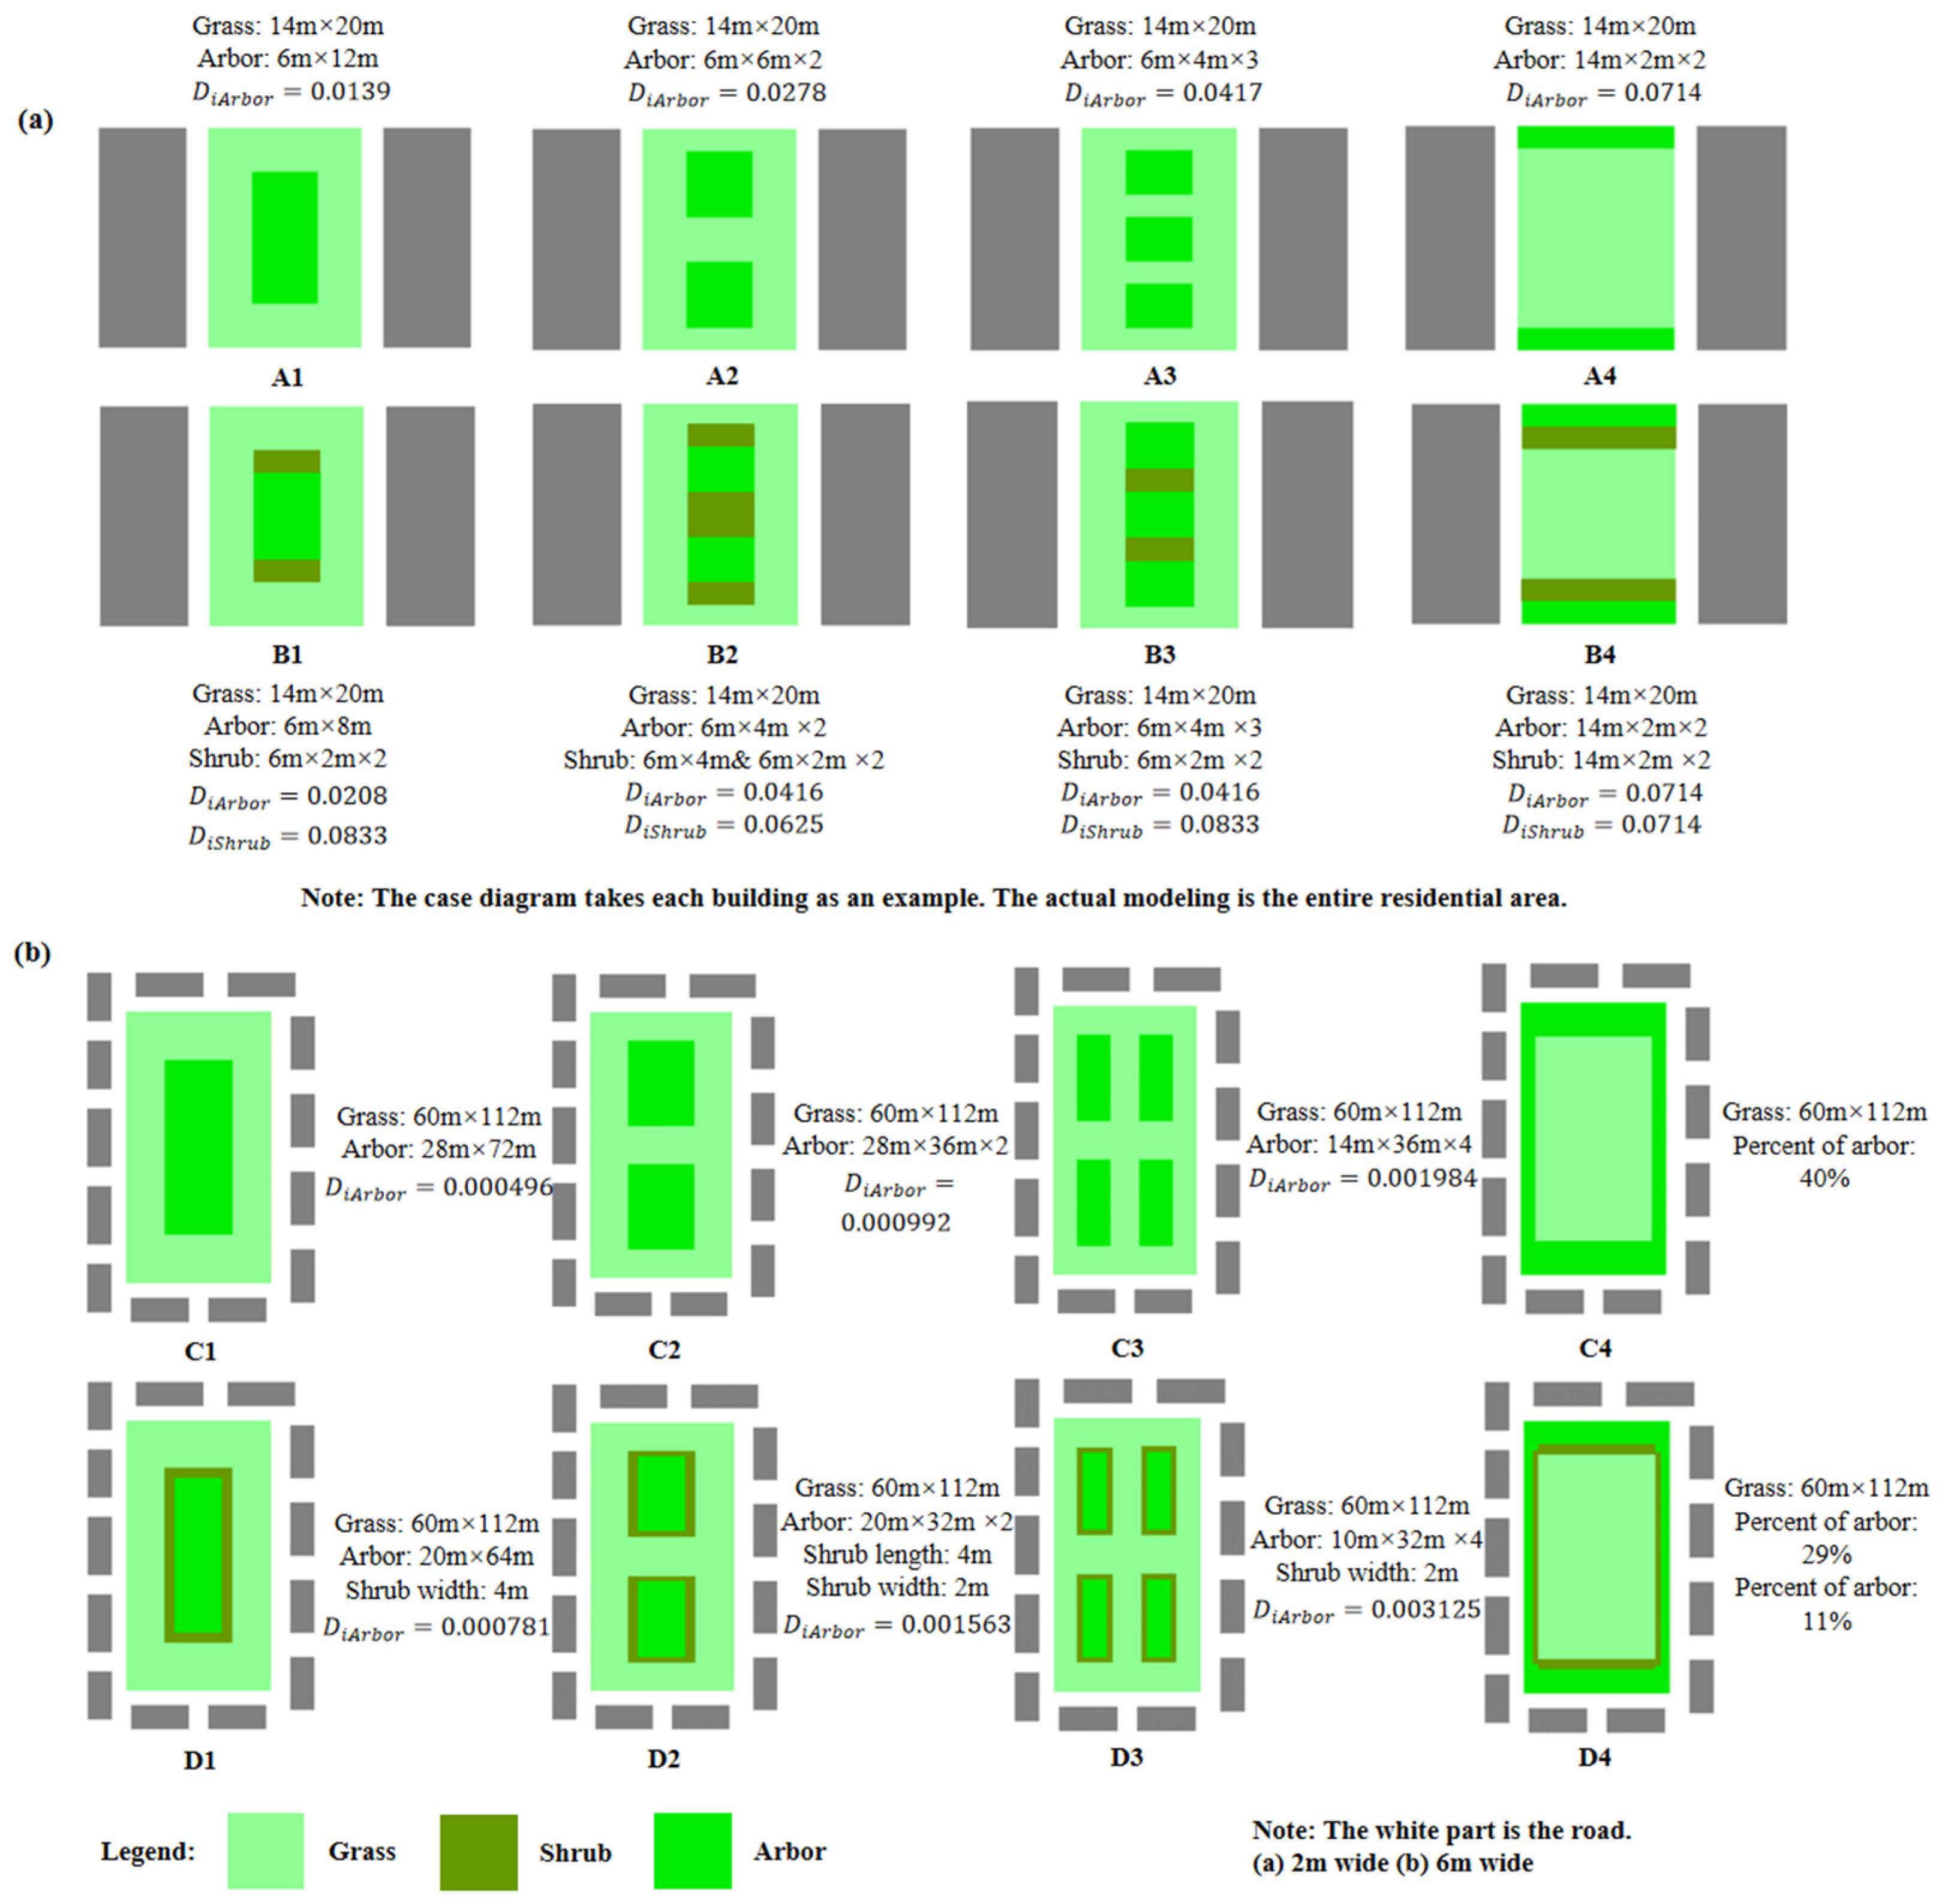
2.3. Simulation Scenarios
3. Results and Discussion
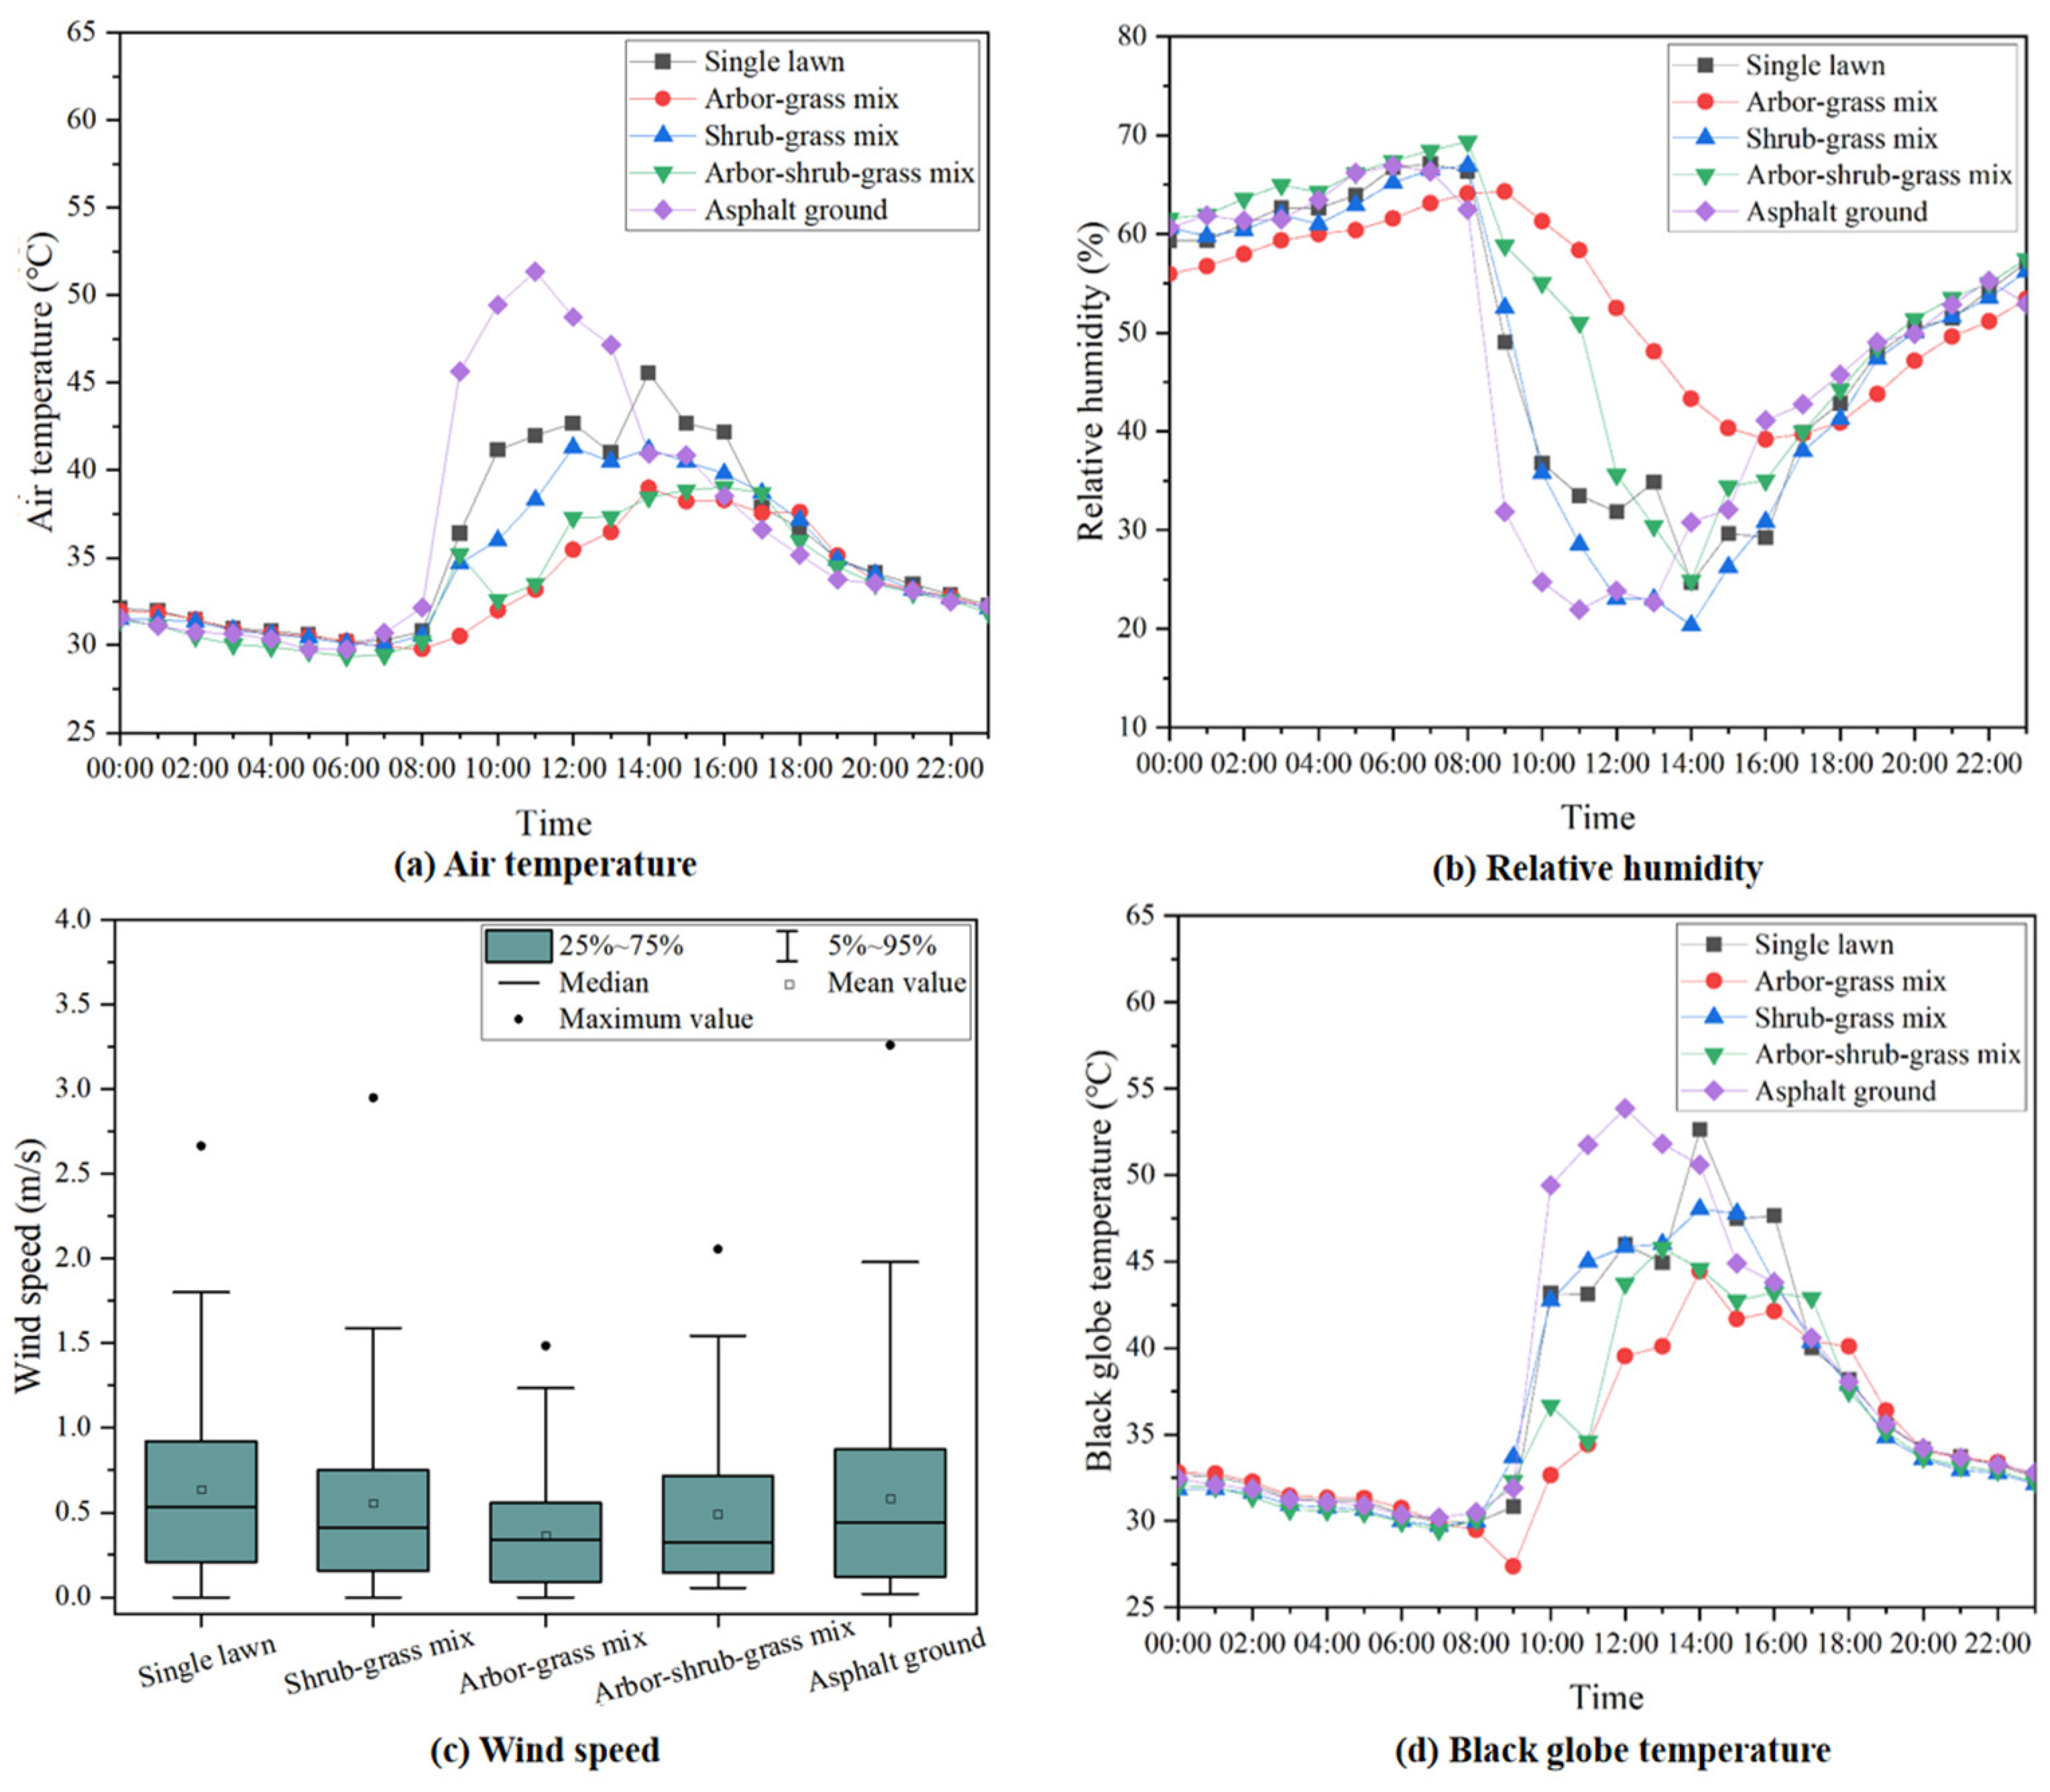
3.1. Changes of Thermal Parameters for Various Greening Layouts
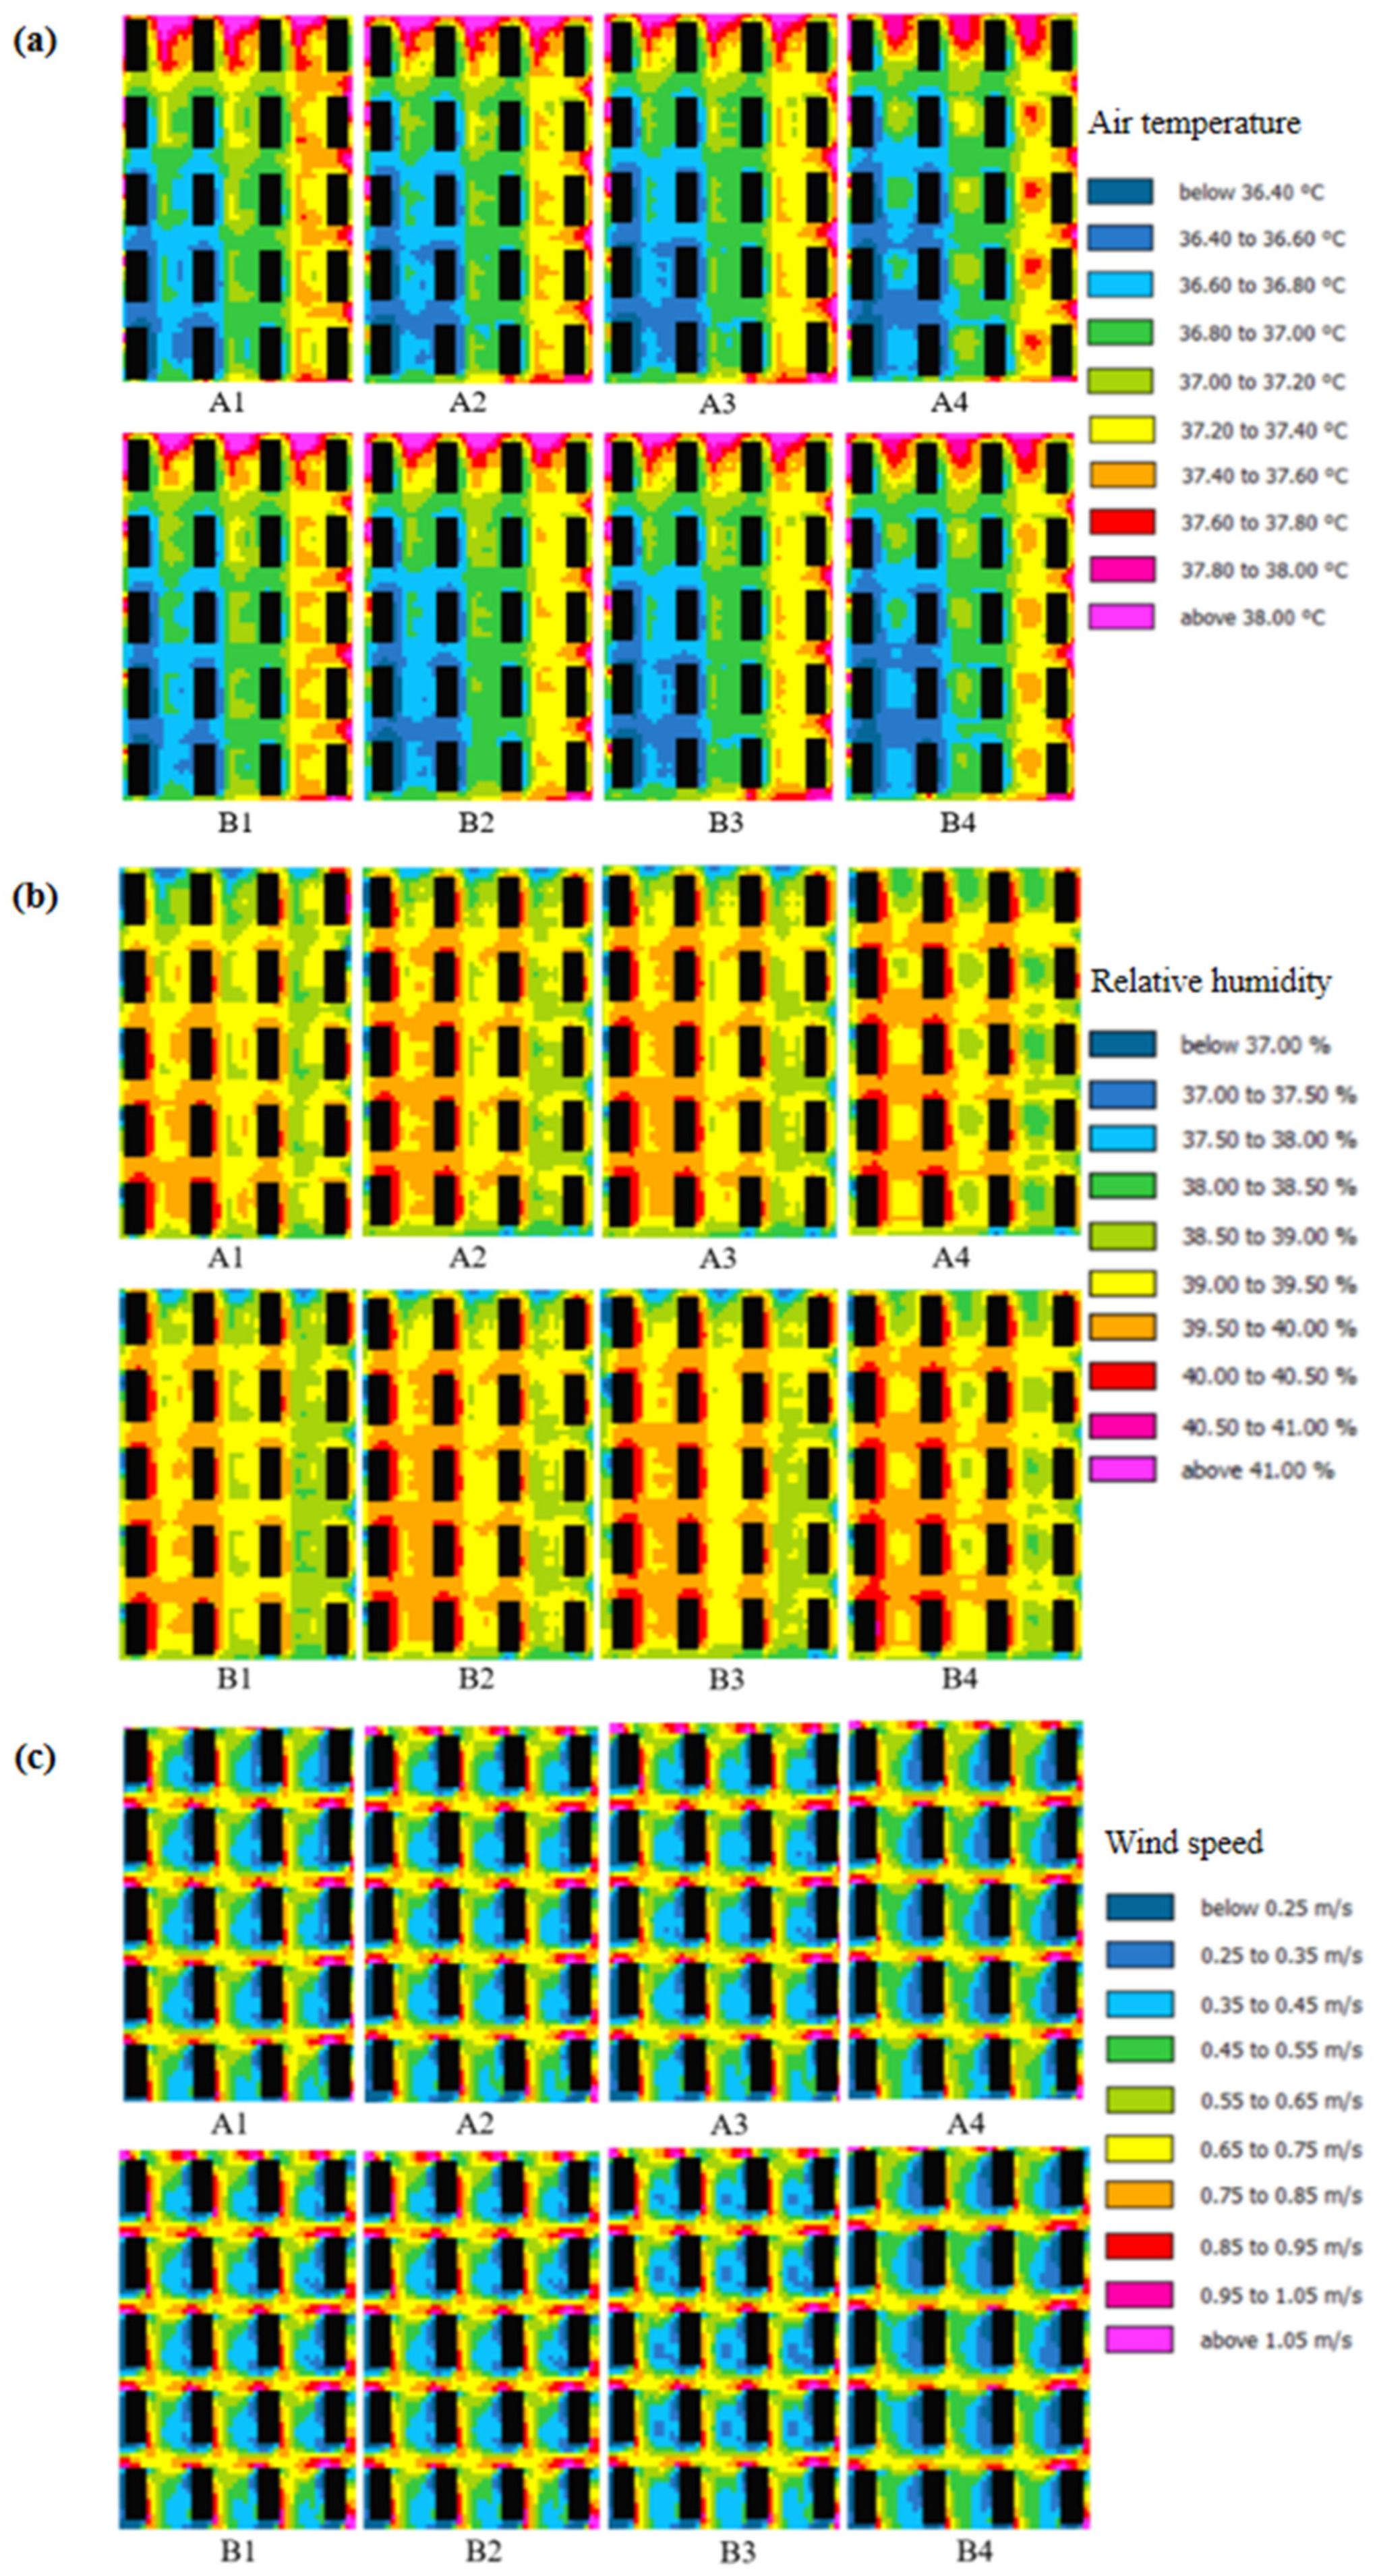
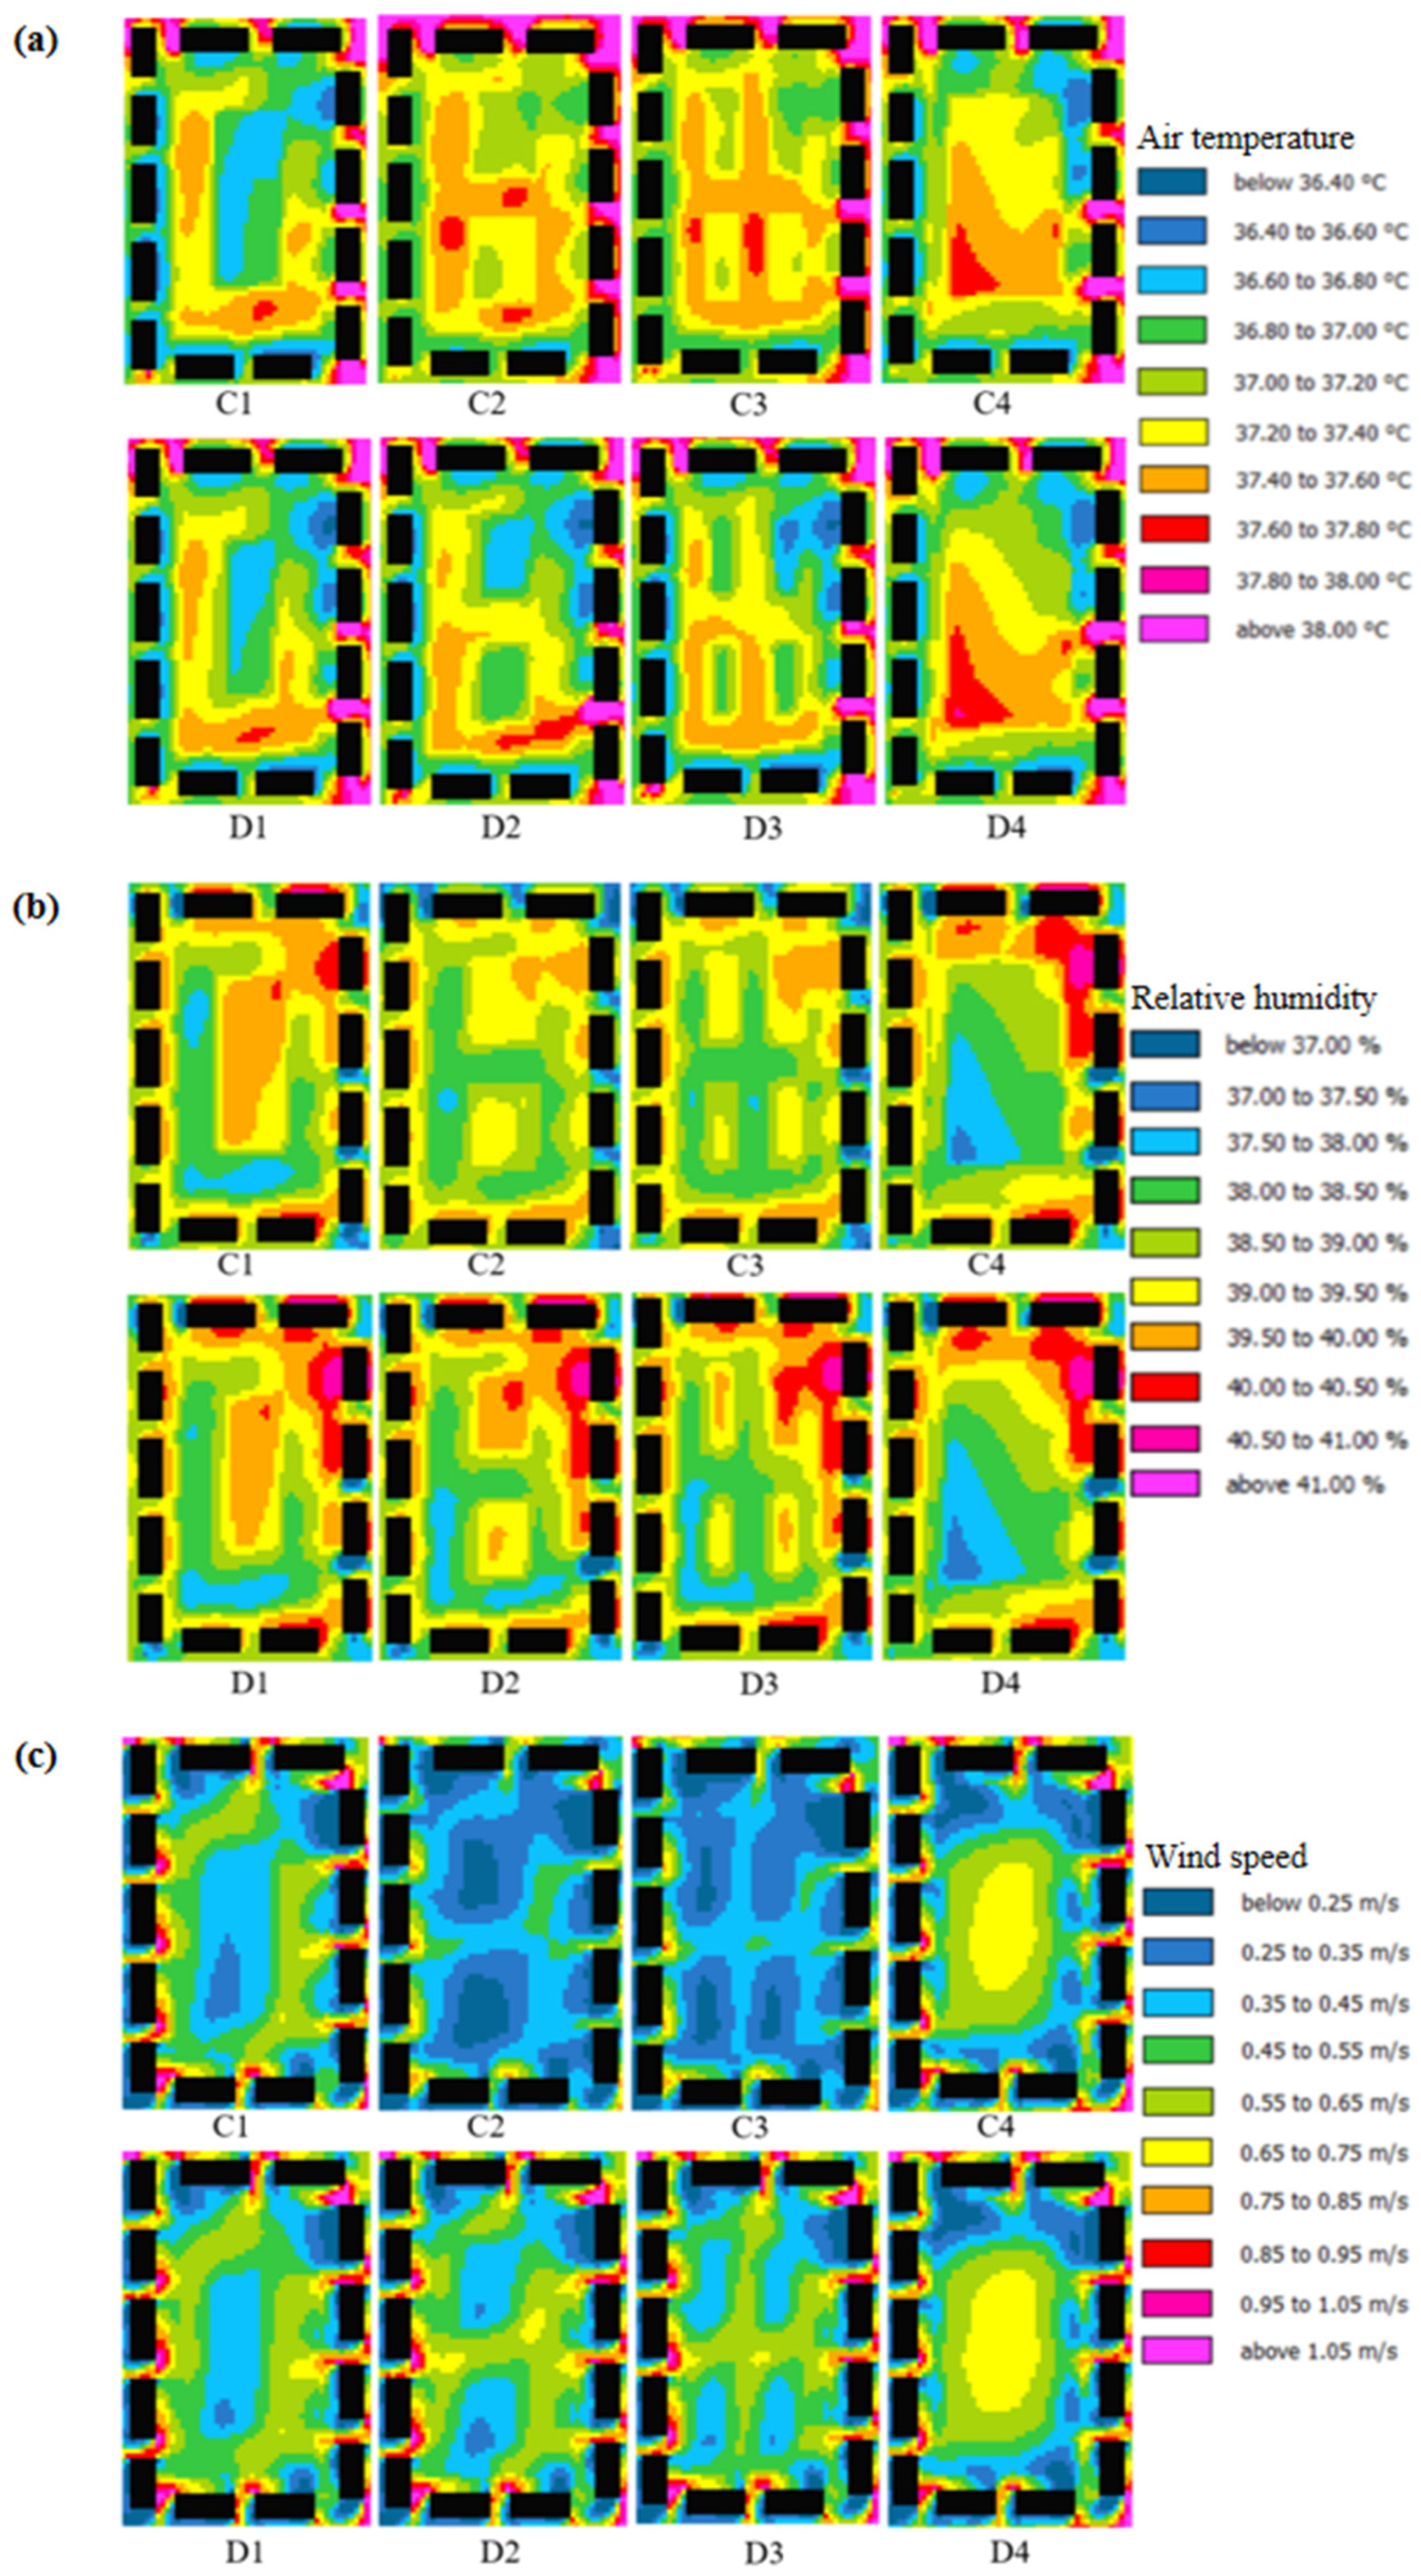
3.2. Effect of Greening Design under Different Building Layouts
3.2.1. Determinant Layout
3.2.2. Enclosed Layout
4. Conclusions
5. Limitations and Future Work
Author Contributions
Funding
Institutional Review Board Statement
Informed Consent Statement
Data Availability Statement
Acknowledgments
Conflicts of Interest
References
- Thompson, C.W.; Aspinall, P.; Roe, J. Access to Green Space in Disadvantaged Urban Communities: Evidence of Salutogenic Effects Based on Biomarker and Self-report Measures of Wellbeing. Procedia—Soc. Behav. Sci. 2014, 153, 10–22. [Google Scholar] [CrossRef]
- Zhang, J.; Browning, M.H.E.M.; Liu, J.; Cheng, Y.; Zhao, B.; Dadvand, P. Is indoor and outdoor greenery associated with fewer depressive symptoms during COVID-19 lockdowns? A mechanistic study in Shanghai, China. Build. Environ. 2023, 227, 109799. [Google Scholar] [CrossRef] [PubMed]
- Shimazaki, Y.; Aoki, M.; Karaki, K.; Yoshida, A. Improving outdoor human-thermal environment by optimizing the reflectance of water-retaining pavement through subjective field-based measurements. Build. Environ. 2022, 210, 108695. [Google Scholar] [CrossRef]
- Yuan, J.; Masuko, S.; Shimazaki, Y.; Yamanaka, T.; Kobayashi, T. Evaluation of outdoor thermal comfort under different building external-wall-surface with different reflective directional properties using CFD analysis and model experiment. Build. Environ. 2022, 207, 108478. [Google Scholar] [CrossRef]
- Zhang, L.; Zhan, Q.; Lan, Y. Effects of the tree distribution and species on outdoor environment conditions in a hot summer and cold winter zone: A case study in Wuhan residential quarters. Build. Environ. 2018, 130, 27–39. [Google Scholar] [CrossRef]
- Lam, C.K.C.; Lee, H.; Yang, S.-R.; Park, S. A review on the significance and perspective of the numerical simulations of outdoor thermal environment. Sustain. Cities Soc. 2021, 71, 102971. [Google Scholar] [CrossRef]
- Nugroho, N.Y.; Triyadi, S.; Wonorahardjo, S. Effect of high-rise buildings on the surrounding thermal environment. Build. Environ. 2022, 207, 108393. [Google Scholar] [CrossRef]
- He, X.; Gao, W.; Wang, R. Impact of urban morphology on the microclimate around elementary schools: A case study from Japan. Build. Environ. 2021, 206, 108383. [Google Scholar] [CrossRef]
- Pan, H.; Luo, Y.; Zeng, L.; Shi, Y.; Hang, J.; Zhang, X.; Hua, J.; Zhao, B.; Gu, Z.; Buccolieri, R. Outdoor Thermal Environment Regulation of Urban Green and Blue Infrastructure on Various Types of Pedestrian Walkways. Atmosphere 2023, 14, 1037. [Google Scholar] [CrossRef]
- Khan, A.; Papazoglou, E.G.; Cartalis, C.; Philippopoulos, K.; Vasilakopoulou, K.; Santamouris, M. On the mitigation potential and urban climate impact of increased green infrastructures in a coastal mediterranean city. Build. Environ. 2022, 221, 109264. [Google Scholar] [CrossRef]
- Fei, F.; Wang, Y.; Yao, W.; Gao, W.; Wang, L. Coupling mechanism of water and greenery on summer thermal environment of waterfront space in China’s cold regions. Build. Environ. 2022, 214, 108912. [Google Scholar] [CrossRef]
- Zheng, S.; Guldmann, J.-M.; Liu, Z.; Zhao, L. Influence of trees on the outdoor thermal environment in subtropical areas: An experimental study in Guangzhou, China. Sustain. Cities Soc. 2018, 42, 482–497. [Google Scholar] [CrossRef]
- Dimoudi, A.; Nikolopoulou, M. Vegetation in the urban environment: Microclimatic analysis and benefits. Energy Build. 2003, 35, 69–76. [Google Scholar] [CrossRef]
- Zhu, S.; Li, Y.; Wei, S.; Wang, C.; Zhang, X.; Jin, X.; Zhou, X.; Shi, X. The impact of urban vegetation morphology on urban building energy consumption during summer and winter seasons in Nanjing, China. Landsc. Urban Plan. 2022, 228, 104576. [Google Scholar] [CrossRef]
- Srivanit, M.; Hokao, K. Evaluating the cooling effects of greening for improving the outdoor thermal environment at an institutional campus in the summer. Build. Environ. 2013, 66, 158–172. [Google Scholar] [CrossRef]
- Tseliou, A.; Melas, E.; Mela, A.; Tsiros, I.; Zervas, E. The Effect of Green Roofs and Green Façades in the Pedestrian Thermal Comfort of a Mediterranean Urban Residential Area. Atmosphere 2023, 14, 1512. [Google Scholar] [CrossRef]
- Susca, T.; Zanghirella, F.; Colasuonno, L.; Del Fatto, V. Effect of green wall installation on urban heat island and building energy use: A climate-informed systematic literature review. Renew. Sustain. Energy Rev. 2022, 159, 112100. [Google Scholar] [CrossRef]
- Liu, H.; Lim, J.Y.; Thet, B.W.H.; Lai, P.-Y.; Koh, W.S. Evaluating the impact of tree morphologies and planting densities on outdoor thermal comfort in tropical residential precincts in Singapore. Build. Environ. 2022, 221, 109268. [Google Scholar] [CrossRef]
- Ng, E.; Chen, L.; Wang, Y.; Yuan, C. A study on the cooling effects of greening in a high-density city: An experience from Hong Kong. Build. Environ. 2012, 47, 256–271. [Google Scholar] [CrossRef]
- Teshnehdel, S.; Akbari, H.; Di Giuseppe, E.; Brown, R.D. Effect of tree cover and tree species on microclimate and pedestrian comfort in a residential district in Iran. Build. Environ. 2020, 178, 106899. [Google Scholar] [CrossRef]
- Wu, Z.; Man, W.; Ren, Y. Influence of tree coverage and micro-topography on the thermal environment within and beyond a green space. Agric. For. Meteorol. 2022, 316, 108846. [Google Scholar] [CrossRef]
- Sharmin, M.; Tjoelker, M.G.; Pfautsch, S.; Esperón-Rodriguez, M.; Rymer, P.D.; Power, S.A. Tree Traits and Microclimatic Conditions Determine Cooling Benefits of Urban Trees. Atmosphere 2023, 14, 606. [Google Scholar] [CrossRef]
- Yang, Y.; Gatto, E.; Gao, Z.; Buccolieri, R.; Morakinyo, T.E.; Lan, H. The “plant evaluation model” for the assessment of the impact of vegetation on outdoor microclimate in the urban environment. Build. Environ. 2019, 159, 106151. [Google Scholar] [CrossRef]
- Hami, A.; Abdi, B.; Zarehaghi, D.; Maulan, S.B. Assessing the thermal comfort effects of green spaces: A systematic review of methods, parameters, and plants’ attributes. Sustain. Cities Soc. 2019, 49, 101634. [Google Scholar] [CrossRef]
- Morakinyo, T.E.; Lam, Y.F. Simulation study on the impact of tree-configuration, planting pattern and wind condition on street-canyon’s micro-climate and thermal comfort. Build. Environ. 2016, 103, 262–275. [Google Scholar] [CrossRef]
- Sodoudi, S.; Zhang, H.; Chi, X.; Müller, F.; Li, H. The influence of spatial configuration of green areas on microclimate and thermal comfort. Urban For. Urban Green. 2018, 34, 85–96. [Google Scholar] [CrossRef]
- Fan, C.; Myint, S.W.; Zheng, B. Measuring the spatial arrangement of urban vegetation and its impacts on seasonal surface temperatures. Prog. Phys. Geogr. Earth Environ. 2015, 39, 199–219. [Google Scholar] [CrossRef]
- Yang, Y.; Zhou, D.; Wang, Y.; Meng, X.; Gu, Z.; Xu, D.; Han, X. Planning method of centralized greening in high-rise residential blocks based on improvement of thermal comfort in summer. Sustain. Cities Soc. 2022, 80, 103802. [Google Scholar] [CrossRef]
- El-Bardisy, W.M.; Fahmy, M.; El-Gohary, G.F. Climatic Sensitive Landscape Design: Towards a Better Microclimate through Plantation in Public Schools, Cairo, Egypt. Procedia—Soc. Behav. Sci. 2016, 216, 206–216. [Google Scholar] [CrossRef]
- Zhao, Q.; Sailor, D.J.; Wentz, E.A. Impact of tree locations and arrangements on outdoor microclimates and human thermal comfort in an urban residential environment. Urban For. Urban Green. 2018, 32, 81–91. [Google Scholar] [CrossRef]
- Hong, B.; Lin, B. Numerical studies of the outdoor wind environment and thermal comfort at pedestrian level in housing blocks with different building layout patterns and trees arrangement. Renew. Energy 2015, 73, 18–27. [Google Scholar] [CrossRef]
- Tan, C.L.; Wong, N.H.; Tan, P.Y.; Jusuf, S.K.; Chiam, Z.Q. Impact of plant evapotranspiration rate and shrub albedo on temperature reduction in the tropical outdoor environment. Build. Environ. 2015, 94, 206–217. [Google Scholar] [CrossRef]
- Li, J.; Zheng, B.; Ouyang, X.; Chen, X.; Bedra, K.B. Does shrub benefit the thermal comfort at pedestrian height in Singapore? Sustain. Cities Soc. 2021, 75, 103333. [Google Scholar] [CrossRef]
- Meili, N.; Acero, J.A.; Peleg, N.; Manoli, G.; Burlando, P.; Fatichi, S. Vegetation cover and plant-trait effects on outdoor thermal comfort in a tropical city. Build. Environ. 2021, 195, 107733. [Google Scholar] [CrossRef]
- Gong, Y.; Li, X.; Liu, H.; Li, Y. The Spatial Pattern and Mechanism of Thermal Environment in Urban Blocks from the Perspective of Green Space Fractal. Buildings 2023, 13, 574. [Google Scholar] [CrossRef]
- Park, M.; Hagishima, A.; Tanimoto, J.; Narita, K.-I. Effect of urban vegetation on outdoor thermal environment: Field measurement at a scale model site. Build. Environ. 2012, 56, 38–46. [Google Scholar] [CrossRef]
- Xi, T.; Li, Q.; Mochida, A.; Meng, Q. Study on the outdoor thermal environment and thermal comfort around campus clusters in subtropical urban areas. Build. Environ. 2012, 52, 162–170. [Google Scholar] [CrossRef]
- Liu, Z.; Cheng, W.; Jim, C.Y.; Morakinyo, T.E.; Shi, Y.; Ng, E. Heat mitigation benefits of urban green and blue infrastructures: A systematic review of modeling techniques, validation and scenario simulation in ENVI-met V4. Build. Environ. 2021, 200, 107939. [Google Scholar] [CrossRef]
- Wang, Y.; Zacharias, J. Landscape modification for ambient environmental improvement in central business districts—A case from Beijing. Urban For. Urban Green. 2015, 14, 8–18. [Google Scholar] [CrossRef]
- Lin, P.; Song, D.; Qin, H. Impact of parking and greening design strategies on summertime outdoor thermal condition in old mid-rise residential estates. Urban For. Urban Green. 2021, 63, 127200. [Google Scholar] [CrossRef]
- Simon, H.; Lindén, J.; Hoffmann, D.; Braun, P.; Bruse, M.; Esper, J. Modeling transpiration and leaf temperature of urban trees—A case study evaluating the microclimate model ENVI-met against measurement data. Landsc. Urban Plan. 2018, 174, 33–40. [Google Scholar] [CrossRef]
- Rui, L.; Buccolieri, R.; Gao, Z.; Ding, W.; Shen, J. The impact of green space layouts on microclimate and air quality in residential districts of Nanjing, China. Forests 2018, 9, 224. [Google Scholar] [CrossRef]
- ISO 7726; Ergonomics of the Thermal Environment—Instruments for Measuring Physical Quantities. Danish Standards Association: Copenhagen, Denmark, 2001.
- Shi, D. Study on the Synergistic Cooling Effect of Green Water Bodies in Existing Residential Areas in Chongqing. Master’s Thesis, Chongqing University, Chongqing, China, 2021. [Google Scholar]
- Chen, Y. Study on the Impact of Greening Layout on the Outdoor Thermal, Environment of Chongqing Residential District in Summer. Master’s Thesis, Chongqing University, Chongqing, China, 2020. [Google Scholar]
- Hao, Z. A Study on Outdoor Thermal Comfort in Existing Residential Areas of Chongqing in Summer. Master’s Thesis, Chongqing University, Chongqing, China, 2020. [Google Scholar]
- Zhu, S. Study on Characteristics of Garden Plant Disposition of Residential Areas in Central Districts of Chongqing. Master’s Thesis, Chongqing Southwest University, Chongqing, China, 2007. [Google Scholar]
- Chow, W.T.; Pope, R.L.; Martin, C.A.; Brazel, A.J. Observing and modeling the nocturnal park cool island of an arid city: Horizontal and vertical impacts. Theor. Appl. Climatol. 2011, 103, 197–211. [Google Scholar] [CrossRef]
- Cilek, M.U.; Uslu, C. Modeling the relationship between the geometric characteristics of urban green spaces and thermal comfort: The case of Adana city. Sustain. Cities Soc. 2022, 79, 103748. [Google Scholar] [CrossRef]
- Aminipouri, M.; Rayner, D.; Lindberg, F.; Thorsson, S.; Knudby, A.J.; Zickfeld, K.; Middel, A.; Krayenhoff, E.S. Urban tree planting to maintain outdoor thermal comfort under climate change: The case of Vancouver’s local climate zones. Build. Environ. 2019, 158, 226–236. [Google Scholar] [CrossRef]
- Mansouri, S.T.; Zarghami, E. Investigating the effect of the physical layout of the architecture of high-rise buildings, residential complexes, and urban heat islands. Energy Built Environ. 2023. [Google Scholar] [CrossRef]
- Teitelbaum, E.; Rysanek, A.; Pantelic, J.; Aviv, D.; Obelz, S.; Buff, A.; Luo, Y.; Sheppard, D.; Meggers, F. Revisiting radiant cooling: Condensation-free heat rejection using infrared-transparent enclosures of chilled panels. Archit. Sci. Rev. 2019, 62, 152–159. [Google Scholar] [CrossRef]
- Alfano, F.R.D.; Ficco, G.; Frattolillo, A.; Palella, B.I.; Riccio, G. Mean Radiant Temperature Measurements through Small Black Globes under Forced Convection Conditions. Atmosphere 2021, 12, 621. [Google Scholar] [CrossRef]


| Material | Unit | Natural Soil |
|---|---|---|
| Water content at saturation | m3 (Water)/m3 (Soil) | 0.45 |
| Water content at field capacity | m3 (Water)/m3 (Soil) | 0.24 |
| Water content at wilting point | m3 (Water)/m3 (Soil) | 0.155 |
| Matrix potential | m | −0.478 |
| Hydraulic conductivity | m/s·10−6 | 7 |
| Volumetric heat capacity | J/(m3·K)·106 | 1.88 |
| Clapp & Hornberger constant | / | 5.39 |
| Heat conductivity | W/m·K | 0.7838 |
| Ground Type | Thickness (m) | Thermal Conductivity (W/m·K) | Roughness (mm) | Reflectivity | Emissivity |
|---|---|---|---|---|---|
| Natural soil | 4.5 | 0.7838 | 1 | 0.17 | 0.94 |
| Concrete | 0.1 | 1.05 | 1 | 0.04 | 0.94 |
| Granite | 0.1 | 3.49 | 1 | 0.4 | 0.85 |
| Wave | 1 | 0.599 | 1 | 0 | 0.95 |
| Lawn | Shrub | Arbor | |
|---|---|---|---|
| Transmissivity | 0.35 | 0.2 | 0.1 |
| Emissivity | 0.25 | 0.15 | 0.15 |
| Height (m) | 0.5 | 1 | 7 |
| LAD = 1/10 | 0.4 | 2.8 | 0.159 |
| LAD = 2/10 | 0.4 | 2.8 | 0.23 |
| LAD = 3/10 | 0.4 | 2.8 | 0.334 |
| LAD = 4/10 | 0.4 | 2.8 | 0.482 |
| LAD = 5/10 | 0.4 | 2.8 | 0.671 |
| LAD = 6/10 | 0.4 | 2.8 | 0.848 |
| LAD = 7/10 | 0.4 | 2.8 | 0.878 |
| LAD = 8/10 | 0.4 | 2.8 | 0.827 |
| LAD = 9/10 | 0.4 | 2.8 | 0.626 |
| LAD = 10/10 | 0.4 | 2.8 | 0.075 |
| Type | Roof | Wall |
|---|---|---|
| Thickness (m) | 0.3 | 0.3 |
| Absorptivity | 0.5 | 0.7 |
| Transmittance | 0 | 0 |
| Reflectivity | 0.5 | 0.5 |
| Emissivity | 0.9 | 0.9 |
| Specific heat capacity (J/kg·K) | 1300 | 1050 |
| Thermal conductivity (W/m·K) | 0.84 | 0.81 |
| Density (kg/m3) | 1900 | 1800 |
| Roughness (m) | 0.02 | 0.02 |
| The Simplified ENVI-Met Model | |
|---|---|
| Location | 29.72 N 106.63 E |
| Climate | Hot summer-cold winter |
| Grid cell | dx = 2 m, dy = 2 m, dz = 3 m |
| Grid north | 22.5 |
| Grid space for determinant layout | 102 × 129 × 30 |
| Grid space for enclosed layout | 106 × 131 × 30 |
| Distance between buildings | 18 m |
| Buildings height | 12 m |
| Reference points height | 1.5 m |
| City | Air Temperature (°C) | Relative Humidity (%) | Wind Speed (m/s) | Solar Radiation Intensity (W/m2) | ||||
|---|---|---|---|---|---|---|---|---|
| Average | Range | Average | Range | Average | Range | Average | Max. (Time) | |
| Chongqing | 31.1 | 25.9–37.0 | 67.5 | 41.4–91.4 | 1.35 | 0.3–2.7 | 362.5 | 13:00 |
| Greening Layout | Air Temperature | Relative Humidity | Wind Speed | Black Globe Temperature | ||||
|---|---|---|---|---|---|---|---|---|
| Mean Value (°C) | Variance | Mean Value (%) | Variance | Mean Value (m/s) | Variance | Mean Value (°C) | Variance | |
| Single lawn | 35.6 | 23.66 | 49.3 | 181.31 | 0.62 | 0.16 | 36.9 | 45.67 |
| Arbor-grass mix | 33.4 | 8.65 | 53.0 | 68.32 | 0.41 | 0.10 | 34.8 | 20.55 |
| Shrub-grass mix | 34.7 | 15.48 | 47.7 | 234.21 | 0.58 | 0.22 | 36.4 | 40.86 |
| Arbor-shrub-grass mix | 33.5 | 10.74 | 52.6 | 167.60 | 0.49 | 0.16 | 35.3 | 28.14 |
| Asphalt ground | 36.5 | 47.68 | 47.9 | 234.29 | 0.45 | 0.17 | 37.8 | 64.79 |
| Case | Tmrt | PET | ||
|---|---|---|---|---|
| Center | Asphalt | Center | Asphalt | |
| C1 | 51.1 | 62.5 | 44.5 | 49.2 |
| C2 | 64.4 | 65.4 | 52.7 | 49.2 |
| C3 | 64.1 | 65.5 | 52.3 | 49.2 |
| C4 | 61.0 | 62.2 | 48.6 | 49.2 |
| D1 | 51.0 | 62.6 | 44.4 | 49.2 |
| D2 | 61.4 | 62.6 | 49.4 | 49.2 |
| D3 | 61.3 | 62.6 | 49.2 | 49.2 |
| D4 | 61.0 | 62.3 | 48.6 | 49.2 |
Disclaimer/Publisher’s Note: The statements, opinions and data contained in all publications are solely those of the individual author(s) and contributor(s) and not of MDPI and/or the editor(s). MDPI and/or the editor(s) disclaim responsibility for any injury to people or property resulting from any ideas, methods, instructions or products referred to in the content. |
© 2023 by the authors. Licensee MDPI, Basel, Switzerland. This article is an open access article distributed under the terms and conditions of the Creative Commons Attribution (CC BY) license (https://creativecommons.org/licenses/by/4.0/).
Share and Cite
Lu, F.; Gao, Y.; Jiang, L.; Chen, Y.; Hao, Z. The Effect of Greening Layout on Microclimate in Urban Residential Areas in Hot Summer–Cold Winter Zones. Atmosphere 2023, 14, 1824. https://doi.org/10.3390/atmos14121824
Lu F, Gao Y, Jiang L, Chen Y, Hao Z. The Effect of Greening Layout on Microclimate in Urban Residential Areas in Hot Summer–Cold Winter Zones. Atmosphere. 2023; 14(12):1824. https://doi.org/10.3390/atmos14121824
Chicago/Turabian StyleLu, Fangqi, Yafeng Gao, Lina Jiang, Yangyang Chen, and Zhongyu Hao. 2023. "The Effect of Greening Layout on Microclimate in Urban Residential Areas in Hot Summer–Cold Winter Zones" Atmosphere 14, no. 12: 1824. https://doi.org/10.3390/atmos14121824
APA StyleLu, F., Gao, Y., Jiang, L., Chen, Y., & Hao, Z. (2023). The Effect of Greening Layout on Microclimate in Urban Residential Areas in Hot Summer–Cold Winter Zones. Atmosphere, 14(12), 1824. https://doi.org/10.3390/atmos14121824