

Spatiotemporal Analysis of Hydrometeorological Factors in the Source Region of the Dongting Lake Basin, China


Abstract
:1. Introduction
2. Materials and Methods
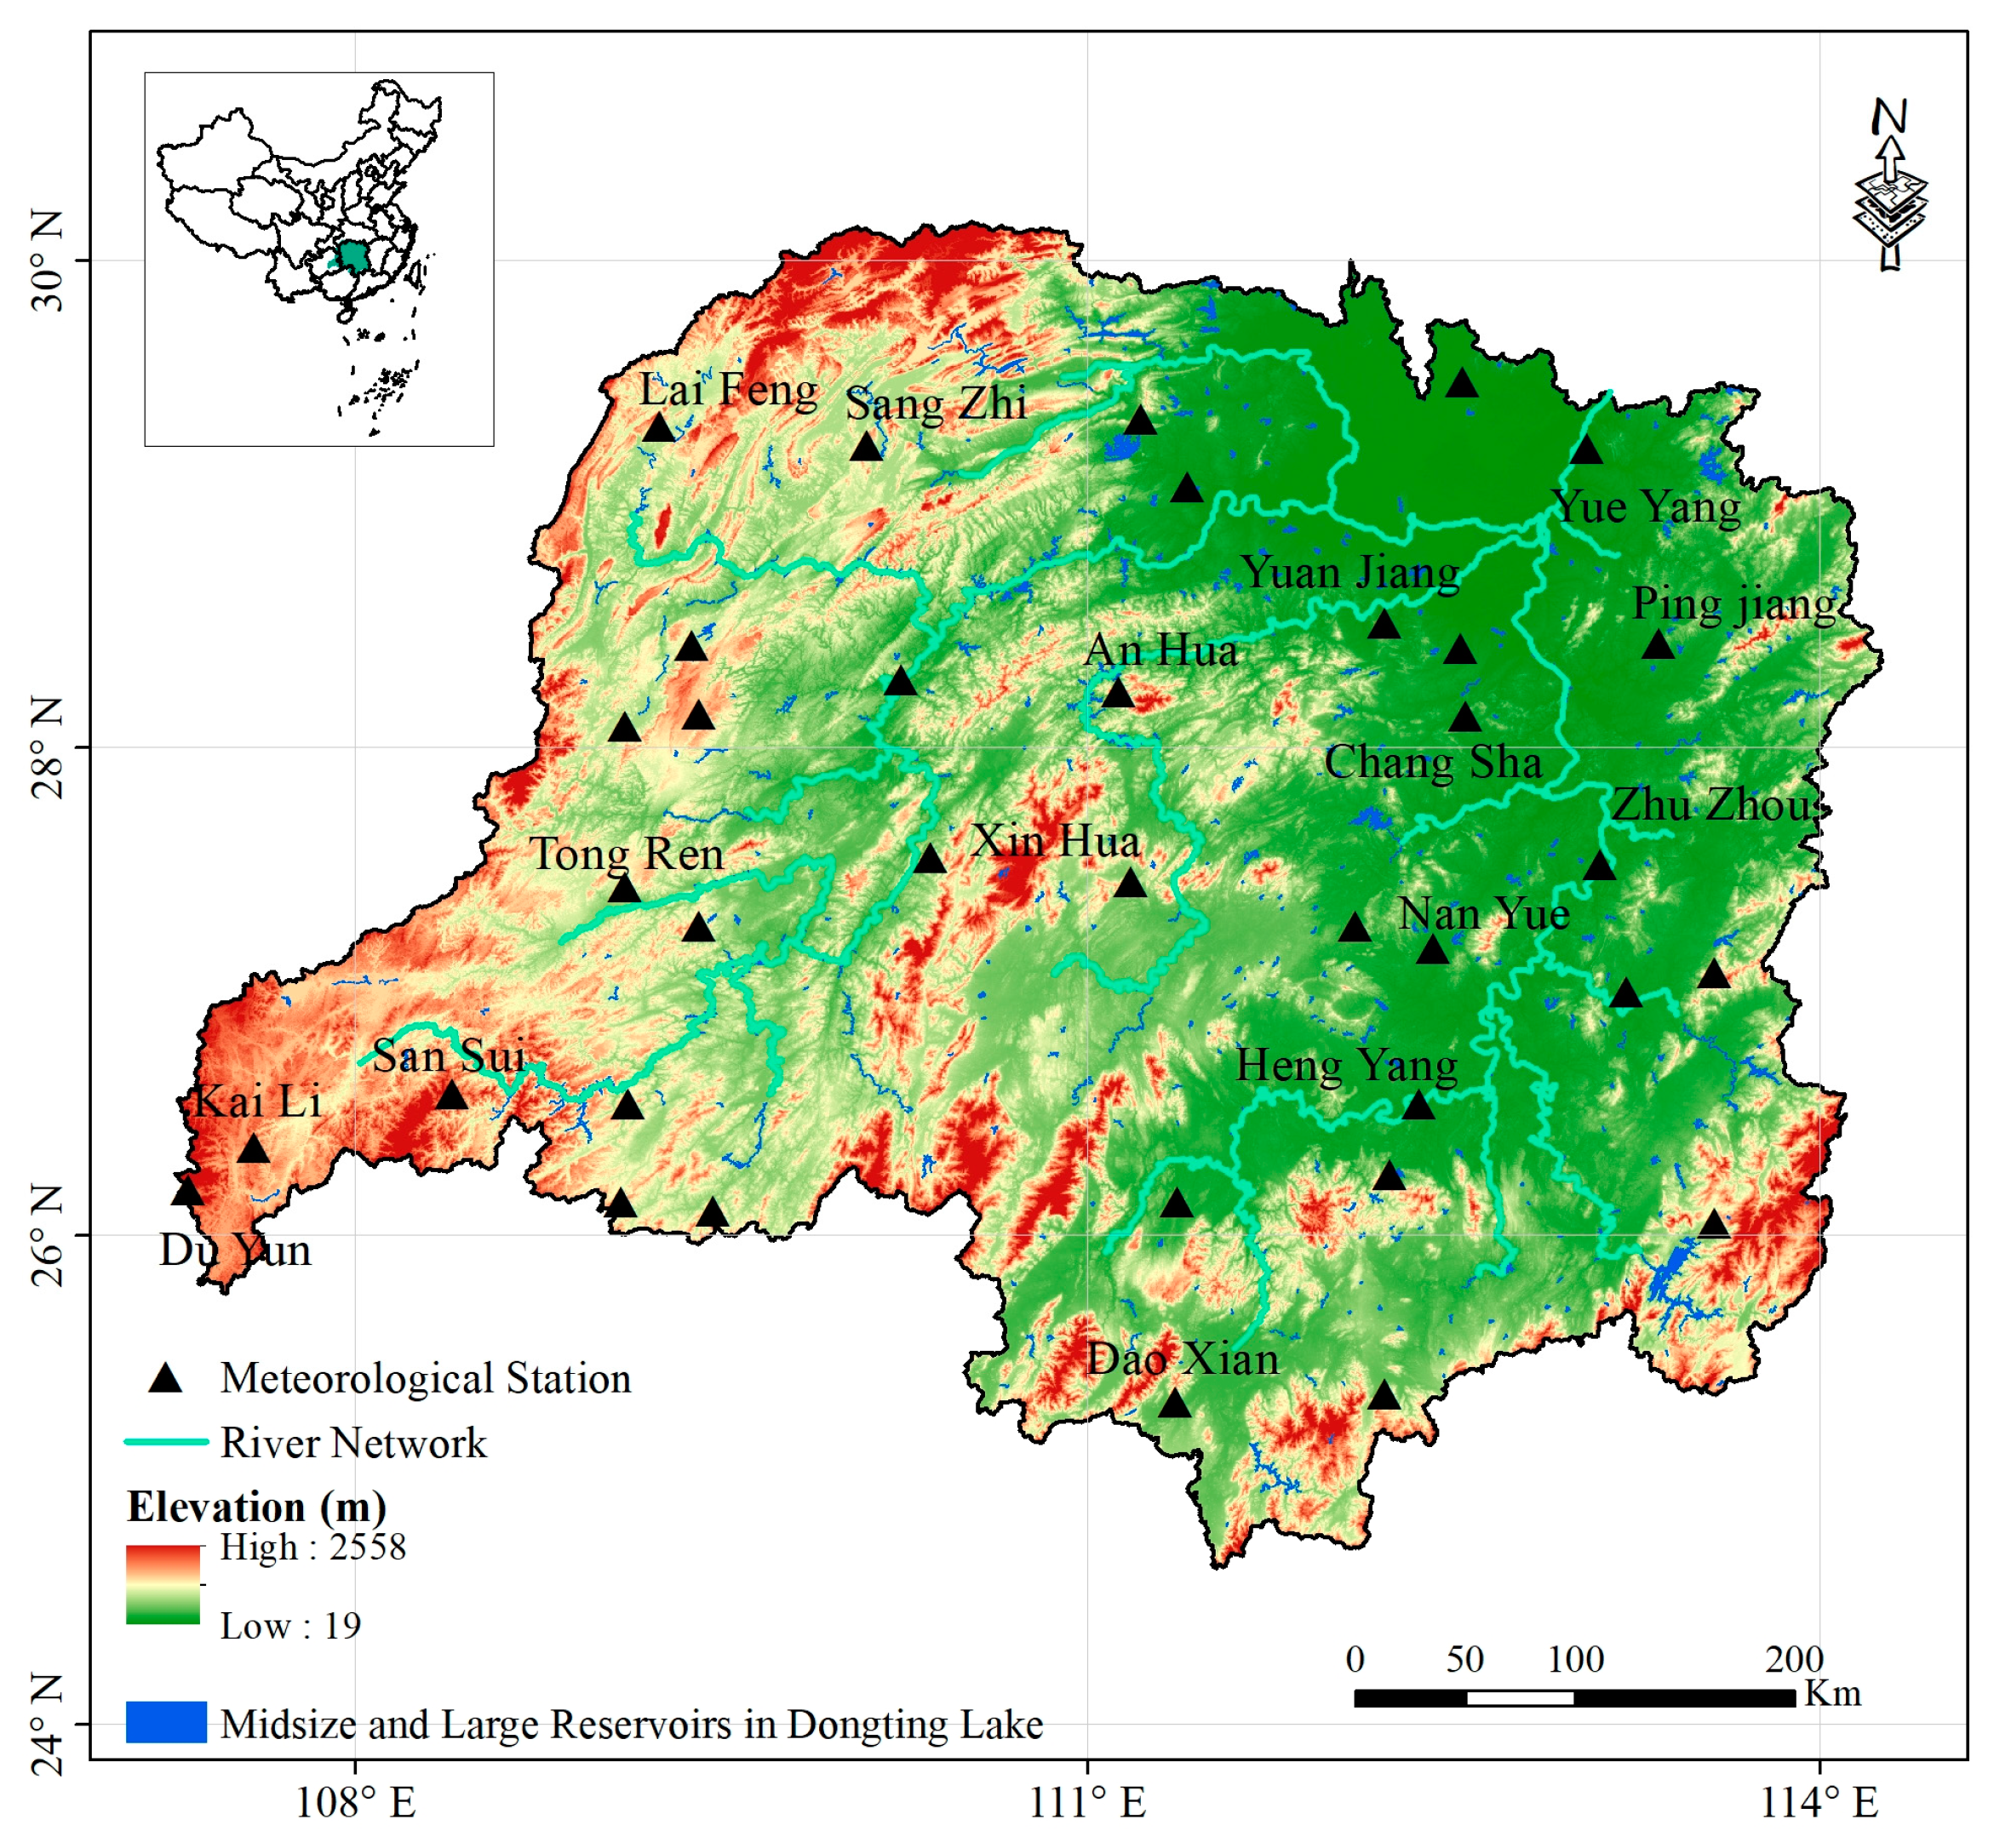
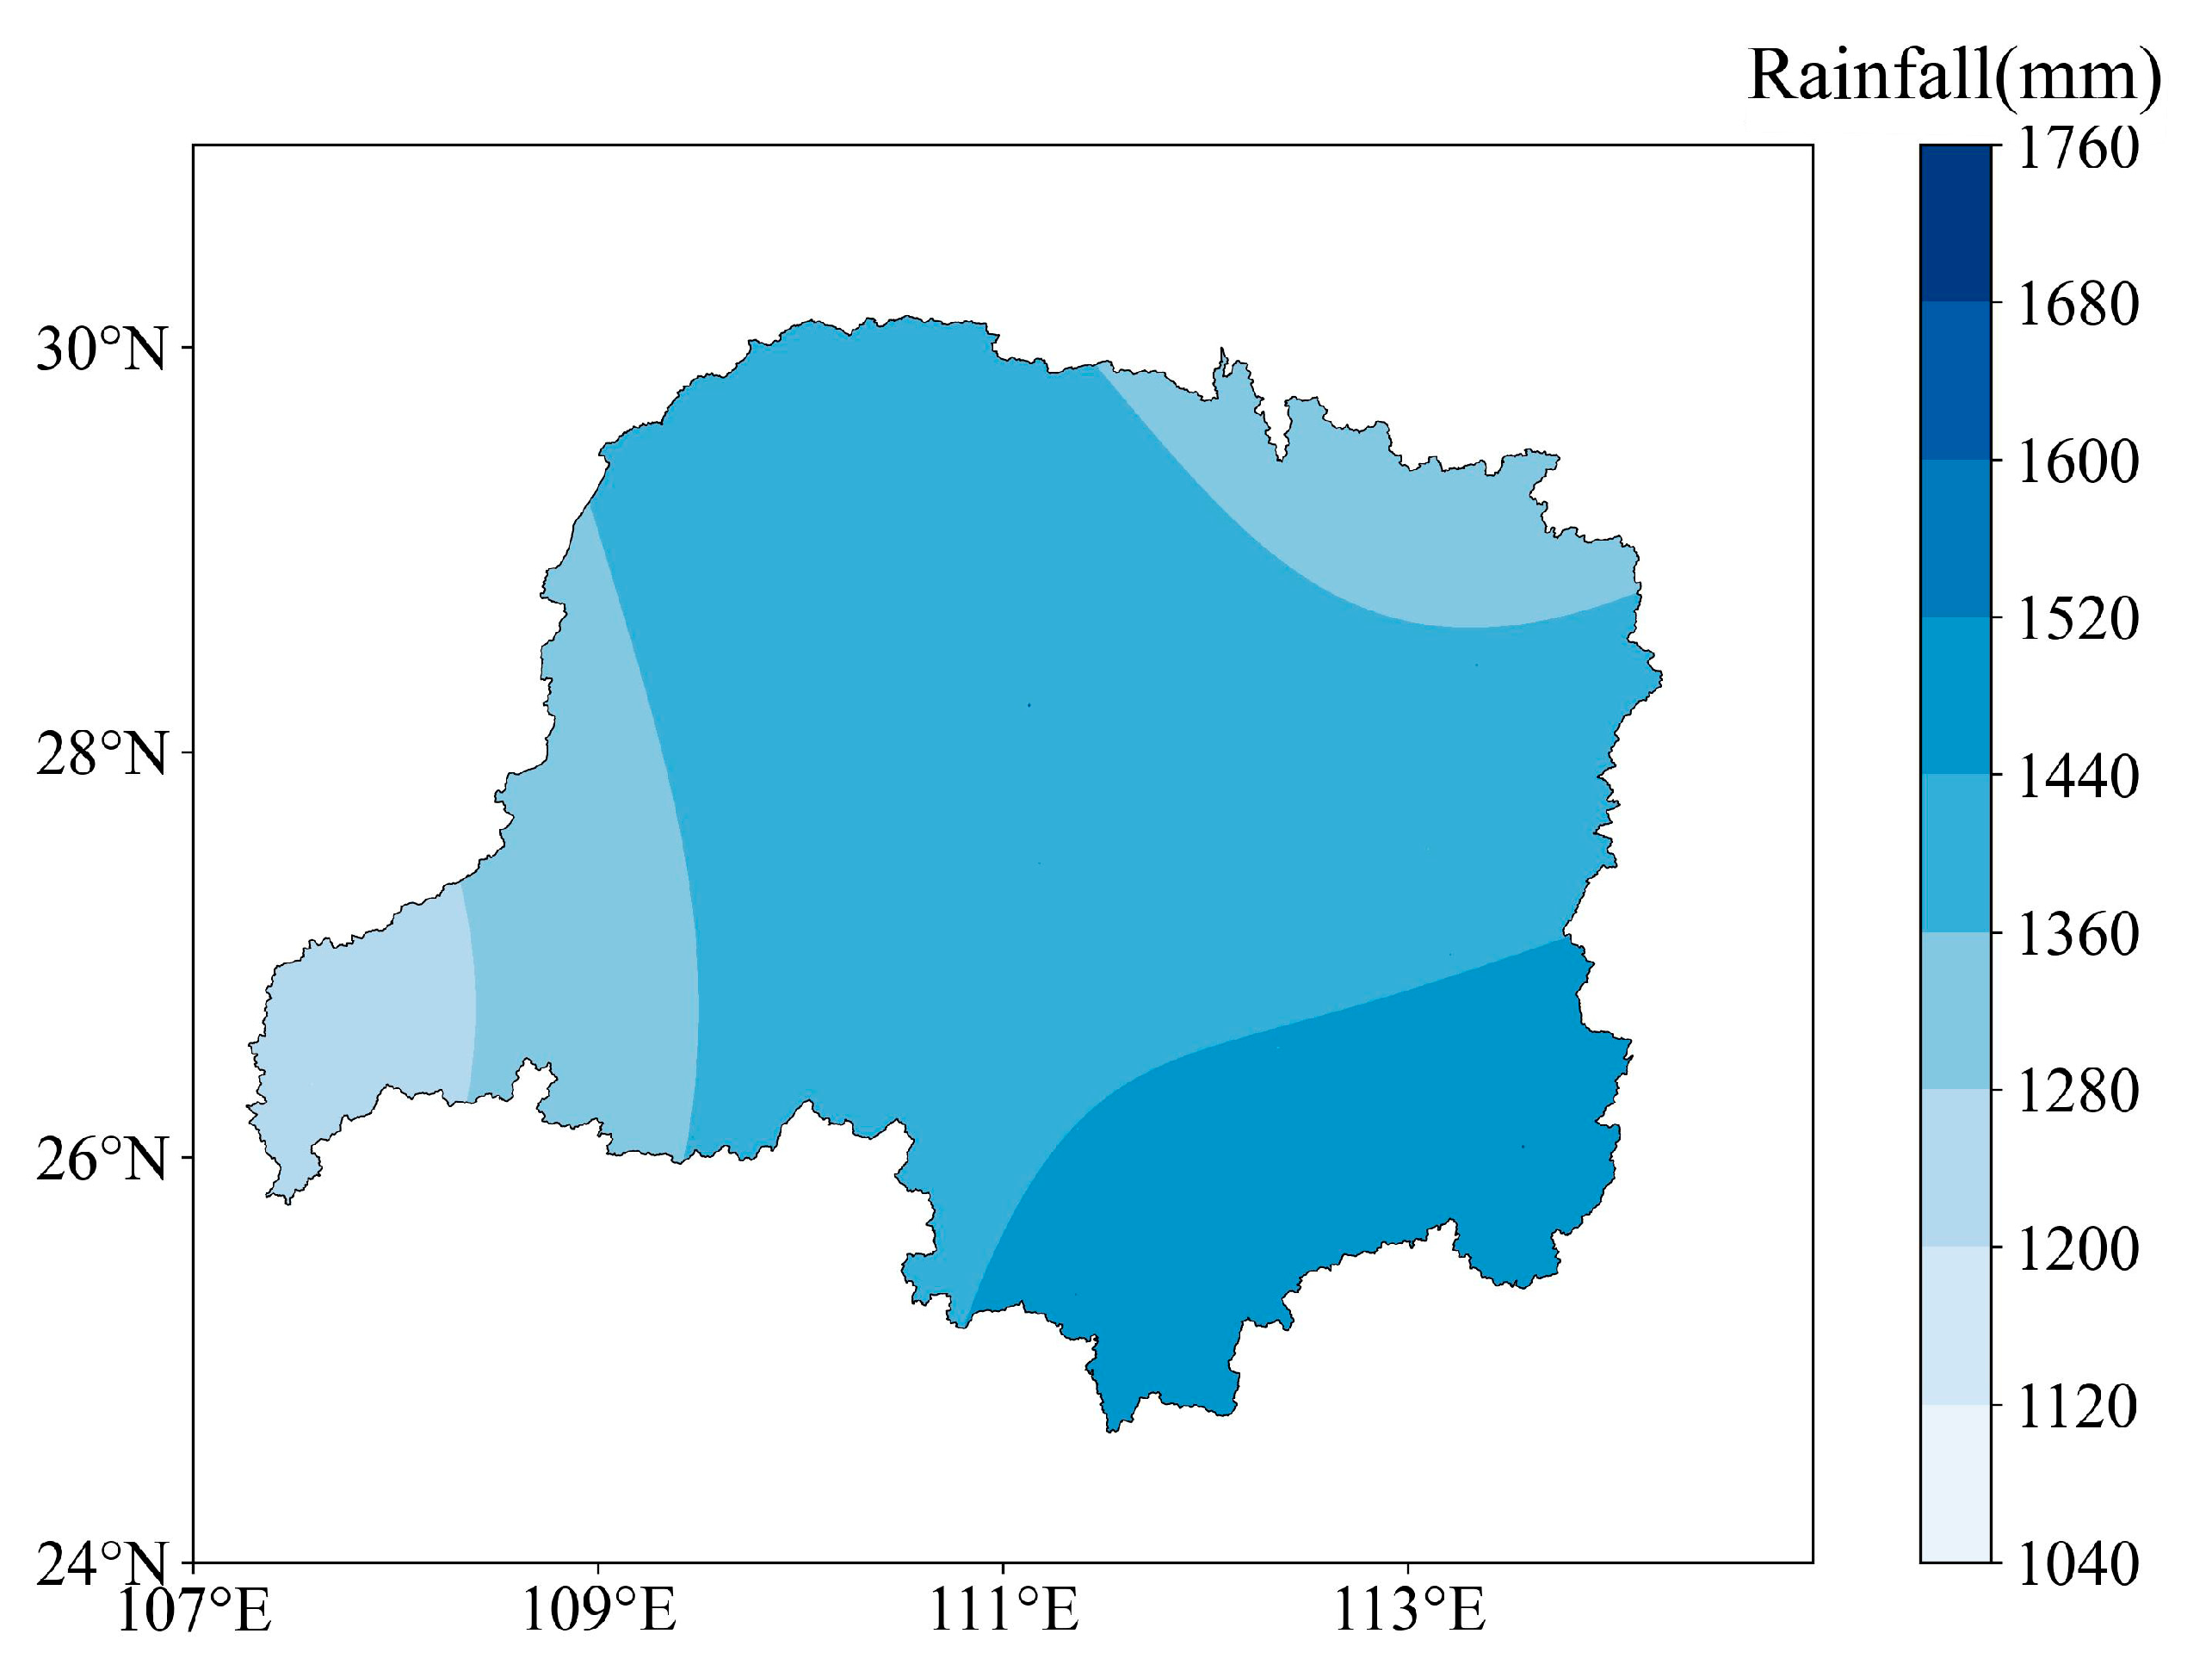
2.1. Study Area
2.2. Data Source and Processing
2.3. Methods
2.3.1. Non-Parametric Mann–Kendall (MK) Test
2.3.2. Modified Mann–Kendall (MMK) Test
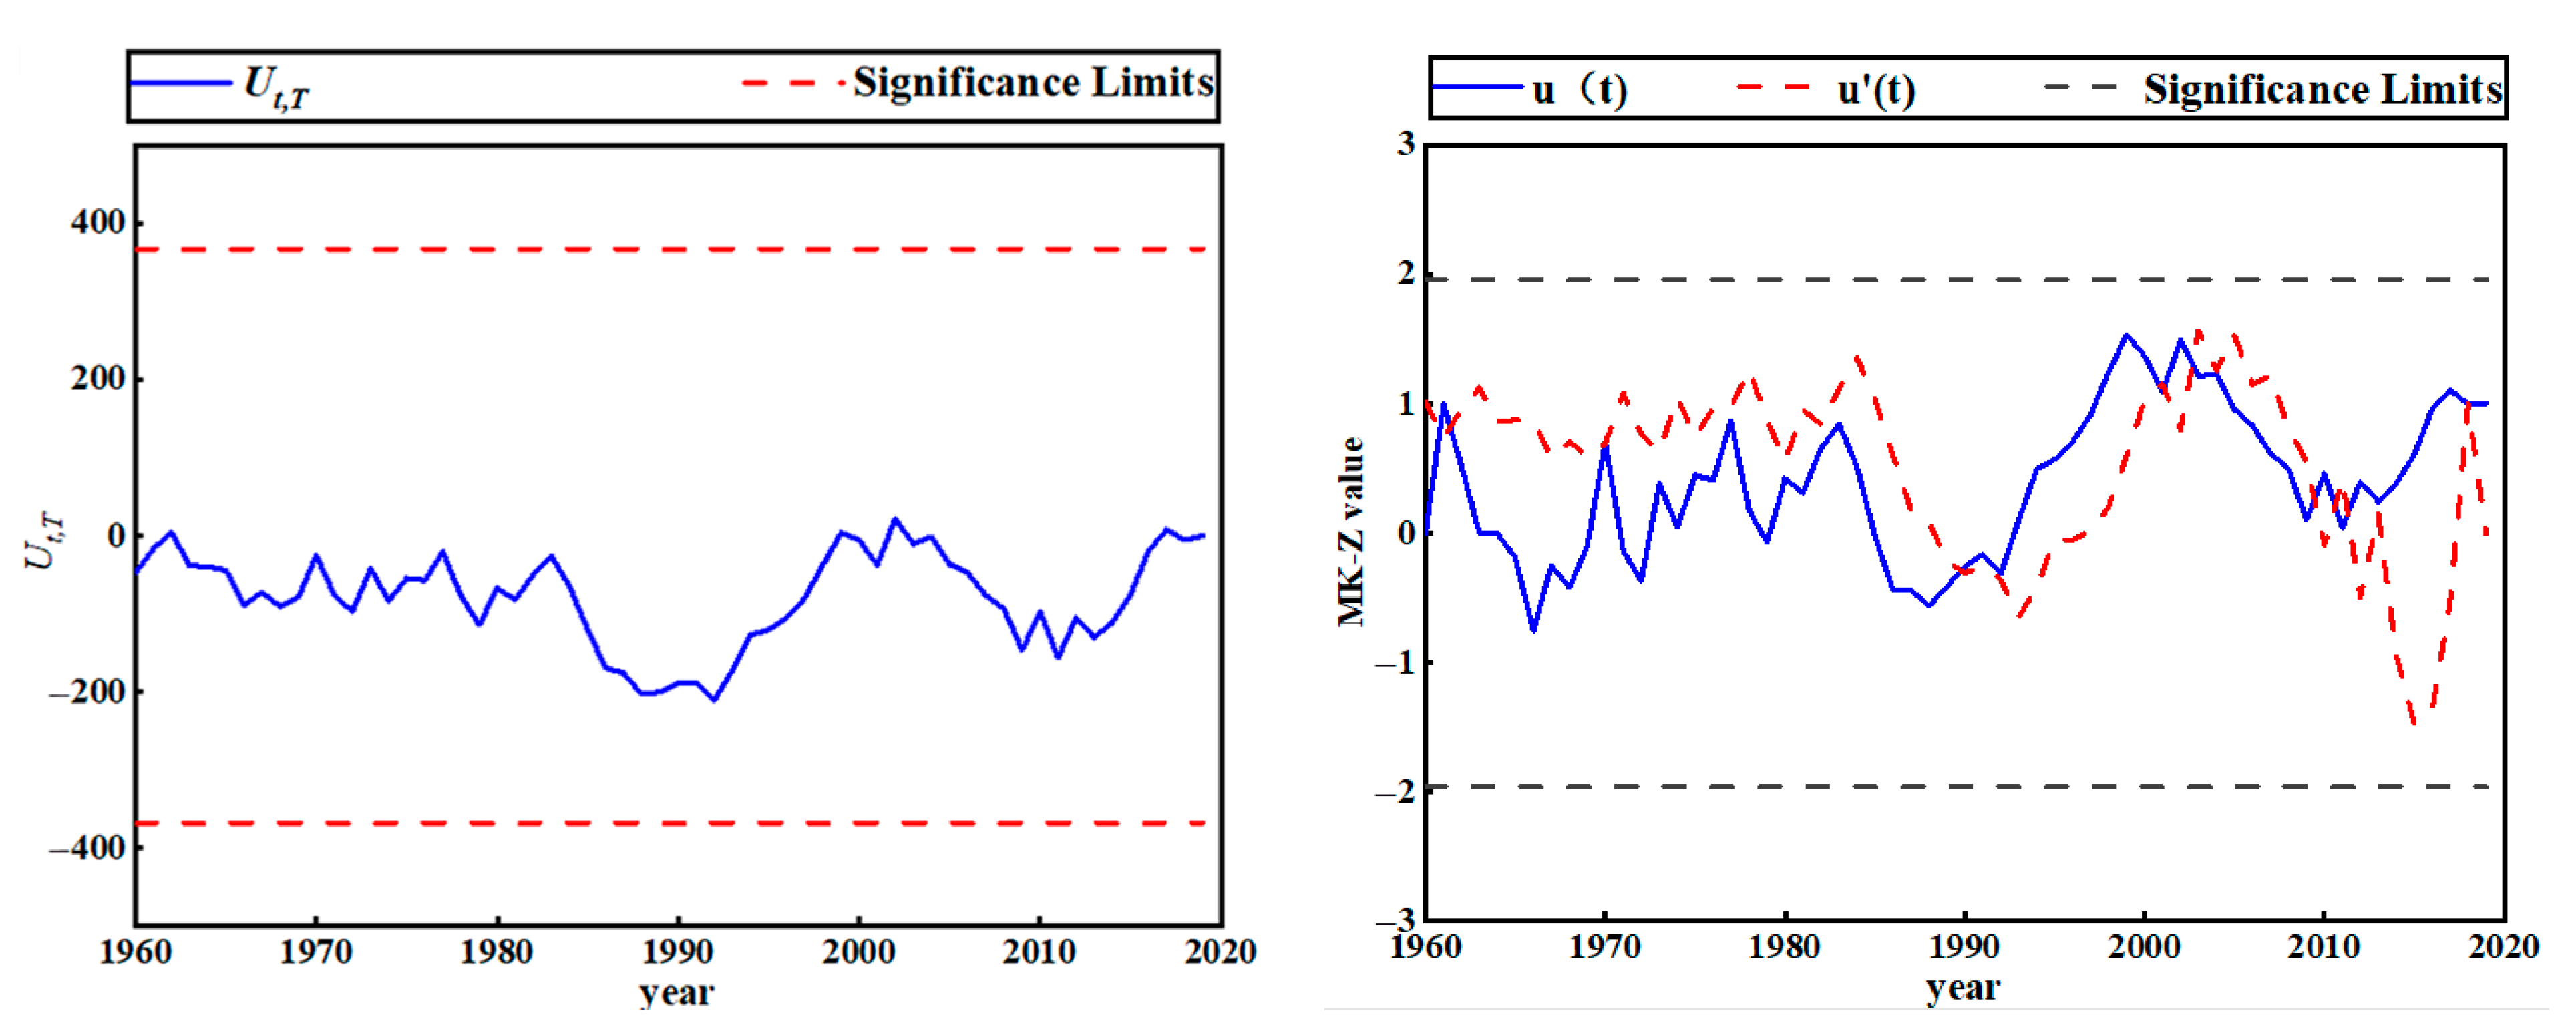
2.3.3. Non-Parametric Pettitt Test
2.3.4. Sen’s Slope (SS) Test
2.3.5. Wavelet Analysis
- (1)
- The Continuous Wavelet Transform (CWT)
- (2)
- The Cross-Wavelet Transform (XWT)
2.3.6. Method of Spatial Interpolation
3. Results and Analysis
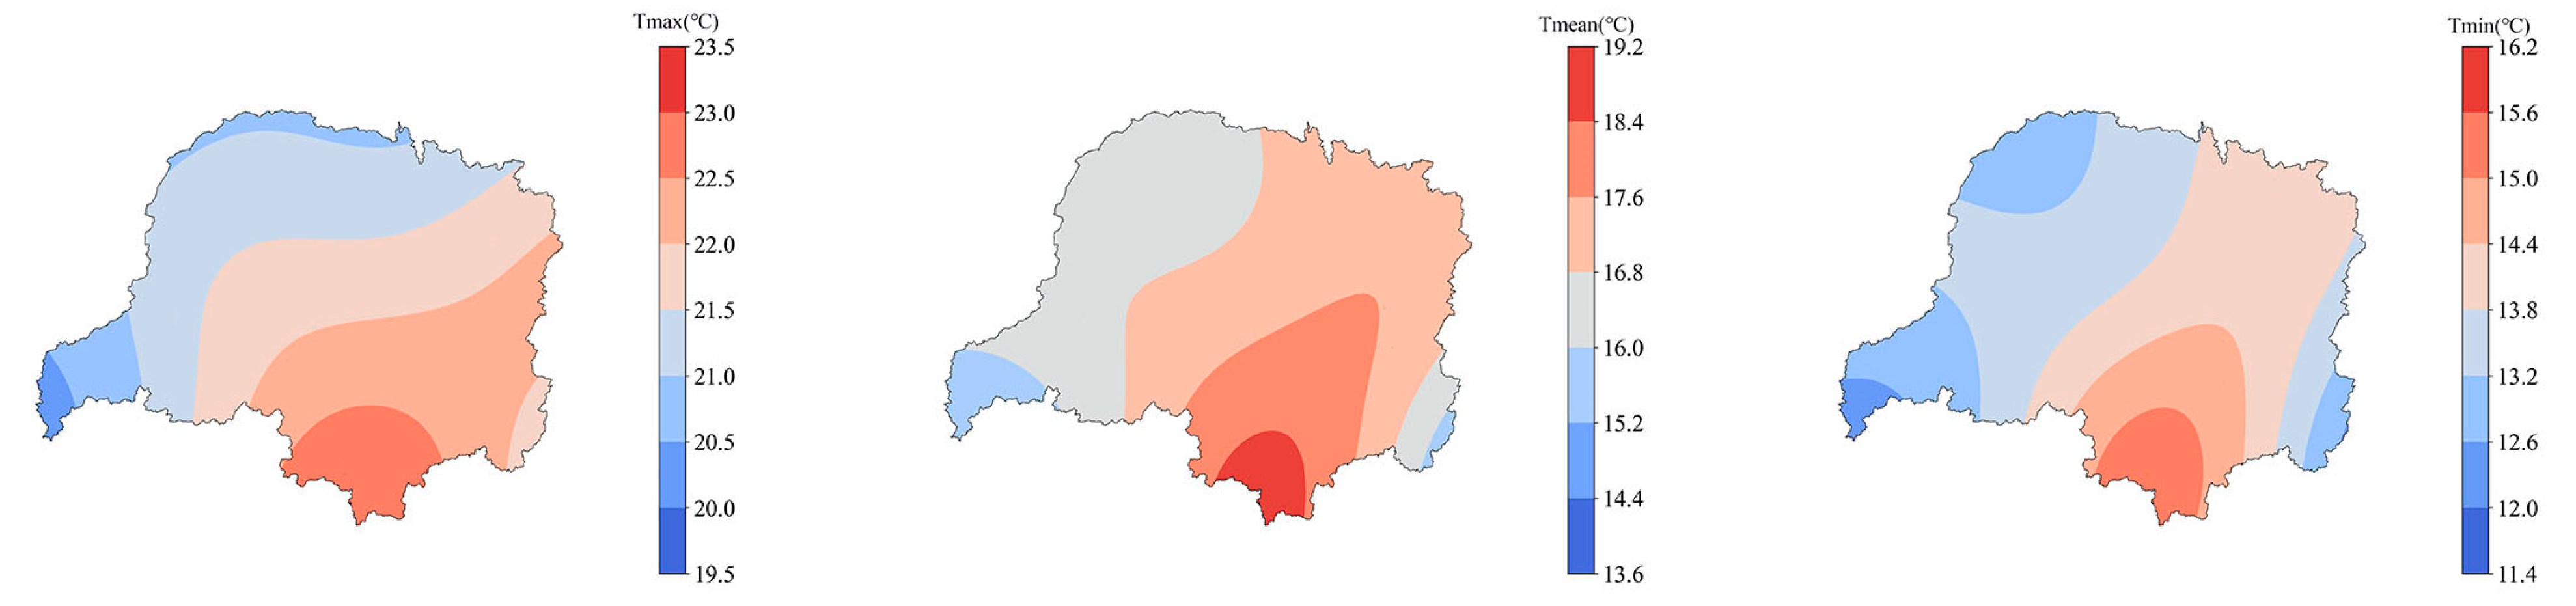
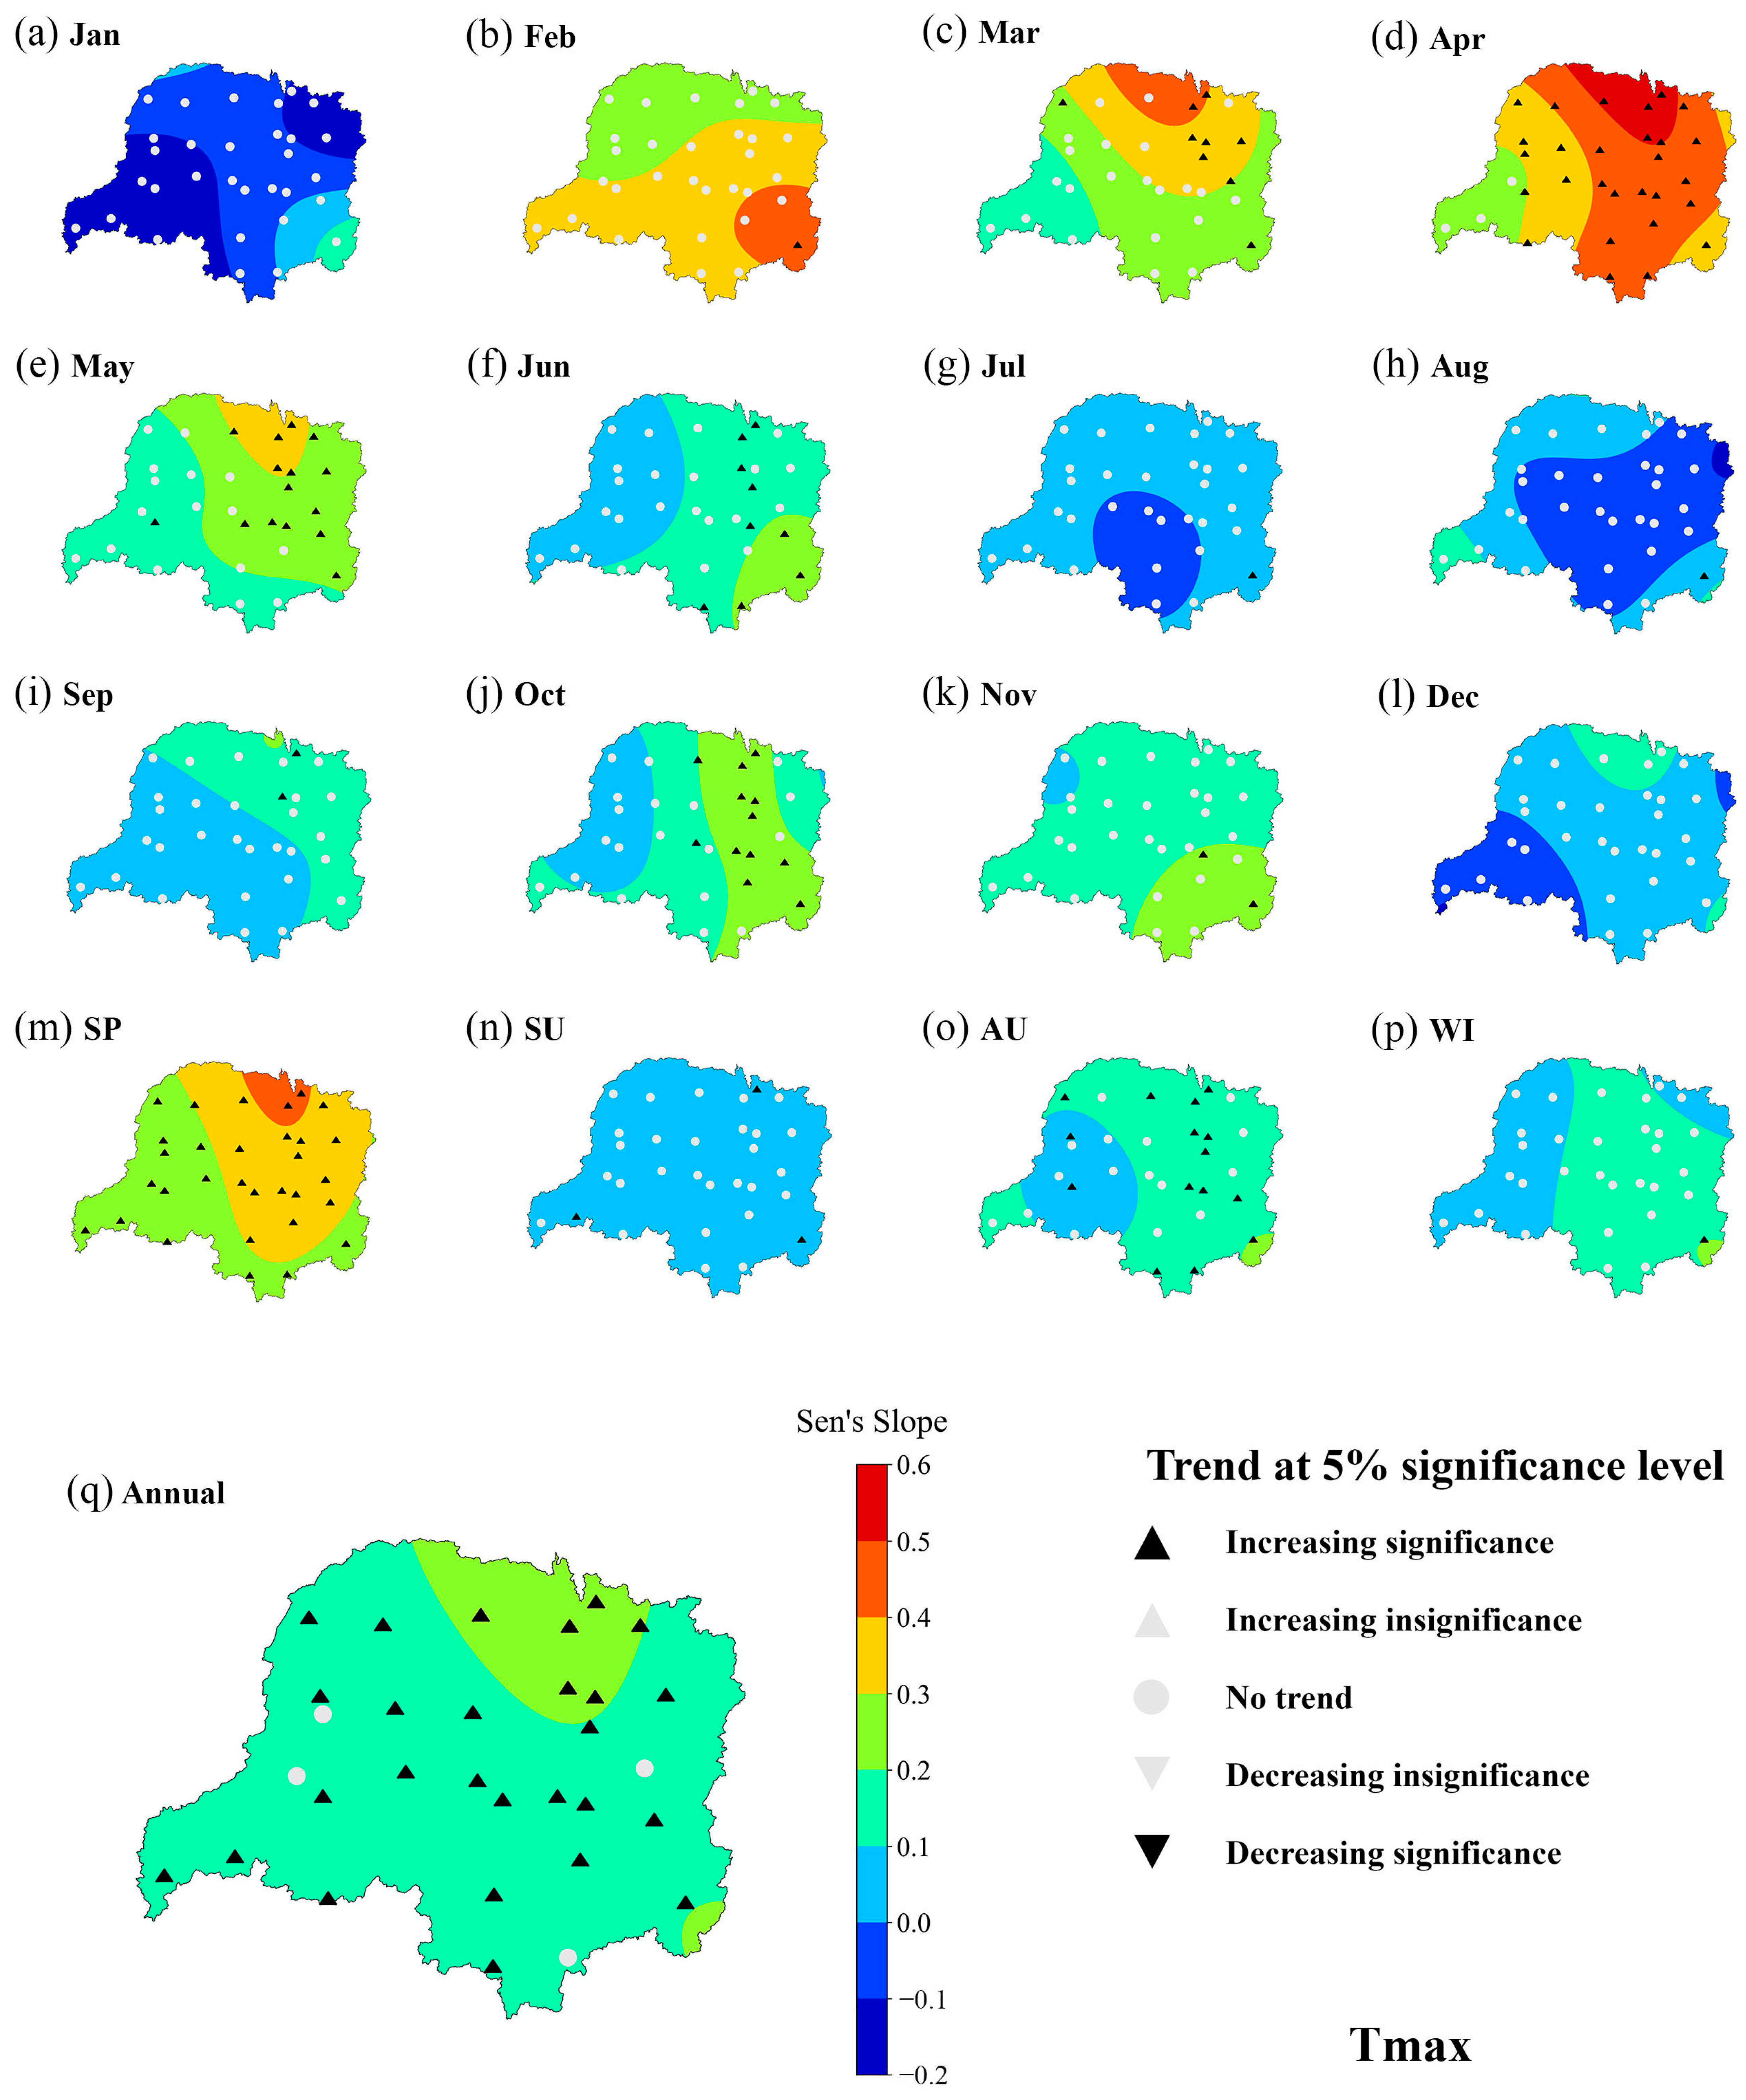
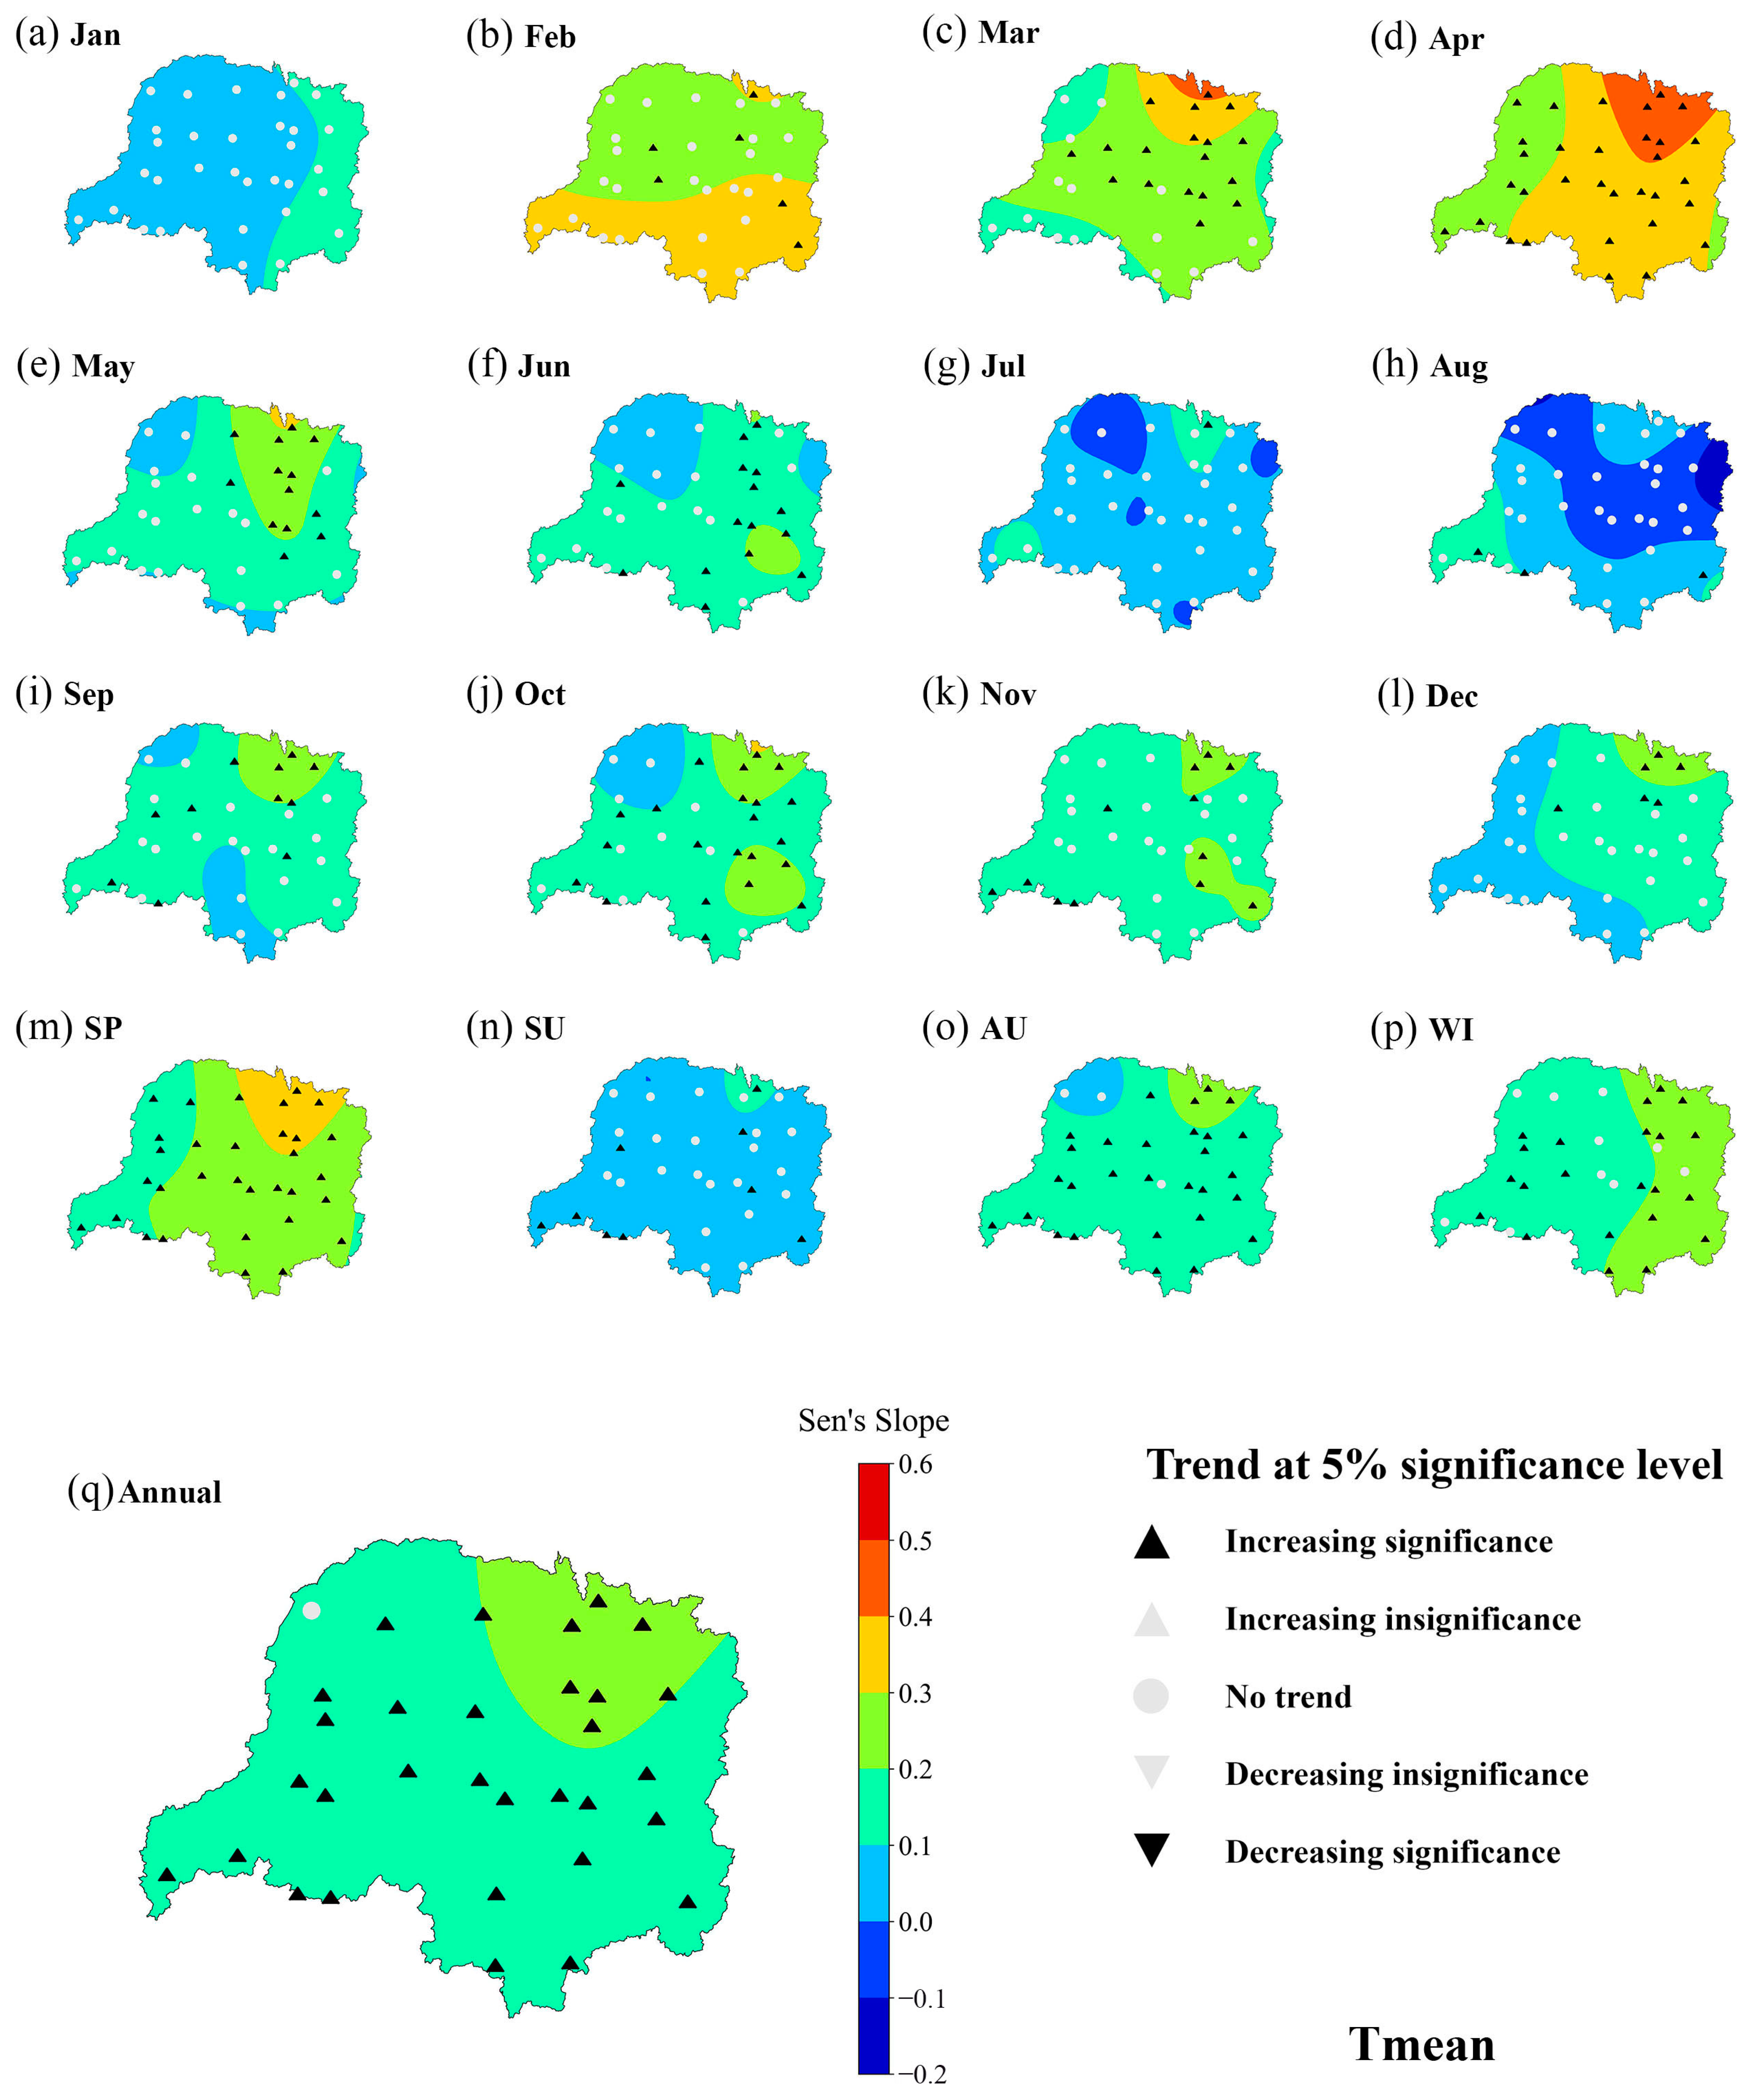
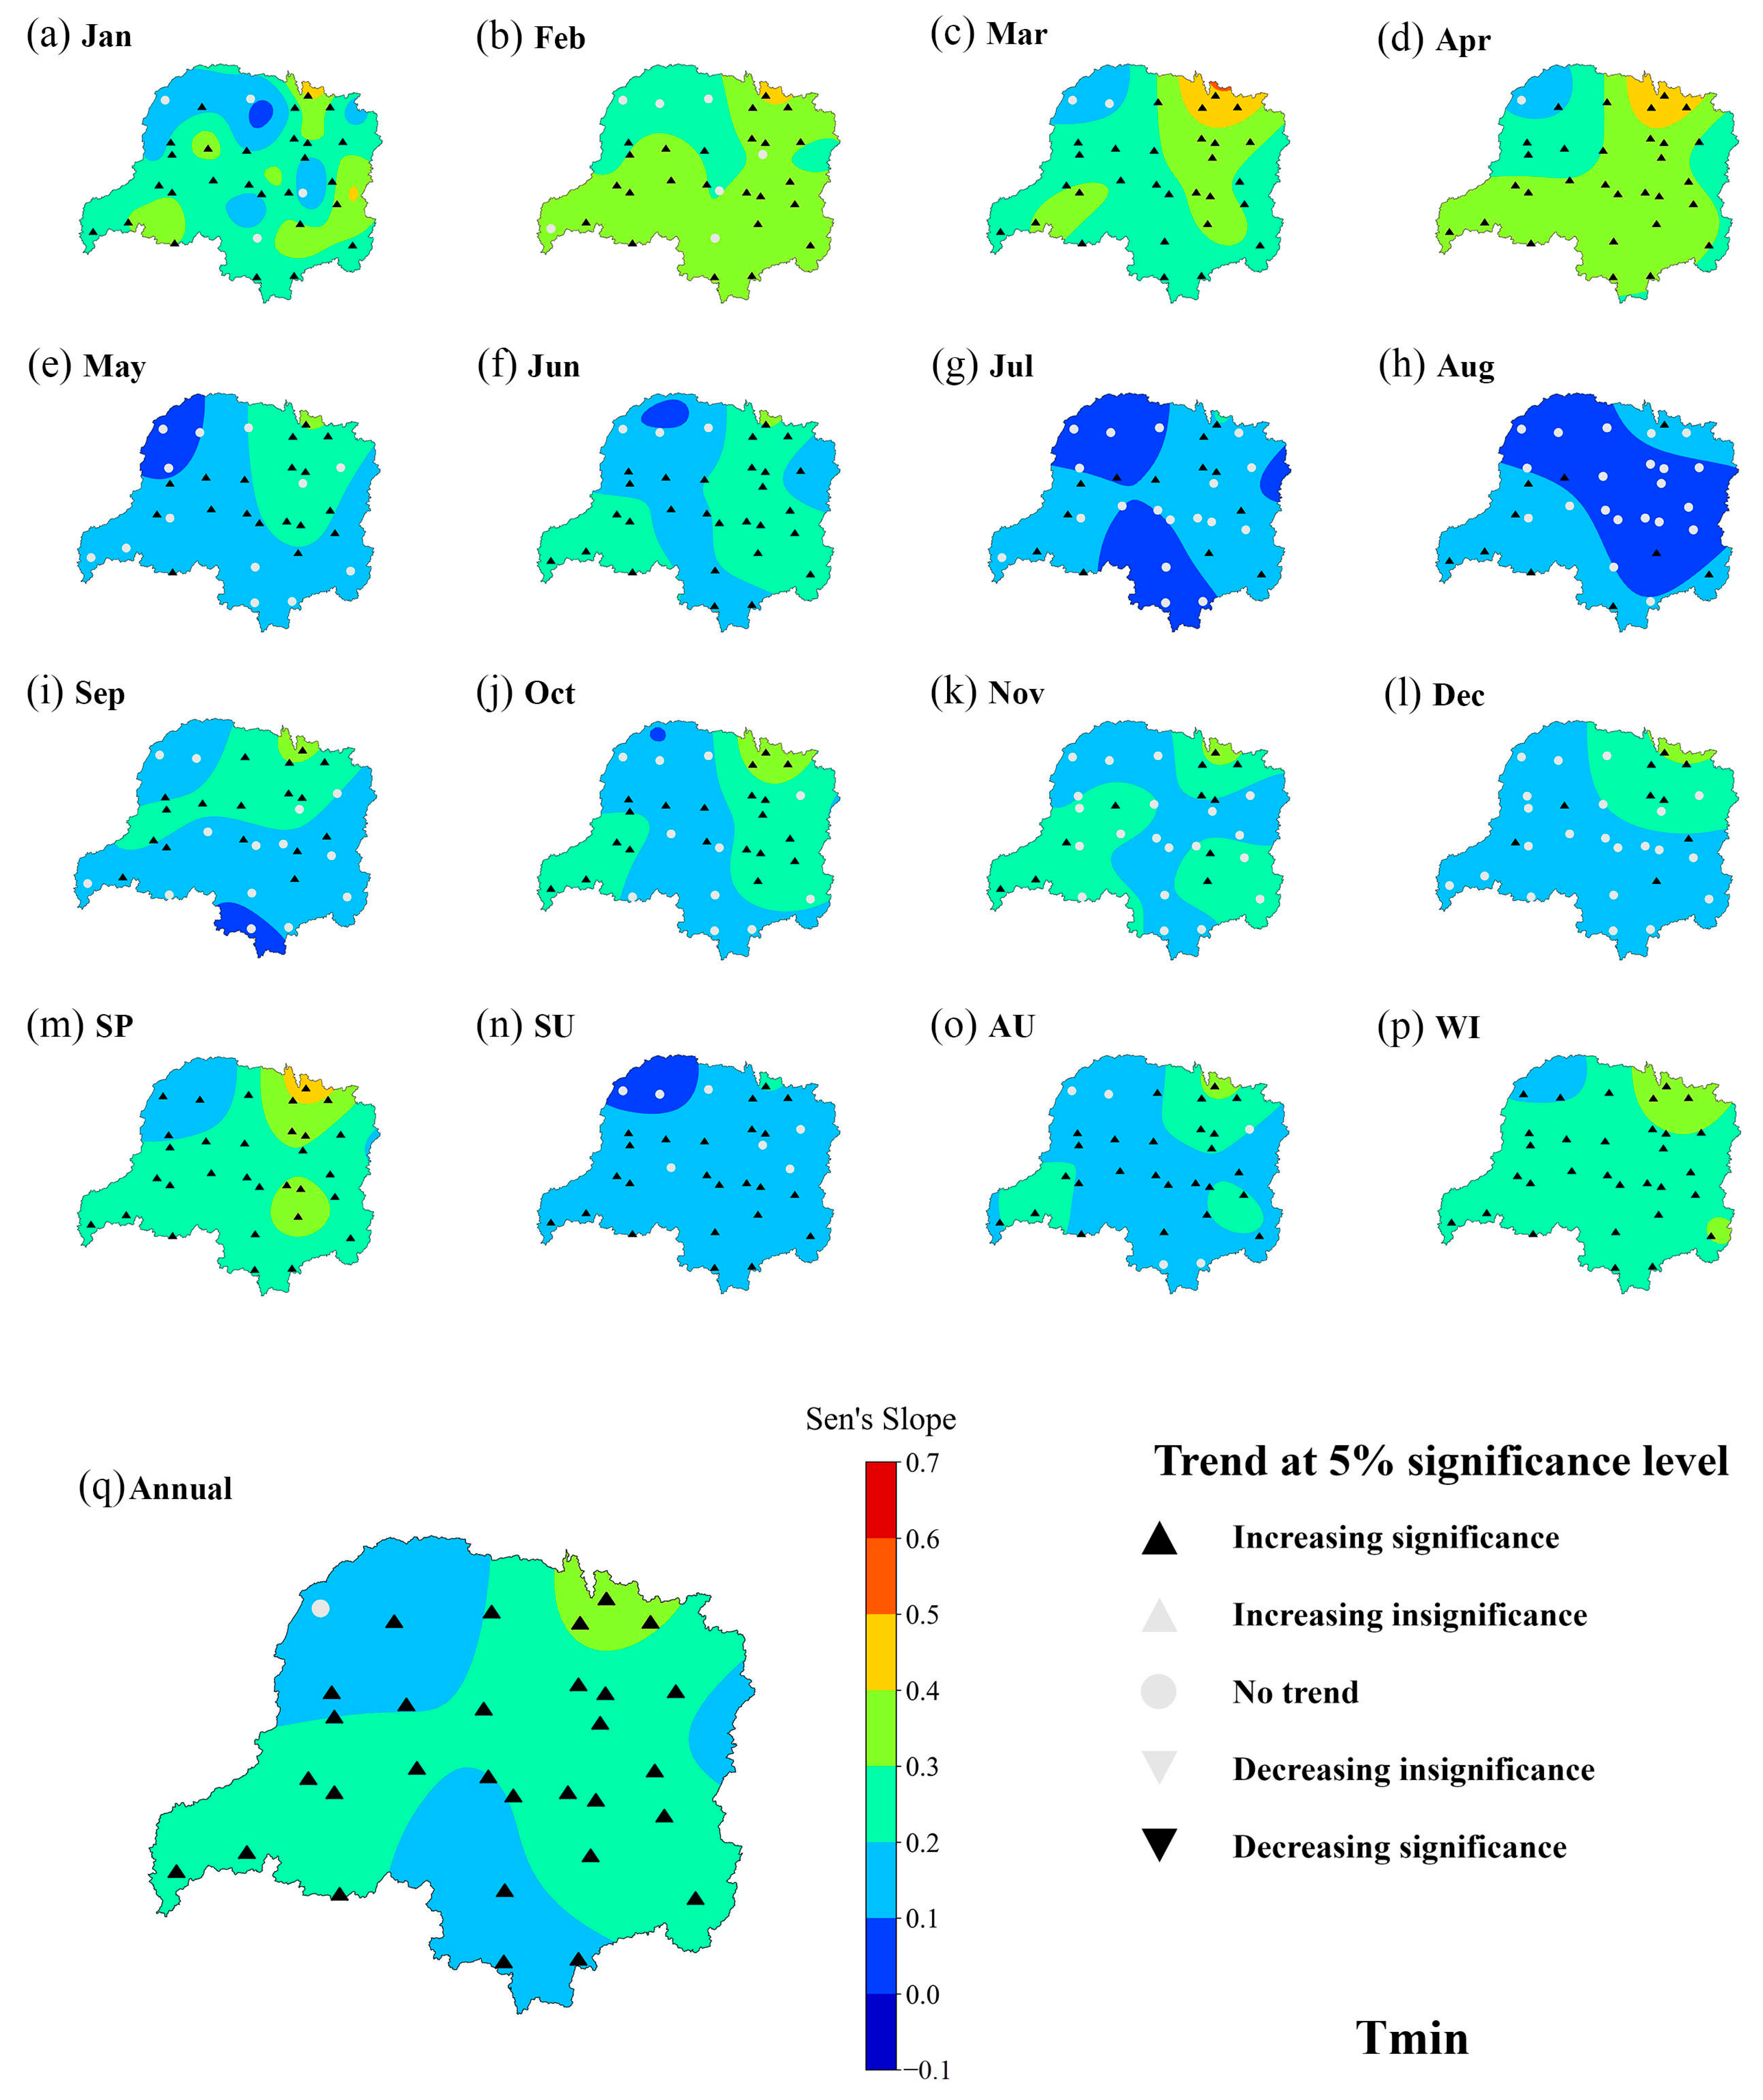
3.1. Temperature
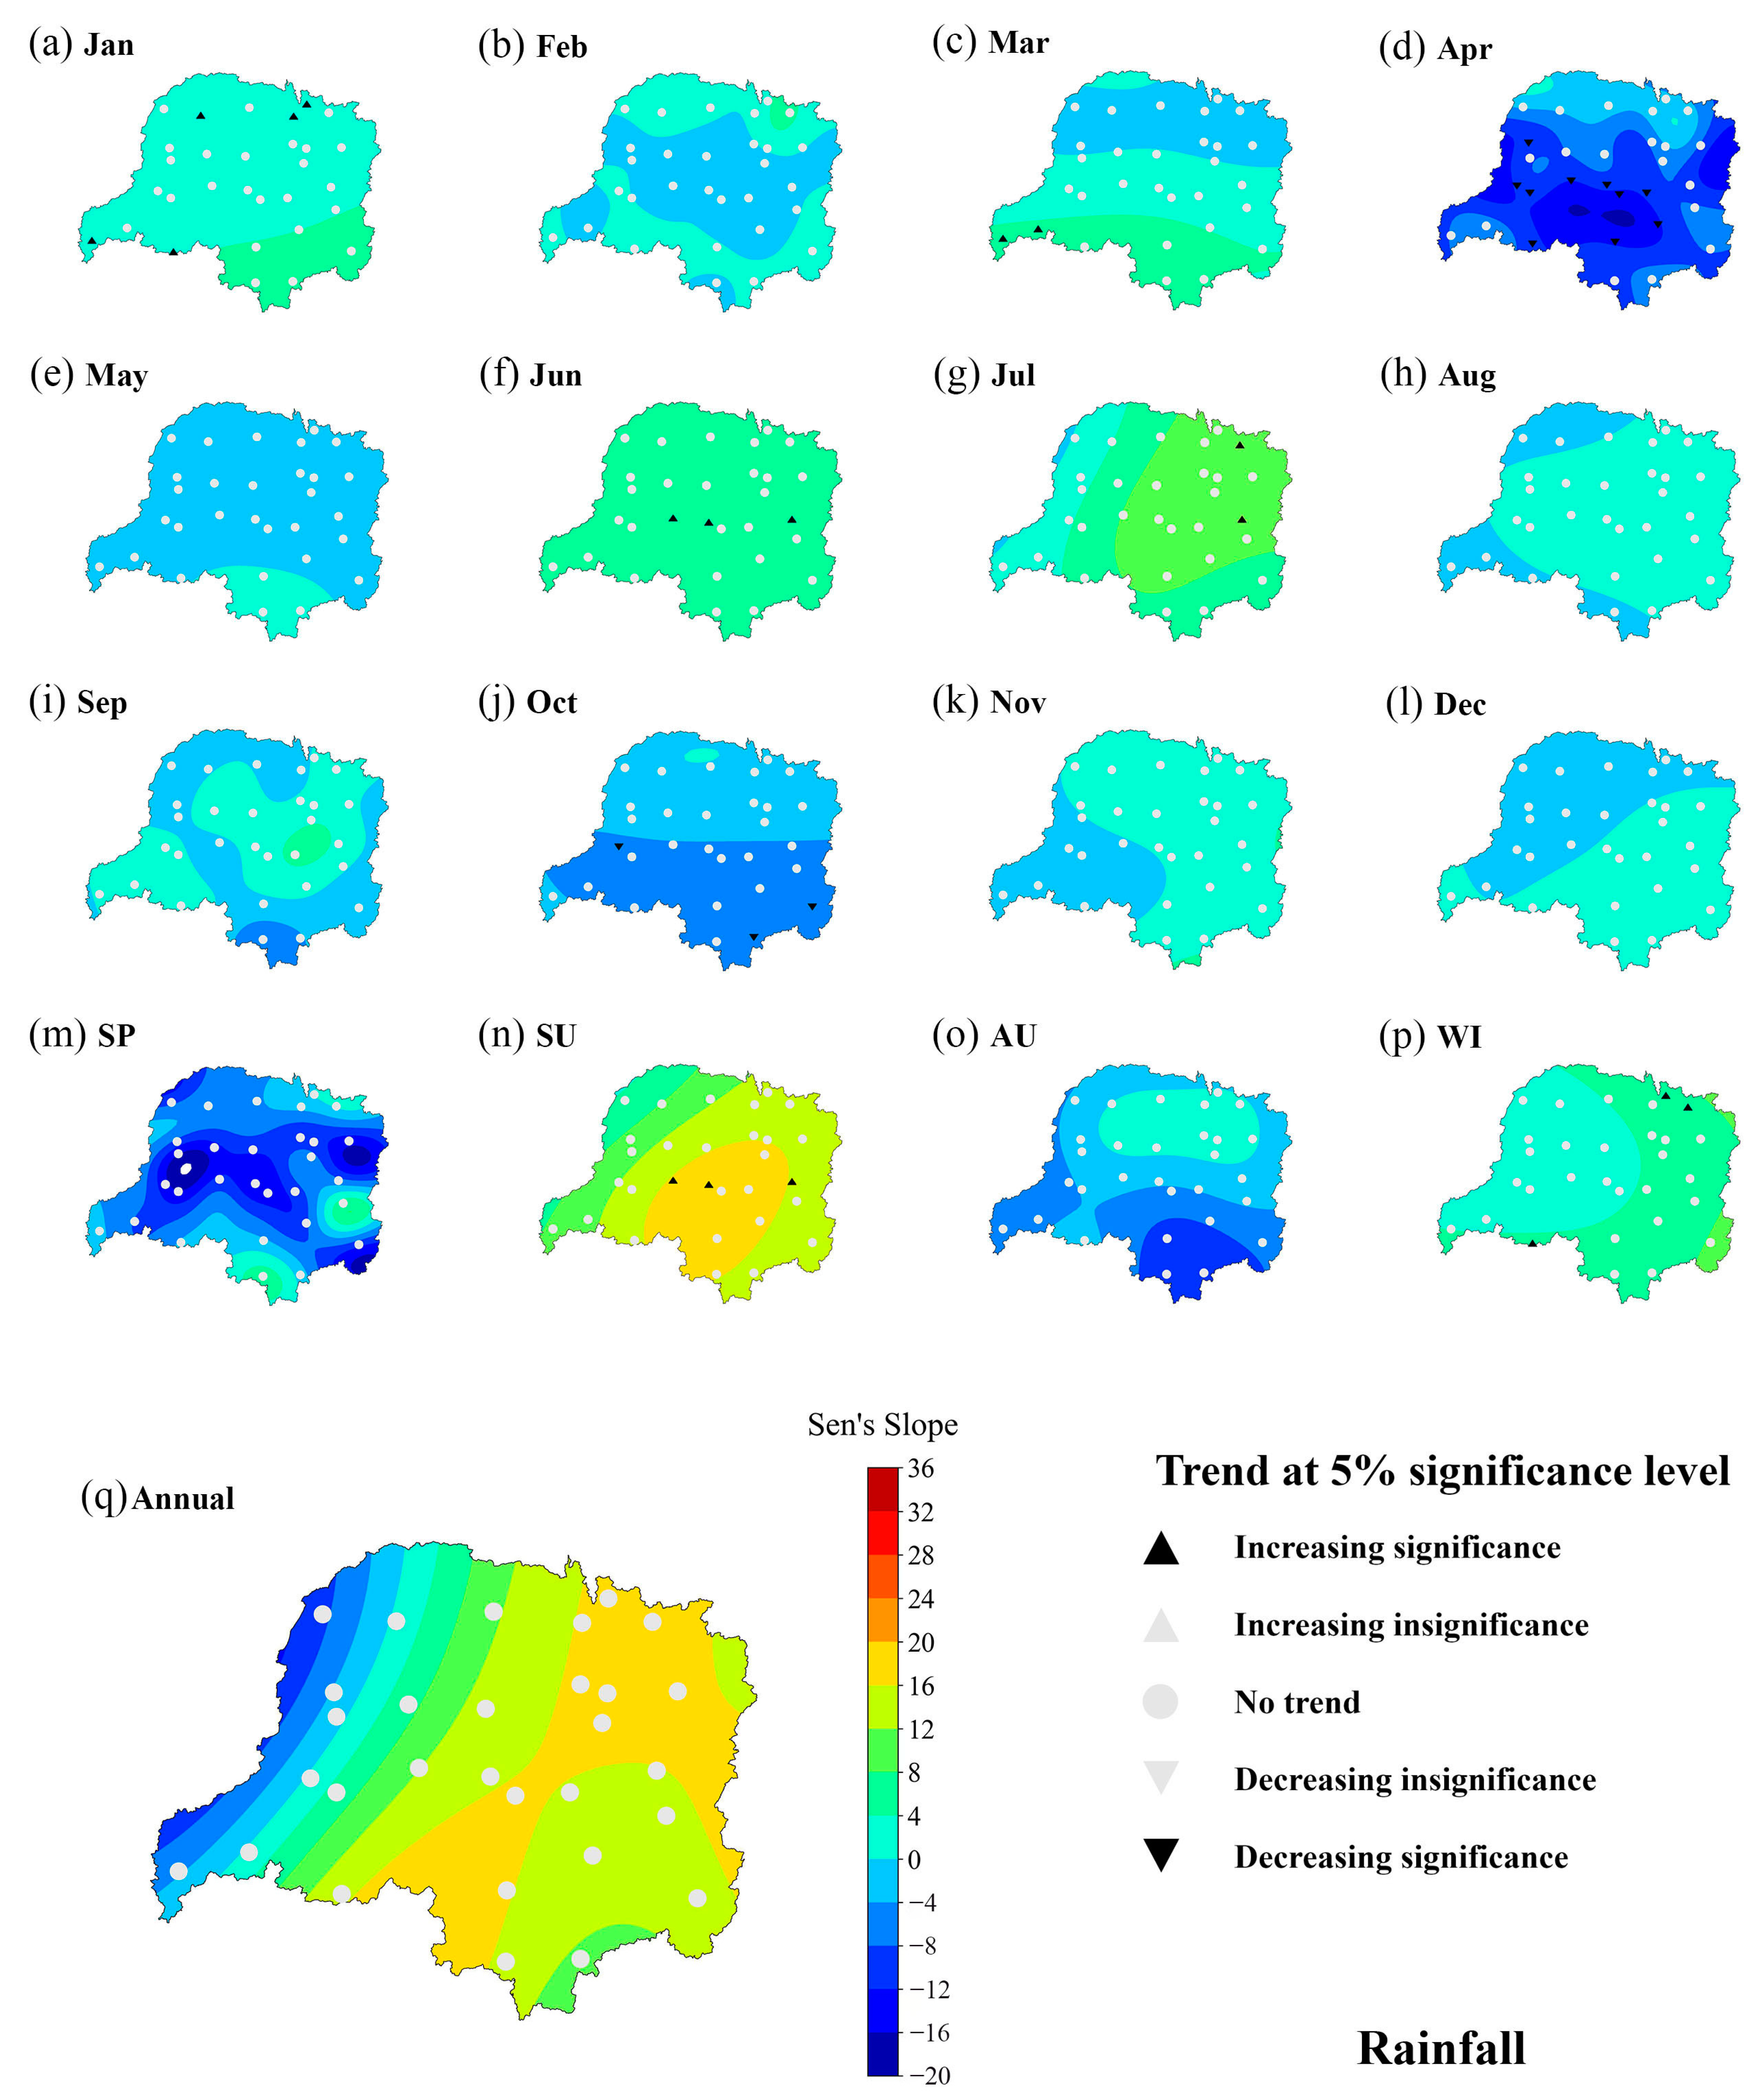
3.2. Rainfall
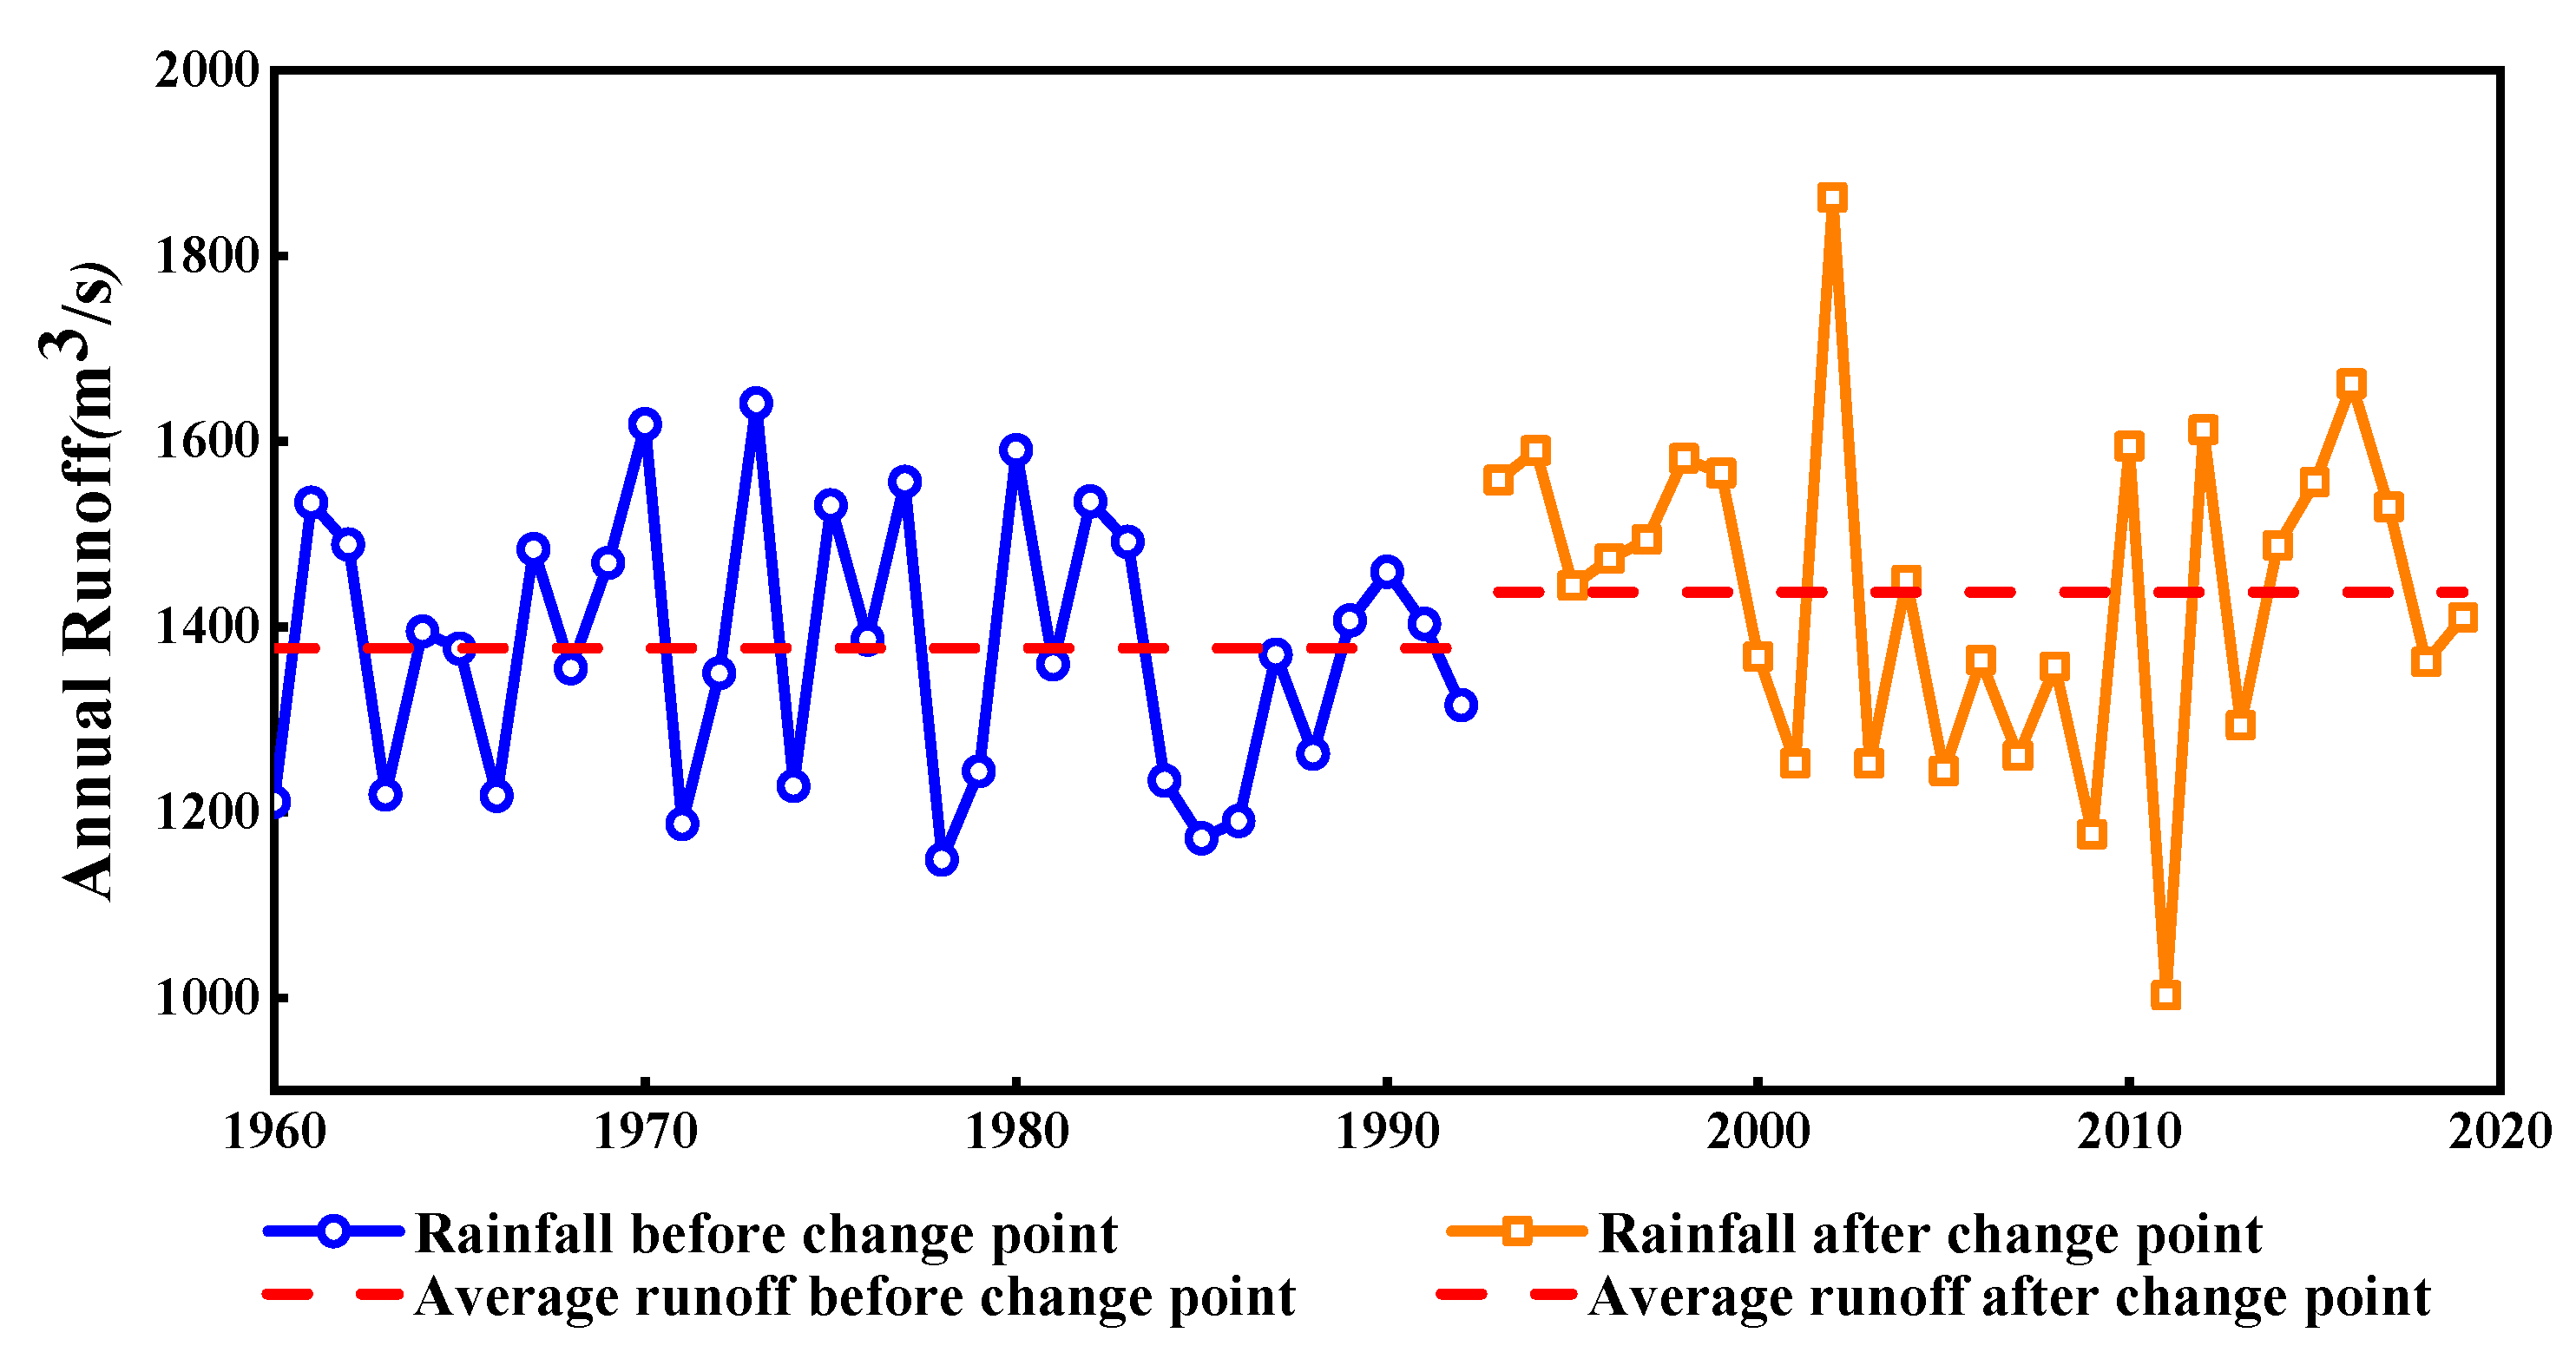
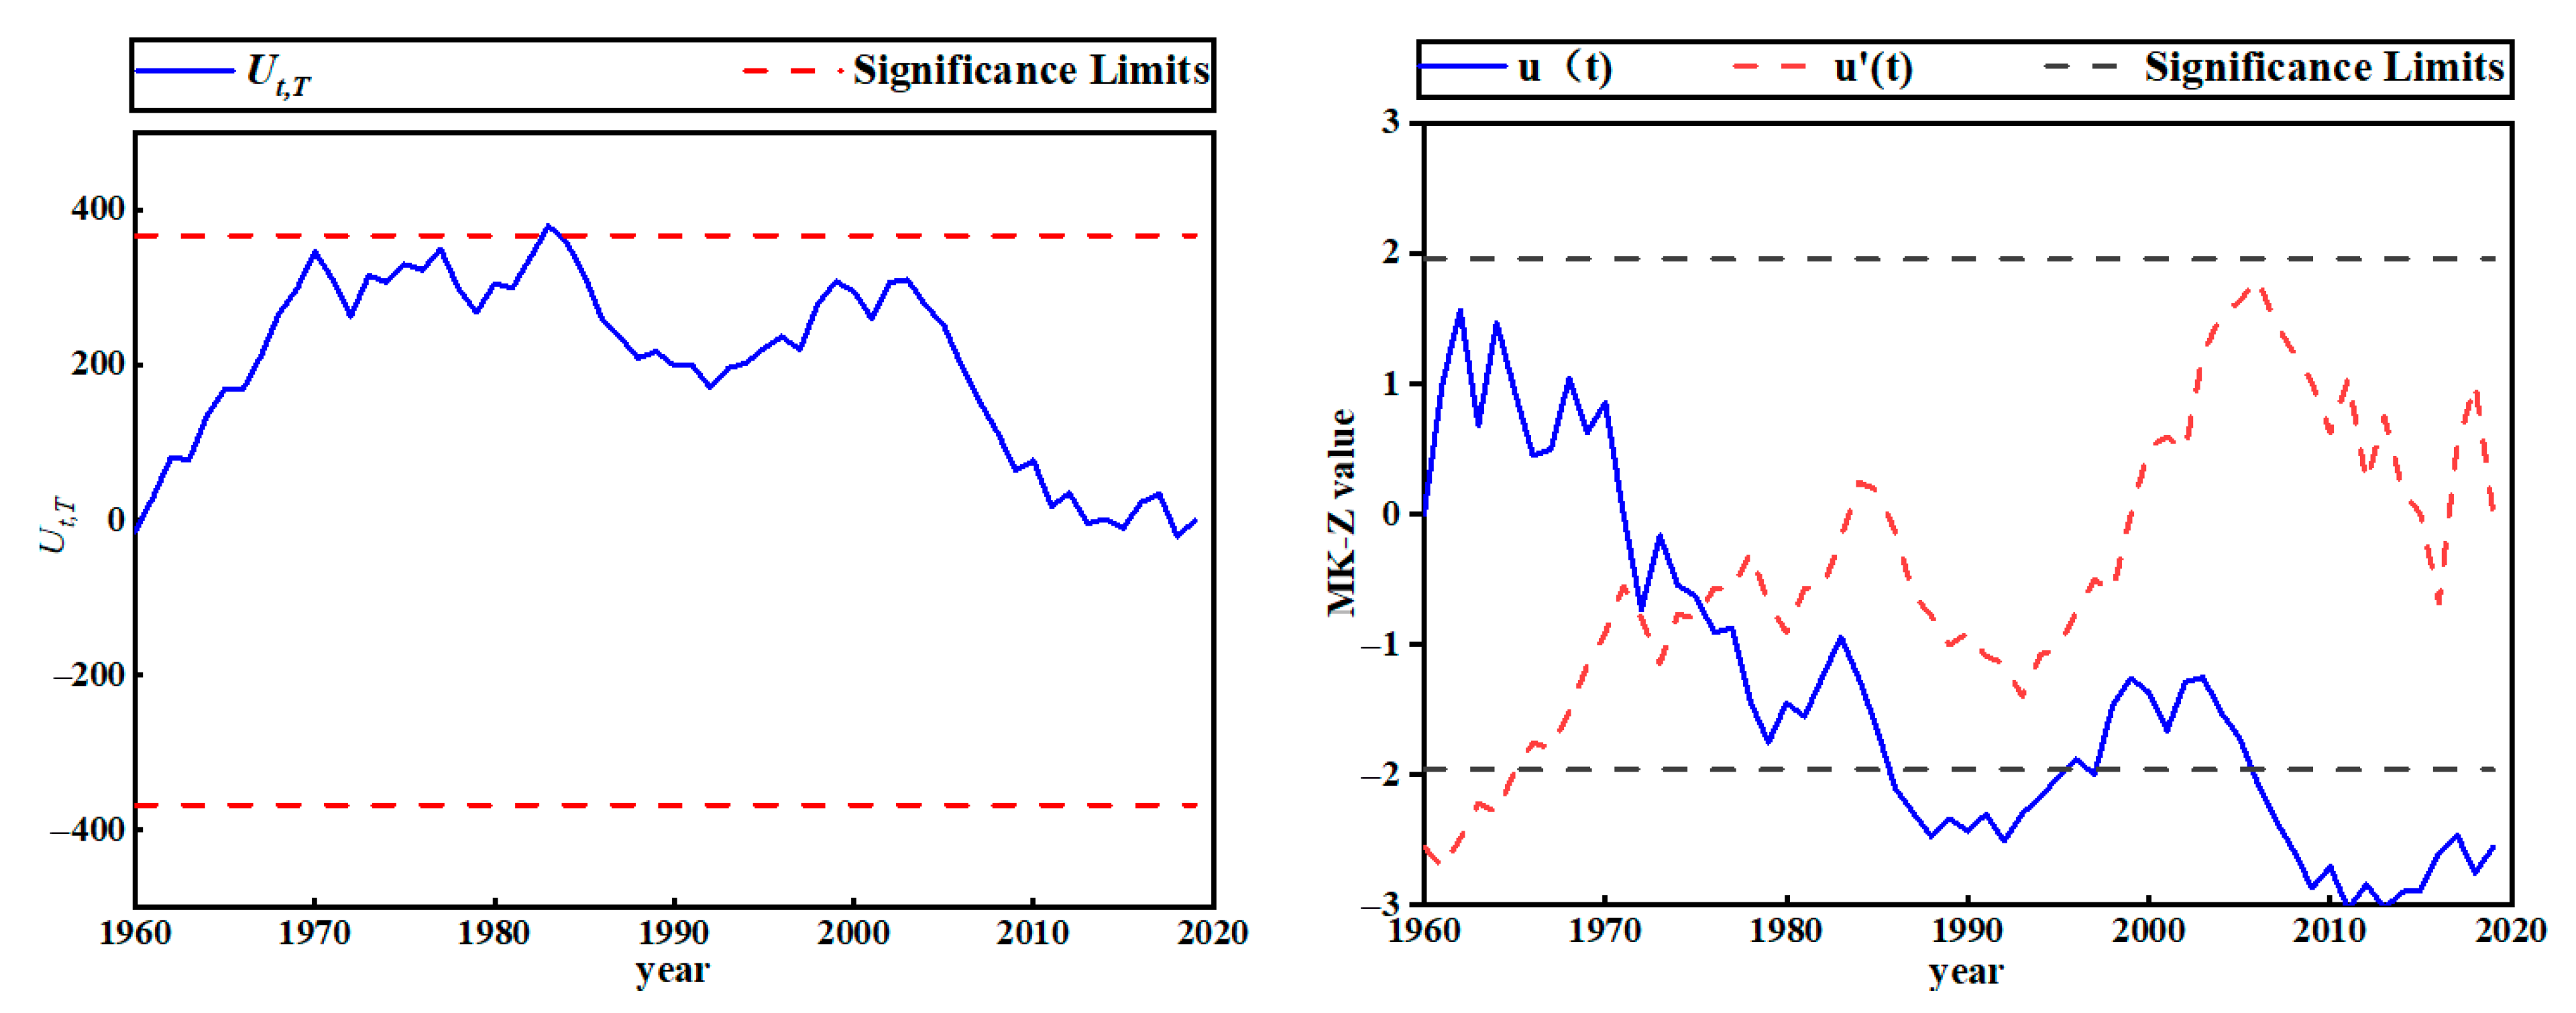
3.3. Runoff
3.4. Evapotranspiration
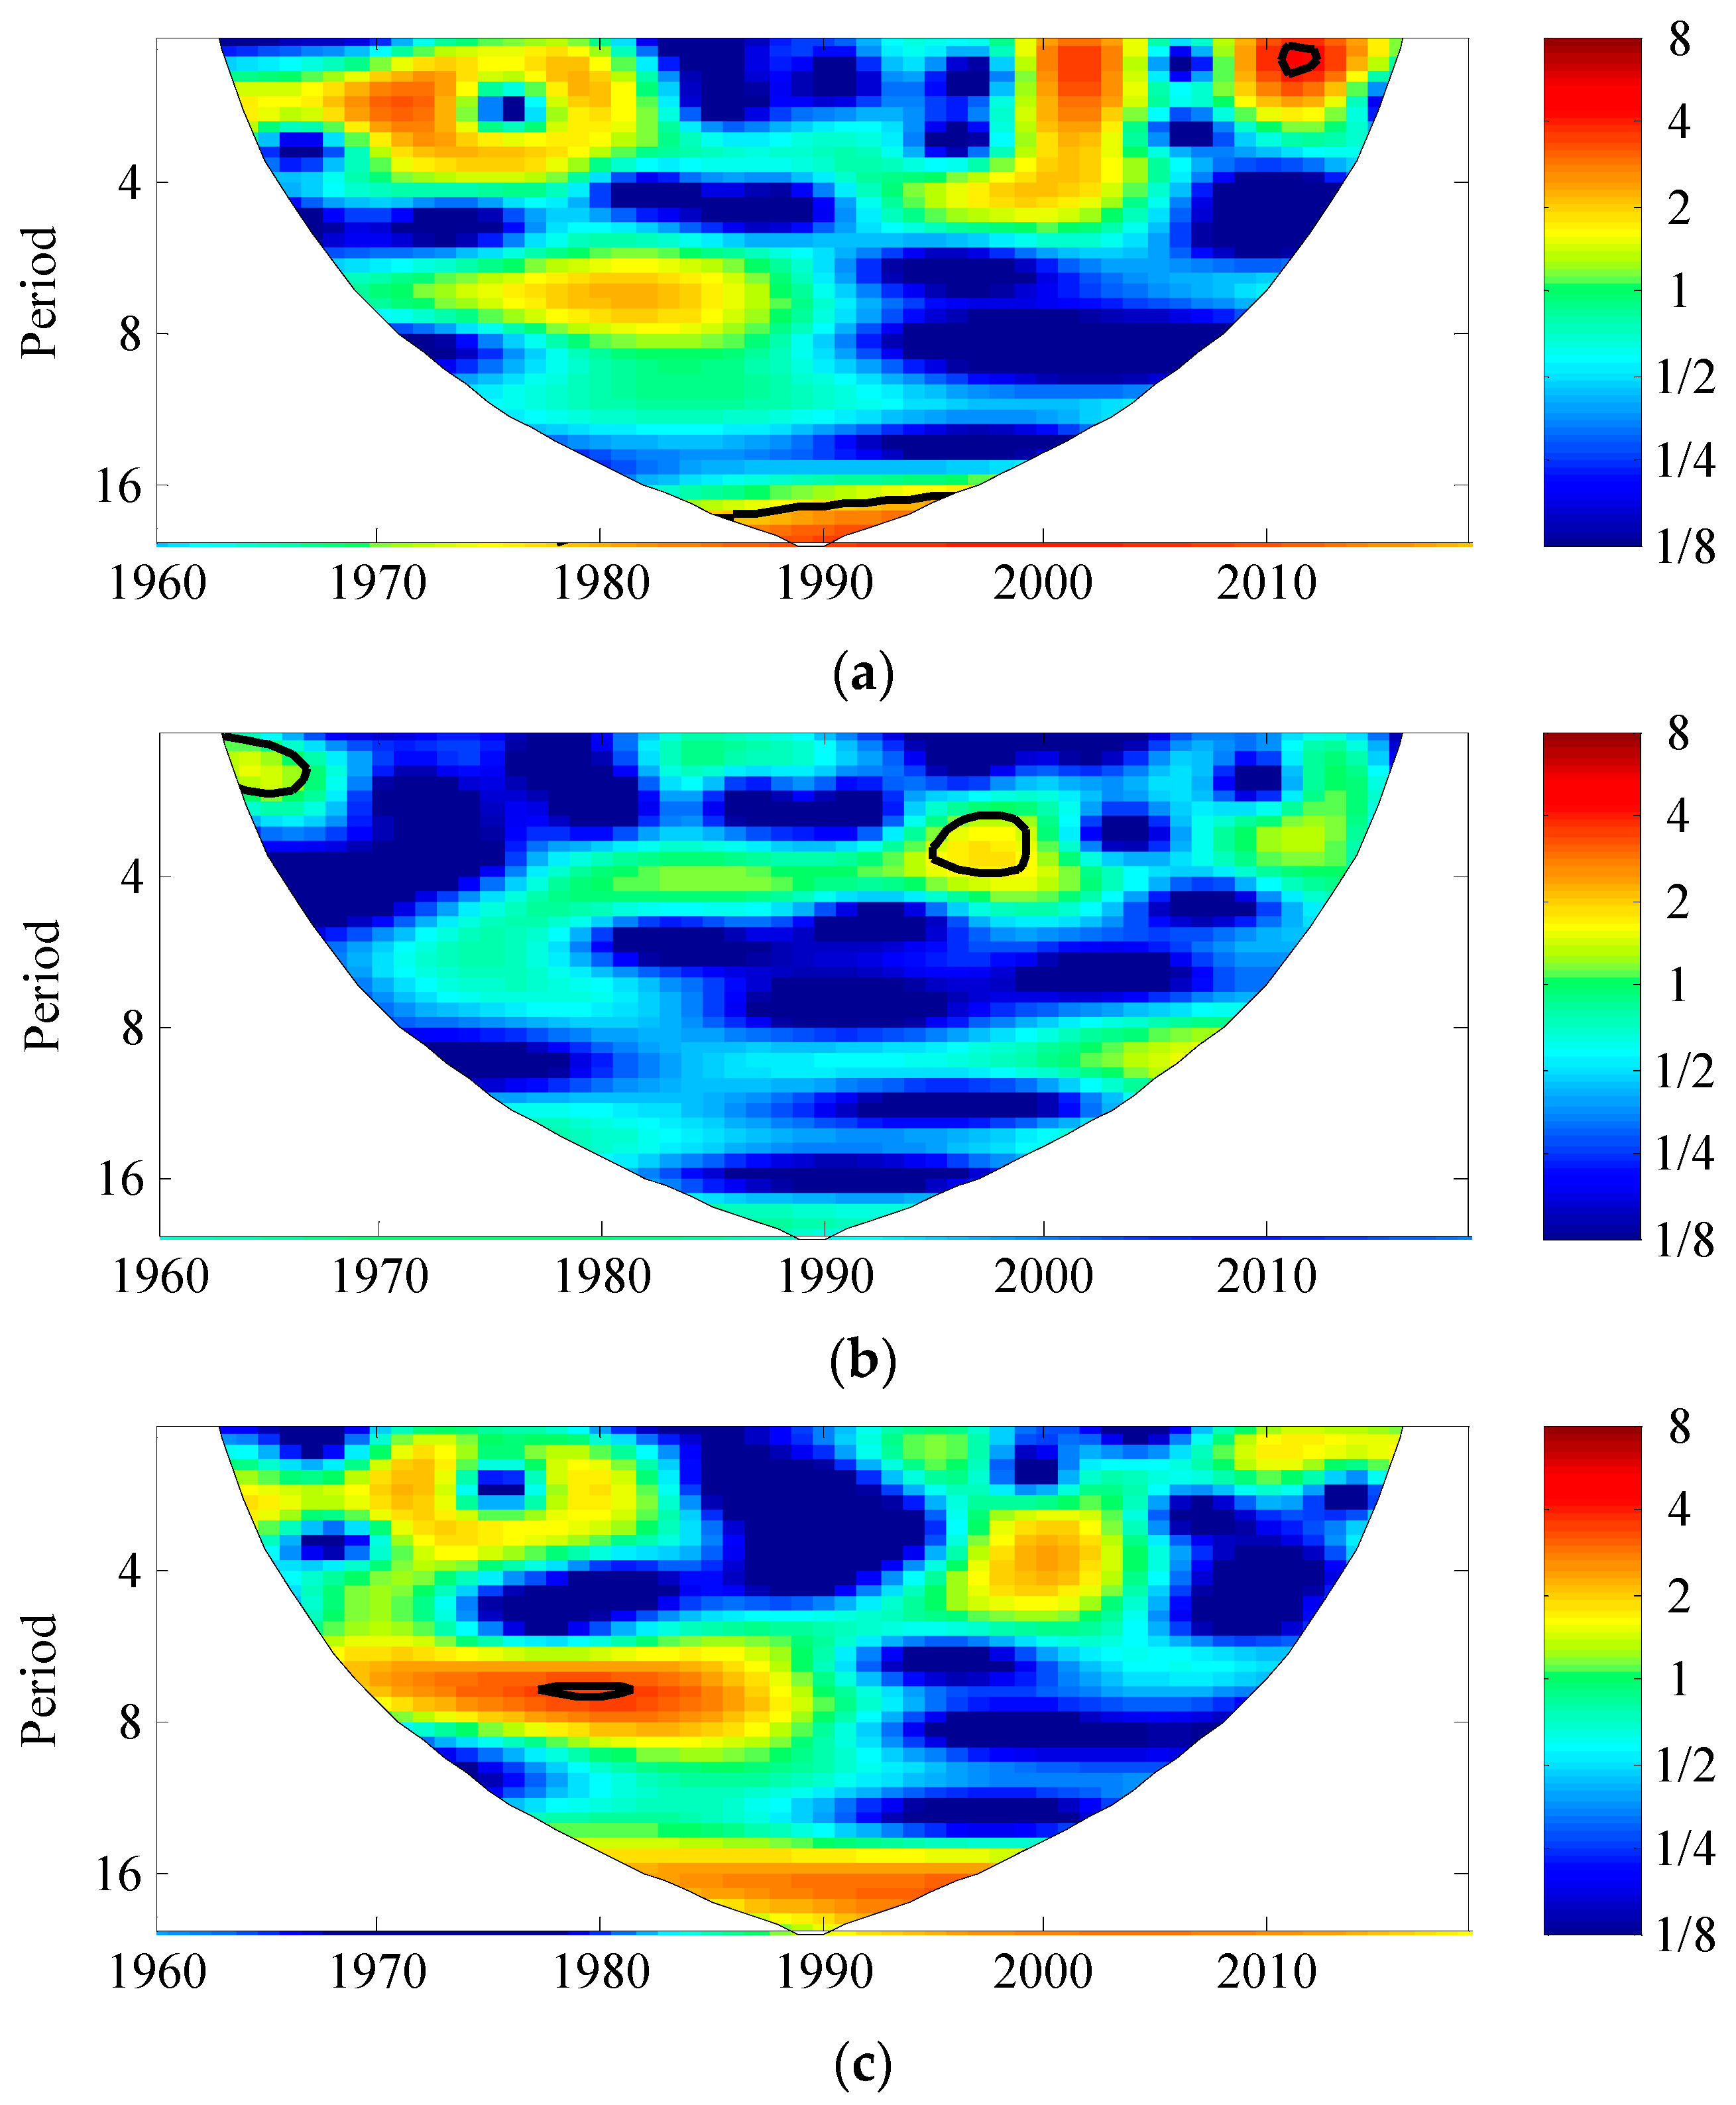
3.5. Cross-Wavelet Analysis of Rainfall, Temperature, and Runoff
4. Discussion
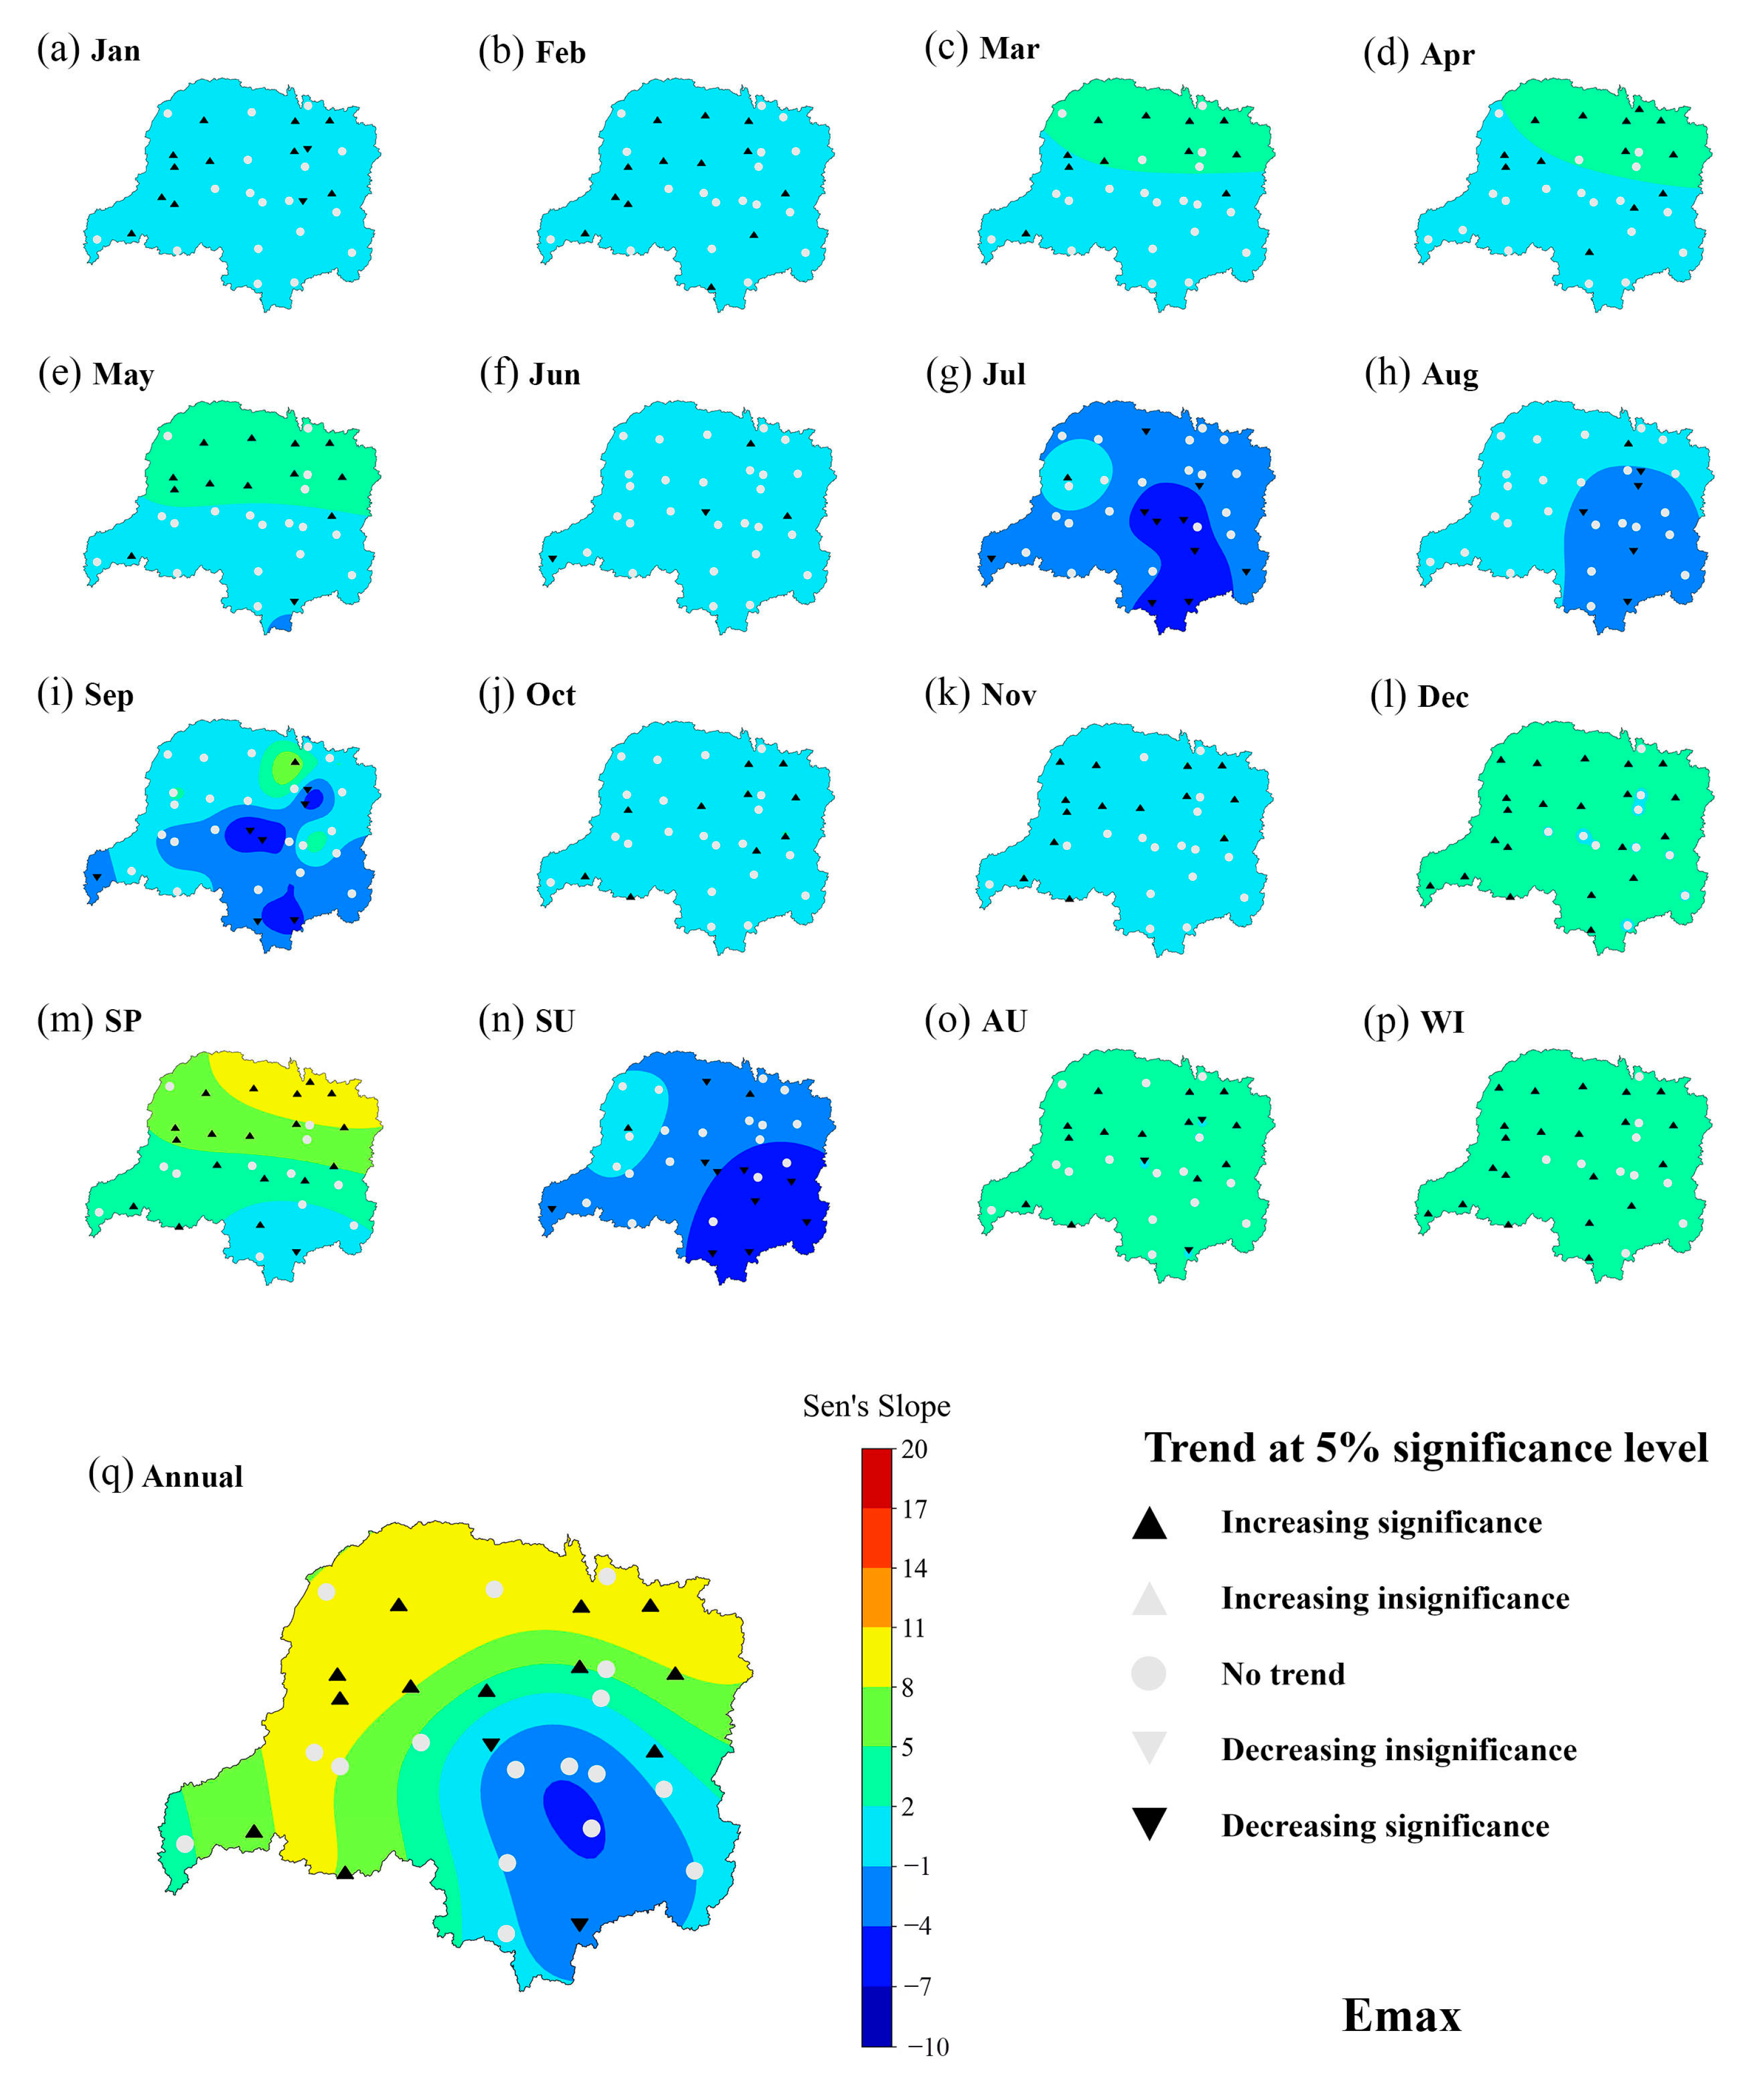
4.1. Sen’s Slope Spatial Variability Analysis
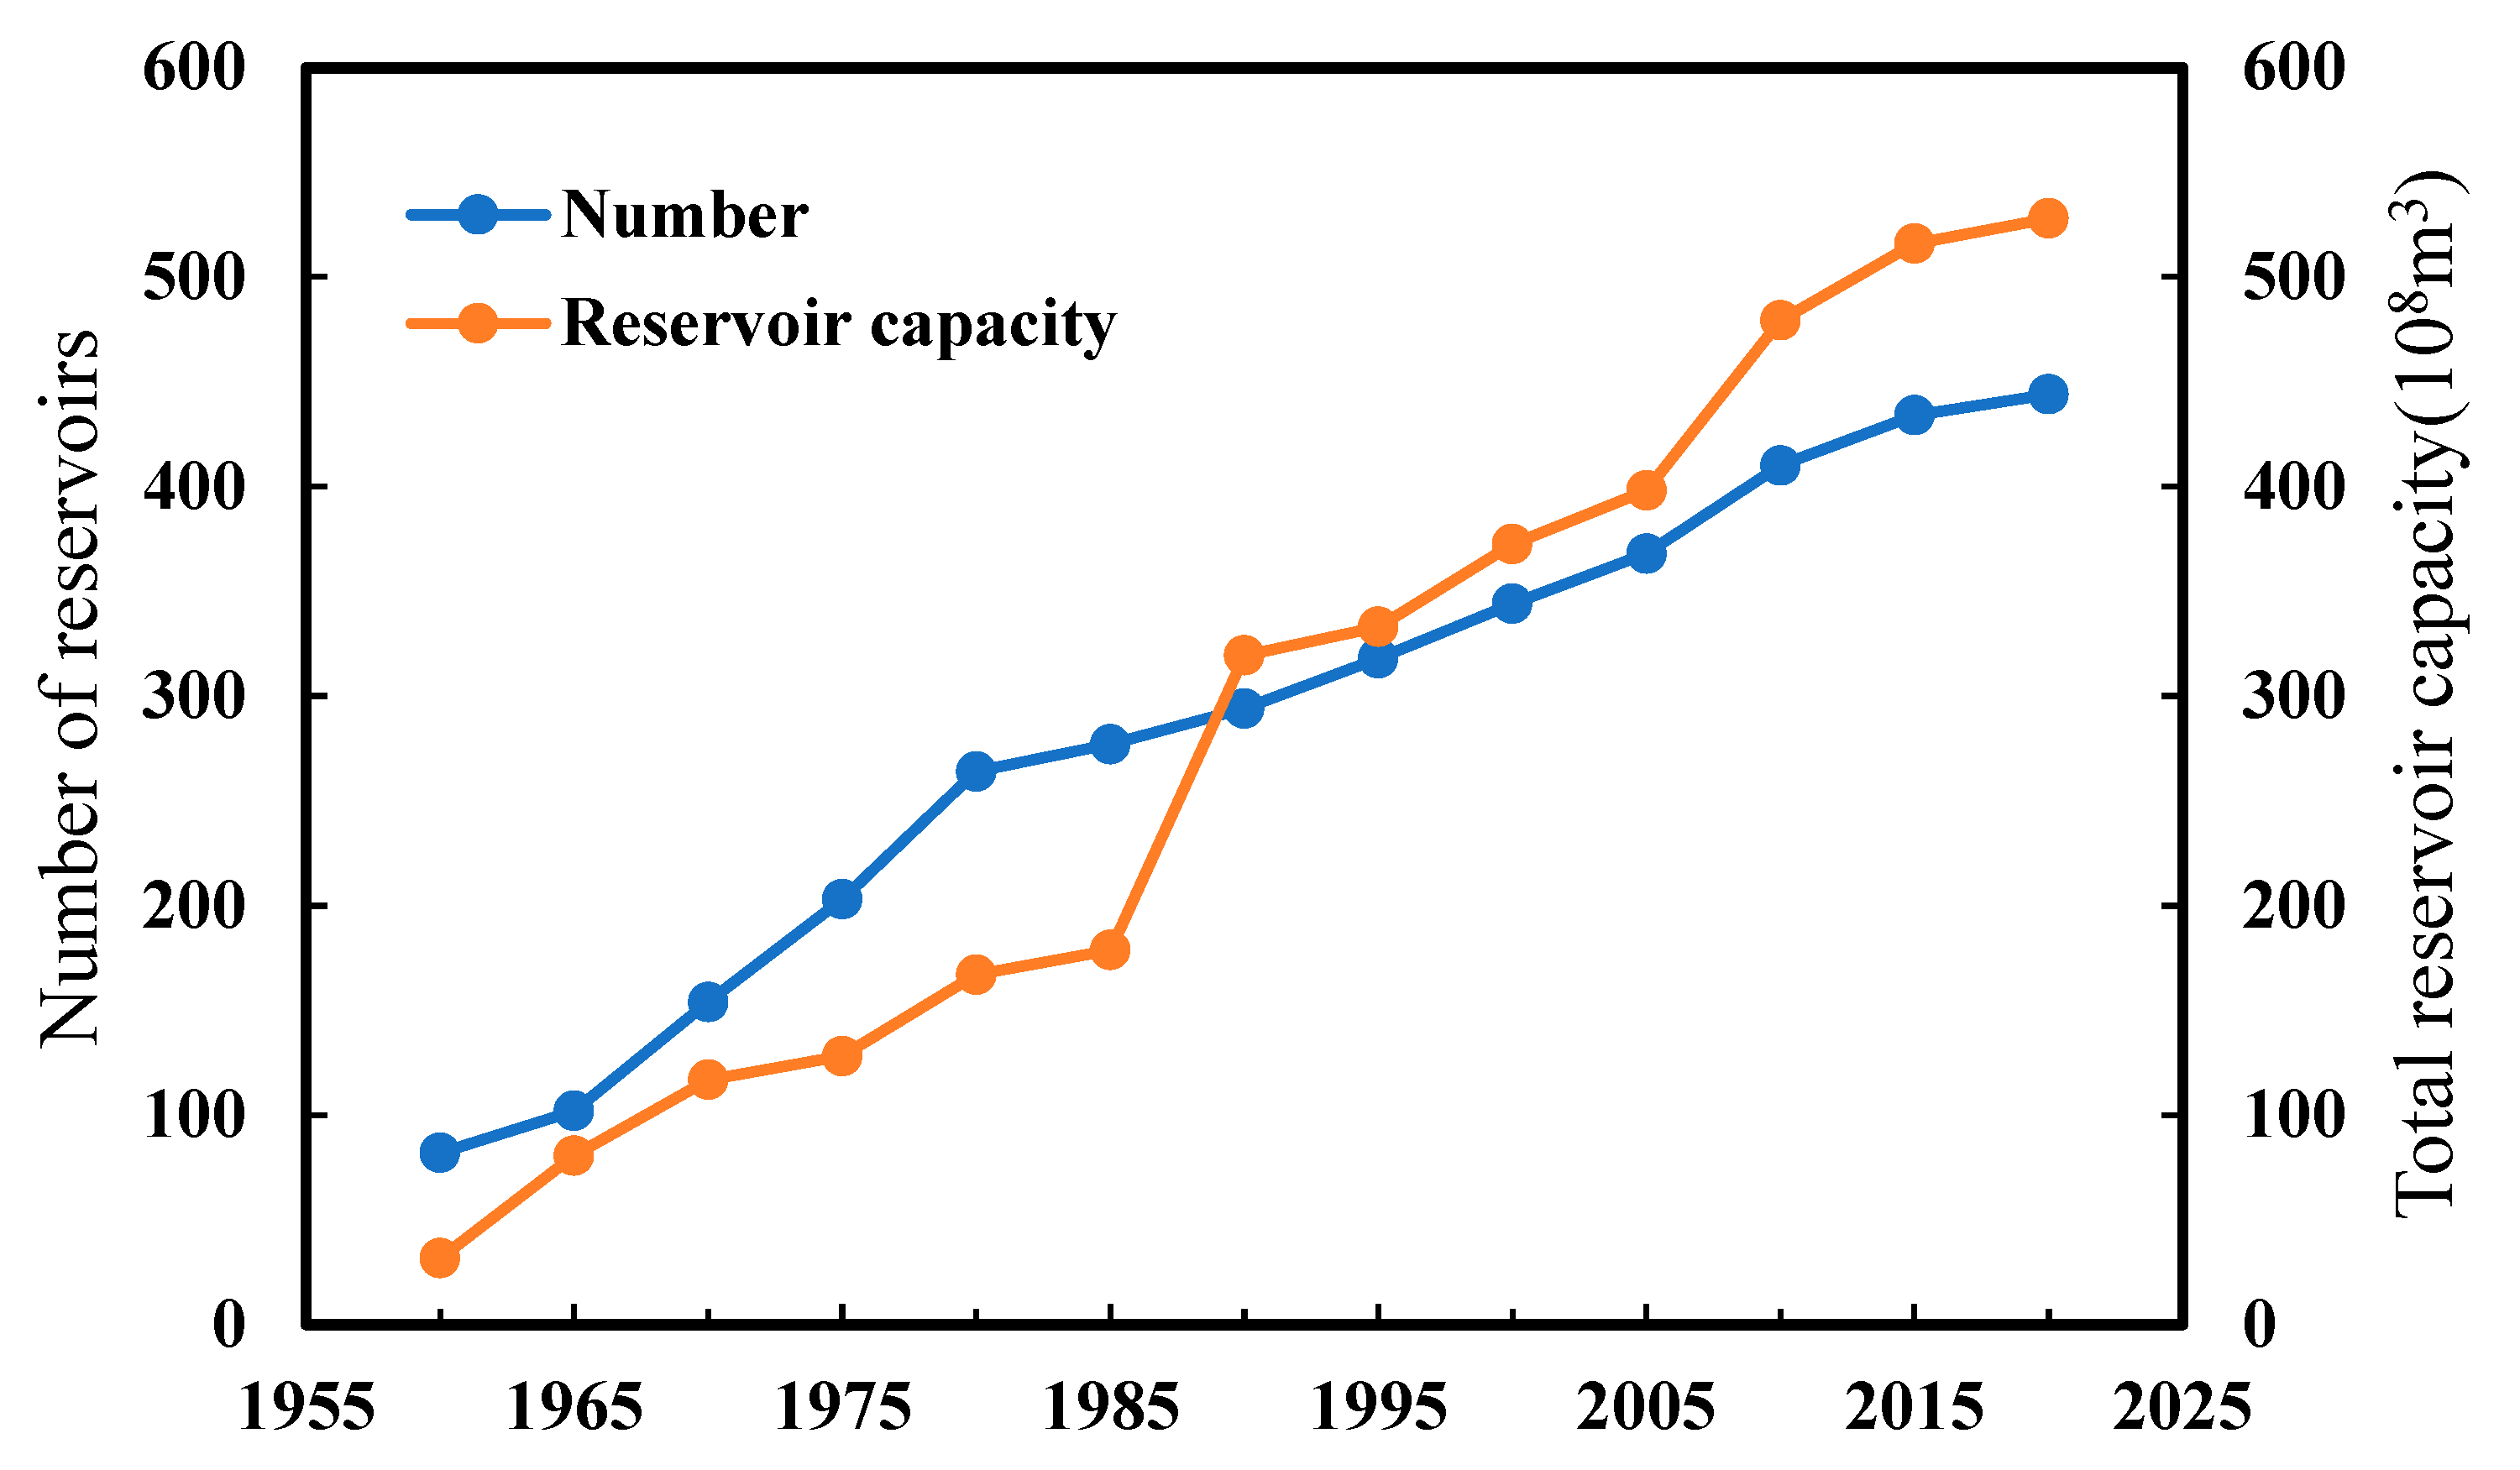
4.2. Impact of Reservoir Construction
5. Conclusions
- (1)
- During the study period, the minimum, maximum, and average temperatures showed an overall increasing trend, with spring temperatures having a significant upward trend. The annual time series for Tmax, Tmean, and Tmin exhibited growth rates of 0.168 °C, 0.18 °C, and 0.222 °C per year, respectively.
- (2)
- The annual total precipitation in the Dongting Lake basin exhibits a year-by-year increasing trend at a rate of 10.2 mm per year, while the precipitation during the spring and autumn seasons shows a decreasing trend at rates of 7.8 mm and 3 mm per year. The annual runoff at the basin outlet exhibits a clear decreasing trend at rate of 11,573 m3 per year. Furthermore, the long-term time series of evaporation also shows an increasing trend at rates of 4.44 mm per year. The change points identified using the non-parametric Pettitt test for annual rainfall and annual runoff were inconsistent, occurring in 1993 and 1983, respectively.
- (3)
- The annual average temperature and annual runoff in the Dongting Lake basin show a negative correlation cycle of 6–10a. As the temperature increases, evaporation in the basin increases, leading to a decrease in runoff. There is also a positive correlation cycle of 4–6a, where spring warming intensifies glacier melting, resulting in increased water supply to the rivers. The annual rainfall and annual runoff exhibit a good positive correlation cycle of 0–12a, indicating that rainfall is a controlling factor for runoff and is the main source of water supply in the Dongting Lake basin. In the high-frequency region with a 3a cycle, a mutation in the resonance period occurred around 1973 and the years around 2005.
Author Contributions
Funding
Institutional Review Board Statement
Informed Consent Statement
Data Availability Statement
Acknowledgments
Conflicts of Interest
References
- Intergovernmental Panel on Climate Change (IPCC). Climate Change 2022: Impacts, Adaptation and Vulnerability. Contribution of Working Group II to the Sixth Assessment Report of the Intergovernmental Panel on Climate Change; Cambridge University Press: Cambridge, UK, 2022. [Google Scholar]
- McCrystall, M.R.; Stroeve, J.; Serreze, M.; Forbes, B.C.; Screen, J.A. New climate models reveal faster and larger increases in Arctic precipitation than previously projected. Nat. Commun. 2021, 12, 6765. [Google Scholar] [CrossRef]
- Li, C.; Liu, Z.; Li, W.; Lin, Y.; Hou, L.; Niu, S.; Xing, Y.; Huang, J.; Chen, Y.; Zhang, S. Projecting future risk of dengue related to hydrometeorological conditions in mainland China under climate change scenarios: A modelling study. Lancet Planet. Health 2023, 7, e397–e406. [Google Scholar] [CrossRef] [PubMed]
- Fooladi, M.; Golmohammadi, M.H.; Safavi, H.R.; Mirghafari, R.; Akbari, H. Trend analysis of hydrological and water quality variables to detect anthropogenic effects and climate variability on a river basin scale: A case study of Iran. J. Hydro-Environ. Res. 2021, 34, 11–23. [Google Scholar] [CrossRef]
- Zuzani, P.; Ngongondo, C.; Mwale, F.; Willems, P. Examining trends of hydro-meteorological extremes in the Shire River Basin in Malawi. Phys. Chem. Earth A B C 2019, 112, 91–102. [Google Scholar] [CrossRef]
- Bui, H.X.; Li, Y.-X.; Maloney, E.D.; Kim, J.-E.; Lee, S.-S.; Yu, J.-Y. Emergence of Madden-Julian oscillation precipitation and wind amplitude changes in a warming climate. Npj Clim. Atmos. Sci. 2023, 6, 22. [Google Scholar] [CrossRef]
- Zhang, Q.; Zhao, Y.; Li, Y. Research progress and prospect on causes and variation of drought events in China. J. Meteorol. 2020, 78, 22. [Google Scholar]
- Zhang, X.; Xu, W. Diurnal Variations in Rainfall and Precipitation Asymmetry of Tropical Cyclones in the Northwest Pacific Region. J. Clim. 2021, 34, 5565–5582. [Google Scholar] [CrossRef]
- Javed, A.; Cheng, V.Y.; Arhonditsis, G.B. Detection of spatial and temporal hydro-meteorological trends in Lake Michigan, Lake Huron and Georgian Bay. Aquat. Ecosyst. Health Manag. 2019, 22, 1–14. [Google Scholar] [CrossRef]
- Gupta, N.; Gond, S.; Gupta, S.K. Spatiotemporal trend characteristics of rainfall and drought jeopardy over Bundelkhand Region, India. Arab. J. Geosci. 2022, 15, 1155. [Google Scholar] [CrossRef]
- Ahmad, I.; Tang, D.; Wang, T.; Wang, M.; Wagan, B. Precipitation trends over time using Mann-Kendall and spearman’s rho tests in swat river basin, Pakistan. Adv. Meteorol. 2015, 2015, 431860. [Google Scholar] [CrossRef]
- Alifujiang, Y.; Abuduwaili, J.; Ge, Y. Trend Analysis of Annual and Seasonal River Runoff by Using Innovative Trend Analysis with Significant Test. Water 2021, 13, 95. [Google Scholar] [CrossRef]
- Hamed, K.H.; Rao, A.R. A modified Mann-Kendall trend test for autocorrelated data. J. Hydrol. 1998, 204, 182–196. [Google Scholar] [CrossRef]
- Sa’adi, Z.; Shahid, S.; Ismail, T.; Chung, E.-S.; Wang, X.-J. Trends analysis of rainfall and rainfall extremes in Sarawak, Malaysia using modified Mann–Kendall test. Meteorol. Atmos. Phys. 2019, 131, 263–277. [Google Scholar] [CrossRef]
- Mondal, A.; Kundu, S.; Mukhopadhyay, A. Rainfall trend analysis by Mann-Kendall test: A case study of north-eastern part of Cuttack district, Orissa. Int. J. Geol. Earth Environ. Sci. 2012, 2, 70–78. [Google Scholar]
- Umar, D.A.; Ramli, M.F.; Aris, A.Z.; Wan, N.; Basiru, H.A. Runoff irregularities, trends, and variations in tropical semi-arid river catchment. J. Hydrol. Reg. Stud. 2018, 19, 335–348. [Google Scholar] [CrossRef]
- Brigadier, L.; Bwalya, K.; Nkolola, N.B.; Chilekana, N. Quantifying long-term variability of precipitation and temperature over Zambia. J. Atmos. Sol. Terr. Phys. 2020, 198, 105201. [Google Scholar]
- Deng, P.; Zhang, M.; Hu, Q.; Wang, L.; Bing, J. Pattern of spatio-temporal variability of extreme precipitation and flood-waterlogging process in Hanjiang River basin. Atmos. Res. 2022, 276, 106258. [Google Scholar] [CrossRef]
- De Oliveira, R.G.; Valle Júnior, L.C.G.; Da Silva, J.B.; Espíndola, D.A.L.F.; Lopes, R.D.; Nogueira, J.S.; Curado, L.F.A.; Rodrigues, T.R. Temporal trend changes in reference evapotranspiration contrasting different land uses in southern Amazon basin. Agric. Water Manag. 2021, 250, 106815. [Google Scholar] [CrossRef]
- Bouizrou, I.; Aqnouy, M.; Bouadila, A. Spatio-temporal analysis of trends and variability in precipitation across Morocco: Comparative analysis of recent and old non-parametric methods. J. Afr. Earth Sci. 2022, 196, 104691. [Google Scholar] [CrossRef]
- Hu, J.; Li, P.; Zhao, G.; Mu, X.; Hoermann, G.; Gao, P.; Sun, W.; Zhang, L. Effects of climate variability and anthropogenic factors on sediment load reduction in the Weihe River basin, China. Hydrol. Process. 2022, 36, e14562. [Google Scholar] [CrossRef]
- Sharma, V.; Nicholson, C.M.; Bergantino, A.; Irmak, S.; Peck, D. Temporal Trend Analysis of Meteorological Variables and Reference Evapotranspiration in the Inter-Mountain Region of Wyoming. Water 2020, 12, 2159. [Google Scholar] [CrossRef]
- Gulakhmadov, A.; Chen, X.; Gulahmadov, N.; Liu, T.; Gulakhmadov, M. Long-Term Hydro-Climatic Trends in the Mountainous Kofarnihon River Basin in Central Asia. Water 2020, 12, 2140. [Google Scholar] [CrossRef]
- Grinsted, A.; Moore, J.C.; Jevrejeva, S. Application of the cross wavelet transform and wavelet coherence to geophysical time series. Nonlinear Process. Geophys. 2004, 11, 561–566. [Google Scholar] [CrossRef]
- Sun, W.; Cheng, B. Application of cross wavelet transform to analysis on regional climate variations. J. Appl. Meteorol. Sci. 2008, 19, 479–487. [Google Scholar]
- Yu, D.; Zhang, R.; Hong, M.; Liu, K. Correlation analysis between the West Pacific subtropical high and the East Asian summer monsoon system based on cross wavelet and wavelet coherence. J. Nanjing Inst. Meteorol. 2008, 30, 755–769. [Google Scholar]
- Wang, G.; Jiang, D.; Wang, Y.; Yu, Z. Characteristics of climate change in the Lake Dongting Basin (1961–2003). J. Lake Sci. 2006, 18, 470–475. [Google Scholar]
- Xu, W.; Ge, D.; Li, N. Characteristics of Precipitation Variation in the Dongting Lake Basin during 1961–2011. Wetl. Sci. 2016, 14, 108–112. [Google Scholar]
- Li, J.; Huang, S.; Li, J. Spatial-temporal characteristics of temperature in the Lake Dongting Basin from 1960 to 2008, Water Systems and Sustainable Management of water Resources. In Proceedings of the 7th China Water Forum, Beijing, China, 19–20 September 2009; pp. 82–88. [Google Scholar]
- Zhang, M.; Zeng, Y.; Qi, Y. Analyzing spatio-temporal variations of evapotranspiration in Dongting Lake Basin during 2000–2014 based on MOD16. Trans. Chin. Soc. Agric. Eng. 2018, 34, 9. [Google Scholar]
- Moghimi, M.M.; Zarei, A.R.; Mahmoudi, M.R. Seasonal drought forecasting in arid regions, using different time series models and RDI index. J. Water Clim. Chang. 2019, 11, 633–654. [Google Scholar] [CrossRef]
- Chen, C.; Gan, R.; Feng, D.; Yang, F.; Zuo, Q. Quantifying the contribution of SWAT modeling and CMIP6 inputting to streamflow prediction uncertainty under climate change. J. Clean. Prod. 2022, 364, 132675. [Google Scholar] [CrossRef]
- Zhang, J.; Li, Z.; Zhang, X.; Wu, P. Precipitation: Spatio-temporal Distribution Characteristics and Trend Change in Hunan Province from 1960 to 2005. J. Hydrol. 2009, 29, 73–78. [Google Scholar]
- Song, C.; Fan, C.; Zhu, J.; Wang, J.; Sheng, Y.; Liu, K.; Chen, T.; Zhan, P.; Luo, S.; Yuan, C. A comprehensive geospatial database of nearly 100 000 reservoirs in China. Earth Syst. Sci. Data 2022, 14, 4017–4034. [Google Scholar] [CrossRef]
- Mann, H.B. Nonparametric tests against trend. Econom. J. Econom. Soc. 1945, 13, 245–259. [Google Scholar] [CrossRef]
- Kendall, M.G. Rank Correlation Methods; Griffin: New York, NY, USA, 1948. [Google Scholar]
- Pettitt, A.N. A non-parametric approach to the change-point problem. J. R. Stat. Soc. Ser. C Appl. Stat. 1979, 28, 126–135. [Google Scholar] [CrossRef]
- Gerstengarbe, F.W.; Werner, P.C. Estimation of the beginning and end of recurrent events within a climate regime. Vis. Books 1999, 11, 97–107. [Google Scholar] [CrossRef]
- Feidas, H. Trend analysis of air temperature time series in Greece and their relationship with circulation using surface and satellite data: Recent trends and an update to 2013. Theor. Appl. Climatol. 2016, 129, 1383–1406. [Google Scholar] [CrossRef]
- Sen, P.K. Estimates of the Regression Coefficient Based on Kendall’s Tau. J. Am. Stat. Assoc. 1968, 63, 1379–1389. [Google Scholar] [CrossRef]
- Torrence, C.; Compo, G.P. A practical guide to wavelet analysis. Bull. Am. Meteorol. Soc. 1998, 79, 61–78. [Google Scholar] [CrossRef]
- Carey, S.K.; Tetzlaff, D.; Buttle, J.; Laudon, H.; McDonnell, J.; McGuire, K.; Seibert, J.; Soulsby, C.; Shanley, J. Use of color maps and wavelet coherence to discern seasonal and interannual climate influences on streamflow variability in northern catchments. Water Resour. Res. 2013, 49, 6194–6207. [Google Scholar] [CrossRef]
- Juez, C.; Nadal-Romero, E. Long-term temporal structure of catchment sediment response to precipitation in a humid mountain badland area. J. Hydrol. 2021, 597, 125723. [Google Scholar] [CrossRef]
- Juez, C.; Garijo, N.; Hassan, M.; Nadal-Romero, E. Intraseasonal-to-Interannual analysis of discharge and suspended sediment concentration time-series of the upper changjiang (Yangtze river). Water Resour. Res. 2021, 57, e2020WR029457. [Google Scholar] [CrossRef]
- Grossmann, A.; Morlet, J. Decomposition of Hardy functions into square integrable wavelets of constant shape. SIAM J. Math. Anal. 1984, 15, 723–736. [Google Scholar] [CrossRef]
- Panagiotopoulou, A.; Anastassopoulos, V. Super-resolution image reconstruction employing Kriging interpolation technique. In Proceedings of the 2007 14th International Workshop on Systems, Signals and Image Processing and 6th EURASIP Conference focused on Speech and Image Processing, Multimedia Communications and Services, Maribor, Slovenia, 27–30 June 2007; pp. 144–147. [Google Scholar]
- Liu, Z.; Liu, Y.; Hao, Y. Multi-time scale cross-wavelet transformation between runoff and climate factors in the upstream of Heihe River. Arid. Land Geogr. 2014, 37, 1137–1146. [Google Scholar]
- Liu, J.; Fu, G.; Song, X.; Charles, S.P.; Zhang, Y.; Han, D.; Wang, S. Stable isotopic compositions in Australian precipitation. J. Geophys. Res. 2010, 115, D23307. [Google Scholar] [CrossRef]
- Zhou, H. Impact of Climate Change on Water Resources in Dongting Lake Basin; Hunan Normal University: Changsha, China, 2016. [Google Scholar]
- Xu, K.; Milliman, J.D. Seasonal variations of sediment discharge from the Yangtze River before and after impoundment of the Three Gorges Dam. Geomorphology 2009, 104, 276–283. [Google Scholar] [CrossRef]
- Valdivielso, S.; Hassanzadeh, A.; Vázquez-Sué, E.; Custodio, E.; Criollo, R. Spatial distribution of meteorological factors controlling stable isotopes in precipitation in Northern Chile. J. Hydrol. 2022, 605, 127–380. [Google Scholar] [CrossRef]
- Palazzi, E.; Filippi, L.; von Hardenberg, J. Insights into elevation-dependent warming in the Tibetan Plateau-Himalayas from CMIP5 model simulations. Clim. Dyn. 2017, 48, 3991–4008. [Google Scholar] [CrossRef]
- Li, S.; Jiang, C.; Ma, Y.; Long, Y.; Wu, R.; Zhu, Q.; Li, D.; Li, C.; Ning, Z. Adaptation Analysis in IMERG Precipitation Estimation for the Dongting Lake Basin, China. Atmosphere 2022, 13, 1735. [Google Scholar] [CrossRef]
- Gohain, K.J.; Mohammad, P.; Goswami, A. Assessing the impact of land use land cover changes on land surface temperature over Pune city, India. Quat. Int. 2021, 575, 259–269. [Google Scholar] [CrossRef]
- Gong, C.; Dan, L.; Yong, W.; Tingting, K. Water Area Change of Dongting Lake Based on Landsat Data and ItsAffecting Factors Analysis. J. Irrig. Drain. 2015, 34, 252–255. [Google Scholar]
- Wang, R.; Peng, W.; Liu, X.; Jiang, C.; Wu, W.; Chen, X. Characteristics of Runoff Variations and Attribution Analysis in the Poyang Lake Basin over the Past 55 Years. Sustainability 2020, 12, 944. [Google Scholar] [CrossRef]


| Stations | p-Value | Year | Variation | |
|---|---|---|---|---|
| LaiFeng | 60 | 0.516 | 24 | −98.3 |
| Sangzhi | 60 | 0.979 | 33 | 55.9 |
| Shimen | 60 | 0.804 | 52 | 126.8 |
| Jianli | 60 | 0.336 | 20 | 131.7 |
| Nanxian | 60 | 0.638 | 27 | 60.2 |
| Yueyang | 60 | 0.211 | 27 | 144.4 |
| Baojing | 60 | 0.734 | 18 | −90.8 |
| Jishou | 60 | 0.495 | 52 | 223 |
| Yuanling | 60 | 0.715 | 50 | 140.3 |
| Anhua | 60 | 0.423 | 29 | 105.9 |
| Yuanjiang | 60 | 0.686 | 29 | 68.7 |
| Xiangyin | 60 | 0.722 | 29 | 96.3 |
| Changsha | 60 | 0.103 | 29 | 119.9 |
| Pingjiang | 60 | 0.46 | 43 | −106.9 |
| Tongren | 60 | 0.842 | 52 | 133.3 |
| Zhijiang | 60 | 0.551 | 13 | −116.5 |
| Xupu | 60 | 0.523 | 30 | 91 |
| Xinhua | 60 | 0.092 | 29 | 135 |
| Shaoyang | 60 | 0.828 | 28 | 57.5 |
| Shuangfeng | 60 | 0.34 | 27 | 68.2 |
| Youxian | 60 | 0.576 | 20 | 124.7 |
| Zhuzhou | 60 | 0.114 | 30 | 142.5 |
| Kaili | 60 | 0.794 | 18 | −62.3 |
| Sansui | 60 | 0.558 | 23 | −68 |
| Tongdao | 60 | 0.336 | 8 | 239.5 |
| Yongzhou | 60 | 0.658 | 52 | 159.1 |
| Hengyang | 60 | 0.774 | 47 | −114.5 |
| Guidong | 60 | 0.223 | 33 | 140.3 |
| Daoxian | 60 | 0.466 | 52 | 319.3 |
| Jiahe | 60 | 0.842 | 33 | 64.5 |
| Time Series | Correlation | MK/MMK Test (Z) | SS Test (β) | p-Value | Year | Shift |
|---|---|---|---|---|---|---|
| Jan | independent | 3.31 | 756.8 | 0.003 | 9 | + |
| Feb | independent | 2.4 | 596.8 | 0.023 | 9 | + |
| Mar | independent | 1.89 | 1013.4 | 0.051 | 0 | + |
| Apr | independent | −1.32 | −870.1 | 0.382 | 9 | - |
| May | independent | −1.82 | −1711.6 | 0.01 | 8 | - |
| Jun | independent | −0.47 | −428.9 | 0.544 | 5 | - |
| Jul | independent | −1.78 | −2525.2 | 0.134 | 0 | - |
| Aug | independent | −2.21 | −2303.7 | 0.065 | 0 | - |
| Sep | independent | −3.62 | −3616.1 | 0.012 | 0 | - |
| Oct | correlation | −5.59 | −3279 | 0 | 0 | - |
| Nov | independent | −2.61 | −1378.5 | 0.026 | 4 | - |
| Dec | independent | −0.39 | −103.4 | 0.243 | 1 | - |
| Spring | independent | −0.99 | −1544.7 | 0.402 | 8 | + |
| Summer | independent | −2.24 | −5436.5 | 0.099 | 0 | - |
| Autumn | correlation | −4.81 | −7971.1 | 0 | 0 | - |
| Winter | independent | 2.15 | 1287.3 | 0.013 | 9 | - |
| Annual | independent | −2.54 | −11,573.7 | 0.023 | 4 | - |
Disclaimer/Publisher’s Note: The statements, opinions and data contained in all publications are solely those of the individual author(s) and contributor(s) and not of MDPI and/or the editor(s). MDPI and/or the editor(s) disclaim responsibility for any injury to people or property resulting from any ideas, methods, instructions or products referred to in the content. |
© 2023 by the authors. Licensee MDPI, Basel, Switzerland. This article is an open access article distributed under the terms and conditions of the Creative Commons Attribution (CC BY) license (https://creativecommons.org/licenses/by/4.0/).
Share and Cite
Li, S.; Jiang, C.; Ma, Y.; Li, C. Spatiotemporal Analysis of Hydrometeorological Factors in the Source Region of the Dongting Lake Basin, China. Atmosphere 2023, 14, 1793. https://doi.org/10.3390/atmos14121793
Li S, Jiang C, Ma Y, Li C. Spatiotemporal Analysis of Hydrometeorological Factors in the Source Region of the Dongting Lake Basin, China. Atmosphere. 2023; 14(12):1793. https://doi.org/10.3390/atmos14121793
Chicago/Turabian StyleLi, Shanshan, Changbo Jiang, Yuan Ma, and Chuannan Li. 2023. "Spatiotemporal Analysis of Hydrometeorological Factors in the Source Region of the Dongting Lake Basin, China" Atmosphere 14, no. 12: 1793. https://doi.org/10.3390/atmos14121793
APA StyleLi, S., Jiang, C., Ma, Y., & Li, C. (2023). Spatiotemporal Analysis of Hydrometeorological Factors in the Source Region of the Dongting Lake Basin, China. Atmosphere, 14(12), 1793. https://doi.org/10.3390/atmos14121793