Article

Spatiotemporal Characteristics of Hourly-Scale Extreme Precipitation in the Sichuan Basin and Its Impact on Normalized Difference Vegetation Index Values

1
Jiangsu Provincial Climate Center, Nanjing 210044, China
2
College of Computer and Software, Nanjing Vocational University of Industry Technology, Nanjing 210046, China
*
Author to whom correspondence should be addressed.
Atmosphere 2023, 14(12), 1719; https://doi.org/10.3390/atmos14121719
Submission received: 8 September 2023 / Revised: 26 October 2023 / Accepted: 13 November 2023 / Published: 22 November 2023
(This article belongs to the Special Issue Characteristics of Extreme Climate Events over China)

Abstract

:
This study harnesses ground observation data collected between 1980 and 2021 and ERA5 hourly data to thoroughly implement trend and correlation analysis techniques to explore the spatiotemporal dynamic characteristics of daily and hourly extreme precipitation in the Sichuan Basin. The investigation delineates these characteristics and probes into the potential triggers of extreme hourly rainstorms. The findings unveil the following: (1) A general increase in extreme rainfall volume, contribution rate, intensity, and dispersion, along with a decline in frequency and proportion of rainstorm areas, indicating the concentration of daily-scale severe rainstorms. The basin’s edge receives more precipitation than the bottom, exhibiting latitudinal variations. (2) The northernmost mountainous regions have less frequent, less intense rainstorms influenced by terrain, whereas the northeastern region experiences more frequent, dispersed rainstorms. (3) Extreme hourly rainstorms predominantly occur at night, with rainfall amount, intensity, and frequency declining at 21:00 compared to 19:00. (4) Summer experiences the highest risk of extreme rainstorms, with annual and monthly datasets displaying a rising trend in the frequency, dispersion, and intensity of intense hourly rainstorms. (5) Peak values of extreme hourly rainstorms are growing, with two distinct periods for their frequency: 1:00–9:00 and 10:00–24:00, with an increase in the former and a decrease in the latter. (6) Normalized difference vegetation index (NDVI) values ascend from southwest to northeast within the basin on a ten-day scale, correlating with the distribution of hourly extreme precipitation.

1. Introduction

Amid the aggravation of global warming, a noticeable rise in extreme rainfall events has been observed across varying time scales [1,2,3,4]. Over recent decades, the frequency and intensity of such meteorological phenomena have increased in China, leading to substantial losses due to disasters like torrential rains and floods in certain areas. Nonetheless, notable regional variations in extreme rainfall events are notably evident [5,6,7]. Specifically, specific regions within the middle and lower reaches of the Yangtze River, the southeastern areas, and the northwest have manifested an upward trend in occurrences of extreme precipitation. Conversely, specific regions in North China, the Northeast, and the Southwest have seen a diminution in extreme precipitation events’ frequency and intensity. Throughout the warm season from 1981 to 2017, a total of 231 flood disasters were recorded across China, causing losses exceeding USD 247 billion (Emergency Disaster Database: http://www.emdat.be/ (accessed on 3 September 2023)). In the Min and Jialing River basins within the Sichuan Basin, the recorded rainfall in the middle of August 2020 exceeded typical levels by factors of 3.1 and 2.8, respectively [8]. These anomalous climatic conditions contributed to an economic burden nearing USD 9.4 billion, adversely affecting 8.5 million residents. On 20 July 2021, a catastrophic rainstorm struck Zhengzhou, resulting in 398 reported fatalities and disappearances, and direct economic losses amounting to approximately CNY 120.06 billion [9]. Therefore, examining the spatiotemporal distribution characteristics of extreme precipitation events can provide scientific foundations for disaster prevention and emergency response strategies against regional rainstorms, thereby minimizing economic losses and reducing casualties.
In contemporary studies focused on extreme precipitation events, a diverse array of data sources such as satellite remote sensing data [10,11,12], radar data [13,14,15], climate and meteorological model simulations [16,17,18,19], ground-based observations [10,20,21], and the fusion of multisource heterogeneous data [22,23,24] have been increasingly utilized. Most research methodologies commonly employ the internationally recognized percentile method to define the threshold for extreme precipitation at various monitoring stations [4,25,26,27]. Additionally, the precipitation indices developed by the ETCCDI (Expert Team on Climate Change Detection and Indices) under the WMO (World Meteorological Organization) are frequently utilized in relevant research [28,29]. However, these indices predominantly focus on the characteristics of daily extreme rainfall, yet they need to be improved in their ability to accurately quantify the magnitude of such meteorological extremes. Furthermore, they must capture the intricate details of sub-daily scale precipitation processes. Therefore, examining the spatiotemporal characteristics of precipitation at sub-daily, hourly, or finer scales necessitates constructing monitoring and identification indicators designed for these time scales. Notable efforts have been made by existing scholars in hourly precipitation research within the Huang-Huai-Hai Plain [30].
Besides the representation studies on extreme precipitation, significant progress has been made domestically and internationally concerning the mechanisms and features of regional heavy rainstorm events. The large-scale atmospheric circulation system is crucial to extreme precipitation events [19,31,32]. Varied circulation patterns lead to spatiotemporal variations in regional extreme precipitation. For instance, extreme rainfall over the central North China Plain occurs when the Northwestern Pacific subtropical high extends abnormally northward. At the same time, a low-pressure system sits over the low-latitude southern region. Conversely, the interaction between the westward-extending Northwestern Pacific subtropical high and prevailing southwest low-level jet stream results in extreme rainfall over the south for the North China Plain [19]. Aihaiti et al. [33] studied the variations in daily extreme rainfall totals across China during the summers from 1961 to 2015. They noted that when the Interdecadal Pacific Oscillation (IPO) index transitions from its negative phase into a positive one, extreme precipitation decreases in North China while it increases in the Southwest. The Elevated Southern Oscillation Index (SOI) and Pacific Decadal Oscillation (PDO) lead to more frequent heavy rainfall events in Northeast and Eastern China [34]. Moreover, extreme rainfall in various Chinese regions is intrinsically linked to topography. Zhao and collaborators [35] discovered that steep eastern slopes in North China are primarily where intense rainfall occurs, accompanied by high humidity and strong upward motion. This suggests that the combination of moisture convergence and topography amplifies severe rainfall events within the area.
The southwestern region of China, characterized by its unique Karst topography and fragile ecosystem, is a sensitive and vulnerable zone to climate change [36]. Influenced by complex terrain and monsoonal circulations, this area is prone to localized intense precipitation [37,38], making it one of the regions in China with the most significant local variations and complexities in rainfall patterns. Specifically, the Sichuan Basin is a relatively typical, low-altitude, and southern-latitude basin in China. Due to its diverse topography, precipitation varies substantially across the basin. Generally, summer rainfall in the eastern Sichuan Basin significantly exceeds that of the plateau regions to the west, attributed mainly to large-scale atmospheric circulations [39,40]. This phenomenon arises from upper-level short-wave troughs and the expansion of the Western Pacific Subtropical High, which in turn leads to the eastward shift of southwestern vortices [8,41]. Chen et al. [42] pointed out that under the “high-east, low-west” circulation pattern, the persistent activity of mesoscale convective systems (MCSs) is the direct cause of intense rainfall in the Sichuan Basin. Furthermore, orographic gravity waves intensify the ascending branch, enhancing precipitation in this area. Dong and colleagues [15] proposed that extreme rainfall in the Sichuan Basin is predominantly attributed to the vertical wind shear generated by both the Tibetan Plateau vortex and the southwestern vortex. Furthermore, the interplay between the Tibetan Plateau vortex and the southwestern vortex triggers intensified deep convection, ultimately amplifying precipitation levels in the Sichuan Basin, further enriched by the substantial moisture contributed by the southwestern vortex in the mid-to-lower atmosphere over the basin.
Despite extensive research examining the causes and mechanisms behind intense precipitation within the Sichuan Basin, most of this research emphasizes daily-scale data, offering scant attention to events of extreme rainfall that occur on an hourly timeframe. The impact of short-duration intense rainfall cannot be underestimated and may even far exceed the damage caused by strong precipitation at other time scales. For instance, on 2 July 2018, a short-duration downpour occurred in Pujiang, Chengdu, with a maximum hourly rainfall reaching 107.8 mm, resulting in severe flooding and submersion of multiple areas. To address this gap, the present study employs data on precipitation at an hourly granularity to unveil the patterns of intense hourly rainfall events throughout the day, and the climatic factors influencing the occurrence of such events. The aim is to quantitatively identify and interpret the climatic conditions under which extreme hourly precipitation events occur in the Sichuan Basin. By revealing the genesis and evolutionary process of torrential rains, this study seeks to enhance the precision and promptness of disaster alerts. Furthermore, the objective is to establish a scientific basis for future climate change adaptation and the formulation of long-lasting strategies that promote sustainable progress.

2. Materials and Methods

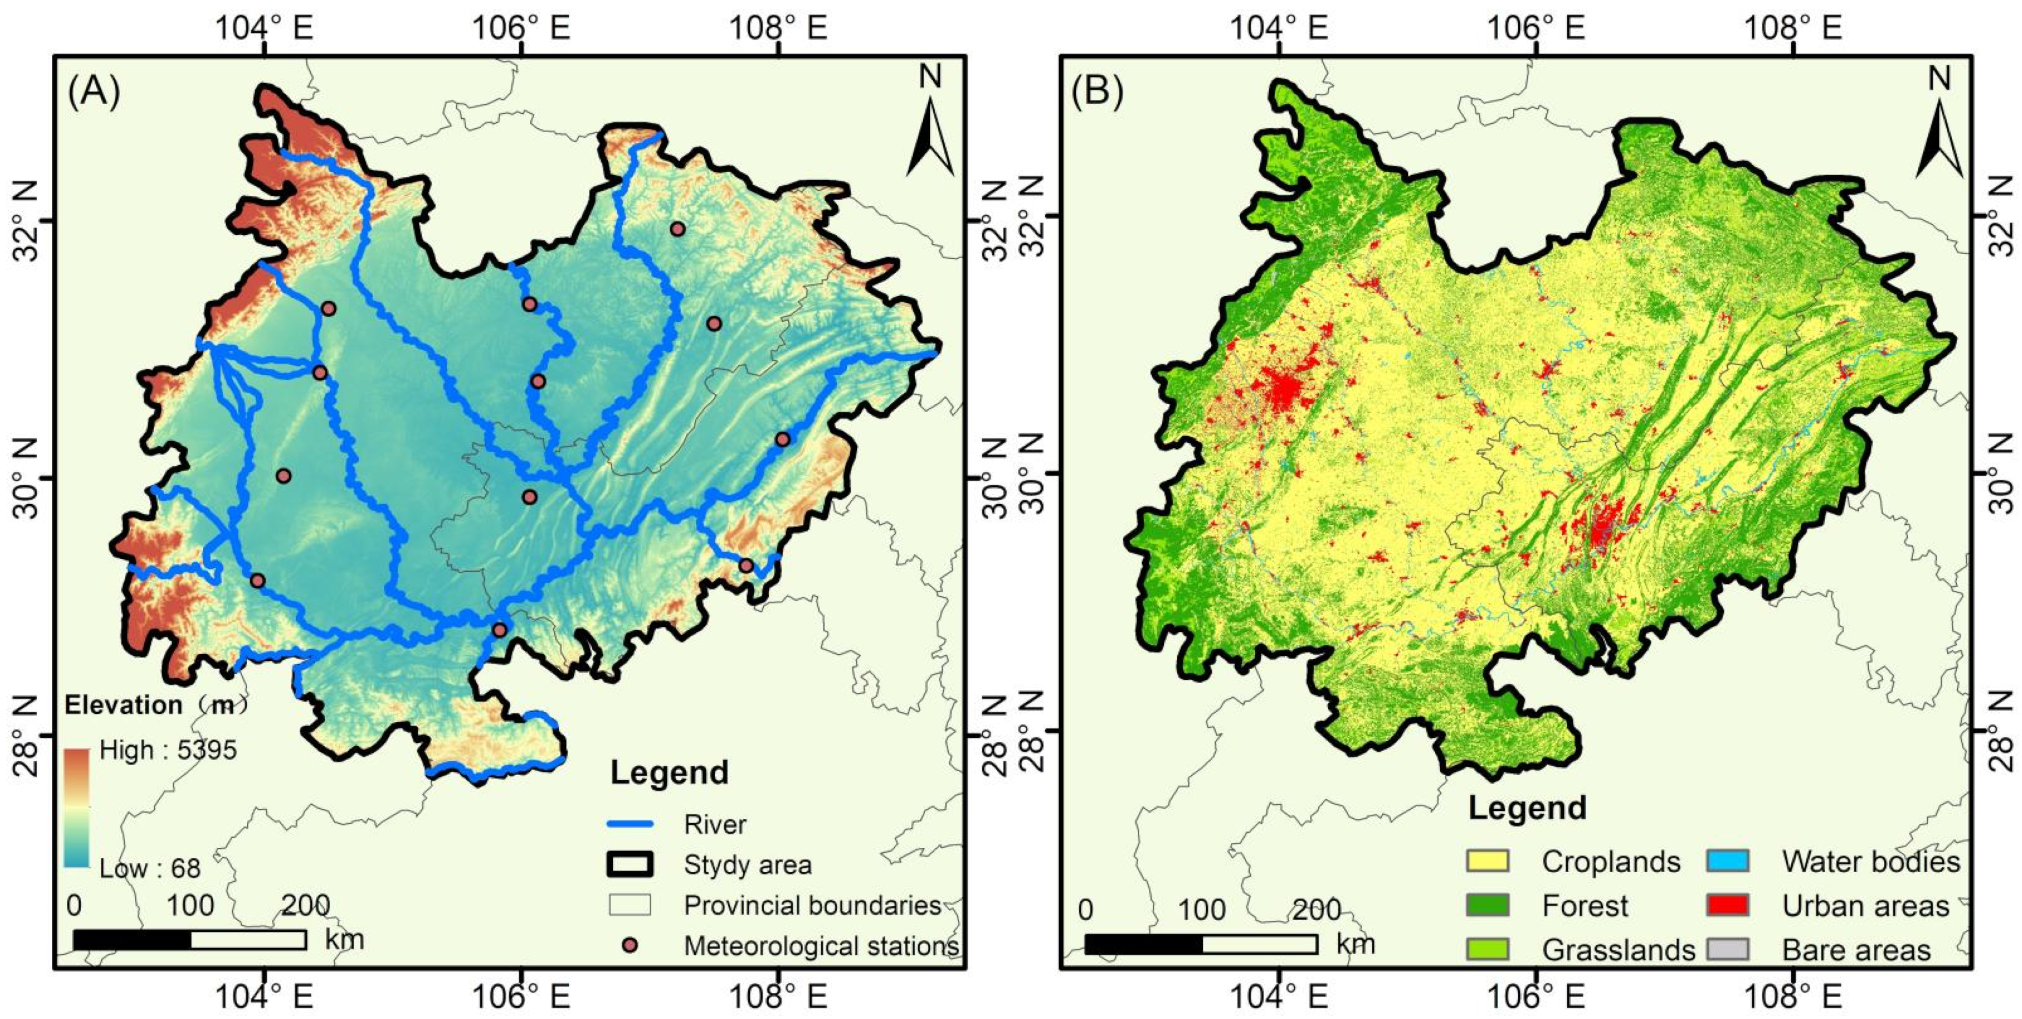
2.1. Overview of the Study Area

Figure 1 displays the Sichuan Basin’s geographical position, bordered by the Tibetan Plateau on the eastern side, the Yunnan-Guizhou Plateau to the north, the Wushan Mountain Range on the western side, and the Daba Mountains to the south [43]. It spans an area of 260,000 km2. The basin is primarily composed of peripheral mountains and a basin floor. The elevations of the peripheral mountains range from approximately 1000 to 3000 m, covering an area of around 100,000 km2. The geographic feature makes the enclosed basin unfavorable for horizontal transportation or vertical diffusion [44,45,46]. The basin floor features low-lying terrains with elevations ranging from 250 to 750 m and covers about 160,000 km2. It is a mosaic of hills and plains, and the area is predominantly categorized into three distinct regions: Eastern Sichuan with its parallel ridges and valleys; Central Sichuan with its hilly terrain; and Western Sichuan, encompassing the Chengdu Plain. These divisions are delineated by Longquan Mountain and Huaying Mountain, respectively [43]. The Sichuan Basin experiences an annual rainfall of about 1000 to 1300 mm, with a notable 70–75% of the total precipitation concentrated in the period spanning from June to October. The maximum daily rain can reach 300–500 mm, with peripheral mountains receiving relatively abundant rainfall. The basin floor exhibits high relative humidity year-round, characterized by frequent fog and overcast conditions.

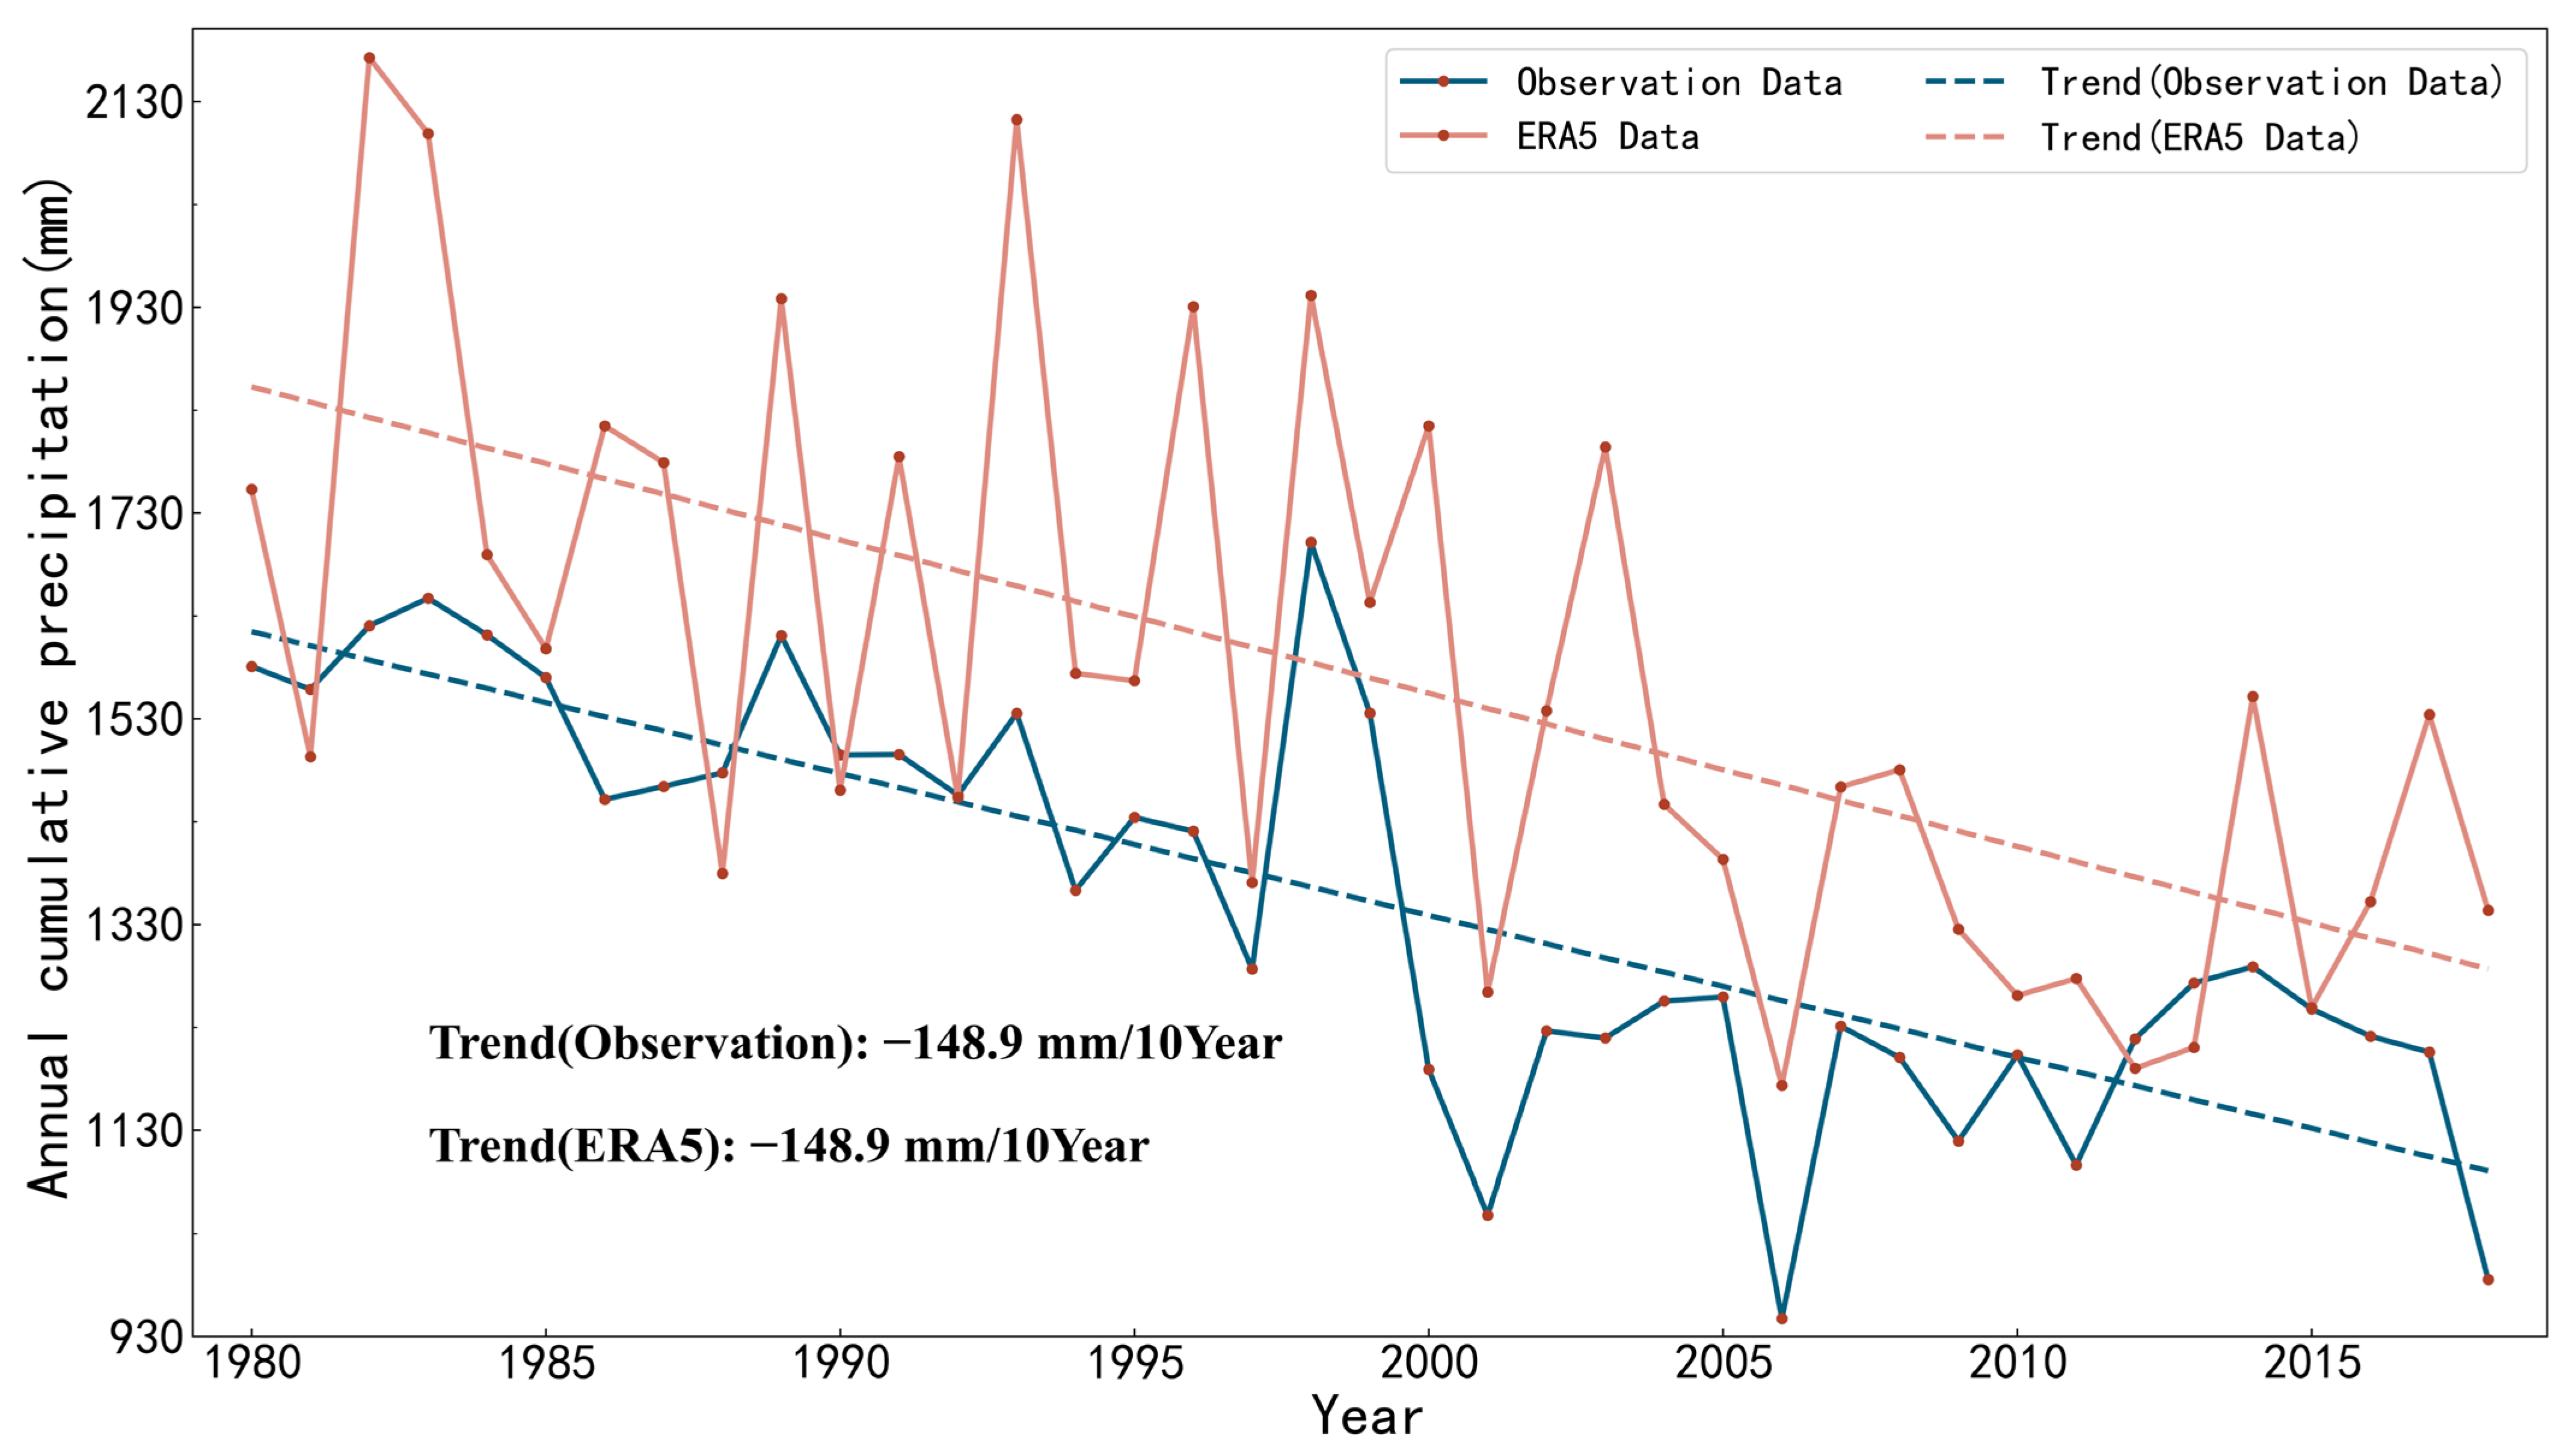
2.2. Data Introduction

2.2.1. NDVI Data and Their Processing

The purpose of data processing was to amalgamate and process NDVI (normalized difference vegetation index) datasets harvested from two separate satellite imaging systems: the Advanced Very High-Resolution Radiometer (AVHRR) and the Moderate Resolution Imaging Spectroradiometer (MODIS). Through the integration of these varied data sources, the temporal scope of the NDVI dataset has been expanded to cover records from 1982 to 2016, thus offering a rigorous and holistic set of NDVI values suitable for ecology and environmental science studies. The AVHRR dataset, from 1982 to 2010, was sourced from NASA’s Goddard Space Center. Conversely, the data for MOD09GA, a daily surface reflectance product, were acquired from NASA’s MODIS Terrestrial Product Division. This dataset spans from 2010 to 2021.
In terms of data preprocessing to ensure homogeneity and reliability, a variety of specialized techniques were employed. The AVHRR set included actions such as radiometric calibration, cloud detection, subsequent removal, atmospheric interference adjustments, addressing satellite drift, and applying BRDF (Bidirectional Reflectance Distribution Function) computations. In the context of the MOD09GA dataset, a series of preparatory steps were undertaken, including but not limited to quality verification, image stitching, data subsetting, and modifications in data format and projection. Such practices were indispensable for procuring a unified and reliable NDVI dataset ripe for further analytical exploration.
To aggregate the daily observations into ten-day and monthly data, we utilized the maximum value composites (MVC) methodology. This approach was crucial in mitigating the influence of clouds and other forms of noise within the daily images, thereby enhancing the fidelity of the vegetation behavior throughout the study.

2.2.2. Meteorological Data Processing and Preparatory Steps

This paper utilizes precipitation data from ground observations as displayed in Figure 1, along with ERA5 data. In the data preprocessing stage, quality control of the data is conducted, encompassing checks for boundary values, handling of outlier data and verification of time consistency. Additionally, during the data processing procedure, the Coordinated Universal Time (UTC) of ERA5 is converted to local time. To avoid trend bias in the extreme precipitation characteristics of ERA5 data, strict quality control is essential for quantifying any potential trend bias within ERA5 data [47,48]. This study compares ERA5 precipitation data and ground meteorological station observations from 1980 to 2021. The corresponding results are presented in Figure 2. Given precipitation data available and the principle of maintaining uniform distribution of stations(a total of 12, with station numbers 56198, 57314, 57320, 56296, 57411, 57328, 56297, 57510, 57437, 56389, 57603, 57525), the validation of ERA5 data bias could be conducted with a limited set of accessible observation sites. The findings reveal minor variations in precipitation values between ERA5 precipitation data and ground station observations; however, the overall trends remain highly congruent. This consistency underscores the temporal reliability of ERA5 precipitation data. Building upon this observation, the study employs ERA5 precipitation data to investigate extreme hourly rainfall patterns in the Sichuan Basin.
The figure illustrates that the overall trend of cumulative annual precipitation from both ground station observed data and ERA5 precipitation data aligns perfectly. To further validate the correlation between these data sets, the authors calculated the Pearson correlation coefficient, with the results as follows:
Table 1 shows a correlation coefficient of 0.79, signifying a robust positive correlation between the two data sets. Furthermore, the p-value is well below 0.01, indicating a significant correlation. In summary, both Figure 2 and Table 1 demonstrate the scientific validity of utilizing ERA5 precipitation data in this research.

2.3. Methods

This study initially constructs eight indices related to extreme precipitation. Subsequently, it employs the Sen slope, Mann–Kendall, and correlation coefficient approaches to quantitatively analyze the spatiotemporal variation patterns of intense hourly rainfall in the Sichuan Basin.

2.3.1. Indices for Identifying Extreme Precipitation

Referring to the indices established in existing studies on hourly precipitation, this research formulates that eight indices have been formulated to depict the attributes of extreme hourly precipitation events within the Sichuan Basin [30]. This research sets thresholds for extreme precipitation events at different temporal scales based on percentile methods [49]. Initially, ascending-order sorting is applied to all daily precipitation data that exceeds or equals 0.1 mm, and the threshold for identifying extreme precipitation at the daily scale is established using the 95th percentile, denoted as R95daily. Similarly, hourly precipitation data exceeding 0.1 mm are subjected to the same procedure, and the 95th percentile (R95hourly) is employed as the criteria for determining extreme rainfall at the hourly scale. These selected thresholds are used to construct an index system that describes extreme precipitation events across various time scales. For comprehensive definitions and in-depth explanations of the eight precipitation indices, please refer to Table 2.

2.3.2. Sen’s Slope Estimation Method

To further investigate the magnitude of temporal variations in the time series, it is necessary to calculate their changing trends. Compared to ordinary linear regression, the Sen’s slope can eliminate the influence of outliers on the slope calculation, without the need for the time series to adhere to a normal distribution. It also allows for the existence of outliers and missing values, offering significant advantages. The calculation formula for Sen’s slope is given below.
β = m e d i a n ( x i x j i j )
In the equation, the term “median” denotes the function that calculates the median, while the symbol indicates the direction of evolution in the time series. A positive value (>0) signifies an ascending trend, with a larger value indicating a stronger upward pattern. Conversely, a negative value (<0) indicates a descending trend, with a lower value denoting a more conspicuous decrease.

2.3.3. Mann–Kendall (M-K) Method

The M-K method serves as an efficient tool for analyzing both gradual and sudden variations within time series datasets. Unlike other methods, it does not require specific sample distributions and is minimally influenced by anomalous data points. Additionally, its computational requirements are straightforward. The sequence for executing an M-K test consists of the subsequent steps:
S k = i = 1 k r i         ( k = 2 , 3 , , n )
Based on the assumption of temporal random independence, the parameter is delineated in the following manner:
U F k = [ s k E ( s k ) ] V a r ( s k )         ( k = 1 , 2 , , n )
where U F 1 = 0 , the statistical values E ( s k ) and V a r ( s k ) represent the average and variance of the accumulated sum of S k , and their computation follows the equation provided below, assuming that x 1 , x 2 , , x n are mutually independent and follow the same continuous distribution.
E s k = n ( n + 1 ) 4
V a r s k = n ( n + 1 ) ( 2 n + 5 ) 72

2.3.4. Maximum Value Composites (MVC)

The concept of MVC encompasses a specific formulation for this method as articulated in the following [50,51].
N D V I i = M a x ( N D V I i j ) ,
where N D V I i denotes the NDVI in the ith month or the ith year, and N D V I i j signifies the NDVI data for the jth day in the ith month or the jth month in the ith year.

2.3.5. Correlation Coefficient

The Pearson correlation coefficient provides insight into the degree of linear association between two variables. It ranges from −1 to 1. To compute the correlation coefficient, the following steps are undertaken:
r = i = 1 n ( X i X ¯ ) ( Y i Y ¯ ) i = 1 n ( X i X ¯ ) 2 i = 1 n ( Y i Y ¯ ) 2
As the absolute value of the Pearson coefficient approaches 1, the correlation between the two variables becomes stronger. When the coefficient is greater than 0, a positive linear relationship exists between the variables; when it is less than 0, a negative relationship exists. The coefficient’s significance is typically evaluated using a t-test. The t-statistic is calculated using the following formula:
t = r ( 1 r 2 ) ( n 2 )
In this case, the t-statistic adheres to a t-distribution characterized by n − 2 degrees of freedom. After conducting a two-tailed t-test at p = 0.05, the specific critical value for t can be found in a t-distribution table. If the computed t value exceeds this critical threshold, the correlation between the two variables is deemed statistically significant; otherwise, it is not significant.

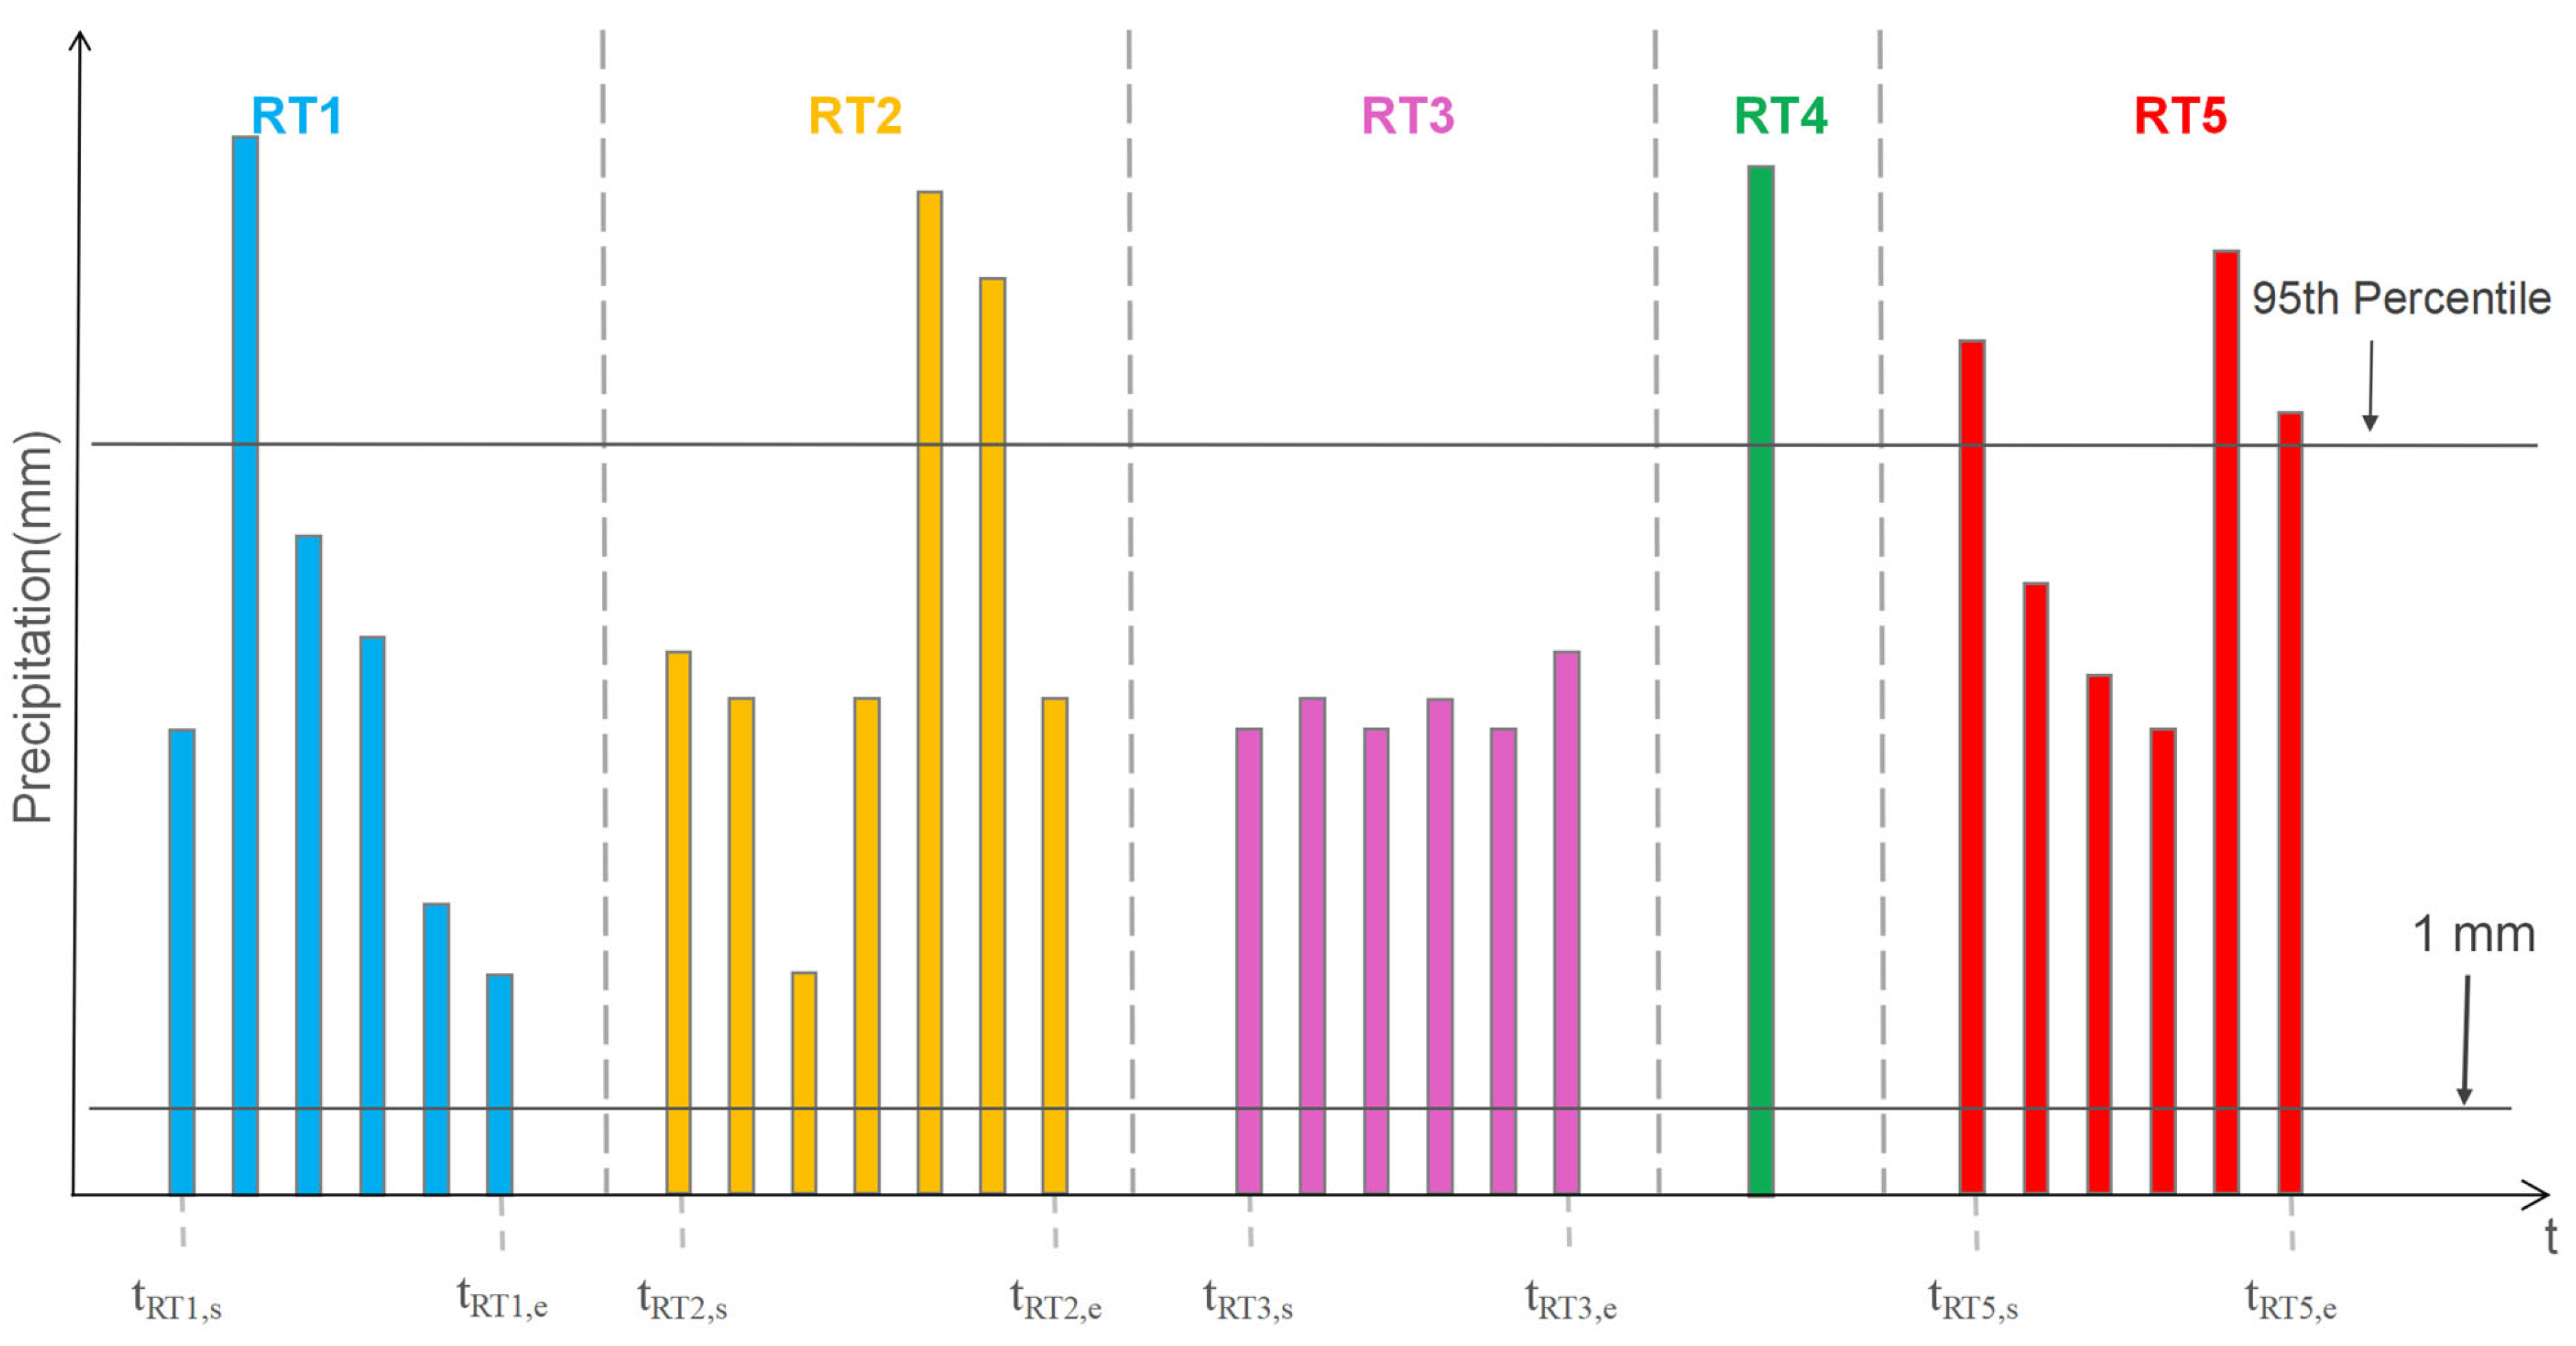
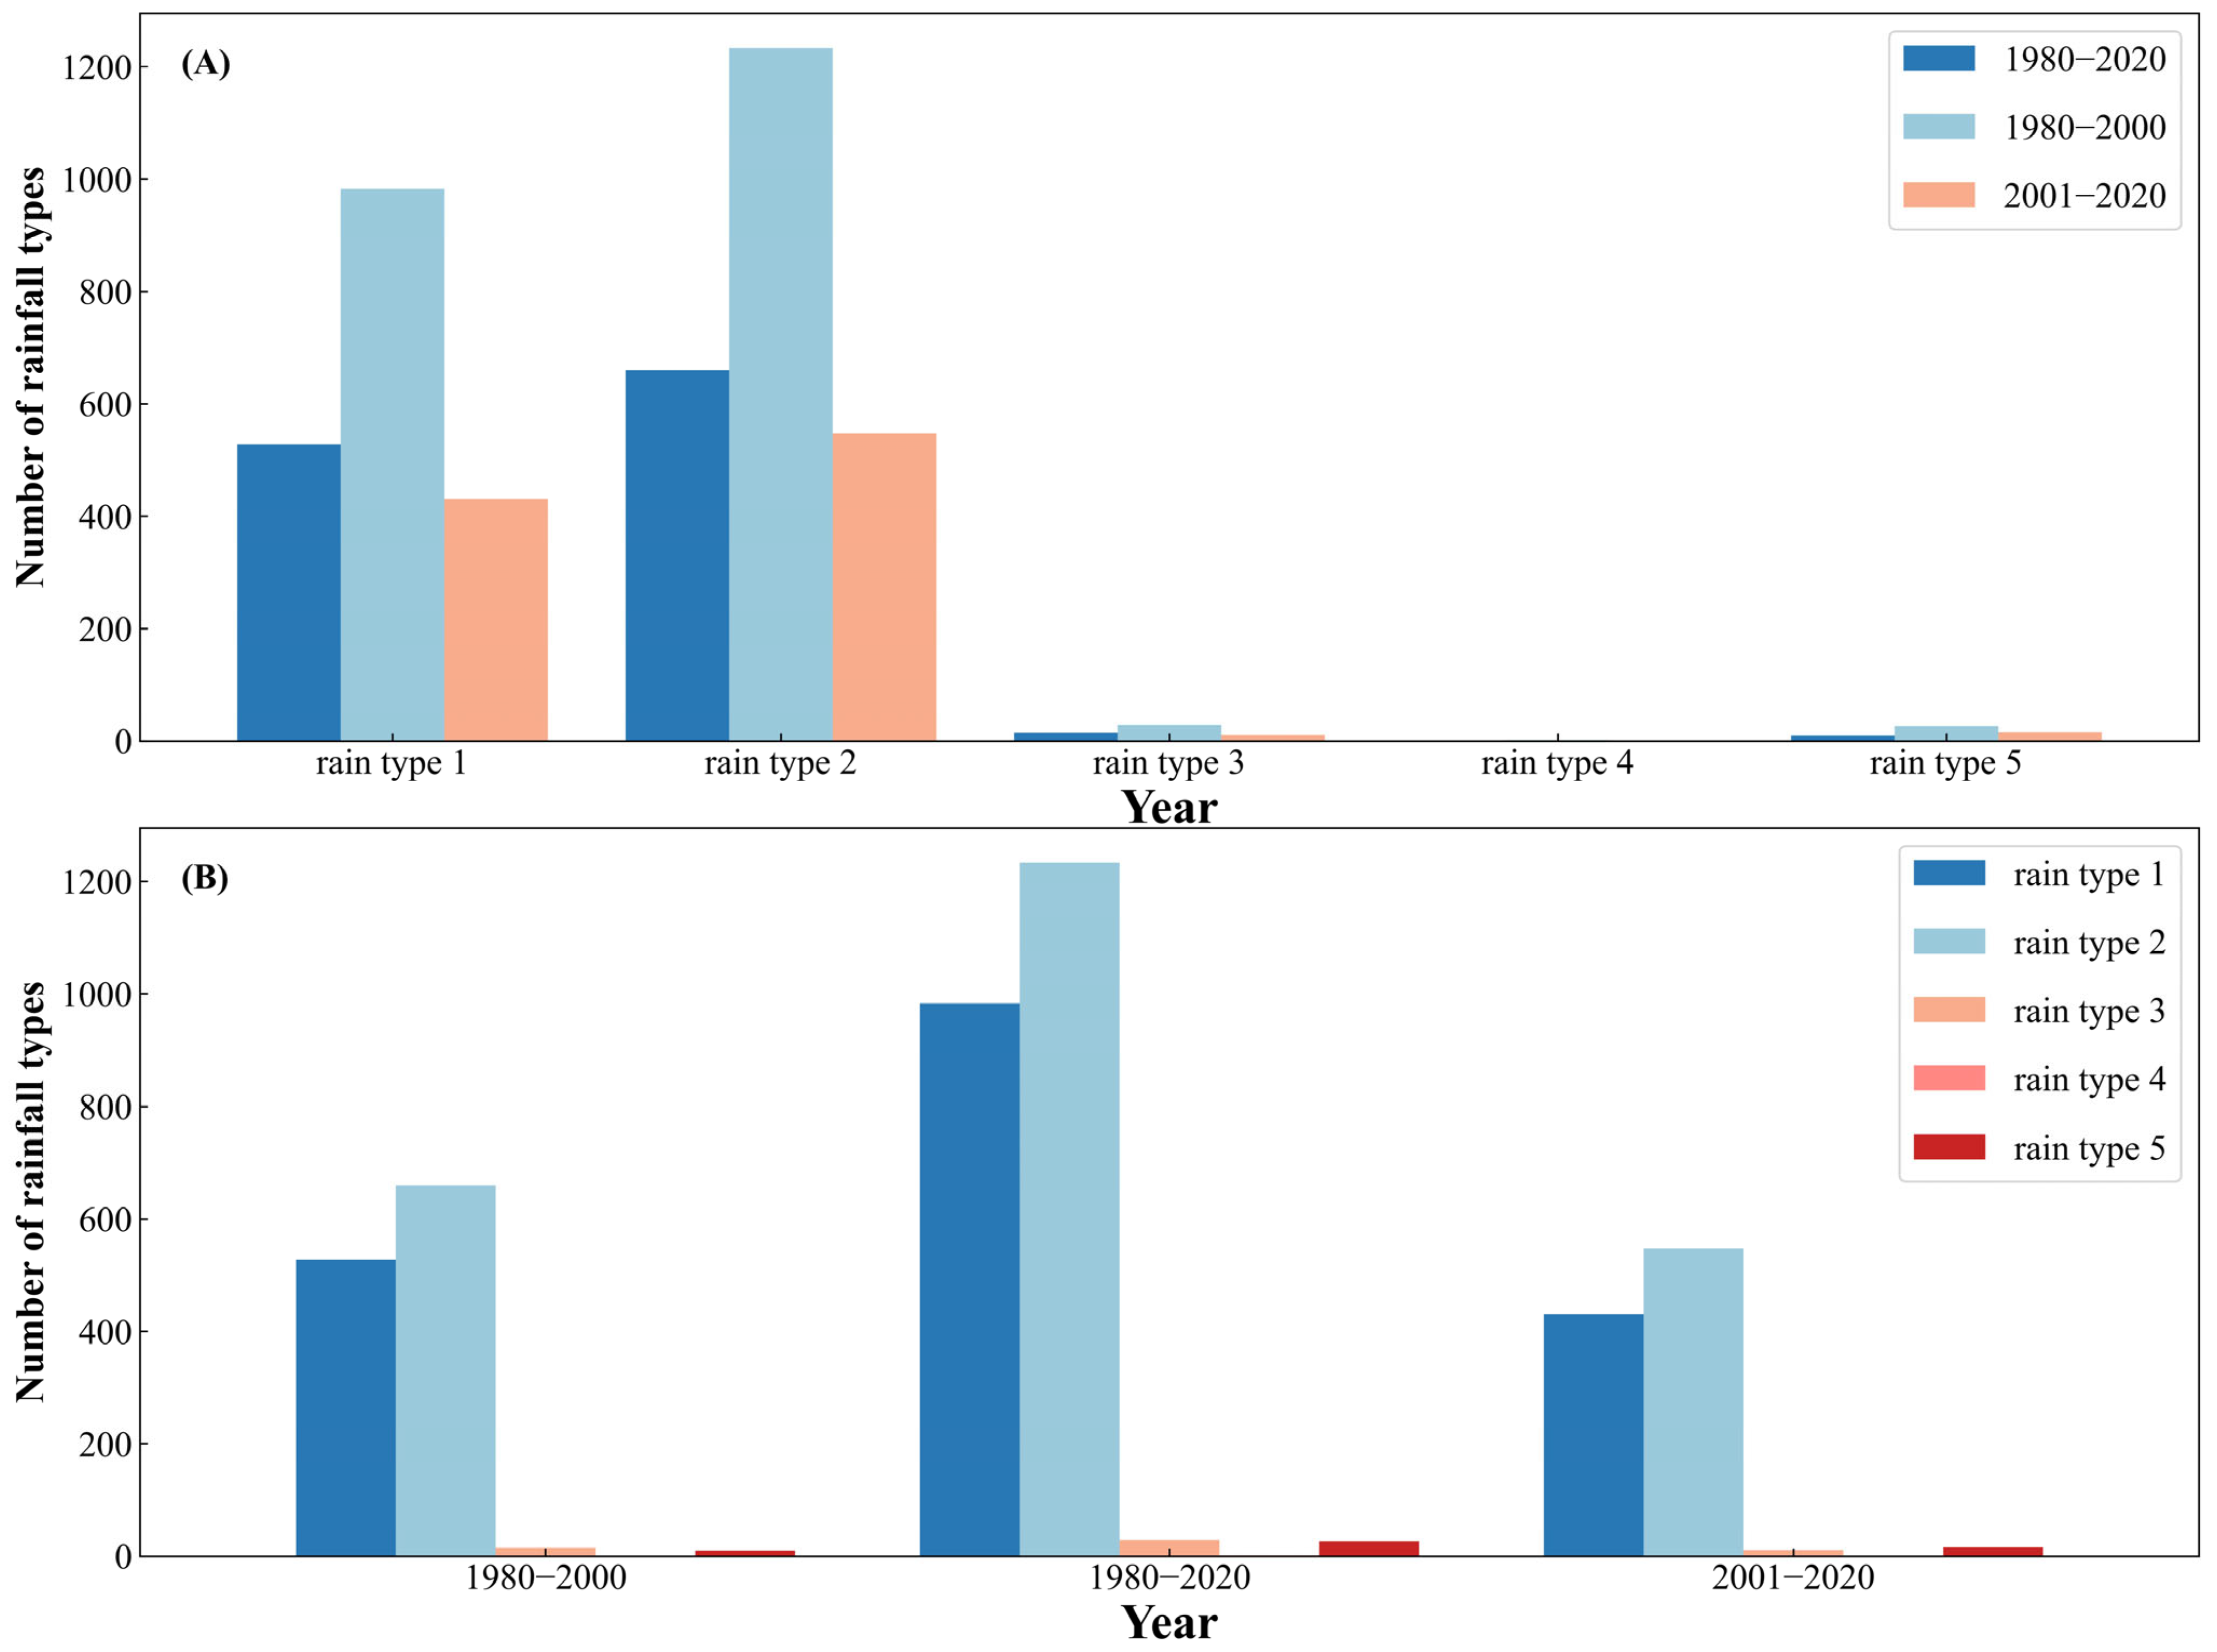
2.3.6. Rainfall Pattern Identification

Based on related research [52], rain events with a total rainfall exceeding 50 mm are selected as storm events for analysis. Each storm event’s entire duration is divided into ten equal parts (equivalent to 10% of the total rainfall duration), and the precipitation amount for each piece is calculated as a percentage of the total rainfall amount. Utilizing this method to analyze the storm events in the Sichuan Basin from 1980 to 2018 that meet the criteria, five types of rainfall processes are identified. One can recognize each storm event as one of the following five rainfall pattern types: Type I is the Early-Heavy pattern, Type II is the Late-Heavy pattern, Type III is the Balanced pattern, Type IV is the Single-Day pattern, and Type V is the Dual-Peak pattern. The model identification method is employed to categorize the historical storm events into these rainfall pattern types (Figure 3).

2.3.7. Fuzzy Recognition Method

We employ the fuzzy recognition method [53], using the percentage of rainfall amount in each time segment relative to the total rainfall to characterize the rainfall pattern indicators for a particular precipitation event. Initially, we construct a pattern matrix for five types of rainfall patterns. Then, we compare each actual precipitation event with the five ways and apply the principle of maximum membership degree to determine the final rainfall pattern for the precipitation event.
The proportion of rainfall amount in each time segment to the total rainfall is as follows:
x i = H i / H Z ( i = 1 , 2 , , m )
In the formula, H i represents the rainfall amount for each time segment; H Z represents the total rainfall amount. We use x i as the rainfall pattern indicator for this precipitation event, and represent it as a vector.
X = ( x 1 , x 2 , , x n )
Similarly, the five pattern types are also represented using this indicator:
V k = ( v k 1 , v k 2 , , v k m )             ( k = 1 , 2 , 3 , 4 , 5 )
In the equation, the meaning of v k i and the x i are the same. The five patterns can also manifest in matrix form. Once established, one can calculate the maximum membership degree of each rainfall event to the five patterns.
σ k = 1 1 m i = 1 m ( v k i x i ) 2             ( k = 1 , 2 , 3 , 4 , 5 )
According to the principle of proximity, if the kth membership degree σ k is the maximum, the rainfall event belongs to the kth rainfall pattern. The program automatically performs the task of classifying rainfall patterns, avoiding judgment errors associated with the manual.

3. Results

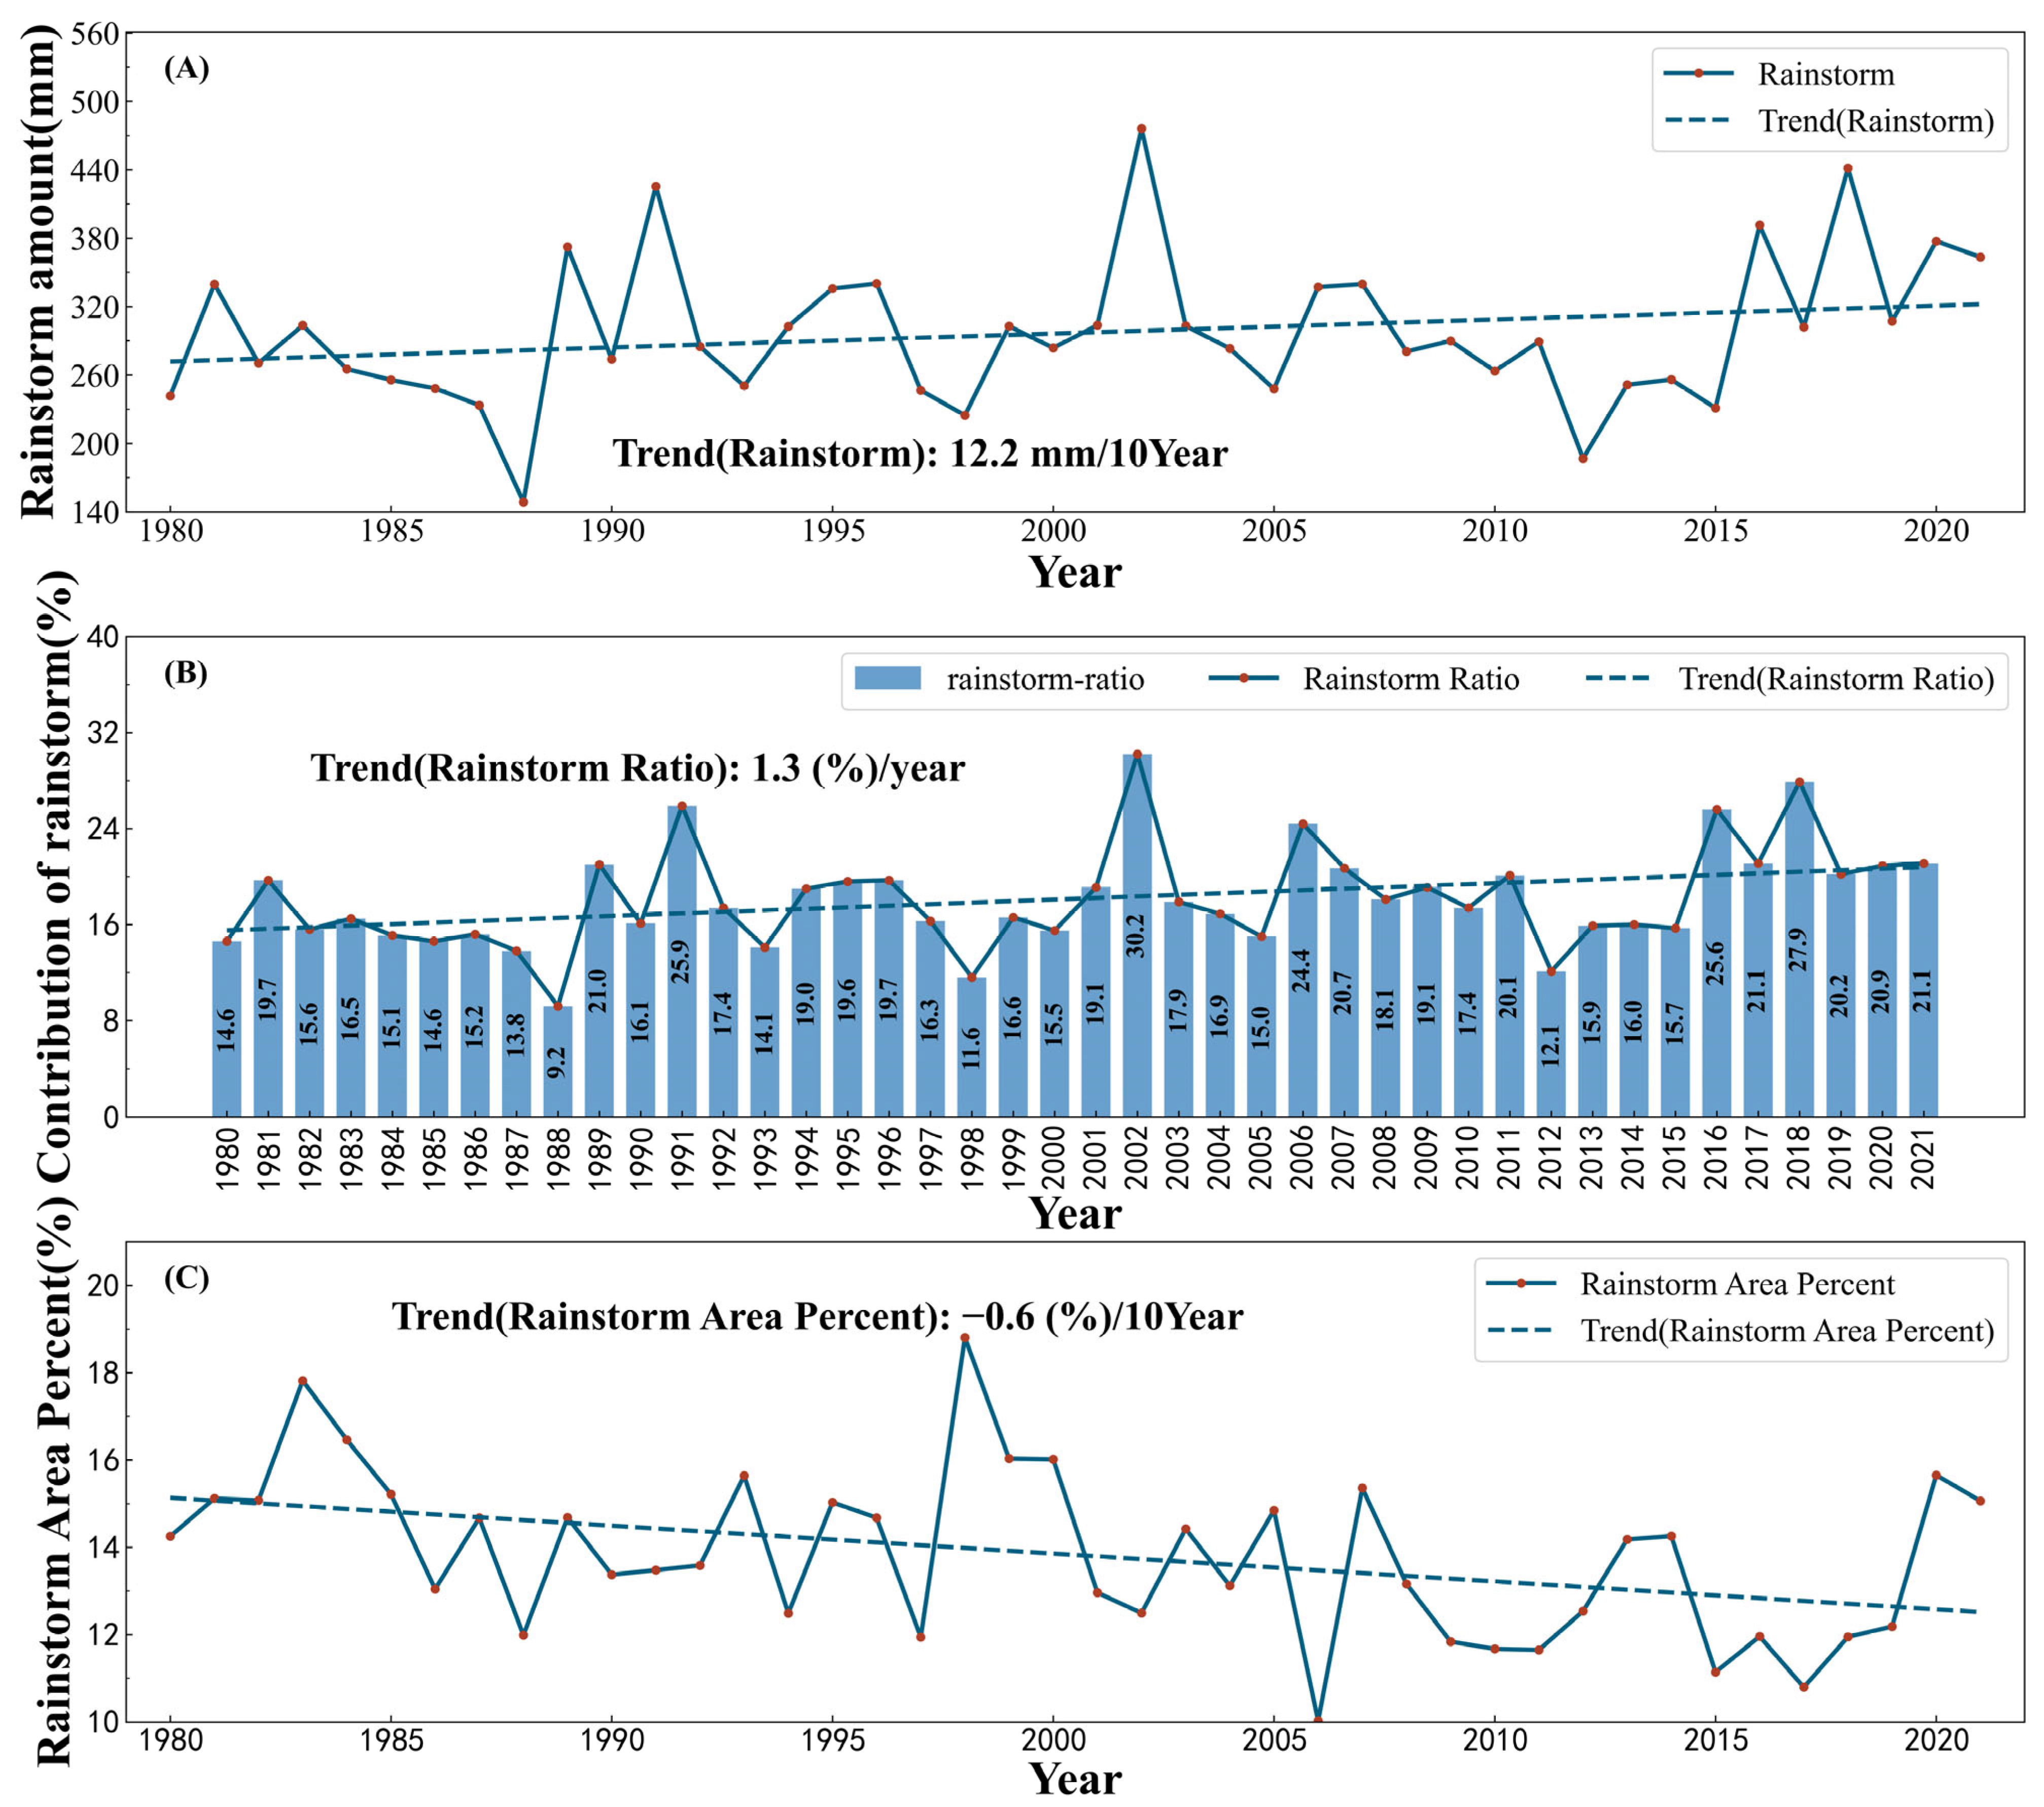
3.1. Examining Daily Scale Extreme Precipitation Patterns

Figure 4 depicts the spatial pattern of daily scale extreme rainfall in the Sichuan Basin. According to the multiyear average precipitation spatial distribution in the Sichuan Basin (Figure 4A), areas with higher elevations at the basin’s edge receive more rainfall, while the basin floor experiences less, which generally aligns with the topographical variations. Rain demonstrates a longitudinal distribution in the central basin area, with the eastern part receiving more rainfall than the western part. The average extreme rainfall presents a latitudinal distribution across the Sichuan Basin (Figure 4B), revealing an increasing trend from southwest to northeast. The northeastern region experiences higher amounts of extreme rainfall than the southwestern region, with the lowest amounts observed in the mountains on the northwestern side of the basin, likely influenced by topographic factors. Concerning the proportion of extreme rainfall concerning total precipitation(Figure 4C), this ratio also follows a latitudinal distribution pattern, with the northern part of the region being higher than the southern part and a notably lower proportion of extreme rainfall in the southwestern direction of the basin.
To obtain a more comprehensive insight into the temporal variations of daily extreme precipitation within the Sichuan Basin, Figure 5 presents the time series of total torrential rainfall (Figure 5A), the proportion of heavy rainfall contribution (Figure 5B), and the portion of the region affected by intense rainfall relative to the total area (Figure 5C) spanning the period from 1980 to 2021. The figure reveals that over the past 40 years, heavy rainfall in the Sichuan Basin has shown an upward trend (12.2 mm/decade), fluctuating between 140 and 500 mm, with notable interannual variability. The contribution rate of heavy rainfall generally exceeds 10% and exhibits an increasing trend (1.3 (%)/year), with relatively moderate annual fluctuations. Conversely, the fraction of the total area impacted by heavy rainfall displays a declining trend (−0.6 (%)/decade), oscillating between 10% and 20%. These findings point to increased heavy rain with heightened intensity, highlighting a growing trend in extreme weather events.
Figure 6 illustrates the features of extreme heavy rainfall frequency, intensity, and dispersion in the Sichuan Basin from 1980 to 2021. Shown in Figure 6, the frequency of intense rainfall events fluctuates within the range of 75–120 and exhibits an overall decreasing trend (−1.2 events/year). Combined with the rising total heavy rainfall observed in Figure 6A, this suggests that the intensity of heavy rain is increasing, thereby escalating the degree of associated risks. The intensity of extreme rainfall shows an upward trend (0.16 (mm/h)/decade), peaking close to 5 mm/h in 2012, consistent with the inference from Figure 6A. Figure 6C represents the dispersion of extreme rainfall, oscillating within the range of [0.15, 0.4], with a relatively gentle declining trend (−0.003/decade). Although the frequency of severe rainstorm events is falling, the intensity is rising. Moreover, heavy rainfall events are becoming more concentrated, increasing the severity of the hazards they trigger.

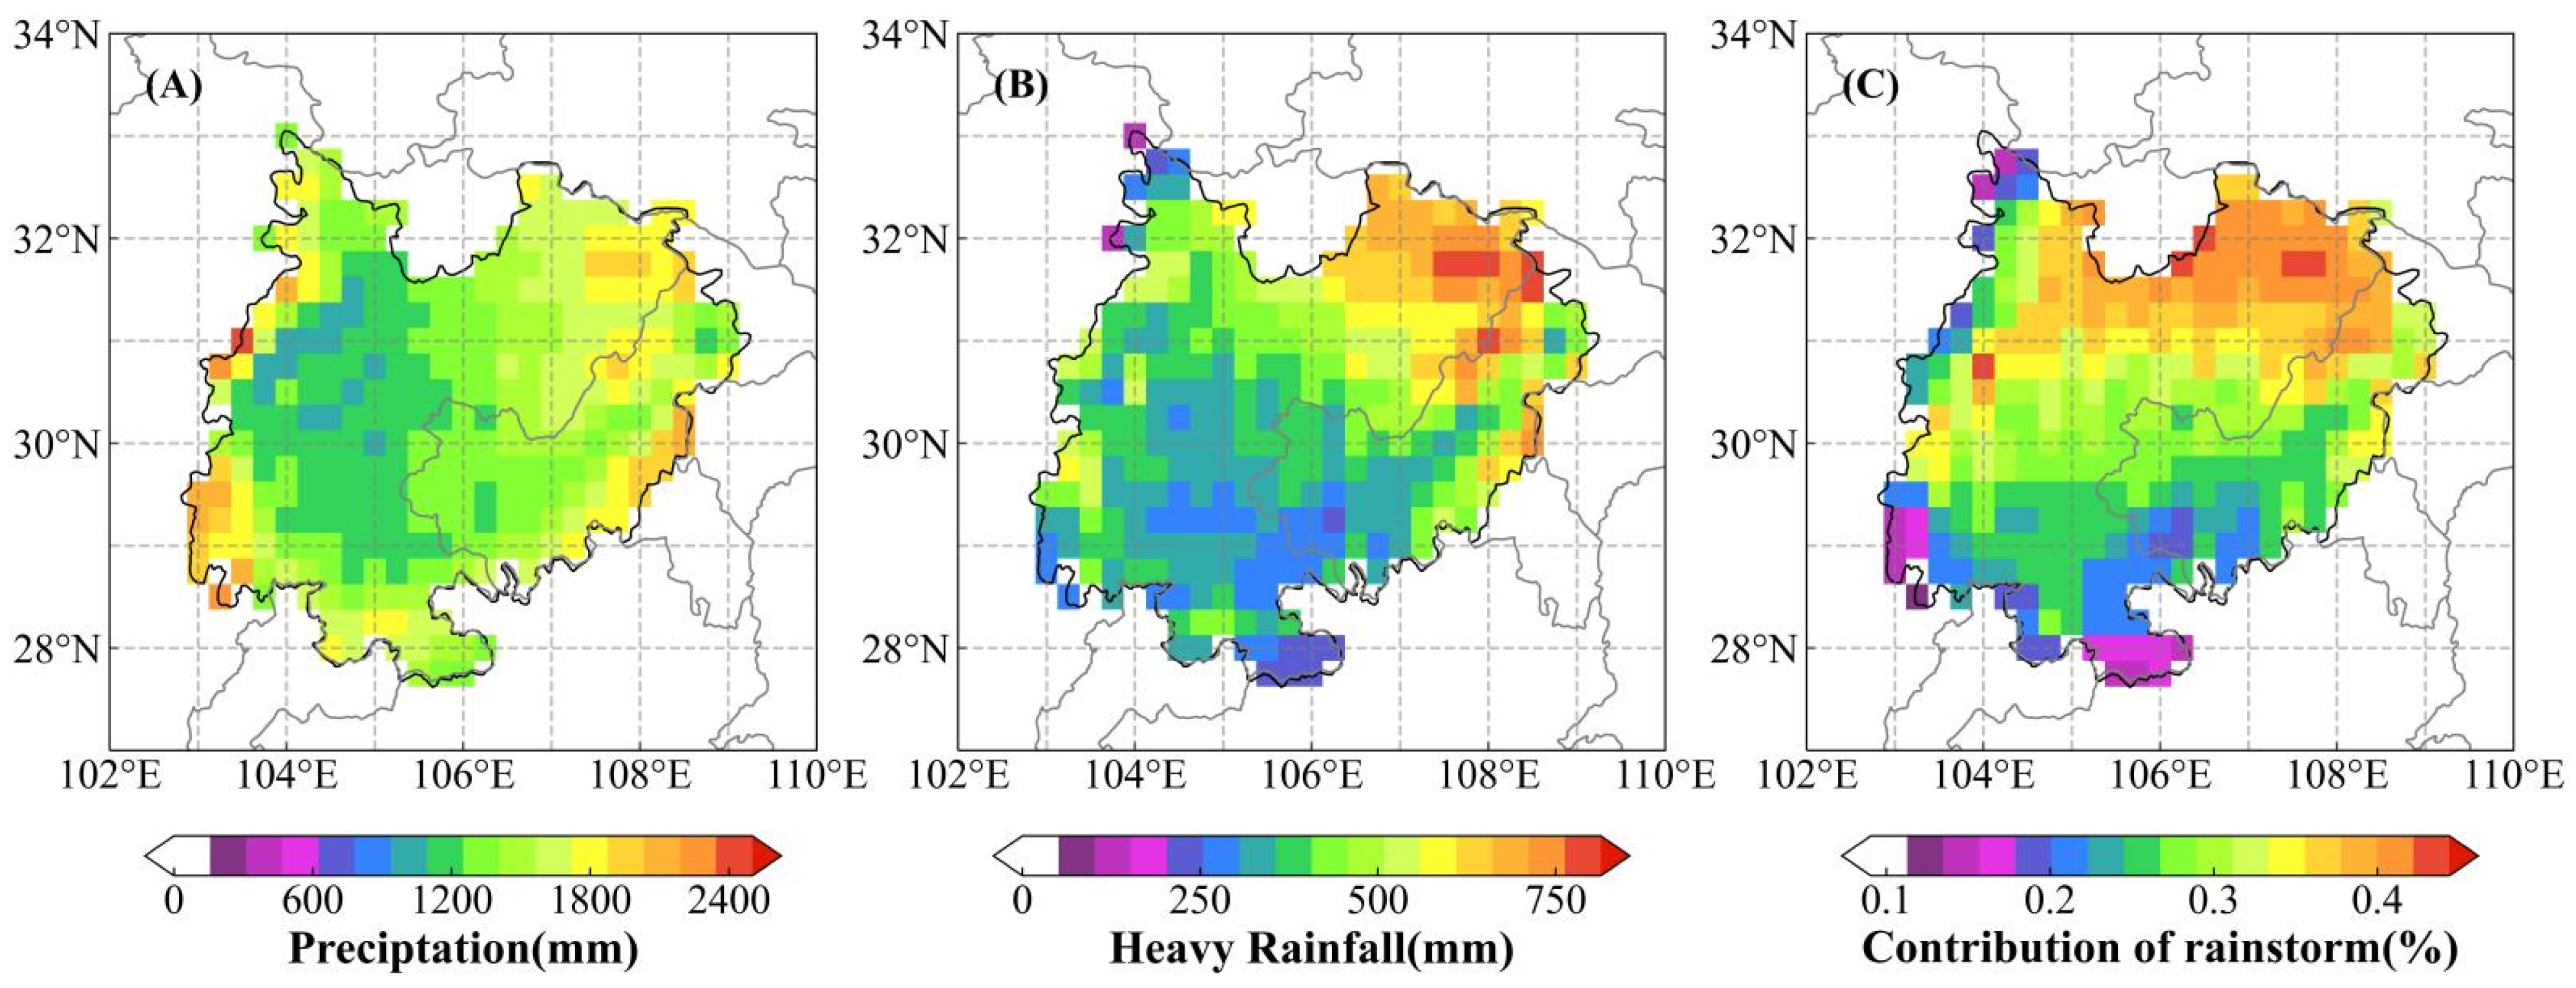
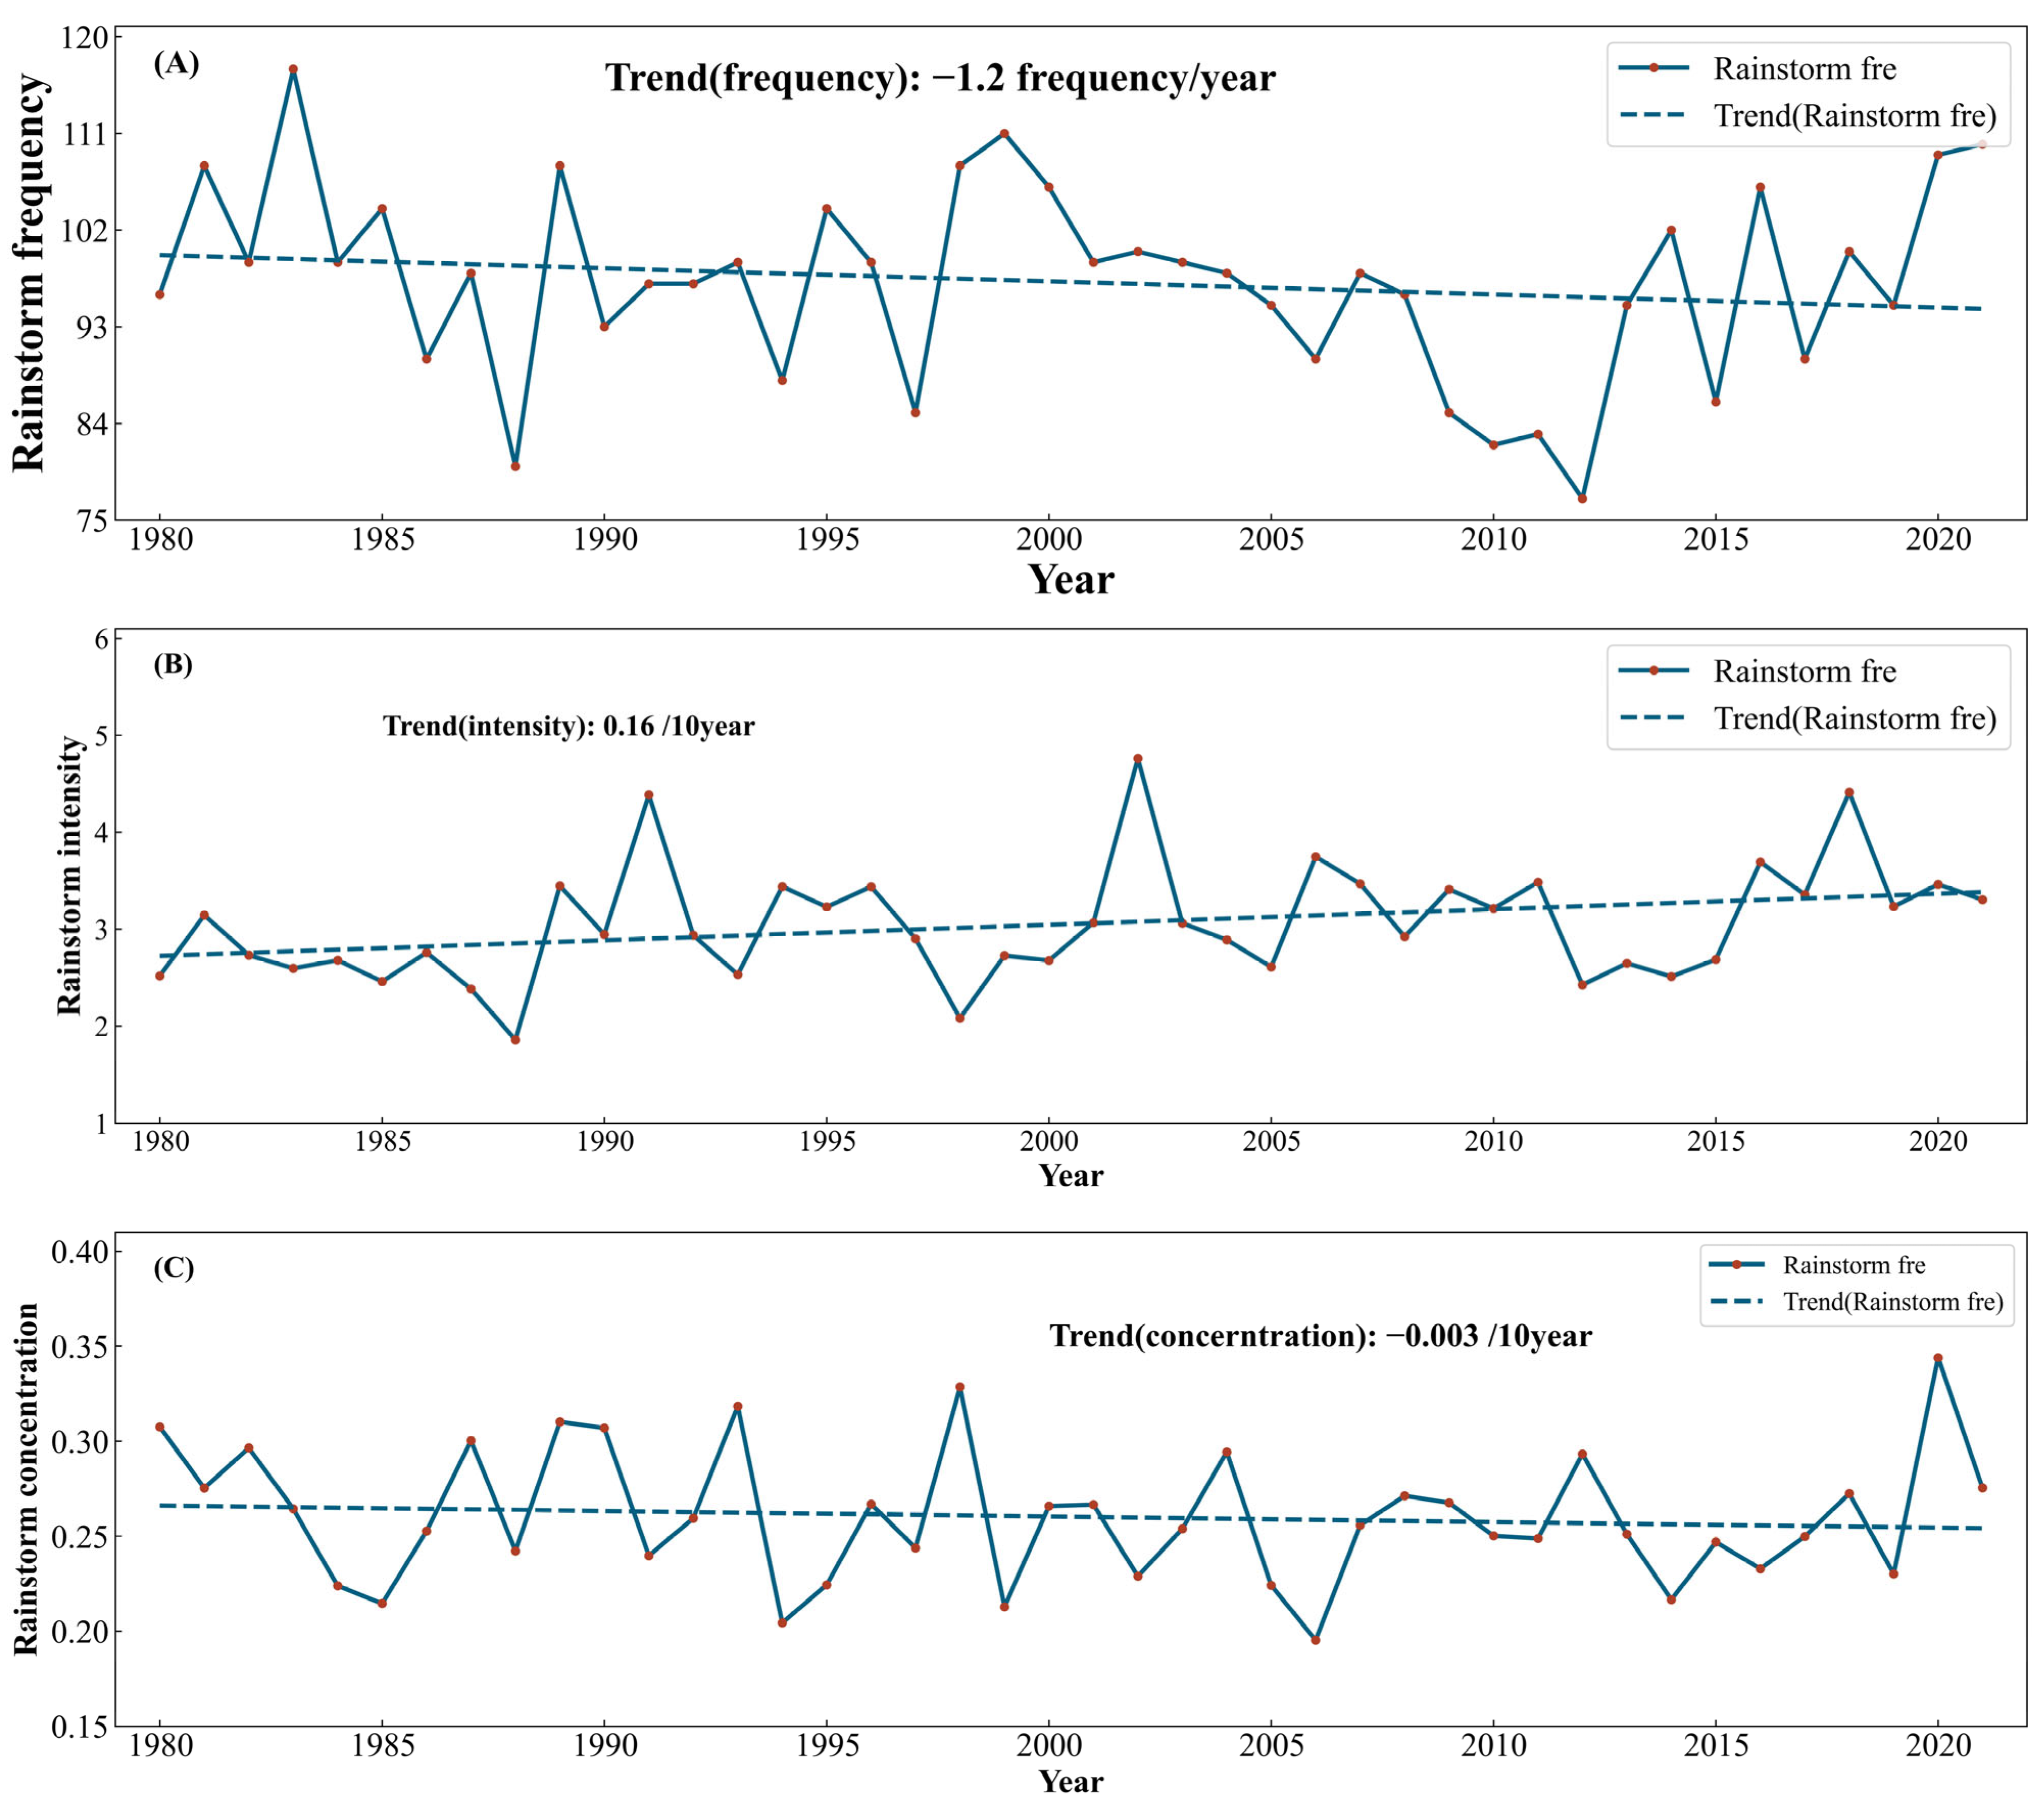
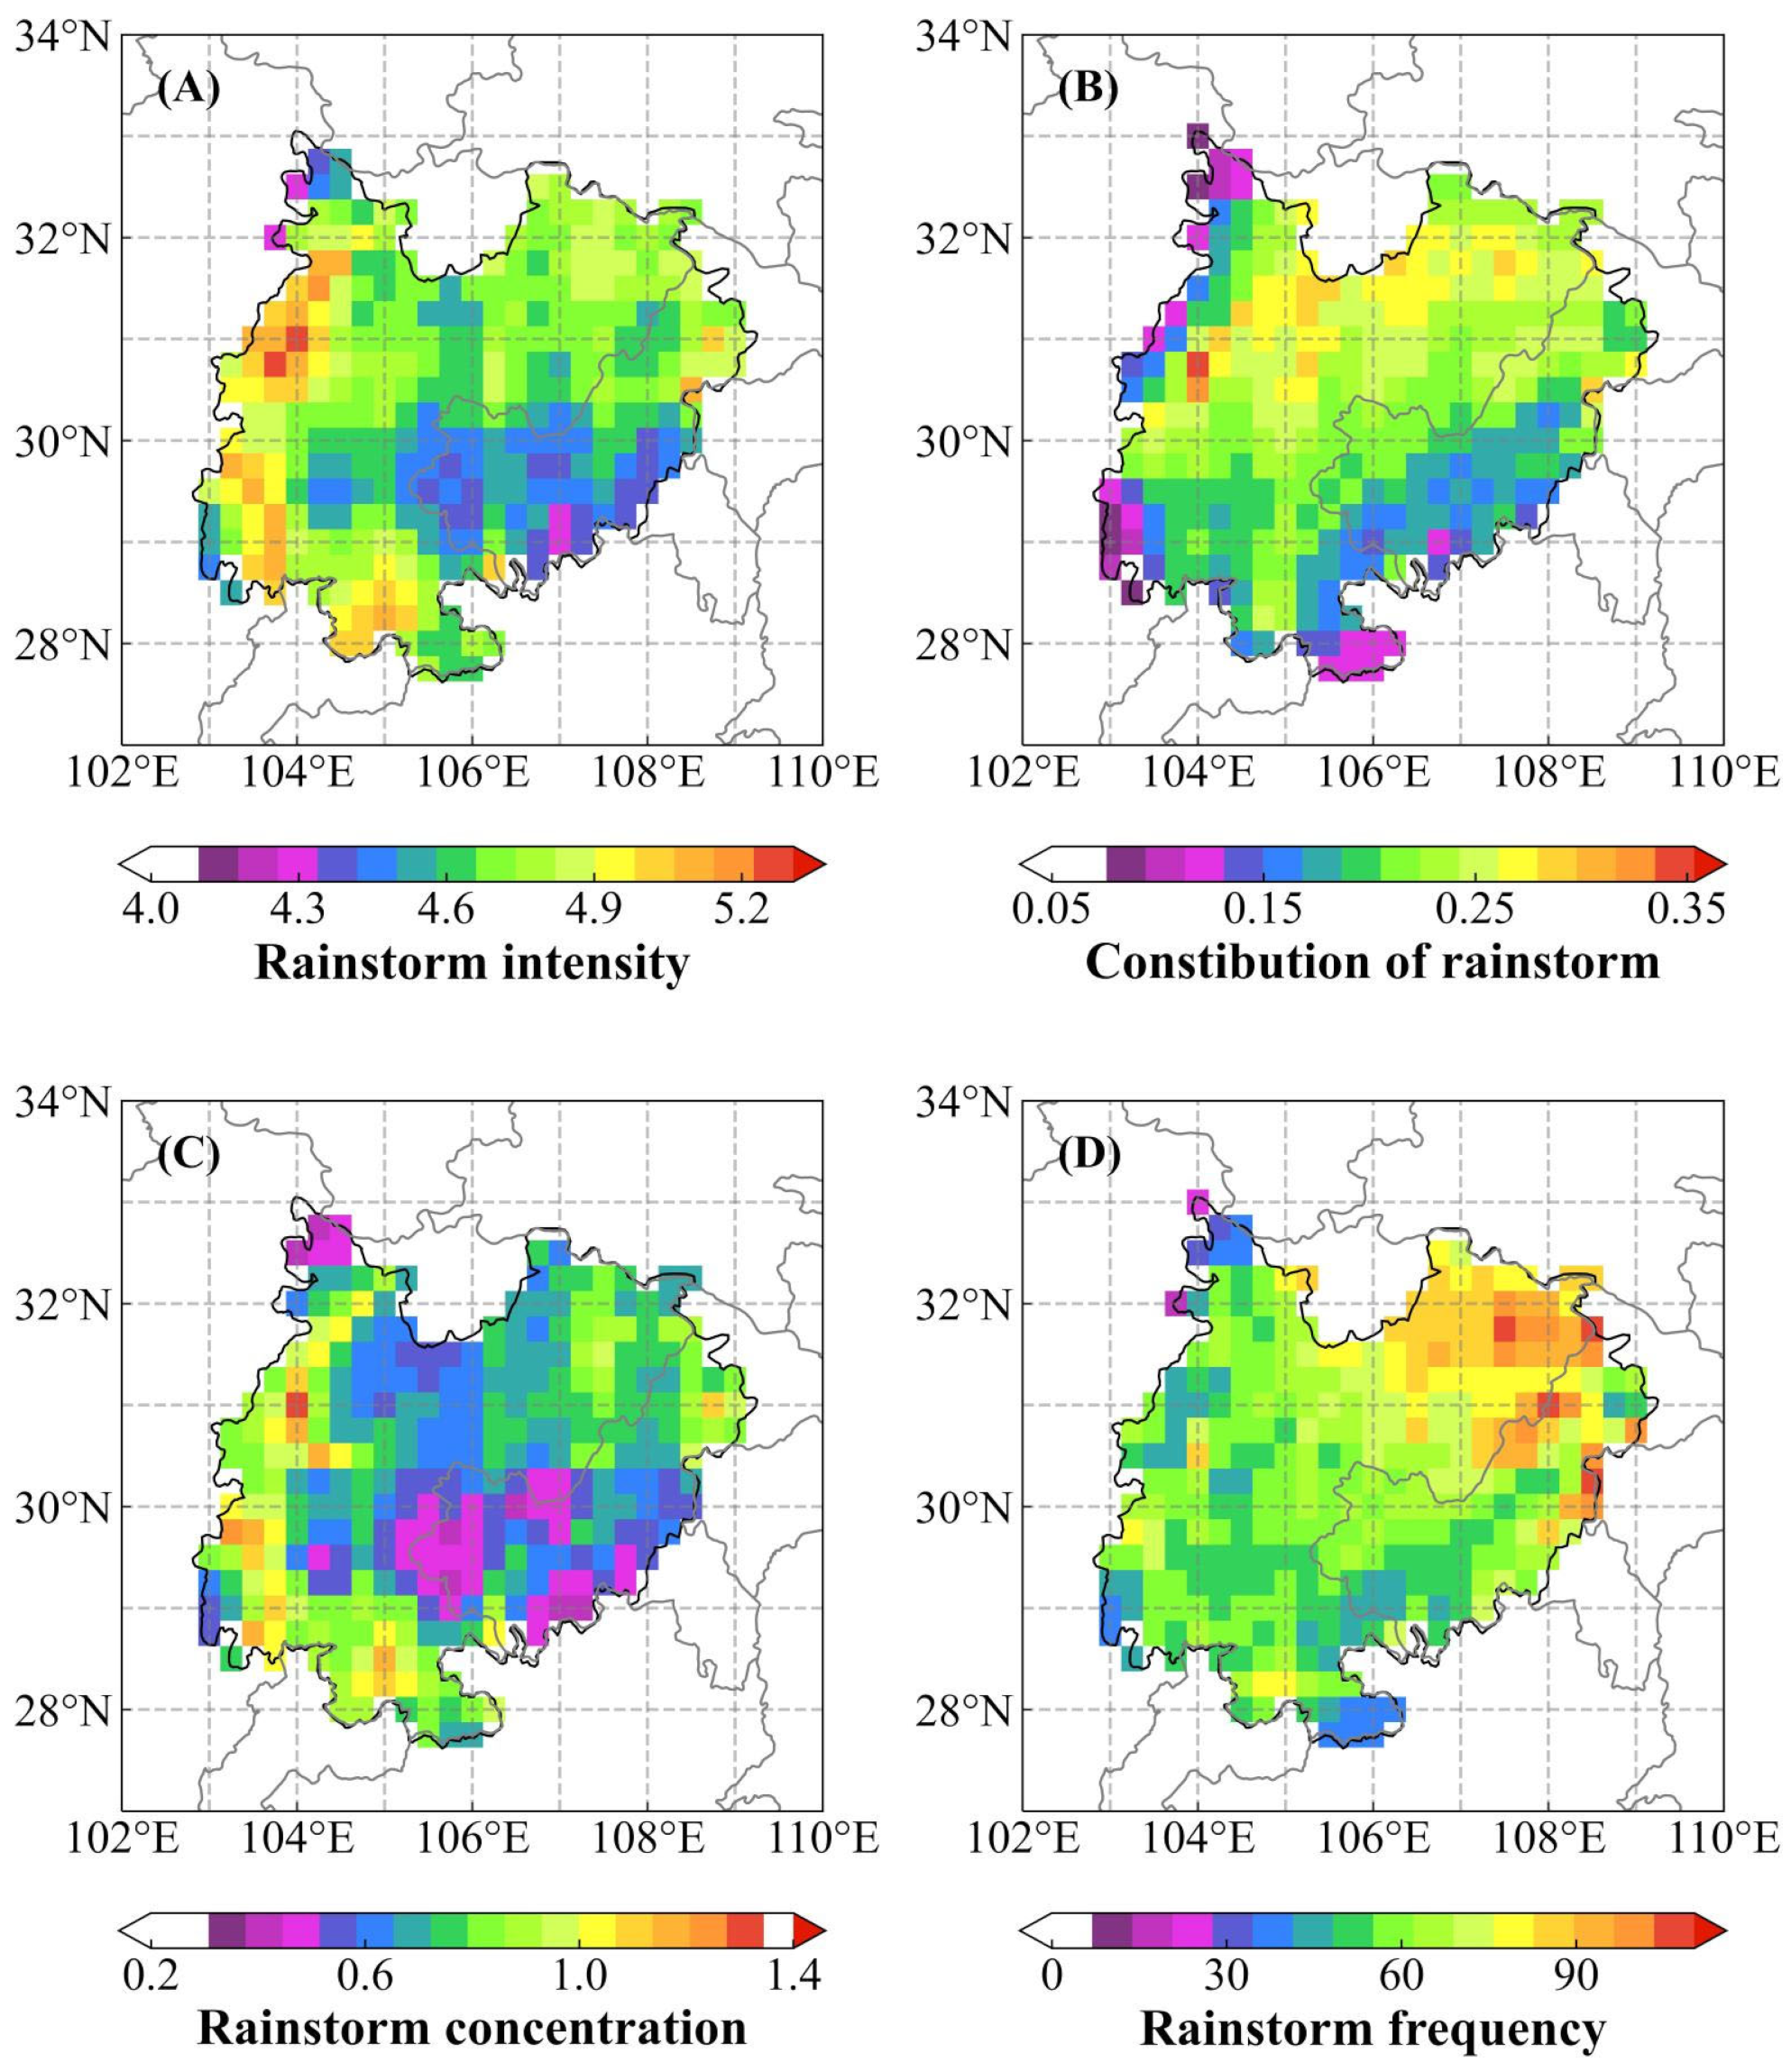
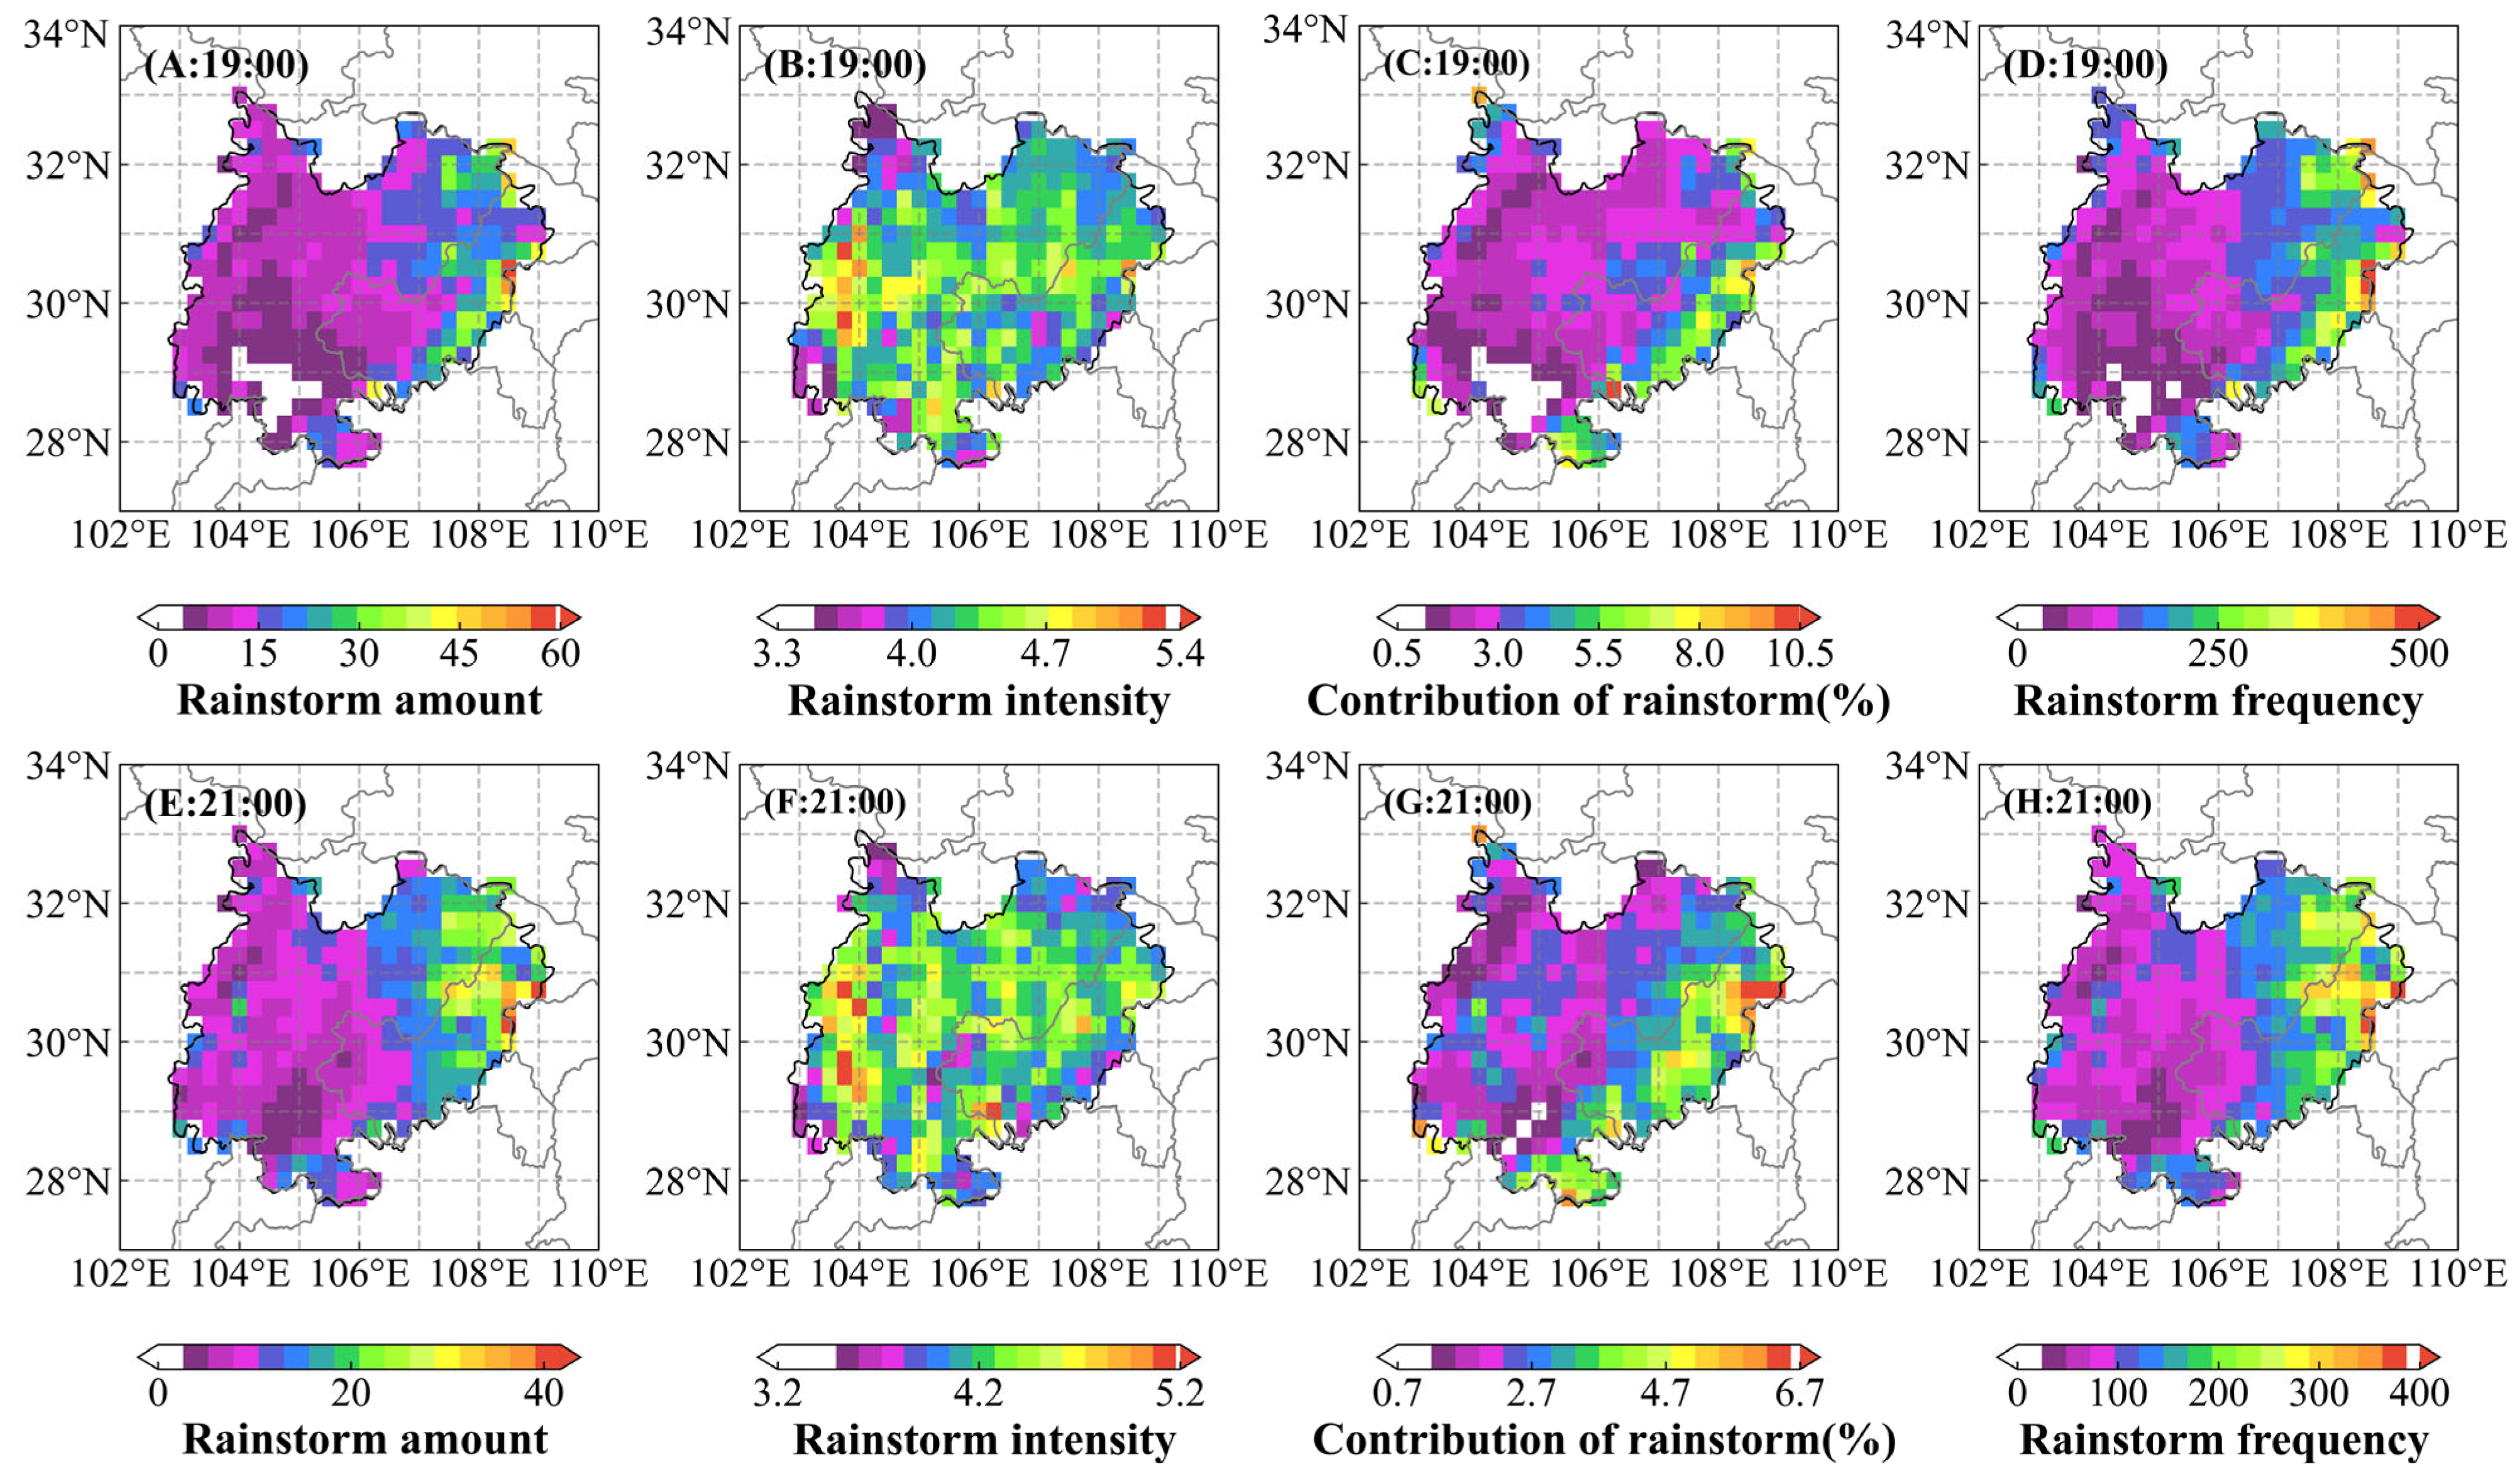
3.2. Examination of Spatial and Temporal Patterns of Hourly Extreme Heavy Rainfall

Building upon the previous research on daily extreme rainfall patterns, this study extends its focus to examining extreme precipitation’s spatiotemporal attributes at an hourly resolution. Figure 7 illustrates the geographic distribution of diverse indicators concerning intense heavy rainfall hourly. Upon reviewing the spatial arrangement of extreme heavy rainfall intensity (Figure 7A), it can be observed that the intensity is lower in the southeastern side of the basin and higher in the northern and southwestern parts. The maximum intensity of extreme heavy rainfall appears near the western peripheral mountains. At the same time, the minimum is located in the northernmost and southeastern mountain areas, suggesting that topography impacts extreme hourly heavy rainfall. Low values of the contribution rate of extreme heavy rainfall appear in the southeastern and northwestern sides of the basin (Figure 7B), both of which are distributed along the mountain range in a belt-like pattern. The lowest value appears in the southwestern edge of the mountain area, and the highest value is also near the western peripheral mountains, closely matching the location where the highest intensity of extreme heavy rainfall occurs. This may be related to topography, local climate, and underlying surface conditions.
According to the dispersion of extremely heavy rainfall (Figure 7C), the general dispersion is minimal apart from the higher dispersion in the belt-like zones on the northeastern and western peripheries of the basin. This indicates that the concentration tendency of extremely heavy rainfall is stronger in the central area of the basin while weaker in the peripheral mountains. Figure 7D depicts the spatial characteristics of extremely heavy rainfall frequency, revealing a gradual upward trend from the southwestern to the northeastern regions. The northeast area within the basin has a higher frequency of extreme heavy rainfall, and when combined with its higher dispersion, it suggests that heavy rainfall in this area is relatively scattered. The northernmost mountain area has a lower frequency and intensity, contribution rate, and dispersion values, possibly significantly influenced by topography.
Figure 8 illustrates the temporal variations in intense hourly precipitation within the Sichuan Basin. The frequency, magnitude, and proportion of severe hourly precipitation exhibit pronounced variations across different temporal intervals, as depicted in Figure 8. Initially, frequency values are considered across all grids in the basin, followed by a temporal averaging over multiple years, resulting in the box plots shown in Figure 8A,C,E. Specifically, the ERA5 data are grouped by year, calculating the average of corresponding hourly statistical measures each year, eventually obtaining a two-dimensional table where each row represents the average hourly statistical measure of a particular year, and each column represents the time series of statistical measures of a specific hour over the years. Following this data processing method, box plots of various statistical measures of extreme hourly downpours are drawn. Radial distribution charts exhibit the data distribution over the time dimension, reflecting the variation characteristics of extreme hourly downpours at different moments. Figure 8B,D,F utilize radial distribution charts to exhibit the distribution of extreme hourly precipitation in the Sichuan Basin. This chart is obtained by statistically analyzing the frequency, intensity, and contribution of extreme hourly downpours occurring in the Sichuan Basin on an hourly scale and then displaying along the radial axis of the time dimension.
Through this method, it is possible to discover how extreme hourly downpours’ occurrence frequency, intensity, and contribution rate vary at different hourly scales, thereby better understanding the temporal distribution characteristics of extreme hourly downpours. Figure 8A depicts the average frequency of extreme hourly downpours over the years on an hourly basis, while Figure 8B describes the cumulative frequency distribution characteristics of extreme hourly downpours over the years on an hourly basis. Frequency peaks appear at 7 AM and 9 PM (Figure 8A,B), whereas intensity (Figure 8C,D) and contribution rate (Figure 8E,F) remain relatively stable until 7 PM, peaking at this hour. Accordingly, analyses indicate that extreme hourly precipitation is likely to occur in the early morning and at night, possibly closely related to the daily oscillations of low-level jet streams and net water vapor flux [8,54]. At night, the southerly airflow in the basin significantly strengthens, and the horizontal wind exhibits cyclonic intensification [55], influenced by the local topography [56], The boundary layer low-level jet triggers convection, enhances vertical velocity, and transports water vapor, leading to enhanced precipitation during the night. Interestingly, nighttime rainfall demonstrates the highest intensity and volume, exhibiting a discernible pattern differing from the attributes of extreme daily rainfall [57].
For a more comprehensive exploration of the temporal changes in extreme hourly precipitation within the Sichuan Basin, Figure 9 contrasts rainfall intensity, frequency, and dispersion changes across different temporal scales. The data presented in the figure highlight an upward trend in the yearly analysis, encompassing both the intensity and frequency aspects of extreme hourly rainfall events alongside a decline in its dispersion pattern. The observed upward trend in the annual research, encompassing both the intensity and frequency aspects of extreme hourly rainfall events alongside a reduction in its dispersion pattern, depicts a growing concentration and regular occurrence of extreme hourly rainfall, leading to amplified adverse impacts. At a seasonal level, extreme rainfall reaches its highest intensity, frequency, and dispersion during the summer, while it experiences its lowest values in winter; values for spring and autumn fall in between. On a monthly scale, the peak values for all three factors occur in July, indicating that the most severe impact of extreme hourly rainfall happens in the summer season.
In summary, across both annual and monthly scales, the intensity and frequency of extreme hourly rainfall are both showing an upward trend, pointing to more frequent extreme rainfall events. Conversely, dispersion trends differ: it decreases on an annual scale but shows an increasing tendency on a monthly scale. These findings suggest that extreme hourly rainfall events are frequent, increasingly scattered, and intensifying.
Figure 10 contrasts the spatial patterns of extreme rainfall in the Sichuan Basin during two distinct time intervals (19:00 and 21:00). The geographic way of extreme rainfall shows elevated precipitation levels in the southeastern area., with a higher proportion and frequency of extreme rain, especially along the eastern edge of the basin. Meanwhile, the western boundary of the basin experiences diminished precipitation levels, which could be attributed to the geographical features in that area. Additionally, the rainfall amounts, intensity, and frequency of occurrences at 21:00 exhibit a decline compared to 19:00, suggesting a tendency for extreme hourly rainfall to be more prevalent during the early nighttime hours.

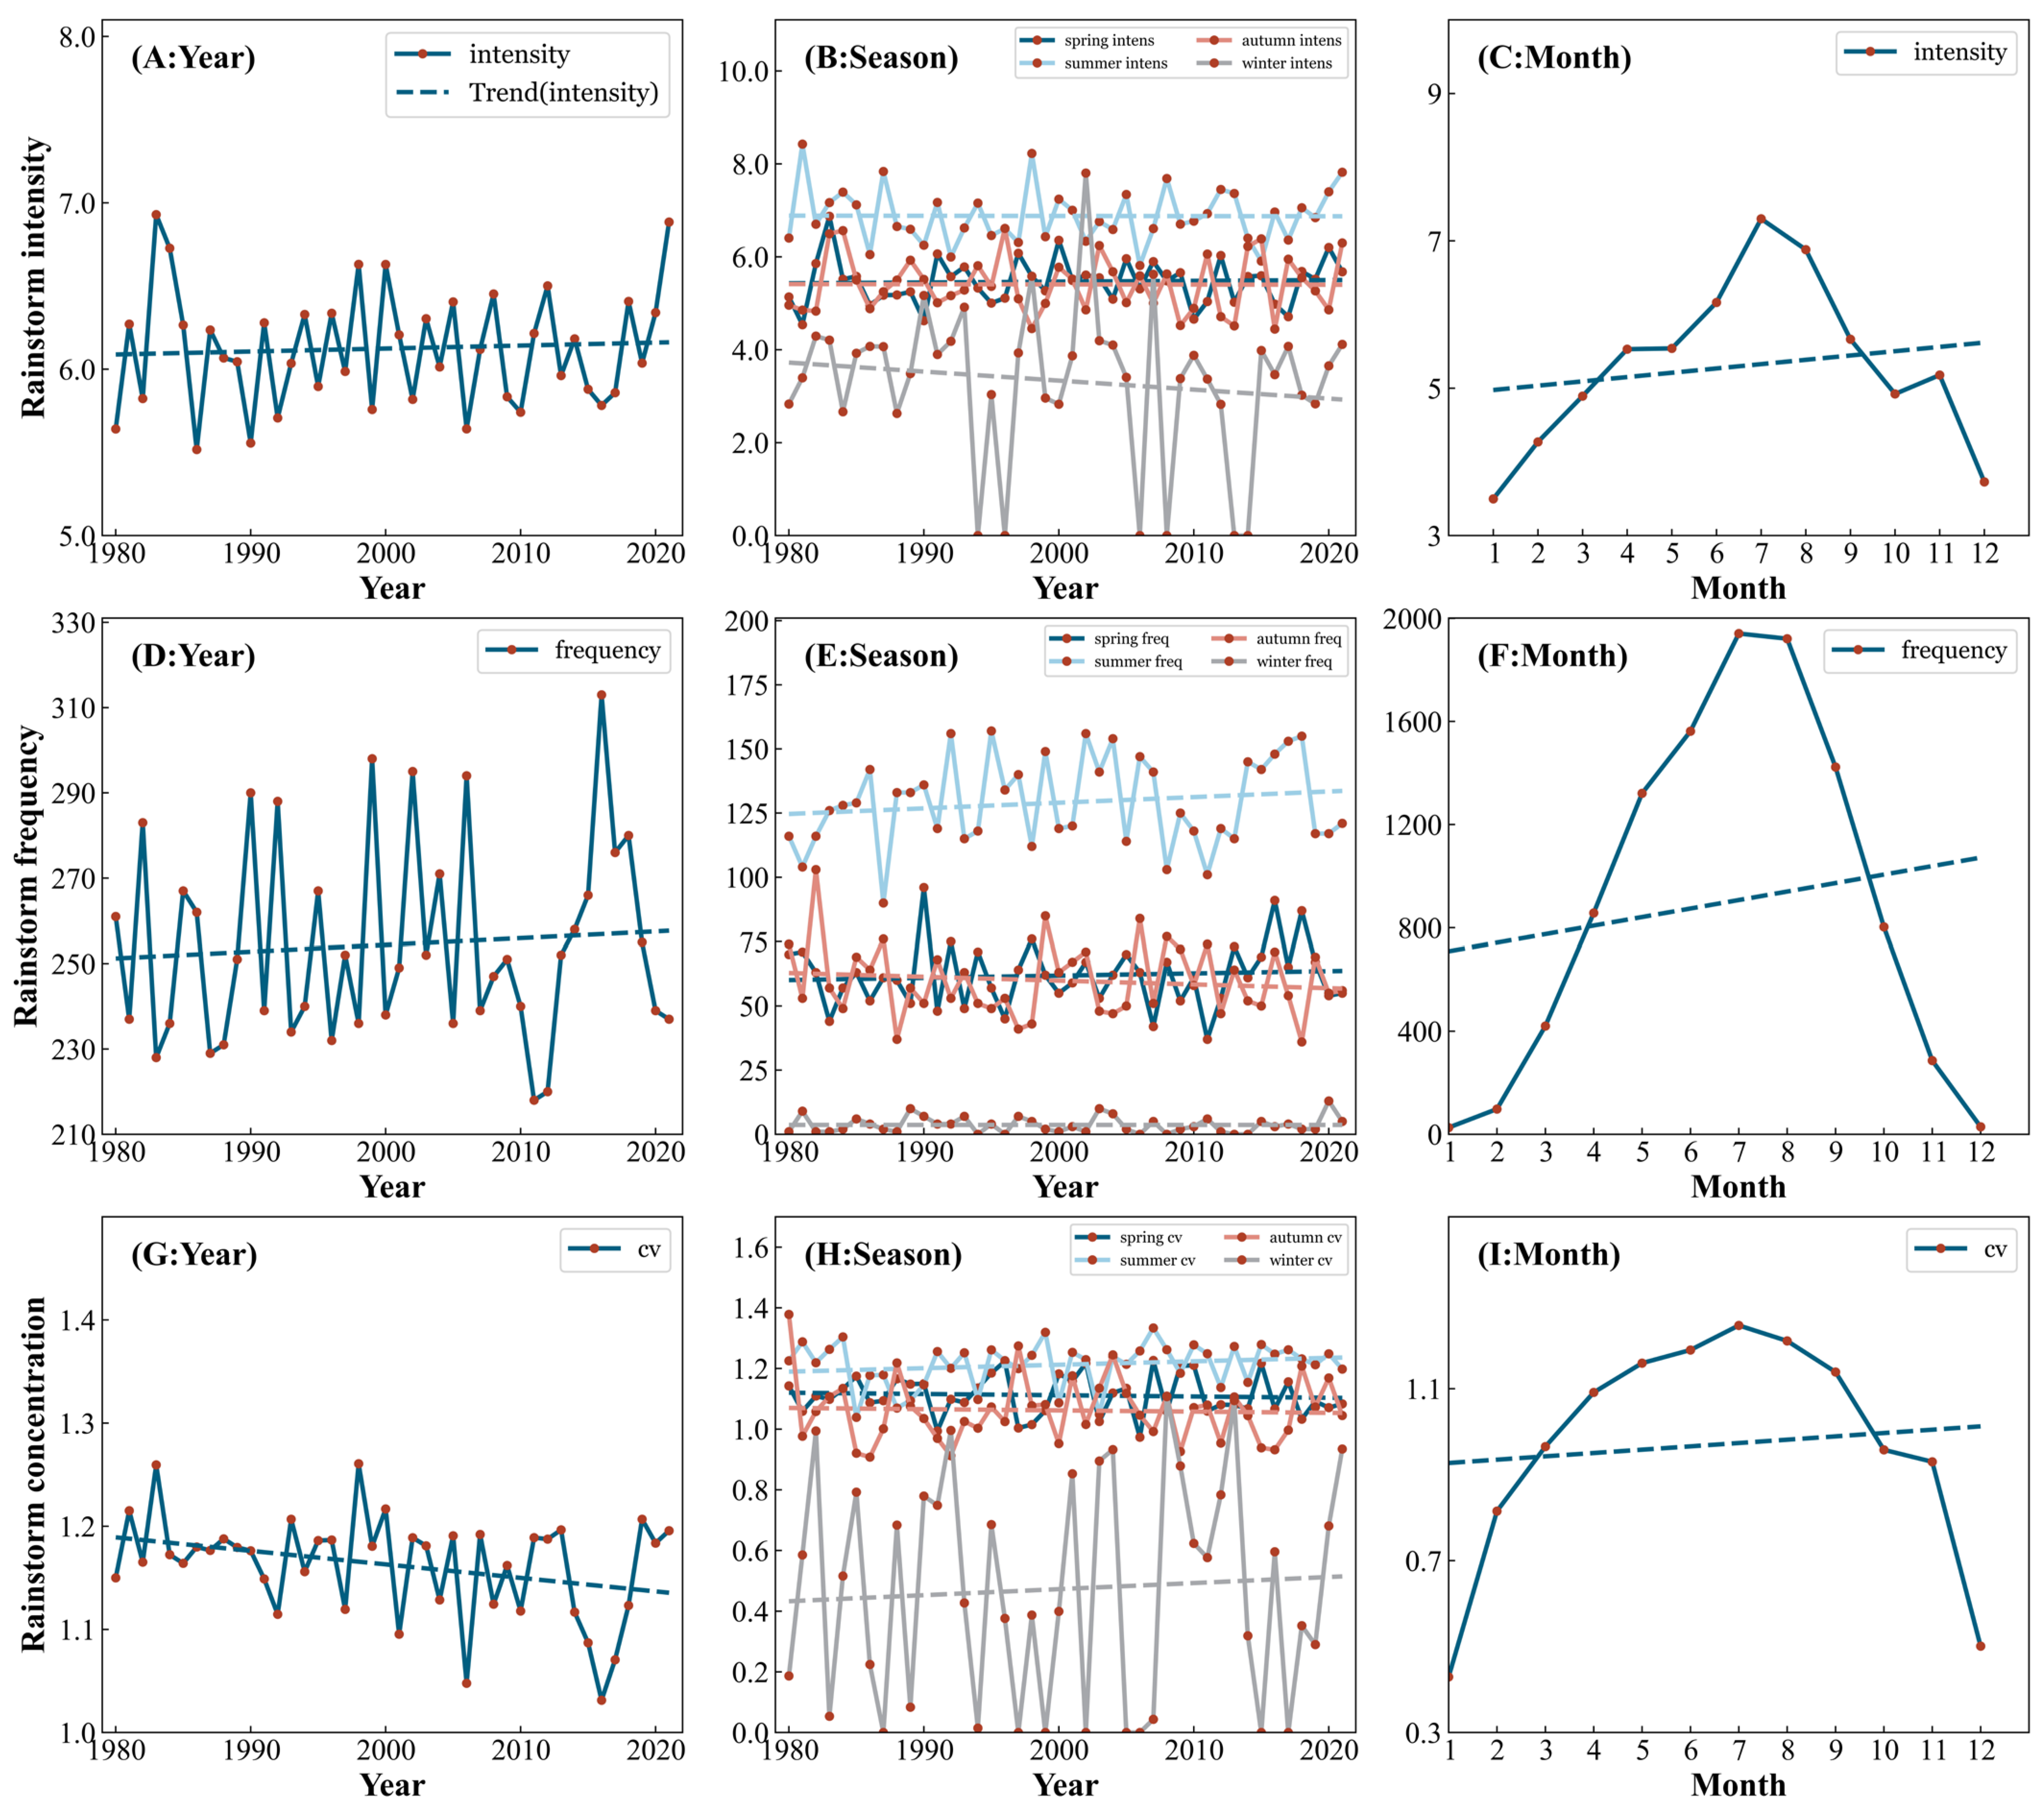
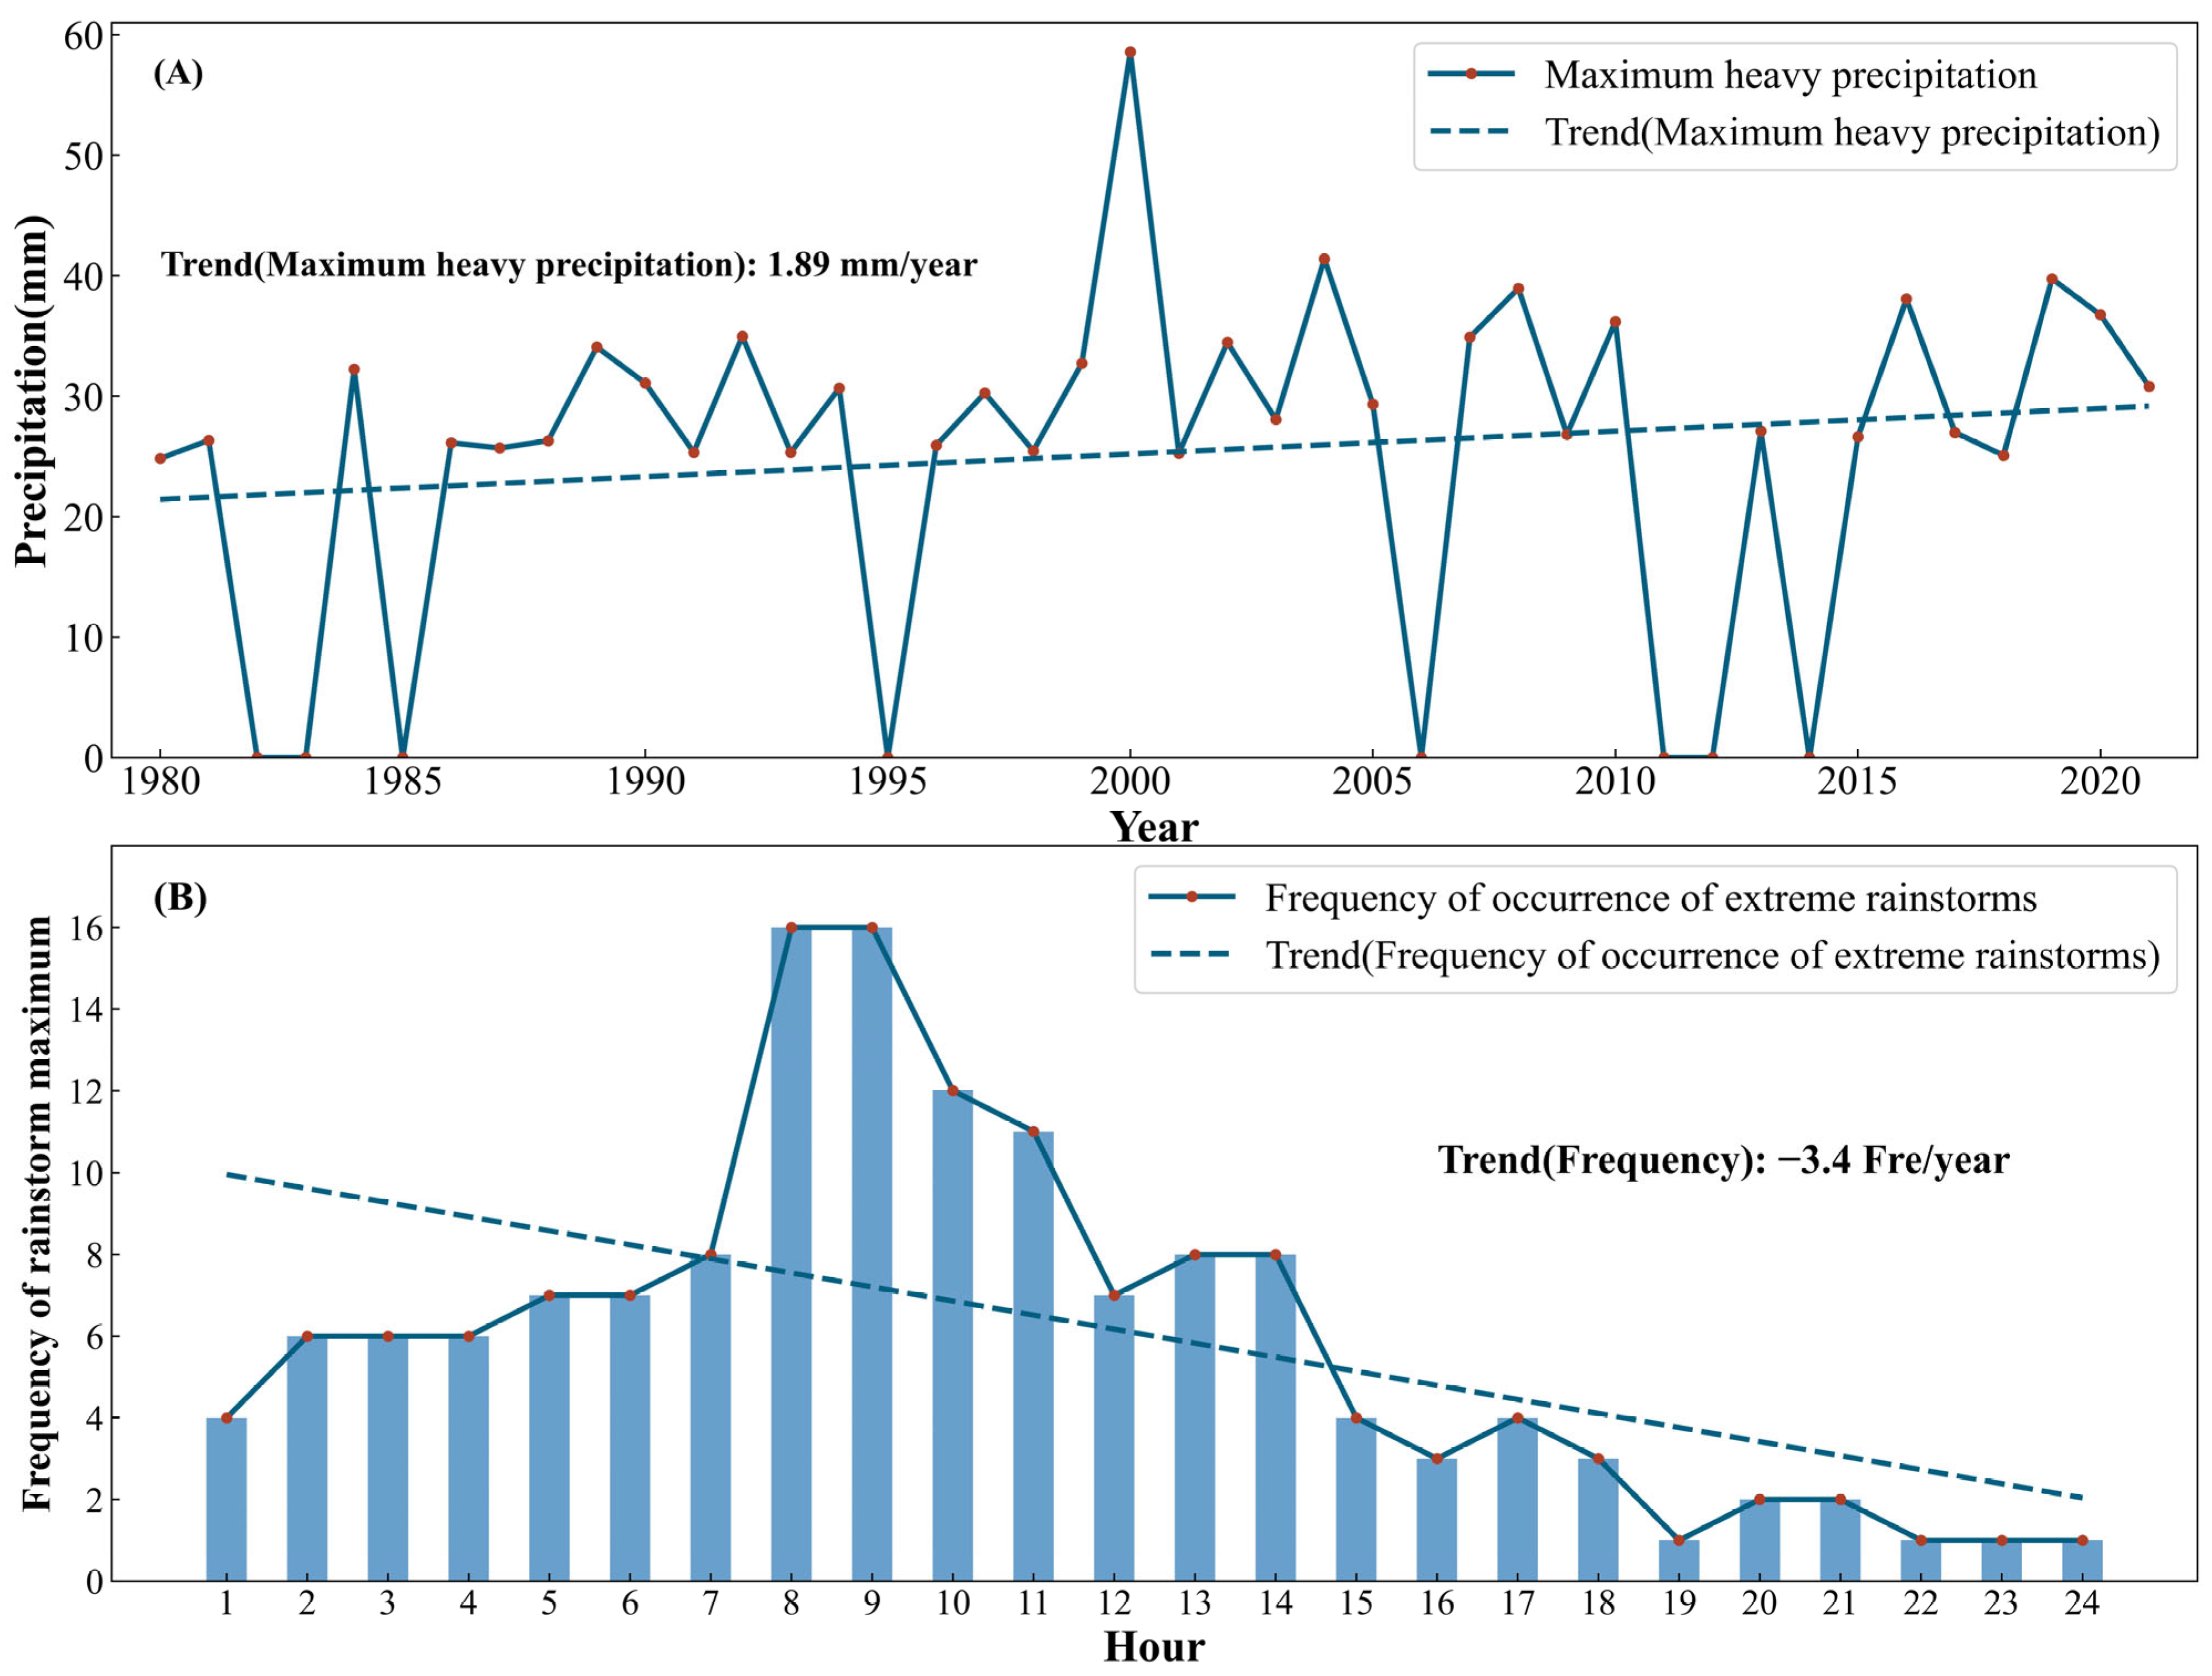
3.3. Extreme Value Characteristics of Hourly Extreme Rainfall

Over the past 40 years, the annual maximum values of extreme precipitation in the Sichuan Basin have shown an upward trend of 1.89 mm/year (Figure 11A). The interannual variability is significant, with an extensive fluctuation range mainly oscillating between 0–60 mm. Alternating states of decline and increase are observed. The frequency of maximum hourly extreme rainfall occurrences shows a decreasing trend throughout the 1:00–24:00 period (Figure 11B). The general pattern can be categorized into two temporal segments: 1:00–9:00 shows an upward trend, while 10:00–24:00 shows a downward trend. The peak occurrence time for the maximum values of hourly extreme rainfall is from early morning to around noon, while the frequency of maximum values occurring in extreme hourly rainfall is lowest in the first half of the night.
In the past 40 years, late-phase and early-phase precipitation have been the primary forms of extreme rainfall in the Sichuan Basin, occasionally exhibiting balanced and dual-peak patterns, and infrequent single-day events (Figure 12A). This indicates that precipitation in the region is relatively concentrated, warranting particular attention to extreme precipitation characteristics on an hourly scale. As shown in Figure 12B, late-phase precipitation is the most frequent, indicating that localized rainfall in the area primarily occurs at night. Despite the recognition of 2000 as a significant year for climate change [58], the nature of rain remained consistent both before and after this juncture [59].

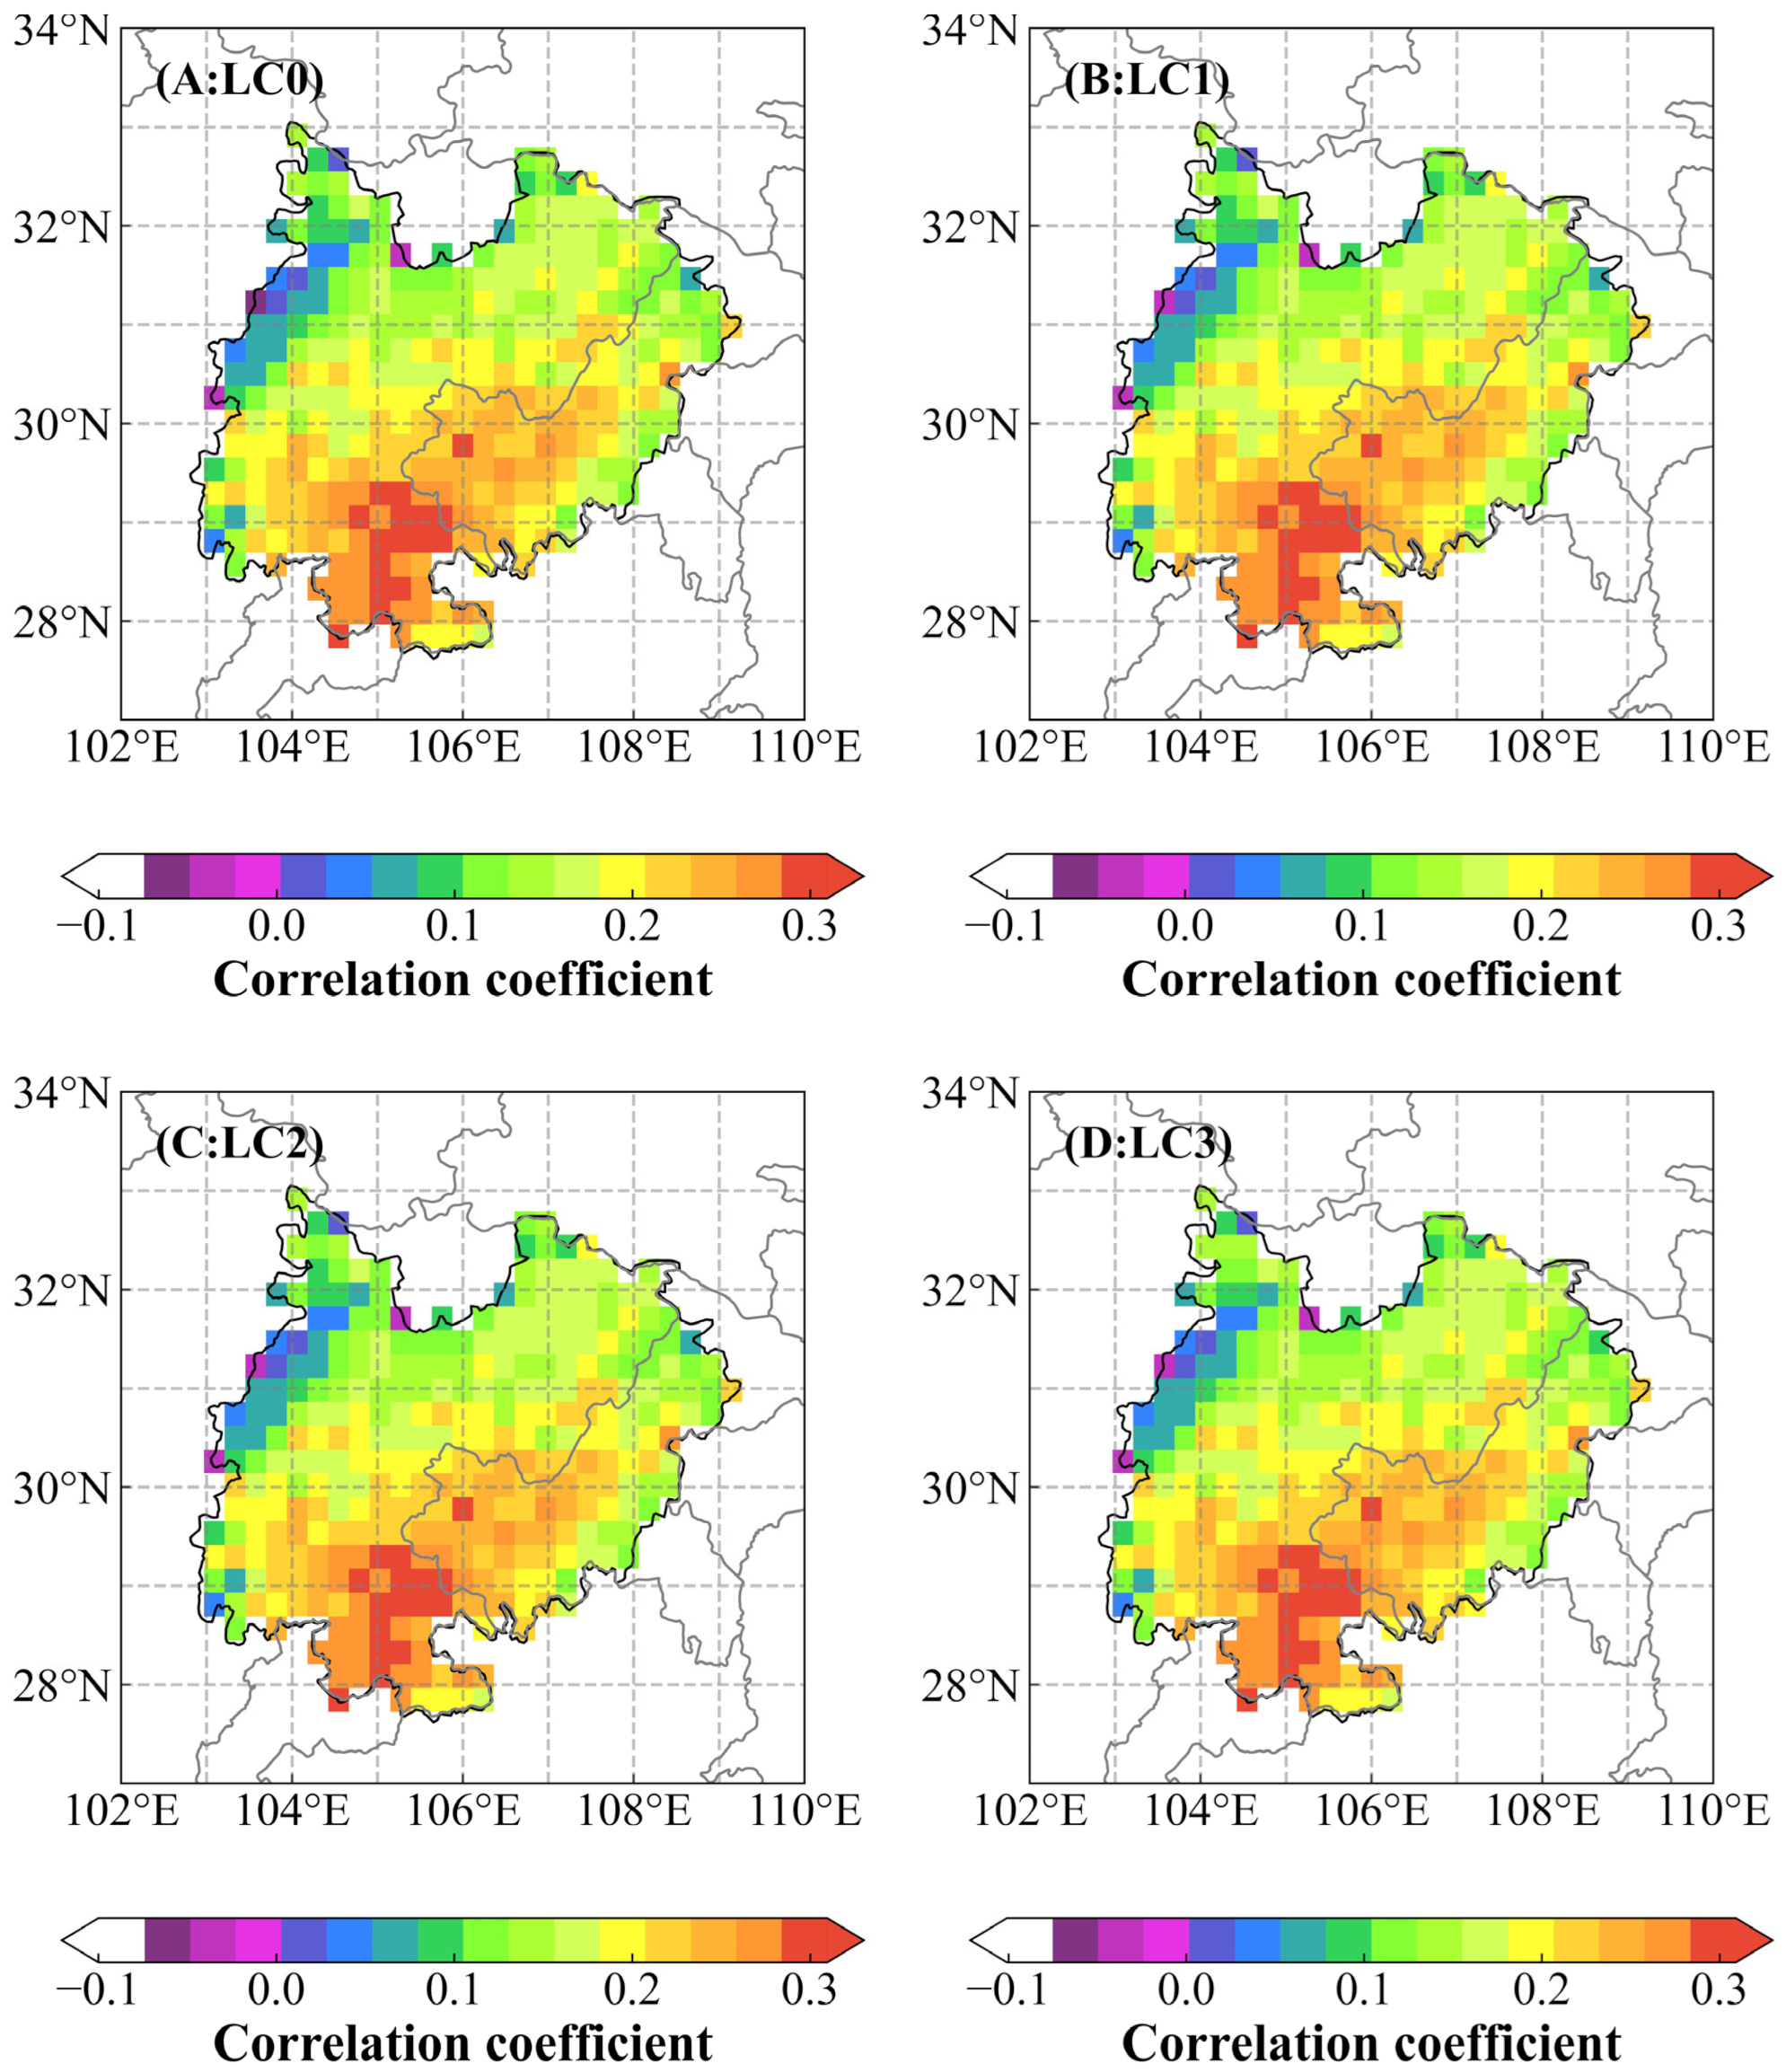
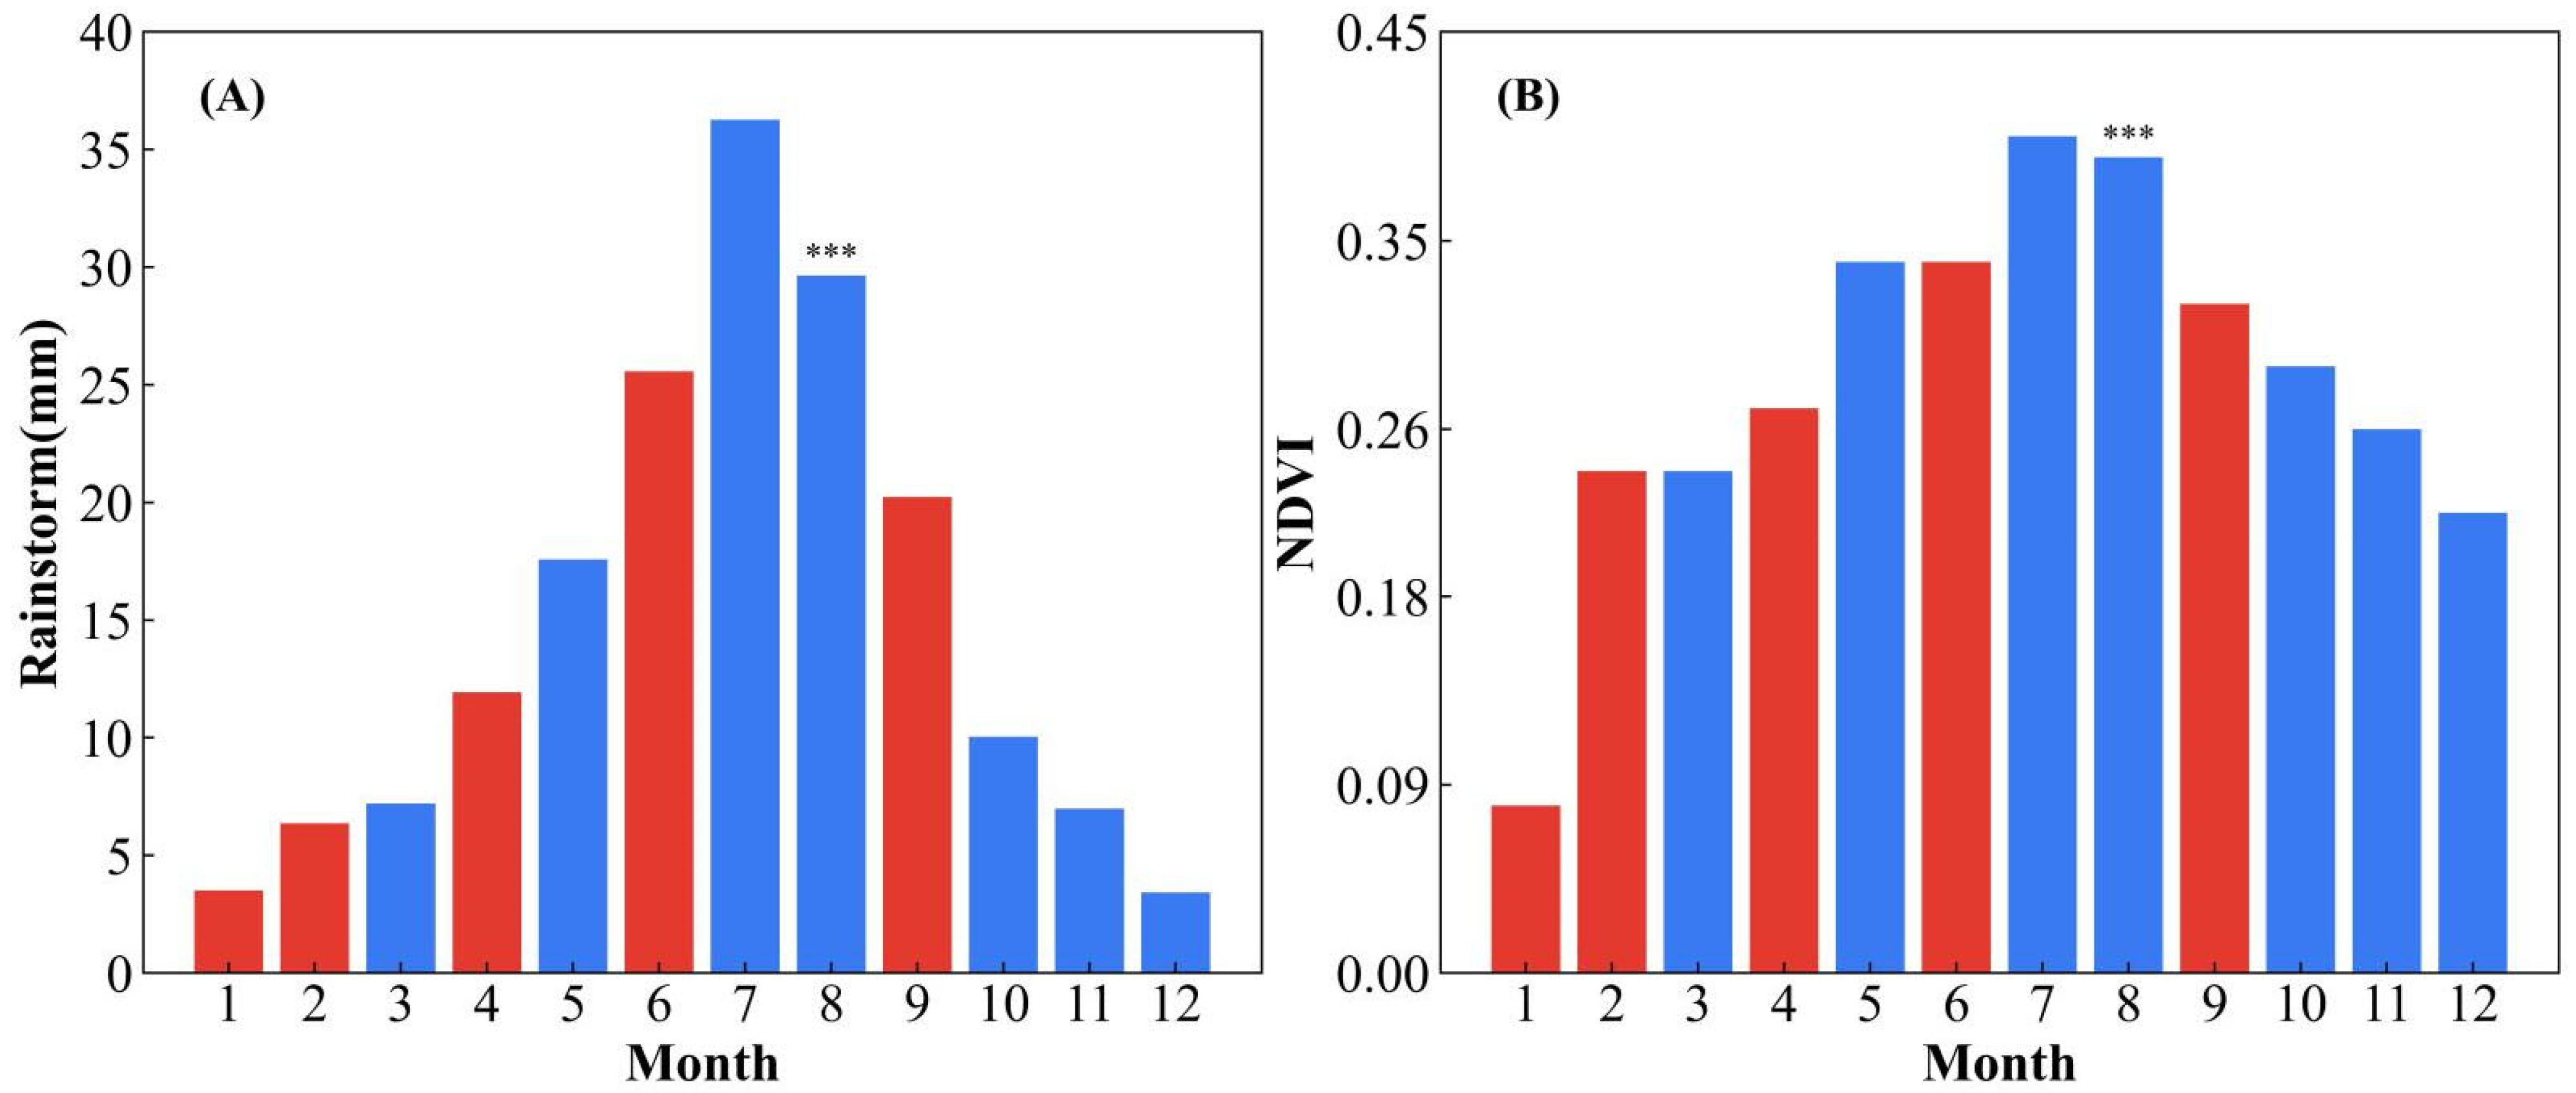
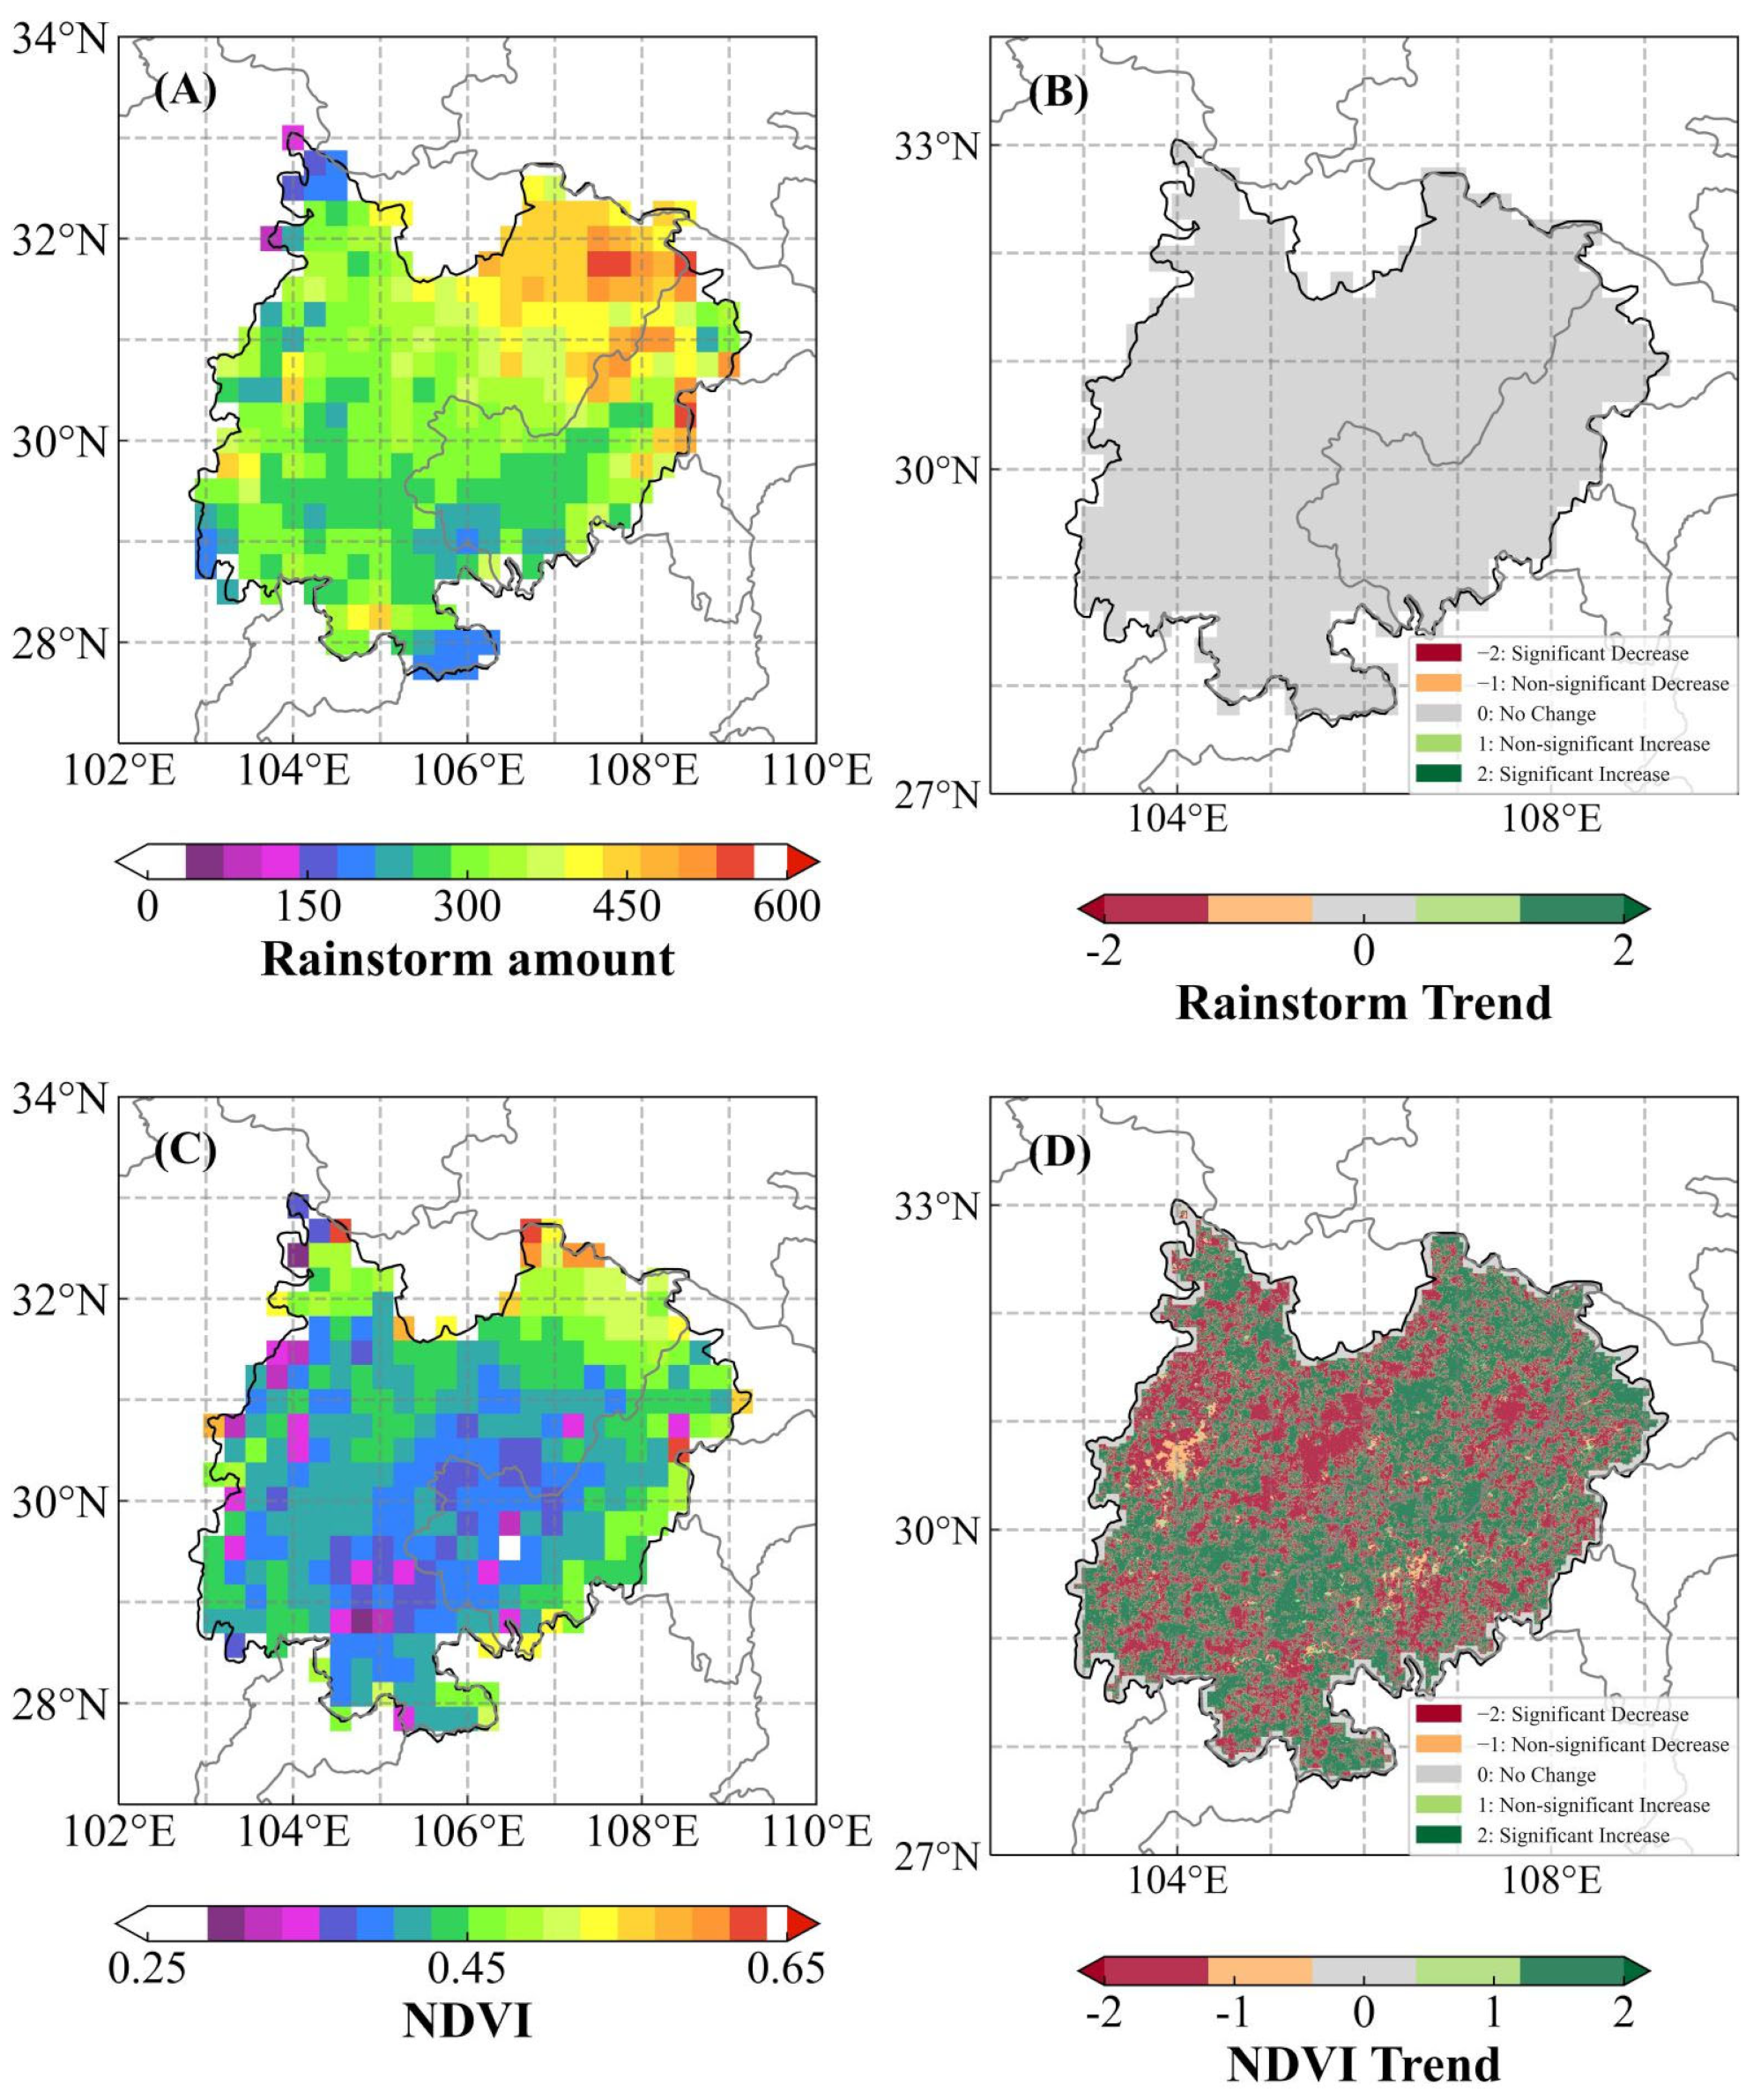
3.4. Influence of Extreme Hourly Precipitation on NDVI

Figure 13 presents the geographic patterns and temporal dynamics of NDVI and extreme hourly precipitation on a 10-day scale in the Sichuan Basin from 1980 to 2021. At this temporal scale, the region’s extreme hourly precipitation displays a distinct zonal spatial distribution, increasing progressively from the southwest to the northeast. The areas surrounding the mountains at the basin’s western edge have the lowest levels of extreme hourly precipitation (Figure 13A). Figure 13B depicts the changing trends of extreme hourly precipitation on a 10-day scale derived using the Sen Slope and Mann–Kendall methods. Over the years, there have been no significant changes in the 10-day scale hourly extreme precipitation levels in the Sichuan Basin. This may be related to multiple influencing factors of extreme hourly precipitation. The factors affecting extreme hourly precipitation are divided into natural and anthropogenic factors, including the underlying surface (topography, vegetation, hydrological conditions, etc.), atmospheric circulation, and human activities. As for the underlying surface and human activities, including large-scale atmospheric circulation, their variations on a decadal scale are minimal. Hence, it is challenging for precipitation to manifest a noticeable trend. Meanwhile, meso-small-scale convections (fronts, cyclones, etc.) typically occur quickly and do not exhibit significant variations on a decadal scale. Thus, there is not any trend for decadal-scale hourly extreme precipitation.
In Figure 13C, the 10-day scale presentation reveals the spatial pattern of NDVI in the Sichuan Basin, indicating a distribution pattern similar to extreme hourly precipitation. The NDVI is lower in the central area of the basin, with the highest values observed at the eastern edge. This pattern is associated with the type of surface cover, with urban areas in the central region and more vegetation at the edges. Figure 13D reveals the spatial trend of NDVI changes. It indicates that the area’s northwest, southwest, and southeast regions are experiencing a significant downward trend in NDVI, whereas other sites exhibit a notable upward trend. The degradation of vegetation may be related to reduced precipitation, intensified extreme rainfall, and alterations in land use and land cover, including urbanization, in these areas. Overall, the changing trend in NDVI suggests that the environment is deteriorating in the Sichuan Basin.
Figure 14 depicts the spatial correlation patterns between extreme hourly rainfall and NDVI over various time lags at the ten-day scale. Research indicates that the lag effect is crucial in the interaction between climate and vegetation [60]. This effect is also significant in the interaction between extreme precipitation and NDVI [61]. For instance, the spatial distribution of vegetation sensitivity to precipitation can define insensitive zones and sensitive belts [62]. The study by Zhe and Zhang [63] demonstrates that most vegetated areas exhibit strong correlations during a lag period of 0–1; Kong et al. [64] indicate that the average lag time in the precipitation amount and NDVI response ranges from 7.9 to 17.7 days. Based on this, the present study selects a ten-day period as the lag time. Recognizing the time-delayed response of vegetation to climatic factors, notable temporal lags occur between NDVI and precipitation. Despite this, extensive investigation is needed into the repercussions of extreme hourly rainfall on NDVI. Hence, this research considers the instantaneous nature of intense rain, calculating concurrent correlation (LC0), first-order lag correlation (LC1), second-order lag correlation (LC2), and third-order lag correlation (LC3) between NDVI and extreme hourly rainfall. The aim is to scrutinize the temporal lag effects of extreme hourly rainfall on NDVI.
As depicted in the illustration, the correlation value between NDVI and extreme hourly rainfall over a ten-day span exhibits obvious spatial variability from zero-order to third-order lag, primarily increasing from north to south and showing a pronounced zonal distribution. In particular, the correlation is lowest in the mountainous regions at the northwest edge of the basin, likely due to the topography, which is potentially more influenced by temperature. Meanwhile, the southernmost part of the basin shows the highest correlation between extreme rainfall and NDVI, potentially due to microclimate and topographical factors. After conducting significance testing, except for very few points in the basin, the correlations displayed in the subfigures are all significantly correlated.
The correlation is lowest in the northwestern marginal mountainous area of the basin, possibly due to the influence of terrain or temperature on its NDVI values [65], as NDVI is influenced not only by precipitation but by the combined effect of temperature and precipitation [62]. Simultaneously, in mountainous regions, due to terrain blockage and rapid runoff of moisture, vegetation’s response to precipitation might be weaker, hence the lower correlation. In the southernmost part of the basin, the correlation between extreme rainfall and NDVI is the highest, possibly related to its land cover type. The LUCC (land use and land cover change) type in the southern part of the Sichuan Basin gradually transitions from crops to alpine sparse and mat vegetation types. This also suggests that vegetation growth relies on natural precipitation rather than artificial irrigation, which is one of the reasons for the higher correlation coefficient in the southern part. Research indicates [64] that the lag between grassland precipitation and NDVI response is the largest, followed by shrubland, cropland, and forest.
Table 3 displays the correlation analysis at a monthly scale between extreme hourly rainfall and NDVI. The monthly scale extreme hourly precipitation here represents the cumulative value of extreme precipitation for the given month. In combination with Table 3 and Figure 15, it becomes apparent that the impact of extreme hourly rainfall on NDVI varies across different seasons. The relationship between NDVI and extreme hourly rainfall shifts between positive and negative across different months. During the summer and autumn, it mainly shows a negative correlation. The correlation coefficients for July and August are negative, with the coefficient in August passing the significance testing at a 5% confidence level. This suggests excessive rainfall has a distinct and direct inhibitory effect on plant growth. June remains within the period of increased rainfall, characterized by substantial precipitation, but the rain at this time has a positive impact on NDVI due to temperature effects. In September, although the amount of extreme rainfall significantly decreases, the vegetation is still in its growing season. Moderate rainfall can still promote the growth of NDVI, enabling the vegetation to acquire adequate moisture.

4. Discussion

The Sichuan Basin, situated in the upper reaches of the Yangtze River region, might exhibit spatiotemporal changes in extreme precipitation linked to the ENSO (El Niño–Southern Oscillation) phenomenon [58,66]. It is generally believed that ENSO influences regional precipitation variations by regulating large-scale atmospheric circulation [58,67]. Studies have shown that in summer, circulation anomalies caused by ENSO, such as the Northeast Asia cyclone and the anticyclone anomalies in the western North Pacific, can lead to increased precipitation in some areas of China [68]. In autumn, different ENSO events cause distinct circulation characteristics in the southwestern region, corresponding to different precipitation responses [69]. Therefore, the intricate interaction between ENSO and precipitation introduces complexities that could result in uncertainties regarding the association between extreme precipitation events and the ENSO phenomenon. Under the impact of global warming, land cover changes, and other factors, ENSO events may undergo significant variations, exacerbating this uncertain relationship between ENSO and extreme precipitation [70]. Consequently, the reasons and mechanisms behind the localized precipitation changes induced by ENSO still require further research.
The formation and persistence of heavy rainfall in the Sichuan Basin are intricately linked to distinct atmospheric circulation patterns. For instance, within the rainy season, a mild convergence exists at mid-to-low levels on the periphery of the Tibetan Plateau, along with upper-level tropospheric jets in the northern region of the Sichuan Basin [71]. the Sichuan Basin encounters distinctive southeasterly airflow patterns and moisture convergence anomalies upon the development of a consistent easterly airflow across the tropical low-latitude areas and an anticyclone to the north. These conditions contribute to the heightened occurrence of summer downpours. Conversely, when the same tropical region establishes a stable westerly airflow and a cyclone to its north, the basin experiences anomalous northeasterly airflow and moisture convergence, corresponding to fewer summer downpours [72]. Large-scale circulations can trigger mesoscale convection, directly inducing heavy rainfall. Within the overarching circulation system characterized by westerly troughs and subtropical highs, distinct cloud belts materialize along the northeastern and southern peripheries of the Tibetan Plateau. Affected by eastward-propagating troughs, inverted troughs, low-level jets (LLJ), and southwestern vortices, the intersection of these cloud belts fosters the formation of a mesoscale convective system (MCS). The lifting of the dew point front at 850 hPa LLJ elevates low-level vertical circulation, which intersects with the upper-level jet stream at 200 hPa, generating strong slanted updrafts that sustain the MCS, directly leading to the occurrence of heavy rain within the Sichuan Basin [42]. Moreover, because of its proximity to the Tibetan Plateau, the Sichuan Basin might experience future changes in precipitation patterns due to the interplay between mid-latitude westerlies and the significant topography [73].
High-altitude mountains mark the periphery of the Sichuan Basin, while its interior is a complex interplay of hills and plains. Under such topographical features, when northeasterly winds appear near the surface, they may converge and lift against the northwest-to-southeast oriented mountains on the western edge of the basin. The presence of southerly winds in the mid-to-low levels transporting moisture can lead to short-duration, intense precipitation. The basin’s western periphery encounters high-intensity but low-frequency rainfall, while the northernmost mountains experience even lower frequency. Similarly influenced by southwestern vortices and topography, Chongqing‘s low and mid-mountain regions experience higher frequency rainfall than the basin and hilly areas, with rainfall intensity being inversely related [74,75]. This contrasts with the findings of this study regarding the relationship between precipitation frequency (intensity) and terrain height, suggesting that the association between precipitation and terrain height is not a straightforward one-to-one correspondence; the actual situation is more complex. Research indicates that aside from altitude, precipitation also depends on several other topographical factors (such as slope aspect) and many other climatic parameters [76,77]. Therefore, a deeper understanding of how local terrain influences the formation mechanisms and impacts of extreme downpours is required.
The Sichuan Basin exhibits a clear diurnal pattern of intense precipitation, with lower values during the daytime and peak values at night. This may be related to the significant elevation contrast between the basin and surrounding mountains. Such multiscale mountain valley breeze effects lead to the spatiotemporal variation of precipitation. A notable pattern emerges during the rainy season: the peak rainfall shifts from the Tibetan Plateau during daylight hours to the Sichuan Basin at night. Similarly, the secondary peak in precipitation moves from the evening to the early morning, progressing from the Yunnan-Guizhou Plateau towards the northeastern part of the basin [71]. Besides affecting the location of precipitation, the specific topography can also significantly alter the rainfall intensity in the early morning and midnight. Still, it does not significantly impact the afternoon peak rainfall. This suggests that precipitation during the early morning and midnight exhibits more excellent responsiveness to the specific mountain ranges, unlike the corresponding afternoon rainfall in the same region [78]. Moreover, convergence zones in the terrain can also trigger localized downpours. Convective available potential energy and lower tropospheric stability, as well as aerosol, may also influence the hourly extreme precipitation in a specific area [79].
The impact of extreme precipitation on NDVI throughout the vegetation growing season (March to October) in the Sichuan Basin demonstrates alternating positive and negative effects. In March, when the growing season has just begun, vegetation requires time to recover from its dormant winter state, and the soil is relatively complex, which poses challenges for water absorption. Although precipitation during this period can enhance soil moisture, the typically low temperatures still restrict vegetation growth. In May, which usually marks the tail end of the spring drought, vegetation recovery may lag despite increased precipitation due to arid soil conditions, hence a delayed rise in NDVI. As temperatures gradually climb from late spring to early summer, accelerated evaporation could ensue, which means that increased precipitation may still not meet the needs of growing vegetation. July and August are the hottest months, and high temperatures may lead to rapid soil moisture evaporation. Despite precipitation, the moisture level might still fall short of vegetation requirements. In the face of high temperatures and intense evaporation, some vegetation might enter a state of “negative growth”, the NDVI may decrease even if precipitation increases. Moreover, because this is a concentrated period of the rainy season, excessive precipitation can directly inhibit vegetation growth. Months showing a positive correlation with NDVI are April, June, and September. Both temperature and soil moisture are generally favorable for vegetation growth in April and June. In September, the warm and moist summer season ends, and vegetation is usually relatively healthy. These months are also within the growing season, and precipitation directly promotes vegetation growth.
The NDVI is a crucial indicator reflecting the regional climate environmental conditions, being influenced by precipitation, and in turn, affecting precipitation through altering thermal dynamic conditions and water supply [80]. Research has found that the correlation between NDVI and precipitation is spatially dependent and influenced by local factors (such as soil background) [81]. During highly humid seasons, this correlation further depends on land cover (grassland, cropland, forest, and urban areas), climatic conditions (temperature, rainfall amount, humidity, and soil moisture), and the specific elevation of a region [82]. For instance, within the same area, forest land and built-up land have opposite effects on vegetation evapotranspiration and regional precipitation [83]. The correlation between rainfall and NDVI over its largest site is significantly positive in areas like the Tibetan Plateau. In contrast, this correlation is weaker in its southeastern part, with the minimum temperature being dominant in affecting NDVI [84]. In this regard, some scholars point out that precipitation and temperature are closely related to NDVI, and their synergistic impact is a significant contributor to NDVI [85,86], with such multiple correlations possibly varying across different regions. Besides natural factors, anthropogenic factors also significantly affect vegetation growth and distribution [87]. For instance, the construction of well-established agricultural water infrastructure in the Sichuan Basin has resulted in good vegetation conditions [88]; around the year 2000, the NDVI in the Amazon rainforest sharply declined, which was directly related to deforestation and land reclamation [89]. The extent and mechanisms of human activities affecting vegetation still require further investigation.
In the next step of the research, we will explore methods to improve the accuracy of precipitation data and investigate the impact of precipitation events on NDVI in depth. This study utilized hourly rainfall data based on ERA5. However, despite ERA5 data following a trend similar to measured data, rainfall amount has a specific deviation. Therefore, one future research direction is exploring methods to decompose daily rainfall into hourly rainfall. This method that can retain the unique characteristics of daily cumulative and hourly rainfall, thereby more accurately assessing the aspects of extreme rainfall and its impact on NDVI [90,91]. Secondly, we will validate the applicability of different satellite and model precipitation products in the Sichuan Basin: TRMM (Tropical Rainfall Measuring Mission satellite), GPM (Global Precipitation Measurement satellite), CMORPH (CPC (Climate Prediction Center) MORPHing technique), etc., to provide more accurate data sources for precipitation research in this region. This will provide more accurate data support for assessing the characteristics of extreme rainfall and their subsequent impacts on NDVI, helping to deepen the understanding of the mechanisms of the effect of precipitation events on vegetation growth. Since the Sichuan Basin has relatively less rainfall in the spring, combined with the results of Figure 15, subsequent research will consider the growth trend of NDVI and the impact of precipitation on its growth if there is drought or arid conditions in the spring. Meanwhile, the focus of this study is to explore the spatiotemporal characteristics of extreme hourly downpours and their impact on NDVI. Still, different plant phenotypes have varying response mechanisms to precipitation. The vegetation traits of plants can directly respond to environmental changes. For instance, phenotypic variables such as height, leaf width, and chlorophyll content are most sensitive to the annual average rainfall [92]. However, plants’ stomatal conductance and leaf area can exhibit adaptability and plasticity to a certain extent through gas exchange and changing leaf morphology [93]. This plasticity has systemic differences in response direction and degree among different populations, and their specific responses to precipitation naturally vary as well [94]. Therefore, the reaction of plant phenotype to rain is also worth special consideration in future research.

5. Conclusions

From 1980 to 2021, this research investigates the spatiotemporal dynamics of daily and hourly extreme precipitation in the Sichuan Basin. It comprehensively analyzes their temporal and spatial attributes and delves into the factors driving intense hourly downpours. The study’s findings are summarized as follows:
(1) In the Sichuan Basin, areas at the periphery with high elevation experience more rainfall, while the central regions of the basin see less precipitation, generally correlating with the topography. The extreme rainfall and its proportion of total rainfall exhibit latitudinal distribution, with the northern part being higher than the southern. Overall rainfall, contribution rates of extreme rainfall, intensity, and dispersion are all on an upward trend, while the area affected by extreme rainfall and the frequency are on a downward trend. This indicates that extreme rain on a daily scale is becoming more concentrated.
(2) The northeastern region of the Sichuan Basin has higher values for extreme rainfall intensity, contribution rate, frequency, and variability, suggesting that extreme rainfall is frequent and dispersed in this area. The mountainous region in the far north shows lower values for these metrics. On the basin’s western edge, intensity, and variability are high while the contribution rate is low, which may be influenced by the topography.
(3) Extreme hourly downpours in the Sichuan Basin are more likely to occur at night, with a decreasing trend in rainfall amounts, intensity, and frequency after 21:00 compared to 19:00. This indicates that extreme hourly downpours tend to occur in the early night. Compared to extreme daily rainfall events, extreme hourly events have increased more, and the types of rainfall are mainly rear-biased and front-biased.
(4) Extreme rainfall in the Sichuan Basin shows different trends on different time scales: The annual and monthly scales of extreme rainfall intensity and frequency show consistent changes, but dispersion shows the opposite direction, indicating that extreme hourly downpours are frequent and dispersed, with increasing intensity. On a seasonal scale, the intensity, frequency, and variability of extreme rainfall are highest in summer, suggesting the most severe potential risks and hazards, while they are lowest in winter.
(5) The peak value of extreme hourly rainfall is increasing, with its frequency divided into two time periods: 1:00–9:00 and 10:00–24:00. The former exhibits an ascending trend, while the latter displays a more pronounced descending trend.
(6) At a ten-day interval, the NDVI spatial distribution across the Sichuan Basin demonstrates a gradual rise from the southwest to the northeast, aligning with the pattern observed in the distribution of extreme hourly rainfall. The local NDVI is showing a trend of degradation. The correlation value between NDVI and extreme hourly rainfall (after 5% confidence level testing) exhibits a strip-shaped distribution pattern increasing from north to south. The impact of extreme rainfall on the NDVI during the vegetation growing season (March to October) alternates between positive and negative effects, influenced by factors like soil moisture, seasonality, precipitation, evapotranspiration, and temperature.

Author Contributions

Conceptualization, Y.X. and Z.L.; methodology, Z.L.; data curation, K.W. and Y.W.; software, K.W. and J.Y.; validation, Y.W. and J.Y.; formal analysis, Y.X. and Z.L.; writing—original draft preparation, Y.X. and Z.L.; writing—review and editing, Y.X. and Y.W. All authors have read and agreed to the published version of the manuscript.

Funding

This research is supported by the “National Agricultural Science and Technology Achievement Transformation Fund Project: Application of Warning Technology for Rainstorm-induced Fish Pond Overflow in the Lixia River Area of Jiangsu” (2012GB24160605); in part by China Meteorological Administration Special Fund on Climate Change: Jiangsu Province Climate Change Assessment Report (CCSF201318); in part by the “The Nanjing Vocational University of Industry Technology’s University-level Introduced Talent Research Start-up Fund Project (Natural Science Category) (YK21-05-07); in part by Special funding Project of Independent Scientific Research funds of Jiangsu Institute of Water Conservancy Sciences (2022z021).

Institutional Review Board Statement

Not applicable.

Informed Consent Statement

Not applicable.

Data Availability Statement

Data available on request due to restrictions e.g., privacy or ethical. The data presented in this study are available on request from the corresponding author. The data are not publicly available due to [data usage regulations signed with the data provider].

Acknowledgments

The authors are grateful to the editor and reviewers for their insightful suggestions and valuable assistance in enhancing the quality of the manuscript.

Conflicts of Interest

The authors declare no conflict of interest.

References

  1. Mukherjee, S.; Aadhar, S.; Stone, D.; Mishra, V. Increase in extreme precipitation events under anthropogenic warming in India. Weather Clim. Extrem. 2018, 20, 45–53. [Google Scholar] [CrossRef]
  2. Tramblay, Y.; Somot, S. Future evolution of extreme precipitation in the Mediterranean. Clim. Change 2018, 151, 289–302. [Google Scholar] [CrossRef]
  3. Harpa, G.V.; Croitoru, A.E.; Djurdjevic, V.; Horvath, C. Future changes in five extreme precipitation indices in the lowlands of Romania. Int. J. Climatol. 2019, 39, 5720–5740. [Google Scholar] [CrossRef]
  4. Myhre, G.; Alterskjær, K.; Stjern, C.W.; Hodnebrog, Ø.; Marelle, L.; Samset, B.H.; Sillmann, J.; Schaller, N.; Fischer, E.; Schulz, M. Frequency of extreme precipitation increases extensively with event rareness under global warming. Sci. Rep. 2019, 9, 16063. [Google Scholar] [CrossRef] [PubMed]
  5. Wang, X.; Hou, X.; Wang, Y. Spatiotemporal variations and regional differences of extreme precipitation events in the Coastal area of China from 1961 to 2014. Atmos. Res. 2017, 197, 94–104. [Google Scholar] [CrossRef]
  6. Fu, G.; Yu, J.; Yu, X.; Ouyang, R.; Zhang, Y.; Wang, P.; Liu, W.; Min, L. Temporal variation of extreme rainfall events in China, 1961–2009. J. Hydrol. 2013, 487, 48–59. [Google Scholar] [CrossRef]
  7. Ding, Z.; Lu, R.; Wang, Y. Spatiotemporal variations in extreme precipitation and their potential driving factors in non-monsoon regions of China during 1961–2017. Environ. Res. Lett. 2019, 14, 024005. [Google Scholar] [CrossRef]
  8. Xia, R.; Luo, Y.; Zhang, D.-L.; Li, M.; Bao, X.; Sun, J. On the diurnal cycle of heavy rainfall over the Sichuan basin during 10–18 August 2020. Adv. Atmos. Sci. 2021, 38, 2183–2200. [Google Scholar] [CrossRef]
  9. Liu, W.; Wu, J.; Tang, R.; Ye, M.; Yang, J. Daily precipitation threshold for rainstorm and flood disaster in the mainland of China: An economic loss perspective. Sustainability 2020, 12, 407. [Google Scholar] [CrossRef]
  10. Chen, Y.; Li, Y. Convective characteristics and formation conditions in an extreme rainstorm on the eastern edge of the Tibetan plateau. Atmosphere 2021, 12, 381. [Google Scholar] [CrossRef]
  11. Guo, B.; Xie, T.; Subrahmanyam, M.V. Rainfall runoff in small watershed after wenchuan earthquake in western China based on remote sensing technology–a case study of jianping gully watershed. Pol. J. Environ. Stud. 2021, 30, 2543–2552. [Google Scholar] [CrossRef] [PubMed]
  12. Shi, X.; Wang, J.; Jiang, M.; Zhang, S.; Wu, Y.; Zhong, Y. Extreme rainfall-related accelerations in landslides in Danba County, Sichuan Province, as detected by InSAR. Int. J. Appl. Earth Obs. Geoinf. 2022, 115, 103109. [Google Scholar] [CrossRef]
  13. Wang, H.; Yan, Y.; Long, K.; Chen, Q.; Fan, X.; Zhang, F.; Tan, L. Relationships Between Rapid Urbanization and Extreme Summer Precipitation Over the Sichuan–Chongqing Area of China. Front. Earth Sci. 2022, 10, 899. [Google Scholar] [CrossRef]
  14. Lengfeld, K.; Kirstetter, P.-E.; Fowler, H.J.; Yu, J.; Becker, A.; Flamig, Z.; Gourley, J. Use of radar data for characterizing extreme precipitation at fine scales and short durations. Environ. Res. Lett. 2020, 15, 085003. [Google Scholar] [CrossRef]
  15. Dong, Y.; Li, G.; Jiang, X.; Wang, Y. The characteristics and formation mechanism of double-band radar echoes formed by a severe rainfall occurred in the Sichuan Basin under the background of two vortices coupling. Front. Earth Sci. 2022, 10, 915954. [Google Scholar] [CrossRef]
  16. Kim, I.-W.; Oh, J.; Woo, S.; Kripalani, R. Evaluation of precipitation extremes over the Asian domain: Observation and modelling studies. Clim. Dyn. 2019, 52, 1317–1342. [Google Scholar] [CrossRef]
  17. Fang, J.; Yang, W.; Luan, Y.; Du, J.; Lin, A.; Zhao, L. Evaluation of the TRMM 3B42 and GPM IMERG products for extreme precipitation analysis over China. Atmos. Res. 2019, 223, 24–38. [Google Scholar] [CrossRef]
  18. Ayugi, B.; Zhihong, J.; Zhu, H.; Ngoma, H.; Babaousmail, H.; Rizwan, K.; Dike, V. Comparison of CMIP6 and CMIP5 models in simulating mean and extreme precipitation over East Africa. Int. J. Climatol. 2021, 41, 6474–6496. [Google Scholar] [CrossRef]
  19. Xu, J.; Zhang, Q.; Bi, B.; Chen, Y. Spring extreme precipitation days in North China and their reliance on atmospheric circulation patterns during 1979–2019. J. Clim. 2022, 35, 2253–2267. [Google Scholar] [CrossRef]
  20. Hong, Y.; Ying, S. Characteristics of extreme temperature and precipitation in China in 2017 based on ETCCDI indices. Adv. Clim. Change Res. 2018, 9, 218–226. [Google Scholar]
  21. Deng, M.; Lu, R.; Li, C. Contrasts between the interannual variations of extreme rainfall over western and eastern Sichuan in mid-summer. Adv. Atmos. Sci. 2022, 39, 999–1011. [Google Scholar] [CrossRef]
  22. Wu, X.; Guo, J.; Wu, X.; Guo, J. A new economic loss assessment system for urban severe rainfall and flooding disasters based on big data fusion. Econ. Impacts Emerg. Manag. Disasters China 2020, 188, 259–287. [Google Scholar]
  23. Duan, Z.; Ren, Y.; Liu, X.; Lei, H.; Hua, X.; Shu, X.; Zhou, L. A comprehensive comparison of data fusion approaches to multi-source precipitation observations: A case study in Sichuan province, China. Environ. Monit. Assess. 2022, 194, 422. [Google Scholar] [CrossRef]
  24. Zhang, Z.; Zeng, Y.; Huang, Z.; Liu, J.; Yang, L. Multi-source data fusion and hydrodynamics for urban waterlogging risk identification. Int. J. Environ. Res. Public Health 2023, 20, 2528. [Google Scholar] [CrossRef] [PubMed]
  25. Lazoglou, G.; Anagnostopoulou, C.; Tolika, K.; Kolyva-Machera, F. A review of statistical methods to analyze extreme precipitation and temperature events in the Mediterranean region. Theor. Appl. Climatol. 2019, 136, 99–117. [Google Scholar] [CrossRef]
  26. Xiang, J.; Wang, H.; Li, Z.; Bu, Z.; Yang, R.; Liu, Z. Case Study on the Evolution and Precipitation Characteristics of Southwest Vortex in China: Insights from FY-4A and GPM Observations. Remote Sens. 2023, 15, 4114. [Google Scholar] [CrossRef]
  27. Wang, Y.; Zhang, Z.; Chen, X. Quantifying influences of natural and anthropogenic factors on vegetation changes based on geodetector: A case study in the Poyang Lake Basin, China. Remote Sens. 2021, 13, 5081. [Google Scholar] [CrossRef]
  28. Li, X.; Wang, X.; Babovic, V. Analysis of variability and trends of precipitation extremes in Singapore during 1980–2013. Int. J. Climatol. 2018, 38, 125–141. [Google Scholar] [CrossRef]
  29. Cooley, A.K.; Chang, H. Detecting change in precipitation indices using observed (1977–2016) and modeled future climate data in Portland, Oregon, USA. J. Water Clim. Change 2021, 12, 1135–1153. [Google Scholar] [CrossRef]
  30. Zuo, H.; Lou, Y.; Li, Z. Spatiotemporal Variation of Hourly Scale Extreme Rainstorms in the Huang-Huai-Hai Plain and Its Impact on NDVI. Remote Sens. 2023, 15, 2778. [Google Scholar] [CrossRef]
  31. Barlow, M.; Gutowski, W.J.; Gyakum, J.R.; Katz, R.W.; Lim, Y.-K.; Schumacher, R.S.; Wehner, M.F.; Agel, L.; Bosilovich, M.; Collow, A. North American extreme precipitation events and related large-scale meteorological patterns: A review of statistical methods, dynamics, modeling, and trends. Clim. Dyn. 2019, 53, 6835–6875. [Google Scholar] [CrossRef]
  32. Xu, J.; Li, R.; Zhang, Q.; Chen, Y.; Liang, X.; Gu, X. Extreme large-scale atmospheric circulation associated with the “21· 7” Henan flood. Sci. China Earth Sci. 2022, 65, 1847–1860. [Google Scholar] [CrossRef]
  33. Aihaiti, A.; Jiang, Z.; Li, Y.; Tao, L.; Zhu, L.; Zhang, J. The global warming and IPO impacts on summer extreme precipitation in China. Clim. Dyn. 2023, 60, 3369–3384. [Google Scholar] [CrossRef]
  34. Gu, X.; Zhang, Q.; Singh, V.P.; Shi, P. Non-stationarities in the occurrence rate of heavy precipitation across China and its relationship to climate teleconnection patterns. Int. J. Climatol. 2017, 37, 4186–4198. [Google Scholar] [CrossRef]
  35. Zhao, Y.; Chen, D.; Li, J.; Chen, D.; Chang, Y.; Li, J.; Qin, R. Enhancement of the summer extreme precipitation over North China by interactions between moisture convergence and topographic settings. Clim. Dyn. 2020, 54, 2713–2730. [Google Scholar] [CrossRef]
  36. Liu, M.; Xu, X.; Sun, A.Y.; Wang, K.; Liu, W.; Zhang, X. Is southwestern China experiencing more frequent precipitation extremes? Environ. Res. Lett. 2014, 9, 064002. [Google Scholar] [CrossRef]
  37. Li, Y.G.; He, D.; Hu, J.M.; Cao, J. Variability of extreme precipitation over Yunnan Province, China 1960–2012. Int. J. Climatol. 2015, 35, 245–258. [Google Scholar] [CrossRef]
  38. Yuan, W.; Hu, X.; Tian, Q. Regional differences in rainfall frequency and amount over southwestern China. Atmos. Ocean. Sci. Lett. 2019, 12, 313–319. [Google Scholar] [CrossRef]
  39. Sun, Y.; Niu, T.; He, J.; Ma, Z.; Liu, P.; Xiao, D.; Hu, J.; Yang, J.; Yan, X. Classification of circulation patterns during the formation and dissipation of continuous pollution weather over the Sichuan Basin, China. Atmos. Environ. 2020, 223, 117244. [Google Scholar] [CrossRef]
  40. Zhang, Y.; Sun, J.; Zhu, L.; Tang, H.; Jin, S.; Liu, X. Comparison of two types of persistent heavy rainfall events during sixteen warm seasons in the Sichuan Basin. Atmos. Ocean. Sci. Lett. 2021, 14, 100094. [Google Scholar] [CrossRef]
  41. Feng, S.L.; Jin, S.L.; Fu, S.M.; Sun, J.H.; Zhang, Y.C. Formation of a kind of heavy-precipitation-producing mesoscale vortex around the Sichuan Basin: An along-track vorticity budget analysis. Atmos. Sci. Lett. 2020, 21, e949. [Google Scholar] [CrossRef]
  42. Chen, Y.; Li, Y. Analysis of a late-autumn rainstorm in the Sichuan basin on the eastern side of the Tibetan plateau. Adv. Meteorol. 2019, 2019, 8797368. [Google Scholar] [CrossRef]
  43. Li, X.; Hussain, S.A.; Sobri, S.; Said, M.S.M. Overviewing the air quality models on air pollution in Sichuan Basin, China. Chemosphere 2021, 271, 129502. [Google Scholar] [CrossRef]
  44. Luo, J.; Zhang, J.; Huang, X.; Liu, Q.; Luo, B.; Zhang, W.; Rao, Z.; Yu, Y. Characteristics, evolution, and regional differences of biomass burning particles in the Sichuan Basin, China. J. Environ. Sci. 2020, 89, 35–46. [Google Scholar] [CrossRef] [PubMed]
  45. Ning, G.; Yim, S.H.L.; Wang, S.; Duan, B.; Nie, C.; Yang, X.; Wang, J.; Shang, K. Synergistic effects of synoptic weather patterns and topography on air quality: A case of the Sichuan Basin of China. Clim. Dyn. 2019, 53, 6729–6744. [Google Scholar] [CrossRef]
  46. Qiao, X.; Guo, H.; Tang, Y.; Wang, P.; Deng, W.; Zhao, X.; Hu, J.; Ying, Q.; Zhang, H. Local and regional contributions to fine particulate matter in the 18 cities of Sichuan Basin, southwestern China. Atmos. Chem. Phys. 2019, 19, 5791–5803. [Google Scholar] [CrossRef]
  47. Yang, J.; Huang, M.; Zhai, P. Performance of the CRA-40/Land, CMFD, and ERA-Interim datasets in reflecting changes in surface air temperature over the Tibetan Plateau. J. Meteorol. Res. 2021, 35, 663–672. [Google Scholar] [CrossRef]
  48. Jin, H.; Chen, X.; Zhong, R.; Pan, Y.; Zhao, T.; Liu, Z.; Tu, X. Corrected GCM data through CMFD data to analysis future runoff changes in the source region of the Yangtze River, China. Environ. Earth Sci. 2022, 81, 527. [Google Scholar] [CrossRef]
  49. Li, H.; Wang, X.; Choy, S.; Jiang, C.; Wu, S.; Zhang, J.; Qiu, C.; Zhou, K.; Li, L.; Fu, E. Detecting heavy rainfall using anomaly-based percentile thresholds of predictors derived from GNSS-PWV. Atmos. Res. 2022, 265, 105912. [Google Scholar] [CrossRef]
  50. Holben, B.N. Characteristics of maximum-value composite images from temporal AVHRR data. Int. J. Remote Sens. 1986, 7, 1417–1434. [Google Scholar] [CrossRef]
  51. Dee, D.P.; Uppala, S.M.; Simmons, A.J.; Berrisford, P.; Poli, P.; Kobayashi, S.; Andrae, U.; Balmaseda, M.; Balsamo, G.; Bauer, D.P. The ERA-Interim reanalysis: Configuration and performance of the data assimilation system. Q. J. R. Meteorol. Soc. 2011, 137, 553–597. [Google Scholar] [CrossRef]
  52. Malla, M.K.; Arya, D.S. Event-based extreme precipitation variability analysis over a part of the Hindu Kush Himalayan region. Int. J. Climatol. 2023, 43, 4196–4219. [Google Scholar] [CrossRef]
  53. Asklany, S.A.; Elhelow, K.; Youssef, I.K.; Abd El-wahab, M. Rainfall events prediction using rule-based fuzzy inference system. Atmos. Res. 2011, 101, 228–236. [Google Scholar] [CrossRef]
  54. Zhang, Y.; Xue, M.; Zhu, K.; Zhou, B. What is the main cause of diurnal variation and nocturnal peak of summer precipitation in Sichuan Basin, China? The key role of boundary layer low-level jet inertial oscillations. J. Geophys. Res. Atmos. 2019, 124, 2643–2664. [Google Scholar] [CrossRef]
  55. Zhang, T.; Wei, W.; Zheng, L.; Chen, Y. Characteristics and Variations of Raindrop Size Distribution in Chengdu of the Western Sichuan Basin, China. Atmosphere 2023, 14, 76. [Google Scholar] [CrossRef]
  56. Wu, A.; Li, G. Roles of the Topographically-Affected Boundary Layer Low-Level Jet in the Moisture Transport Process of Nocturnal Rainstorms in Mountainous Areas around the Western Sichuan Basin. Atmosphere 2022, 14, 84. [Google Scholar] [CrossRef]
  57. Zhu, Y.; Liu, X.; Zhang, Y.; Chen, C.; Shen, L.; Ju, Q.; Zhou, T.; Xia, P. The Proportional Characteristics of Daytime and Nighttime Precipitation Based on Daily Precipitation in Huai River Basin, China. Atmosphere 2022, 13, 1287. [Google Scholar] [CrossRef]
  58. Zhou, X.; Jiang, D.; Lang, X. Unstable relationship between the Pacific decadal oscillation and eastern China summer precipitation: Insights from the Medieval Climate Anomaly and Little Ice Age. Holocene 2020, 30, 799–809. [Google Scholar] [CrossRef]
  59. Sharma, A.; Wasko, C.; Lettenmaier, D.P. If precipitation extremes are increasing, why aren’t floods? Water Resour. Res. 2018, 54, 8545–8551. [Google Scholar] [CrossRef]
  60. Wu, D.; Zhao, X.; Liang, S.; Zhou, T.; Huang, K.; Tang, B.; Zhao, W. Time-lag effects of global vegetation responses to climate change. Glob. Change Biol. 2015, 21, 3520–3531. [Google Scholar] [CrossRef]
  61. Wu, T.; Feng, F.; Lin, Q.; Bai, H. Advanced Method to Capture the Time-Lag Effects between Annual NDVI and Precipitation Variation Using RNN in the Arid and Semi-Arid Grasslands. Water 2019, 11, 1789. [Google Scholar] [CrossRef]
  62. Bao, Y.; Song, G.; Li, Z.; Gao, J.; Lü, H.; Wang, H.; Cheng, Y.; Xu, T. Study on the spatial differences and its time lag effect on climatic factors of the vegetation in the Longitudinal Range-Gorge Region. Chin. Sci. Bull. 2007, 52, 42–49. [Google Scholar] [CrossRef]
  63. Zhe, M.; Zhang, X. Time-lag effects of NDVI responses to climate change in the Yamzhog Yumco Basin, South Tibet. Ecol. Indic. 2021, 124, 107431. [Google Scholar] [CrossRef]
  64. Kong, D.; Miao, C.; Wu, J.; Zheng, H.; Wu, S. Time lag of vegetation growth on the Loess Plateau in response to climate factors: Estimation, distribution, and influence. Sci. Total Environ. 2020, 744, 140726. [Google Scholar] [CrossRef]
  65. Chamaille-Jammes, S.; Fritz, H.; Murindagomo, F. Spatial patterns of the NDVI–rainfall relationship at the seasonal and interannual time scales in an African savanna. Int. J. Remote Sens. 2006, 27, 5185–5200. [Google Scholar] [CrossRef]
  66. Wu, X.; Mao, J. Spatial and interannual variations of spring rainfall over eastern China in association with PDO–ENSO events. Theor. Appl. Climatol. 2018, 134, 935–953. [Google Scholar] [CrossRef]
  67. Miao, C.; Duan, Q.; Sun, Q.; Lei, X.; Li, H. Non-uniform changes in different categories of precipitation intensity across China and the associated large-scale circulations. Environ. Res. Lett. 2019, 14, 025004. [Google Scholar] [CrossRef]
  68. Wen, N.; Liu, Z.; Li, L. Direct ENSO impact on East Asian summer precipitation in the developing summer. Clim. Dyn. 2019, 52, 6799–6815. [Google Scholar] [CrossRef]
  69. Hu, J.; Wang, W.; Tan, Y. Contrasting impacts of three types of ENSO event on boreal autumn rainfall over Southwest China. J. Geosci. Environ. Prot. 2021, 9, 14–27. [Google Scholar] [CrossRef]
  70. Yang, X.; Wu, J.; Liu, J.; Ye, X. Changes of extreme precipitation and possible influence of enso events in a humid basin in China. Atmosphere 2021, 12, 1522. [Google Scholar] [CrossRef]
  71. Qian, T.; Zhao, P.; Zhang, F.; Bao, X. Rainy-season precipitation over the Sichuan basin and adjacent regions in southwestern China. Mon. Weather Rev. 2015, 143, 383–394. [Google Scholar] [CrossRef]
  72. Qi, D.; Li, Y.; Zhou, C.; Chen, D. Climatic change of summer rainstorms and the water vapor budget in the Sichuan Basin. J. Appl. Meteorol. Climatol. 2022, 61, 537–557. [Google Scholar] [CrossRef]
  73. Tang, S.; Li, R.; He, J. Modeling and evaluating systematic and random errors in multiscale GPM IMERG summer precipitation estimates over the Sichuan Basin. IEEE J. Sel. Top. Appl. Earth Obs. Remote Sens. 2021, 14, 4709–4719. [Google Scholar] [CrossRef]
  74. Shi, P.; Wu, M.; Qu, S.; Jiang, P.; Qiao, X.; Chen, X.; Zhou, M.; Zhang, Z. Spatial distribution and temporal trends in precipitation concentration indices for the Southwest China. Water Resour. Manag. 2015, 29, 3941–3955. [Google Scholar] [CrossRef]
  75. Fang, D.; Dong, X.; Deng, C.; Wu, Z.; Hai, C.; Gao, S.; Huang, A. Temporal and Spatial Distribution of Precipitation in Chongqing during 2008–2016. Chin. J. Atmos. Sci 2020, 44, 327–340. [Google Scholar]
  76. Feidas, H.; Karagiannidis, A.; Keppas, S.; Vaitis, M.; Kontos, T.; Zanis, P.; Melas, D.; Anadranistakis, E. Modeling and mapping temperature and precipitation climate data in Greece using topographical and geographical parameters. Theor. Appl. Climatol. 2014, 118, 133–146. [Google Scholar] [CrossRef]
  77. Xu, B.; Li, J.; Luo, Z.; Wu, J.; Liu, Y.; Yang, H.; Pei, X. Analyzing the spatiotemporal vegetation dynamics and their responses to climate change along the Ya’an–Linzhi section of the Sichuan–Tibet Railway. Remote Sens. 2022, 14, 3584. [Google Scholar] [CrossRef]
  78. Li, X.; Wang, N.; Wu, Z. Terrain effects on regional precipitation in a warm season over Qinling-Daba mountains in central China. Atmosphere 2021, 12, 1685. [Google Scholar] [CrossRef]
  79. Zheng, Z.; Xu, G.; Gao, H. Characteristics of summer hourly extreme precipitation events and its local environmental influencing factors in Beijing under urbanization background. Atmosphere 2021, 12, 632. [Google Scholar] [CrossRef]
  80. Zhang, B.; Zhou, W. Spatial–temporal characteristics of precipitation and its relationship with land use/cover change on the Qinghai-Tibet Plateau, China. Land 2021, 10, 269. [Google Scholar] [CrossRef]
  81. Kang, L.; Di, L.; Deng, M.; Shao, Y.; Yu, G.; Shrestha, R. Use of geographically weighted regression model for exploring spatial patterns and local factors behind NDVI-precipitation correlation. IEEE J. Sel. Top. Appl. Earth Obs. Remote Sens. 2014, 7, 4530–4538. [Google Scholar] [CrossRef]
  82. Sharma, M.; Bangotra, P.; Gautam, A.S.; Gautam, S. Sensitivity of normalized difference vegetation index (NDVI) to land surface temperature, soil moisture and precipitation over district Gautam Buddh Nagar, UP, India. Stoch. Environ. Res. Risk Assess. 2022, 36, 1779–1789. [Google Scholar] [CrossRef] [PubMed]
  83. Chu, X.-L.; Zhong, L.; Dan, W.; Lei, G.-P. Effects of land use/cover change (LUCC) on the spatiotemporal variability of precipitation and temperature in the Songnen Plain, China. J. Integr. Agric. 2022, 21, 235–248. [Google Scholar] [CrossRef]
  84. Jiao, K.; Gao, J.; Liu, Z. Precipitation drives the NDVI distribution on the Tibetan Plateau while high warming rates may intensify its ecological droughts. Remote Sens. 2021, 13, 1305. [Google Scholar] [CrossRef]
  85. Chen, T.; Xia, J.; Zou, L.; Hong, S. Quantifying the influences of natural factors and human activities on NDVI changes in the Hanjiang River Basin, China. Remote Sens. 2020, 12, 3780. [Google Scholar] [CrossRef]
  86. Peng, W.; Kuang, T.; Tao, S. Quantifying influences of natural factors on vegetation NDVI changes based on geographical detector in Sichuan, western China. J. Clean. Prod. 2019, 233, 353–367. [Google Scholar] [CrossRef]
  87. Chen, Y.; Ma, L.; Liu, T.; Huang, X.; Sun, G. The Synergistic Effect between Precipitation and Temperature for the NDVI in Northern China from 2000 to 2018. Appl. Sci. 2023, 13, 8425. [Google Scholar] [CrossRef]
  88. Xu, Y.; Huang, W.-T.; Dou, S.-Q.; Guo, Z.-D.; Li, X.-Y.; Zheng, Z.-W.; Jing, J.-L. Responding mechanism of vegetation cover to climate change and human activities in southwest China from 2000 to 2020. Huan Jing Ke Xue Huanjing Kexue 2022, 43, 3230–3240. [Google Scholar]
  89. Yang, Y.; Wang, S.; Bai, X.; Tan, Q.; Li, Q.; Wu, L.; Tian, S.; Hu, Z.; Li, C.; Deng, Y. Factors affecting long-term trends in global NDVI. Forests 2019, 10, 372. [Google Scholar] [CrossRef]
  90. Pui, A.; Sharma, A.; Mehrotra, R.; Sivakumar, B.; Jeremiah, E. A comparison of alternatives for daily to sub-daily rainfall disaggregation. J. Hydrol. 2012, 470–471, 138–157. [Google Scholar] [CrossRef]
  91. Manikanta, V.; Ganguly, T.; Umamahesh, N.V. A Multi criteria Decision Making based nonparametric method of fragments to disaggregate daily precipitation. J. Hydrol. 2023, 617, 128994. [Google Scholar] [CrossRef]
  92. Smith, A.B.; Alsdurf, J.; Knapp, M.; Baer, S.G.; Johnson, L.C. Phenotypic distribution models corroborate species distribution models: A shift in the role and prevalence of a dominant prairie grass in response to climate change. Glob. Change Biol. 2017, 23, 4365–4375. [Google Scholar] [CrossRef] [PubMed]
  93. Navarro, J.; Powers, J.M.; Paul, A.; Campbell, D.R. Phenotypic plasticity and selection on leaf traits in response to snowmelt timing and summer precipitation. New Phytol. 2022, 234, 1477–1490. [Google Scholar] [CrossRef]
  94. Münzbergová, Z.; Hadincová, V.; Skálová, H.; Vandvik, V. Genetic differentiation and plasticity interact along temperature and precipitation gradients to determine plant performance under climate change. J. Ecol. 2017, 105, 1358–1373. [Google Scholar] [CrossRef]
Figure 1. An overview of the natural characteristics and land use in the Sichuan Basin. (A) represents topographical information; (B) displays land use and land cover information.
Atmosphere 14 01719 g001
Figure 2. Contrast between trends in ERA5 hourly data and meteorological observation data.
Atmosphere 14 01719 g002
Figure 3. Explanation of event-based extreme precipitation concept and five rainfall distribution patterns. Note: The primary rainfall types (abbreviated as RT) are categorized into five, namely early single peak (RT1), late single peak (RT2), uniform rainfall type (RT3), single-day rainfall type (RT4), and dual peak type (RT5).
Atmosphere 14 01719 g003
Figure 4. Daily extreme precipitation patterns in the Sichuan Basin. (A) average precipitation; (B) average long-term heavy rainfall (mean R95daily); (C) proportion of intense rainfall relative to total precipitation.
Atmosphere 14 01719 g004
Figure 5. Depicts features of the multiyear mean daily extreme rainfall, the percentage of heavy rain, and the extent of intense precipitation occurrences across the Sichuan Basin. (A) represents the total annual precipitation; (B) indicates the contribution rate of rainfall; (C) shows the proportion of the area affected by rains to the entire area.
Atmosphere 14 01719 g005
Figure 6. Temporal characteristics of daily extreme rainfall frequency, intensity, and dispersion in the Sichuan Basin. (A) shows the annual occurrence frequency of extreme rainfall events; (B) provides a visual representation of the intensity of extreme rainfall occurrences yearly; (C) provides an insight into the yearly dispersion of such events.
Atmosphere 14 01719 g006
Figure 7. Illustrates the geographic distribution features of extreme hourly rainstorms within the Sichuan Basin. (A) represents intense hourly rainfall magnitude; (B) depicts the ratio of extreme hourly rainfall to total rainfall; (C) shows the dispersion of extreme hourly rainstorms; (D) displays the frequency of extreme hourly rain events.
Atmosphere 14 01719 g007
Figure 8. Statistical characteristics of frequency, intensity, and contribution rate of extreme hourly rainfall in the Sichuan Basin. Note: (AF) describe the distribution characteristics of various statistical indicators of extreme hourly rainfall over 24 h. (A) displays the average frequency of extreme hourly rainfall over the years; (B) provides the radial distribution characteristics of the cumulative frequency of extreme hourly rainfall over the years. (C,D) are the box plot and radial distribution chart for the intensity of extreme hourly rainfall. (E,F), respectively, exhibit the box distribution and radial distribution of the proportion of extreme hourly rainfall to the total precipitation (rainfall intensity).
Atmosphere 14 01719 g008
Figure 9. Presents multitemporal features of extreme hourly rainstorms in the Sichuan Basin. (A) to (C) represent the annual, seasonal, and monthly variations in the intensity of extreme hourly rainfall. (D) to (F) show the annual, seasonal, and monthly variations in the frequency of extreme hourly rainfall. (G) to (I) depict the annual, seasonal, and monthly variations in the dispersion of extreme hourly rainfall.
Atmosphere 14 01719 g009
Figure 10. A spatial comparison of extreme hourly rainstorm occurrences at two distinct time points (19:00 and 21:00) within the Sichuan Basin. (A,E) show the precipitation volume of extreme hourly rainstorms; (B,F) depict the intensity of extreme rainfall; (C,G) illustrate the ratio of extreme hourly rain to the overall precipitation amount; (D,H) display the frequency of extreme hourly rainfall incidents.
Atmosphere 14 01719 g010
Figure 11. Extreme value properties of hourly intense rainfall in the Sichuan Basin. (A) presents the yearly peak of extreme hourly rainfall values; (B) depicts the hourly occurrence frequency of the highest values in extreme rainfall.
Atmosphere 14 01719 g011
Figure 12. Showcases the rainfall type characteristics in extreme rainstorms within the Sichuan Basin. (A) displays the distribution patterns of rainfall categories during different periods; (B) displays the distribution proportions of five types of rainfall across various periods. Rain type 1 corresponds to a front-dominant precipitation pattern, while rain type 2 signifies a post-dominant precipitation pattern. Rain type 3 represents a balanced precipitation pattern, rain type 4 indicates a single-day precipitation pattern, and rain type 5 reflects a bimodal precipitation pattern.
Atmosphere 14 01719 g012
Figure 13. Trends in NDVI and extreme hourly rainfall on a ten-day basis within the Sichuan Basin. (A) describes the spatial distribution characteristics of extreme hourly precipitation at the ten-day scale; (B) represents the spatial variation trend of extreme hourly precipitation; (C) displays the spatial distribution features of NDVI at the ten-day scale; and (D) depicts the spatial trend of NDVI variation.
Atmosphere 14 01719 g013
Figure 14. Correlation analysis of NDVI and extreme hourly rainfall on a ten-day scale in the Sichuan Basin. (AD) represent zero-order to third-order lag correlations. Correlation coefficients are shown at a 5% significance level. Black squares indicate nonsignificant results.
Atmosphere 14 01719 g014
Figure 15. Monthly-scale correlation analysis of extreme hourly rainfall and NDVI in the Sichuan Basin. Red indicates positive correlation, blue indicates negative correlation, and the symbol [***] denotes significance at p < 0.05. (A) represents the climatological average of extreme hourly precipitation over multiple years on a monthly basis; (B) shows the average status of NDVI over multiple years on a monthly basis.
Atmosphere 14 01719 g015
Table 1. Pearson correlation coefficient between ground observed precipitation data and ERA5 precipitation data.
Correlationp_ValueSignificant
0.790.004***
Note: Under the significance level of 0.05, the correlation coefficient p-value is far less than 0.01, indicating a significant correlation, denoted by (***) in the text.
Table 2. Extreme precipitation indices.
IndexDefinitionUnit
Precipitation amount (tp)The cumulative precipitation surpassing the threshold of 0.1 mmmm
Daily rainstorm amount (tp_daily)Daily precipitation ≥ R95dailymm
Hourly rainstorm amount (tp_hourly)Hourly precipitation ≥ R95hourlymm
Contribution of rainstormThe proportion of accumulated precipitation exceeding the rainstorm threshold to the overall precipitation recorded during the corresponding perioddimensionless
Contribution rate of heavy rainfall area (contribution of area)The fraction of the region experiencing precipitation above the rainstorm threshold to the entire area with recorded precipitation during the corresponding timeframedimensionless
Frequency of rainstorm (frequency)Frequency of rainstormsdimensionless
Rainstorm intensity (intensity)The proportion of accumulated precipitation exceeding a specific threshold to the time span when precipitation reaches or exceeds that threshold within the given timeframemm/day or
mm/h
Rainstorm dispersion (cv)The ratio between the standard deviation of heavy rainfall and its corresponding mean value within the same timeframedimensionless
Table 3. Correlation between monthly NDVI and extreme hourly rainstorms.
MonthCorrelationp_ValueSignificant
10.320.03
20.050.08
3−0.010.15
40.100.09
5−0.110.04
60.040.02
7−0.140.11
8−0.260.03***
90.030.14
10−0.150.11
11−0.050.07
120.250.10
Note: the symbol [***] denotes significance at p < 0.05.
Disclaimer/Publisher’s Note: The statements, opinions and data contained in all publications are solely those of the individual author(s) and contributor(s) and not of MDPI and/or the editor(s). MDPI and/or the editor(s) disclaim responsibility for any injury to people or property resulting from any ideas, methods, instructions or products referred to in the content.

