Article

Variation of Electron Density in the D-Region Using Kunming MF Radar under Low Solar Activity

1
National Key Laboratory of Electromagnetic Environment, China Research Institute of Radiowave Propagation, Qingdao 266107, China
2
Kunming Electro-Magnetic Environment Observation and Research Station, Qujing 655500, China
3
School of Physics, Xidian University, Xi’an 710071, China
*
Author to whom correspondence should be addressed.
Atmosphere 2023, 14(12), 1764; https://doi.org/10.3390/atmos14121764
Submission received: 28 September 2023 / Revised: 17 November 2023 / Accepted: 20 November 2023 / Published: 29 November 2023

Abstract

:
So far, the least is known about the D-region ionosphere out of the entire ionosphere due to the lack of a conventional detecting method and continuous data accumulation. Medium frequency (MF) radar is an important conventional tool for understanding the D-region ionosphere by measuring the electron density (Ne) within the height range of 60–90 km. To investigate the statistical variation of the D-region, especially at the mid-low latitude area, this study presents the statistical variations in the D-region Ne with the solar zenith angle (SZA), season, and altitude observed by Kunming MF radar (25.6° N, 103.8° E) under low solar activity (2008–2009). The diurnal variation of Ne behaves like typical diurnal changes, which are closely consistent with the SZA. The outstanding feature, the diurnal asymmetry phenomenon, significantly appears in different seasons and at different altitudes. The Ne has obvious semi-annual characteristics, and is larger in summer and fall and the smallest in winter. Compared to other seasons, the variation in the Ne with altitude is the most stable in summer. Due to the impacts of the highest SZA, the value of Ne in winter is the smallest, with a maximum value of less than 300 electrons/cm3, and the largest in summer and fall, with a maximum of 472 electrons/cm3. Particularly, the peaks of Ne above 76 km do not always appear at the time when the SZA is the smallest (at noon). Both the simulations by the International Reference Ionosphere (IRI2016) and observations using MF radar present a strong positive correlation with solar radiation. Meanwhile, it cannot be ignored that there were still large differences between the simulations and observations. To quantitatively analyze the differences between the observations and simulations, the observed value was subtracted from the simulated value. The results show that the maximum value between them was up to 350 electrons/cm3, and the minimum difference appeared at around 72 km, with a value less than 100 electrons/cm3. However, below 66 km, the observations were larger than the simulations, which were, on the contrary, above 76 km.

1. Introduction

The ionospheric D-region is in the altitude range of 60–90 km, which stays in the lowest region of the entire ionosphere. As a key area of momentum and energy coupling between the lower and upper atmosphere, there are fully complicated photochemical and dynamical processes in the D-region. The significant characteristic of the D-region is that the Ne is much lower than that in the upper ionosphere [1]. In addition, there are high proportions of multi-neutral molecules, ion clusters, and electrons in this region, resulting in a significantly high collision frequency between the different components. Some studies have confirmed the correlation between a significant radio wave absorption through this region and high collision frequency, for example, called short-wave communication sudden interruption [2,3,4,5]. The lowest available frequency for High-frequency(HF) users is directly related to the electron density in the D-Region [6].
In recent years, studies on the D-region ionosphere have become more and more focused on rocket-borne [7,8], incoherent scattering radar [9,10], electric wave cross-modulation [11], very low frequency (VLF) [12,13,14,15], etc. However, rocket and incoherent scattering radar are not taken as routine measurements to analyze the characteristics of Ne in the D-region due to their high costs. HF radars have also been proven reliable but have limited their coverage at a fixed station. VLF radio signals could be utilized to obtain the information on the equivalent reflection height of the D-region [16], while it is hard to precisely invert the parameter Ne in the D-region [17].
With the rapid development of detecting technology, MF radar has become a significant routine instrument to observe the Ne profile and neutral wind in the D-region, due to its advantages of simple equipment, and convenient and unattended operation [18,19,20,21,22,23]. Igarashi et al. (2000) found that the monthly variation of Ne was slightly consistent with the International Reference Ionosphere (IRI-95) simulations in December 1997 under low solar activity at Wakkanai (45.36° N, 141.81° E), but that was lower than the IRI-95 model simulations in March, June, and September in 1997 below 80 km [24]. The measured Ne values at Poker Flat (65.1° N, 147.5° W) within the altitude range of 62–84 km were larger than those from the IRI-95 model [24]. On the basis of observations of the Ne by Wakanai MF radar in Japan, Zhang et al. (2003) found that the temporal variation in the lower D-region had a good correlation with the soft X-ray flux, and the increases in the Ne for some of the flares reached as high as 400 cm−3, while some of them only reached about 100 cm−3 [25]. Venkatesham et al. (2019) showed increases in the H′ of about 2.3 km near the central line of totality, of 3.0 km in the region near the totality fringe, and of 2.4 to 3.0 km in the D-region under partial eclipse [26]. Silva et al. (2021) found that daytime sudden Ne changes registered by Arecibo’s incoherent-scatter radar during thunderstorm times were, on average, different from those happening during fair weather conditions (driven by other external factors). These changes typically correspond to Ne depletion in the D and E regions, and these disturbances are different from those associated with solar flares [27]. Baumann et al. (2022) reported the Ne measurements from the Arecibo incoherent-scatter radar being performed during sunset and sunrise conditions and found an asymmetry of the Ne with a higher Ne during sunset than during sunrise, which extended from the solar zenith angles of 80° to 100° [28]. Li et al. (2019) studied the Ne in the D-region observed by Kunming MF radar (25.6° N, 103.8° E) to solar flares and found a sharp decrease from 76 to 80 km during the non-flare period to nearly 58 km with flares, and a sudden increase from below 4 × 10⁸ m3 in the non-flare period to 1.8 × 10⁹ m3 during 13 M-level flares [29]. Ding et al. (2022) analyzed the characteristics of ionospheric Ne in the E-F valley based on Qujing incoherent-scatter radar [30]. Wang et al. (2023) studied the deep learning-based forecasting model for the peak height of the ionospheric F2 layer, the maximum usable frequency for HF communication, and ionospheric TEC prediction [31,32,33]. Certainly, studies on the atmospheric angular spectrum [34,35], mean wind [36], and wave–wave interactions [37,38] have been conducted as a topic based on observations from MF radar.
Overall, the variation of Ne in the D-region has received little attention due to the lack of long-term accumulated data. The Kunming MF radar has running since the year 2008, which provides great access to further understand the variability in Ne [39,40,41,42]. In this study, we perform an analysis of the observations of Ne under low solar activity from August 2008 to July 2009 to increase the knowledge of the characteristics in the D-region around the Kunming area. The MF radar and data processing method are presented in Section 2. The analysis of the Ne profiles in different seasons and different solar zenith angles is given in Section 3. In Section 4, a discussion is presented on the variations of Ne. Finally, the conclusion is presented in Section 5.

2. MF Radar and Data Processing

An integrated platform for detection was built by the Chinese Research Institute of Radio Wave Propagation (CRIRP) at Kunming Station in 2007, which includes stratosphere-troposphere(ST) radar, meteor radar, incoherent scattering radar [41], ionosonde, lidar, MF radar [40], etc. MF radar is used to observe the atmospheric neutral wind and Ne profile within the altitude of 60–90 km. Its system consists of a transmitter, receiver, space antenna, data processor, and a display system. Four mutually independent cross-dipole antennas are arranged in an equilateral triangle to form a transceiver antenna array, in which three antennas are arranged radially with the other at 120°. The dipoles of each cross-dipole antenna intersect at 90°, which is convenient for forming right circular polarization and left circular polarization modes. Detailed information about the radar is shown in reference [40].
MF radar works based on the partial reflection principle. The intensity of the reflected signal is proportional to the gradient of Ne and inversely proportional to the square of the electromagnetic wave frequency, so that the lower the radar frequency, the stronger the echo. However, the total reflection of the electromagnetic wave will occur at the lower altitude if the frequency is too low, further leading to the echo at the higher altitude not being obtained. Therefore, the frequency is usually selected between 1.8 MHz and 2.5 MHz. For example, the frequency of Kunming MF radar is 2.138 MHz [40]. The radar alternately runs the two modes of full correlation analysis (FCA; for the first 2 min) and differential absorption experiments (DAEs; for the latter 1 min) to detect the atmospheric wind field and Ne in 60–100 km, respectively. The vertical height resolution is 2 km. The specific parameters of the DAEs are shown in Table 1.
The Ne from August 2008 to July 2009 under low solar activity was utilized in this study to statistically analyze its variations in the ionospheric D-region. The Ne observations between 08:00 LT and 17:00 LT were taken as available data due to the increase in ground background noise at sunrise and sunset [40]. In addition, the Ne above 84 km increased with the altitude rapidly due to the variability in the ionization source [42], and the Ne below 64 km was too weak with low confidence to be regarded as reliable data, so the altitude range of 64–80 km was selected as the altitude range of reliable data. The daily value of Ne was averaged for the analysis. In addition, the equinoxes (March and September) and solstices (June and December) months were chosen to represent the four seasons of spring, fall, summer, and winter, respectively.

3. Results and Comparison

There are always some missing data, especially during sunrise or sunset or other times due to the value of Ne in the D-region being too low to be detected. To ensure the better effectiveness and higher credibility, the observations at different heights and times must be averaged over 30 days to obtain the average diurnal Ne. A similar data processing method can be found in the paper [43]. Next, the hourly values were averaged to obtain the monthly averaged diurnal Ne with a time resolution of 1 h.
Figure 1 shows the monthly average diurnal variation of the Ne in four seasons from the year 2008 to 2009, where the X-axis means the local time in the Kunming area, and the values at the top of every contour plot indicate the SZA corresponding to the local time. Figure 1a–d represents fall, winter, spring, and summer, respectively. The variation in the SZA reflects the diurnal variation in the solar radiation. The smaller the SZA, the stronger the solar radiation. As shown in Figure 1a, in fall, the Ne below 76 km is obviously lower at sunrise or sunset, and larger around noon. Specifically, the Ne is lower than 100 electrons/cm3 at sunrise and sunset, while it stays at a maximum of approximately 250 electrons/cm3 at noon. The comparison shows that the Ne below 76 km has a strong negative correlation with the SZA, indicating that the diurnal variations of the Ne below 76 km are closely consistent with solar radiation. Above 76 km, similar variabilities in the Ne and SZA present some differences in comparison to that below 76 km. Although the variation of the Ne above 76 km has a strong negative correlation with the SZA, these maximums of the Ne occurred at 10 LT, 13 LT, and 15 LT, respectively, not at noon (12 LT). At each local time, the Ne increases with the increasing height. Below 66 km, enhanced Ne could also be seen in fall, which still implies the existing uncertain ionization sources at the bottom of the D-region ionosphere, and the interesting investigation about them will be further studied in future work.
The Ne in winter shown in Figure 1b has a stronger negative correlation with the SZA in comparison to that in fall. The Ne value is lower in winter, with a maximum of approximately 300 electrons/cm3, and a minimum of approximately 100 electrons/cm3 in fall. The maximum above 68 km occurs at 13 LT, not at noon. Similar to that in fall, the additional ionization in winter occurs at sunrise and sunset. Comparing Figure 1a–d, it was found that the diurnal variations in the Ne in spring and summer have similar characteristics to that in fall and winter, while some differences also exist. Below 76 km, the Ne enhances with a negative SZA and increasing height, and the maximum always occurs at 13 LT after noon. Above 76 km, the Ne in summer, with two peaks at 10 LT and 15 LT, is slightly larger than that in spring, which has two peaks at 12 LT and 14 LT. The main difference among the four seasons is that three peak values of Ne above 76 km occurred in fall, two in spring and summer, and only one in winter. Additional ionization enhancement below 66 km could be found in each season, which may be more significant in winter. This phenomenon implies that the ionization sources in the D-region ionosphere are complex.
As mentioned above, the diurnal variations in the Ne in the four seasons have a strong correlation with the solar radiation, but still show slight differences among them. Due to the impacts of the highest SZA, the value of Ne in winter is the smallest, with a maximum value of less than 300 electrons/cm3. The largest is in summer and fall, with a maximum of 472 electrons/cm3. Here, it must be mentioned that the peaks of Ne above 76 km do not always appear at the time when the SZA is the smallest (at noon). In other words, this phenomenon is considered diurnal asymmetry, which means that the Ne value is different when the SZA before noon is the same as that after noon [44,45,46]. For example, the peaks occur at 12 LT and 14 LT in spring, at 10 LT and 15 LT in summer, and at 10 LT, 13:00 LT, and 15 LT in fall. Rupa (2003) has reported the asymmetry in the diurnal variation in the D-region in the Adelaide area [23].
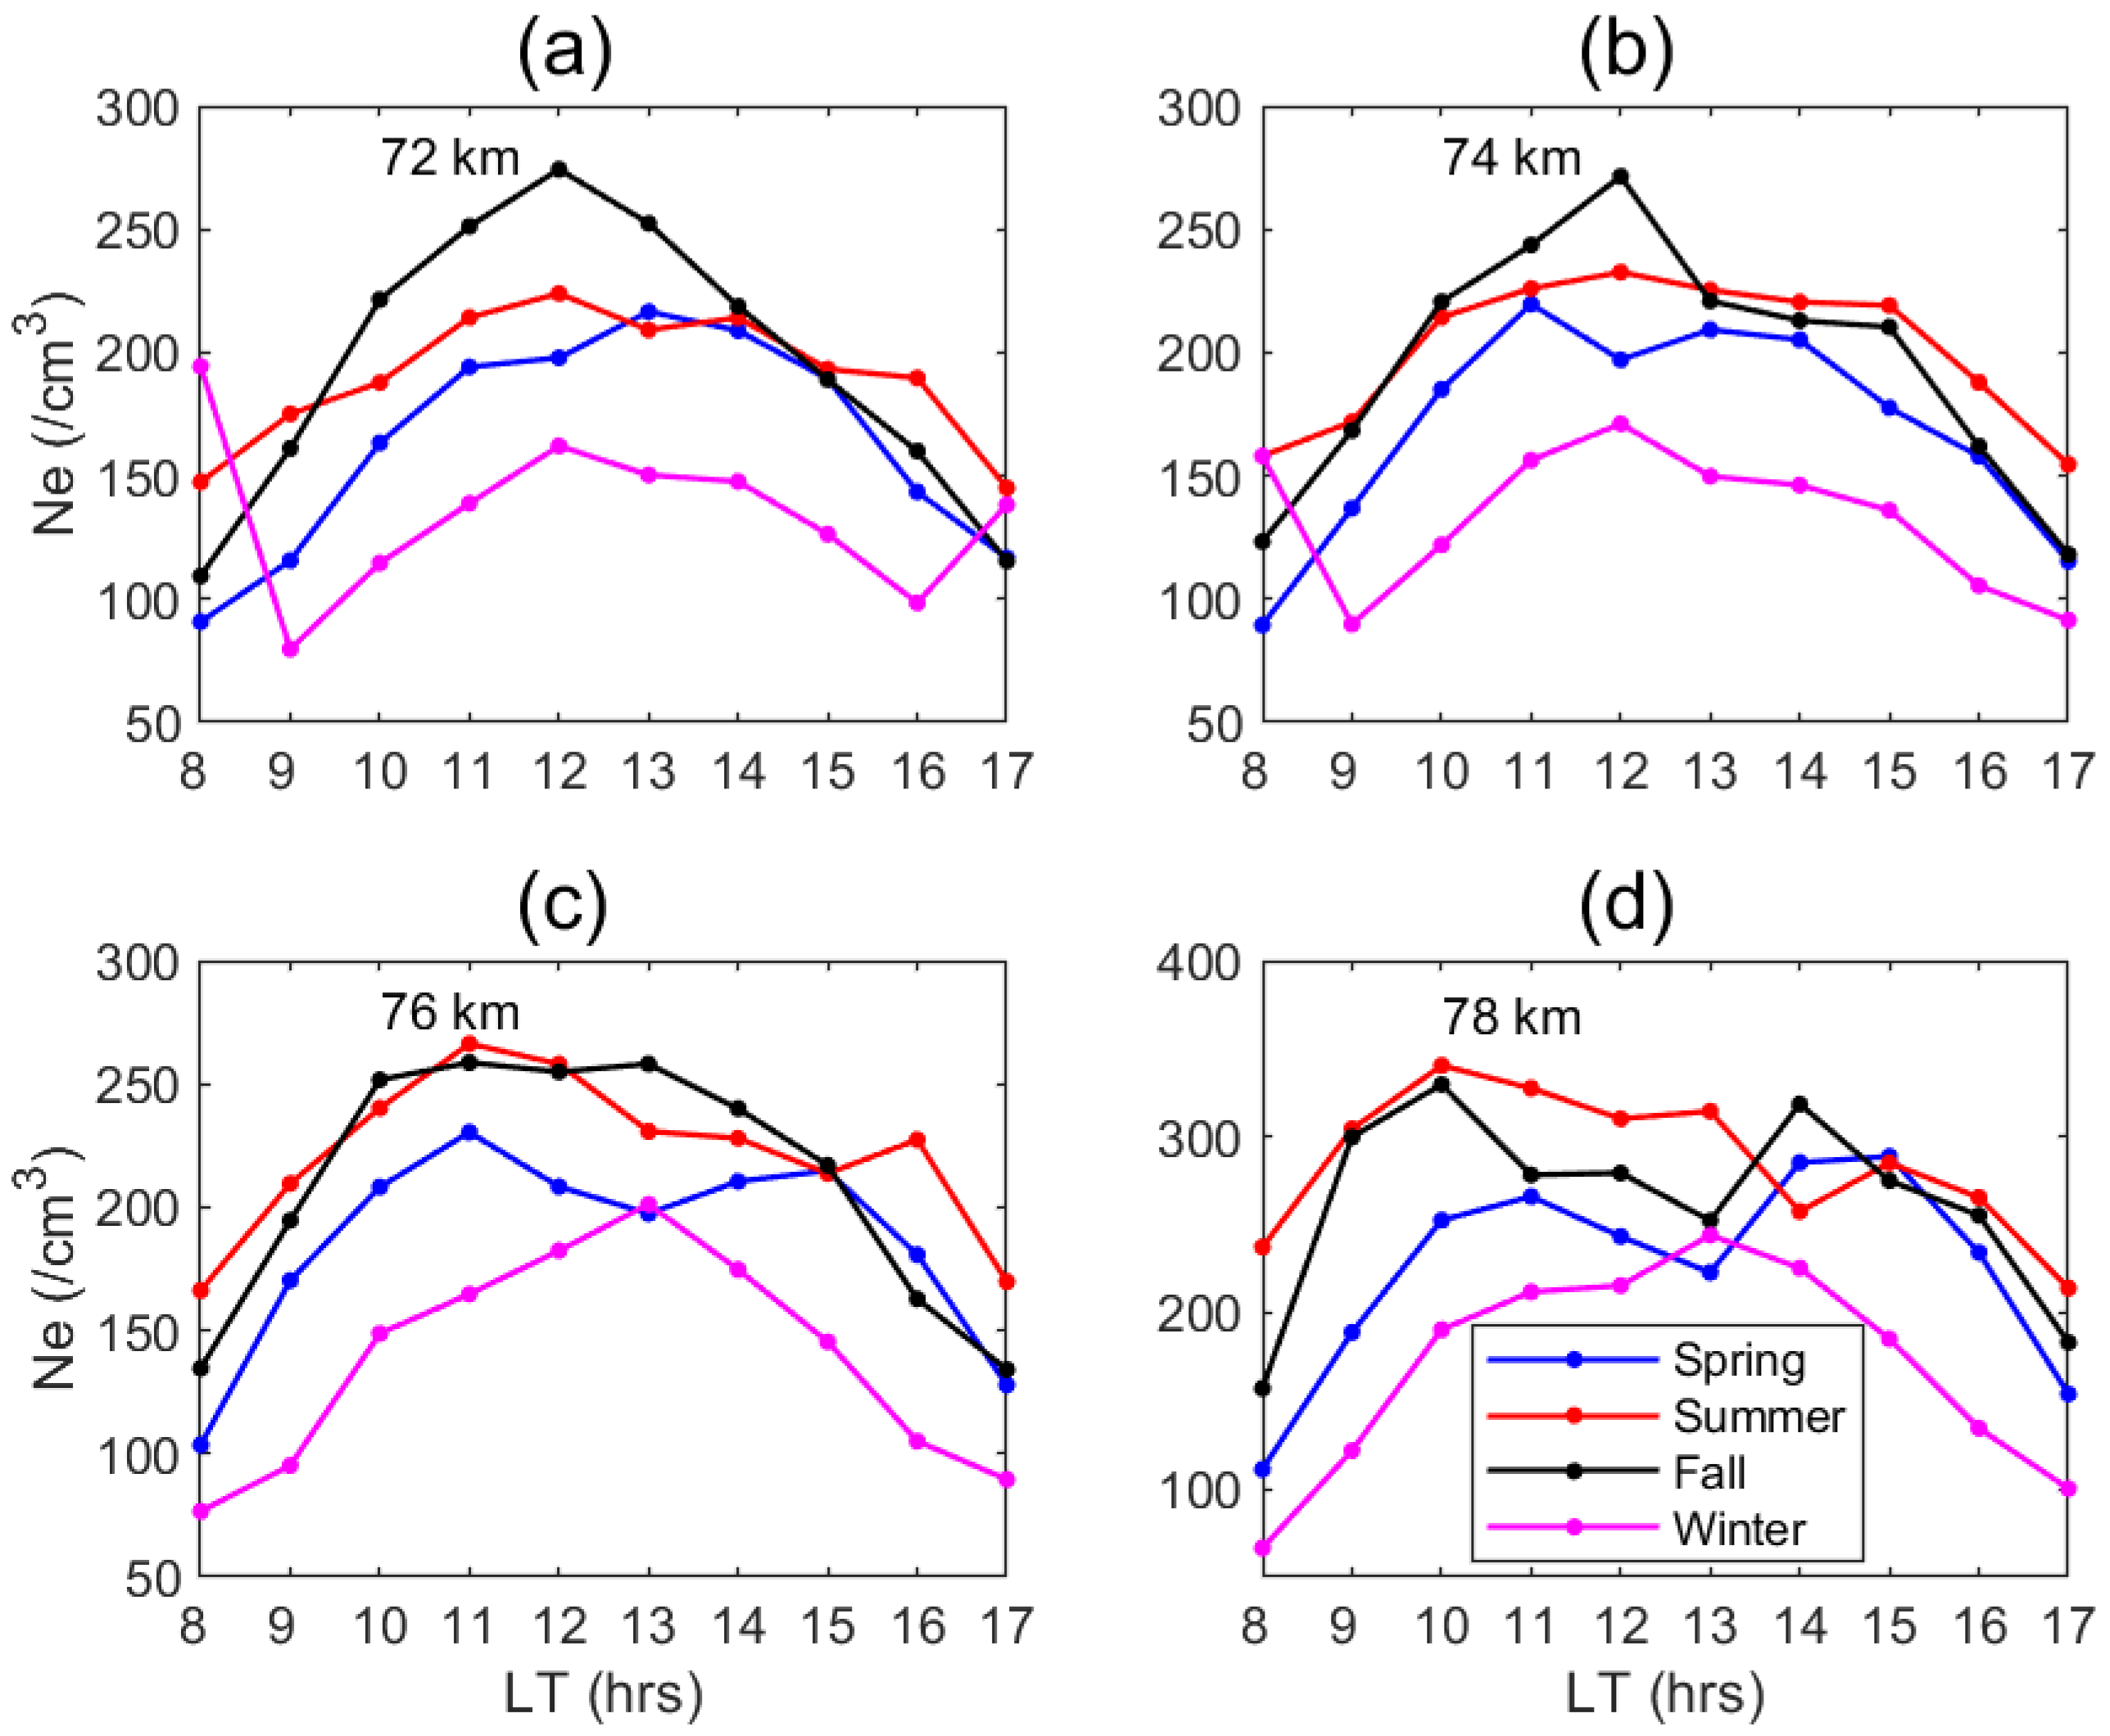
To analyze the variability in the Ne with SZA in detail, the diurnal variation in the Ne from the altitude of 72 to 78 km in the four seasons is shown in Figure 2. It is noted that the Ne in winter is the smallest among the four seasons. The Ne is the second smallest during spring, but it is similar at 13 LT and 14 LT in summer and fall at the altitudes of 72 km and 74 km, respectively. The Ne in spring at 76 km is lower than that in summer and fall until 15 LT, while at 78 km, it is lower until 11 LT. At the altitudes of 72 km and 74 km, the Ne in fall is the largest from 10 LT to 13 LT, which is comparable to the Ne in summer at 76 km and 78 km.
Furthermore, Figure 2 also shows that the occurring time of the peak Ne varies with the altitude within the range of 72 to 78 km. Figure 2a–d shows the different altitudes at 72 km, 74 km, 76 km, and 78 km, respectively. It is shown that the Ne at 72–74 km reaches its maximum at 12 LT in summer, fall, and winter. The maximum values of the Ne at 72 km are approximately 225 electrons/cm3 in summer, 275 electrons/cm3 in fall, and 161 electrons/cm3 in winter, respectively. Meanwhile, the maximum values of the Ne for the corresponding seasons at 74 km are 230 electrons/cm3, 278 electrons/cm3, and 165 electrons/cm3. The peak Ne in spring is 215 electrons/cm3 at 13 LT around 72 km, 220 electrons/cm3 at 11 LT, and 204 electrons/cm3 at 13 LT around 74 km. Here, we ignore the Ne values in winter during sunrise (8 LT) and sunset (17 LT) due to the high noise. At altitudes of 76–78 km, there are two peaks each in spring, summer, and fall, while there is only one peak in winter. At 76 km, the two peaks are 226 electrons/cm3 at 11 LT and 219 electrons/cm3 at 15 LT in spring, 270 electrons/cm3 at 11 LT and 234 electrons/cm3 at 16 LT in summer, 254 electrons/cm3 at 11 LT and 253 electrons/cm3 at 13 LT in fall. At 78 km, the two peaks are 280 electrons/cm3 at 11 LT and 294 electrons/cm3 at 15 LT in spring, 340 electrons/cm3 at 10 LT and 308 electrons/cm3 at 13 LT in summer, 336 electrons/cm3 at 10 LT and 330 electrons/cm3 at 14 LT in fall.
The comparison during the four seasons shows that the Ne in winter is lowest at each altitude and the Ne in spring is always lower than that in summer and fall. The Ne in fall at 72 km is significantly larger than that in summer between 10 LT and 14 LT, and Ne in fall at 74 km is also larger than that in summer between 10 LT and 13 LT.
To compare the seasonal variation in the Ne with height, we first averaged the hourly value within one season at each height to obtain the height profiles of the seasonal average, as shown in Figure 3. In the four seasons, the Ne in winter is the lowest at each height, except for that value at 66 km. The Ne in spring is almost smaller than that in summer and fall except for at 64 km and 80 km, and larger than that in winter at each height except for the value at 66 km. With the increasing height, the Ne in winter and spring appears to decrease below 66 km, and then increases until the height of 70 km. Above 70 km, Ne decreases weakly again and then increases rapidly above 78 km. The Ne in summer enhances almost linearly with increasing height and is lower than that in fall below 68 km and above 76 km. The Ne in winter decreases first below 66 km and increases until 72 km, then decreases in the height 72–76 km, and finally increases again above 76 km.
The International Reference Ionosphere (IRI) [47,48,49] is an empirical (data-based) model representing the primary ionospheric parameters based on the long data record that exists from ground and space observations of the ionosphere. The core model describes the monthly averages of the electron density, electron temperature, ion temperature, and ion composition globally in the altitude range of 60 to 2000 km [50]. The IRI can simulate the ionospheric variation in the D-region. The simulated Ne by IRI2016 is shown in Figure 4, with the same period as shown in Figure 1. The diurnal variation in the simulated Ne increases strictly with the decreasing SZA, which is greatly different from the observations. Certainly, the diurnal asymmetry could not be seen in the simulations. Also, the simulated Ne linear increases strictly with the altitude in all seasons, which is quite different from the observations. In general, the simulated values of the Ne by IRI2016 are larger than the observations. Below 66 km, the simulations show no additional ionization. The simulated Ne by IRI2016 in the four seasons shows that its value is larger in spring and summer, and the second largest in fall, which behaves similarly to the MF radar observations. Also, the IRI2016 simulation results are larger than the measured results by MF radar. For example, the simulated maximum value of Ne is 517 cm3 in fall, 438 electrons/cm3 in winter, 540 electrons/cm3 in spring, and 550 electrons/cm3 in summer. Another comparison among the four seasons in the simulations shows that a larger value above 80 km lasts the longest in summer and the shortest in winter, which also suggests that the disturbance of the D-region is greatly affected by the annual variation in solar radiation [46].
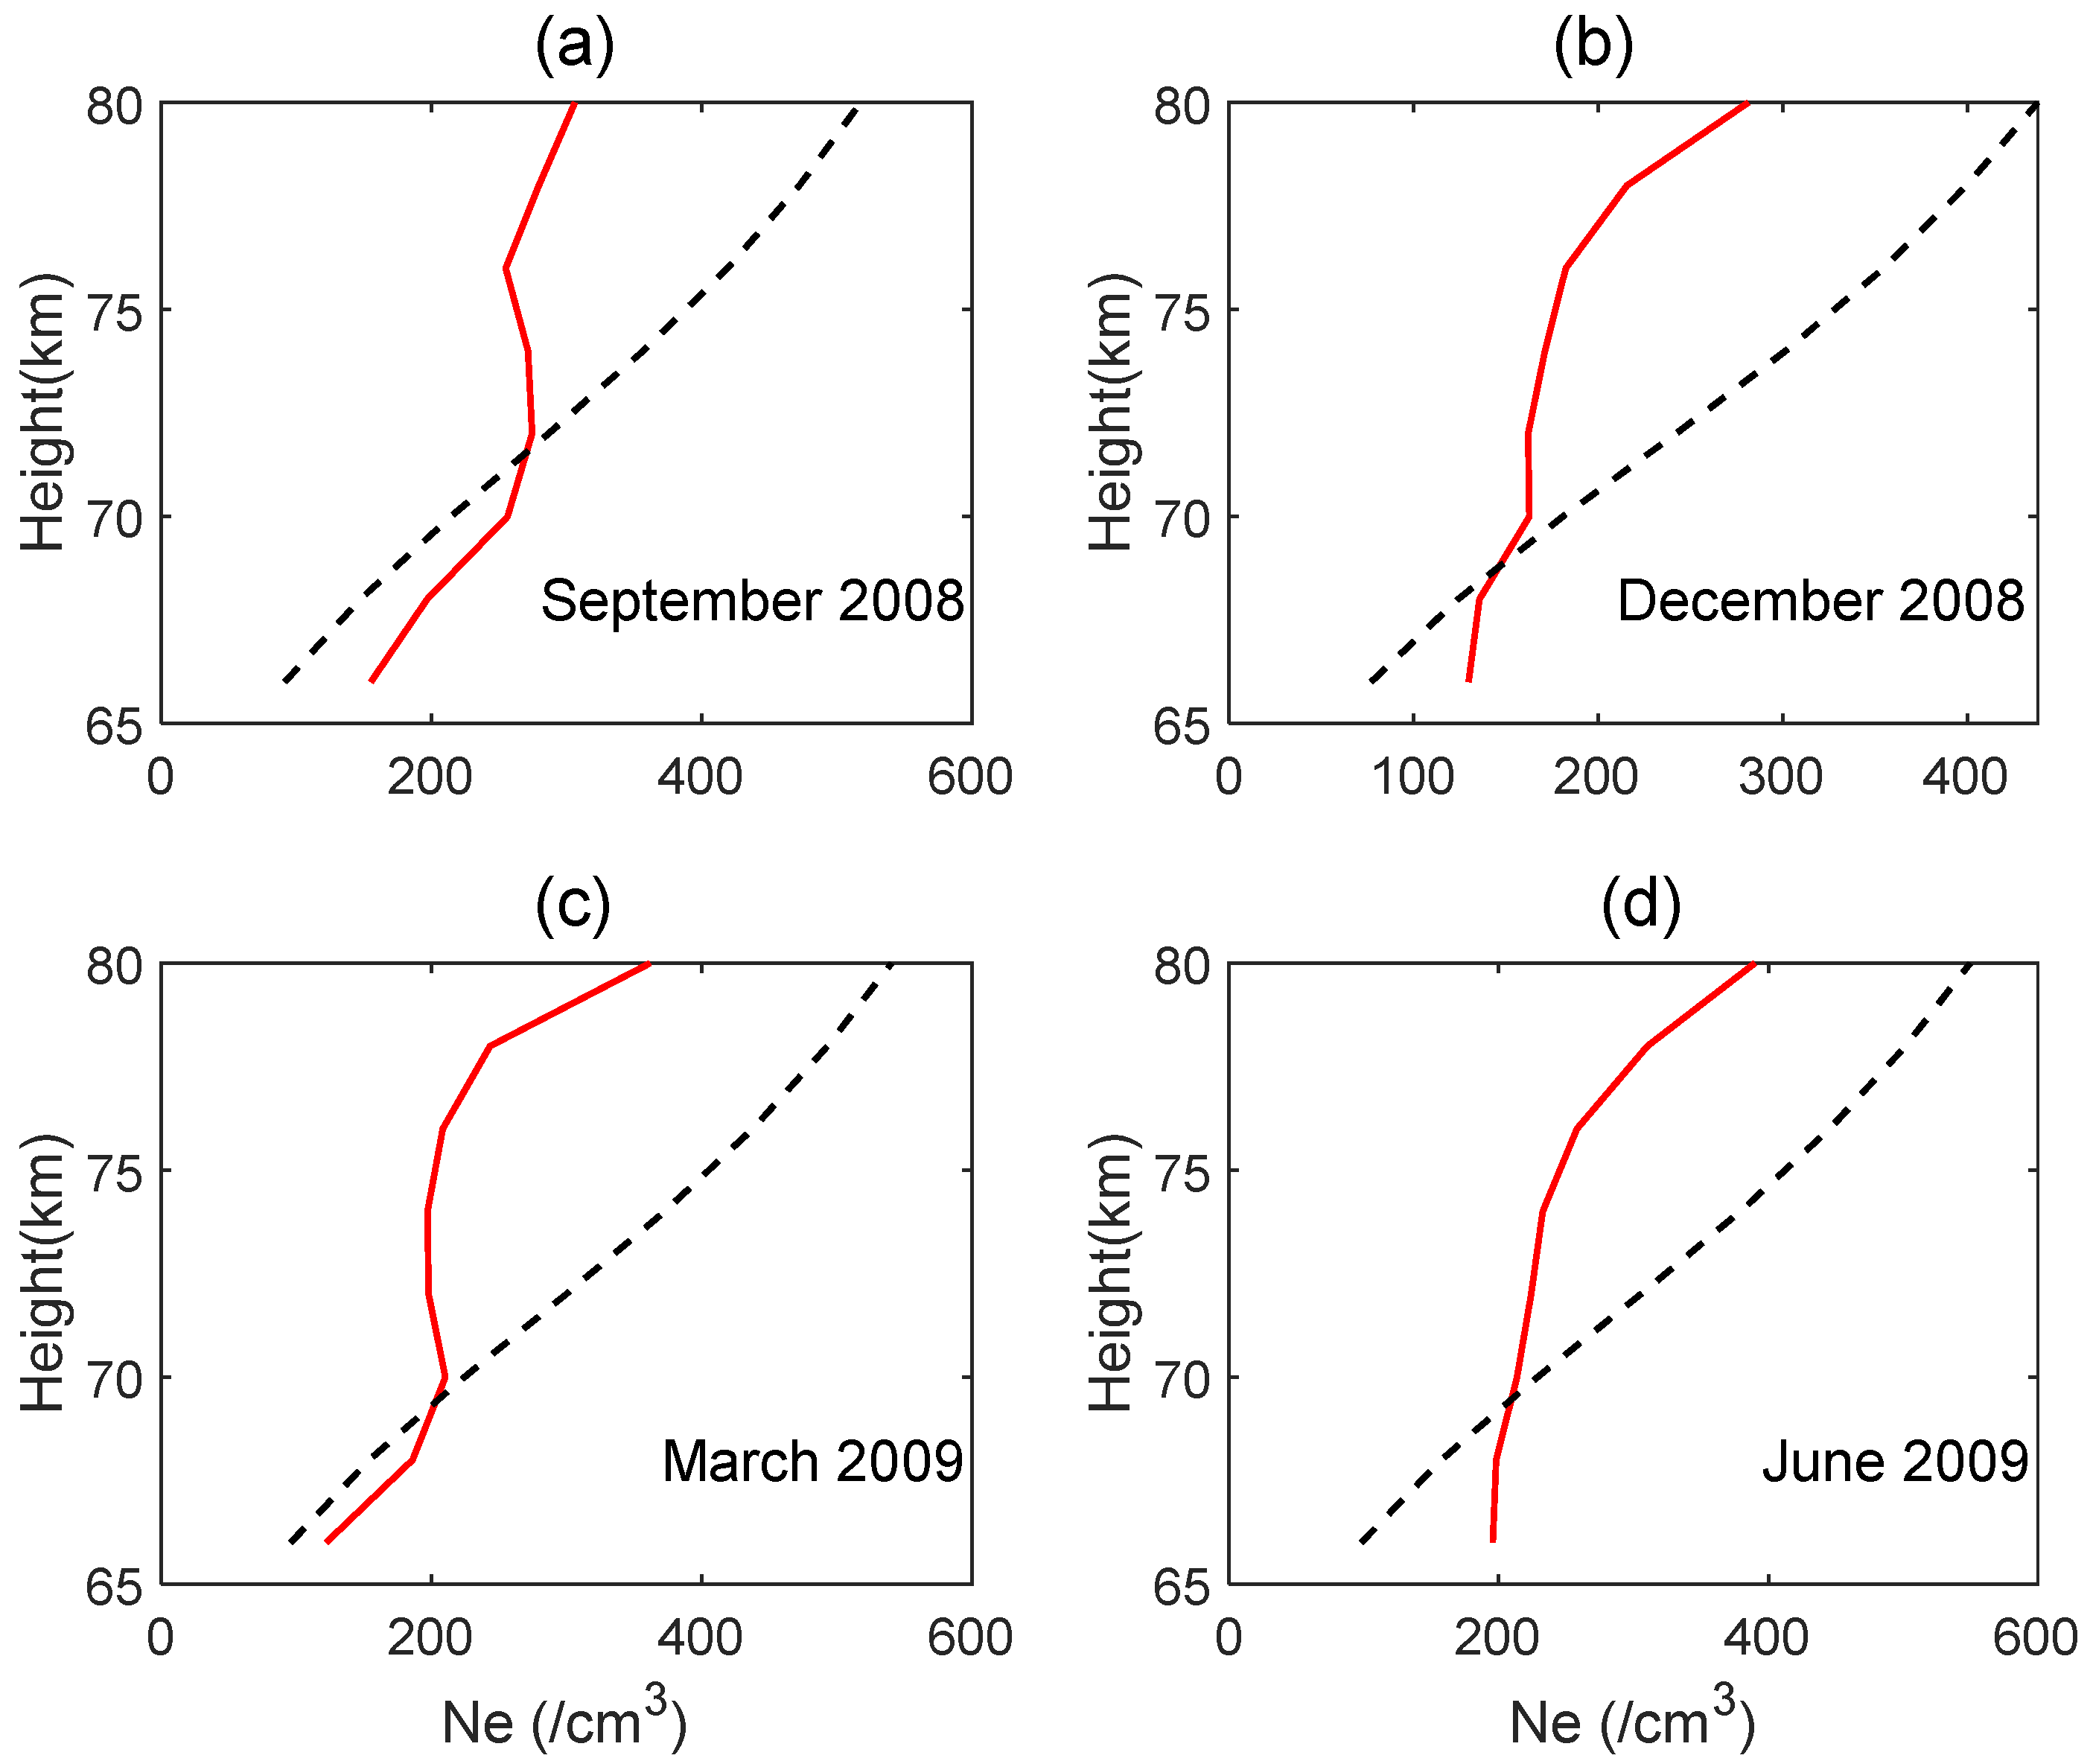
In order to present the difference between the MF observations and IRI2016 simulations, we compared the height profile of Ne between them, which is presented in Figure 5. The red solid line indicates the observations, and the black dashed line denotes the simulations. Figure 5a–d corresponds to the four seasons, as in Figure 1 and Figure 4. For all seasons, the IRI2016 results show a linear enhancement with the altitude, while the observations exhibit an increase–decrease–increase process. Comparing them reveals that the simulations are larger than the measurement in fall above 72 km, winter above 68 km, spring above 70 km, and summer above 70 km. It is indicated that the ionized depletion above ~70 km and the ionized sources below ~70 km may be not considered in the IRI2016 simulation.
To quantitatively analyze the differences between the observations and simulations, the observed value was subtracted from the simulated value to obtain a matrix of difference, which is shown in Figure 6. Figure 6 shows the differences in the four seasons. It is clear that the observations are comparable with the simulations within the height range of 68–72 km in the four seasons. However, the difference between them grows with increasing height, with the value as high as 350 electrons/cm3 around 78 km, for example, in spring. Additionally, the difference between them becomes smaller at sunrise (9 LT) and sunset (16 LT), which denotes that the observed Ne increases at that time due to the possible changes in the ionization sources. Below 66 km, the observed Ne is significantly larger than the simulated Ne, which could be explained by Figure 1. In fact, there exists some extra ionization sources below 66 km, which are not well known by people. For instance, the observed Ne is larger than the simulated Ne frequently during sunrise and sunset in winter, with a maximum of 350 electrons/cm3. Meanwhile, some extra ionized Ne shown in Figure 1 can be seen in winter, but no such extra ionization exists in the simulation shown in Figure 4. In fall, extra ionization sources appear in daytime. It can be seen that the maximum and minimum differences at 66 km in fall appear at 15 LT and 17 LT with values of 170.94 electrons/cm3 and 51.52 electrons/cm3, respectively. The maximum and minimum differences at 72 km are 85.06 electrons/cm3 and 12.25 electrons/cm3, occurring at 8 LT and 12 LT, respectively. At 78 km, the maximum and minimum are 219.9 electrons/cm3 at 13 LT and 72.65 electrons/cm3 at 15 LT, respectively. The smallest difference occurs at 72 km, which means that the simulated values are close to the measured values around 72 km. But at other heights, the simulation deviates further and further from the observation. For instance, the deviation is about 220–265 electrons/cm3 at 78 km, and as high as 350 electrons/cm3 at 64 km.

4. Discussion

In addition to solar radiation extreme ultraviolet rays, the ionization sources in the D-region include Lyman-a rays, X-rays, cosmic rays, etc., among which the ionization sources around 60 km are mainly X-rays, cosmic rays, Lyman-a rays, and high-energy particle precipitation. The sudden enhancement of the average seasonal Ne below 66 km shown in Figure 1 implies that additional ionization probably occurs around this altitude, which may be related to the complex ionization sources in the D-region. Figure 1 also presents another important feature of the Ne, which is called daily asymmetry. The meaning of asymmetry is that the Ne before noon is significantly different from the Ne after noon, corresponding to the same SZA.
Numerous studies have reported the asymmetry of Ne variability by using rocket soundings and ground-based measurements. Chakrabarty et al. (1983) reported that the peak Ne was observed by the partial reflection technique at Park Site, Saskatoon (52° N) in the mesosphere [45]. It was found that an asymmetry in the diurnal variation of Ne existed in each season in the altitude range of 76–82 km. Moreover, in summer and spring, the Ne reached a maximum of about 1 h after local noon, while in winter and fall, the maximum occurred about 1 h before local noon. Haug et al. (1970) analyzed the Ne derived from the partial reflection method during the solar eclipse of 20 May 1966. They found that the maximum of the asymmetry occurred two hours after noon in May 1966 at 80 km, but no significant asymmetry occurred in the fall of 1964 and 1965 [51]. During the same period, the asymmetry phenomenon was very prominent in the early spring and summer at Ottawa Station (45° N). The diurnal asymmetry of the Ne over Urbana (40° N) was manifested as an anomalous enhancement in the morning [52]. These early studies indicate that there is some regional variability in the dayside maximum of Ne at different heights and over different seasons.
According to the electron continuity equation, the variability of the Ne contains two parts, including the changes in the electron production rate (related to the strength of the ionization sources) and those in the electron recombination rate (related to the collision frequency). When the ionization sources are slightly stable, the effect of the collision frequency must be taken into account, which is usually affected by the atmospheric temperature. Some studies have reported that the temperature variations may be associated with the diurnal variation in the gravity waves with the period from 5 min to several hours [53]. In addition, the variation in temperature may also be related to the atmospheric tides. Narayanan (1981) pointed out that the diurnal variation of the temperature in the altitude range of 75–80 km was within the range of 15–20 K [54]. However, few proofs are yet to be considered to explain the phenomenon of asymmetry in the diurnal variation of Ne. The details of daily asymmetry will be investigated in further work.
Siskind et al. (1997) have pointed out the presence of ionization anomalies with a two-dimensional chemical transport process model, including the NO transport term [44]. Nevertheless, the unusual enhancement of the Ne in winter at sunrise and sunset within the altitude range of 66–70 km could not be explained clearly. A similar phenomenon was observed by the Buckland Park MF radar [24], but multiple data are still required for further study.
Additionally, the seasonal Ne varies significantly. For example, at 12 LT, the solar zenith angles are 27.6°, 2.4°, 22.6°, and 48.6° in spring, summer, fall, and winter, respectively. As known, the value of SZA represents the strength of solar radiation, which may be the main reason for the smallest Ne in winter. The simulations shown in Figure 4 indicate that the IRI model cannot provide highly accurate simulation results on the D-region. In addition, the height profiles of the average seasonal Ne show that the impact of solar radiation on Ne becomes more significant with higher altitudes.
Currently, most studies on the Ne in the D-region are based on VLF long-wave reception experiments [13,14,15,16,17,55,56]. For example, Igman [14] analyzed the VLF radiation signal by using the received NAA (24 kHz) during solar flares and reported that VLF amplitude enhancement is related to the solar X-ray flux measured by the GOES-12 satellite. Qin et al. (2015) inverted the D-region equivalent reflection height based on the VLF radiation signals generated by lightning at Mengcheng and Hefei Stations on 7 July 2012 [55]. The method, based on the VLF reception experiment, can perfectly invert the effective reflection height of the D-region and calculate the Ne by the Wait and Spies (WS) model [17].
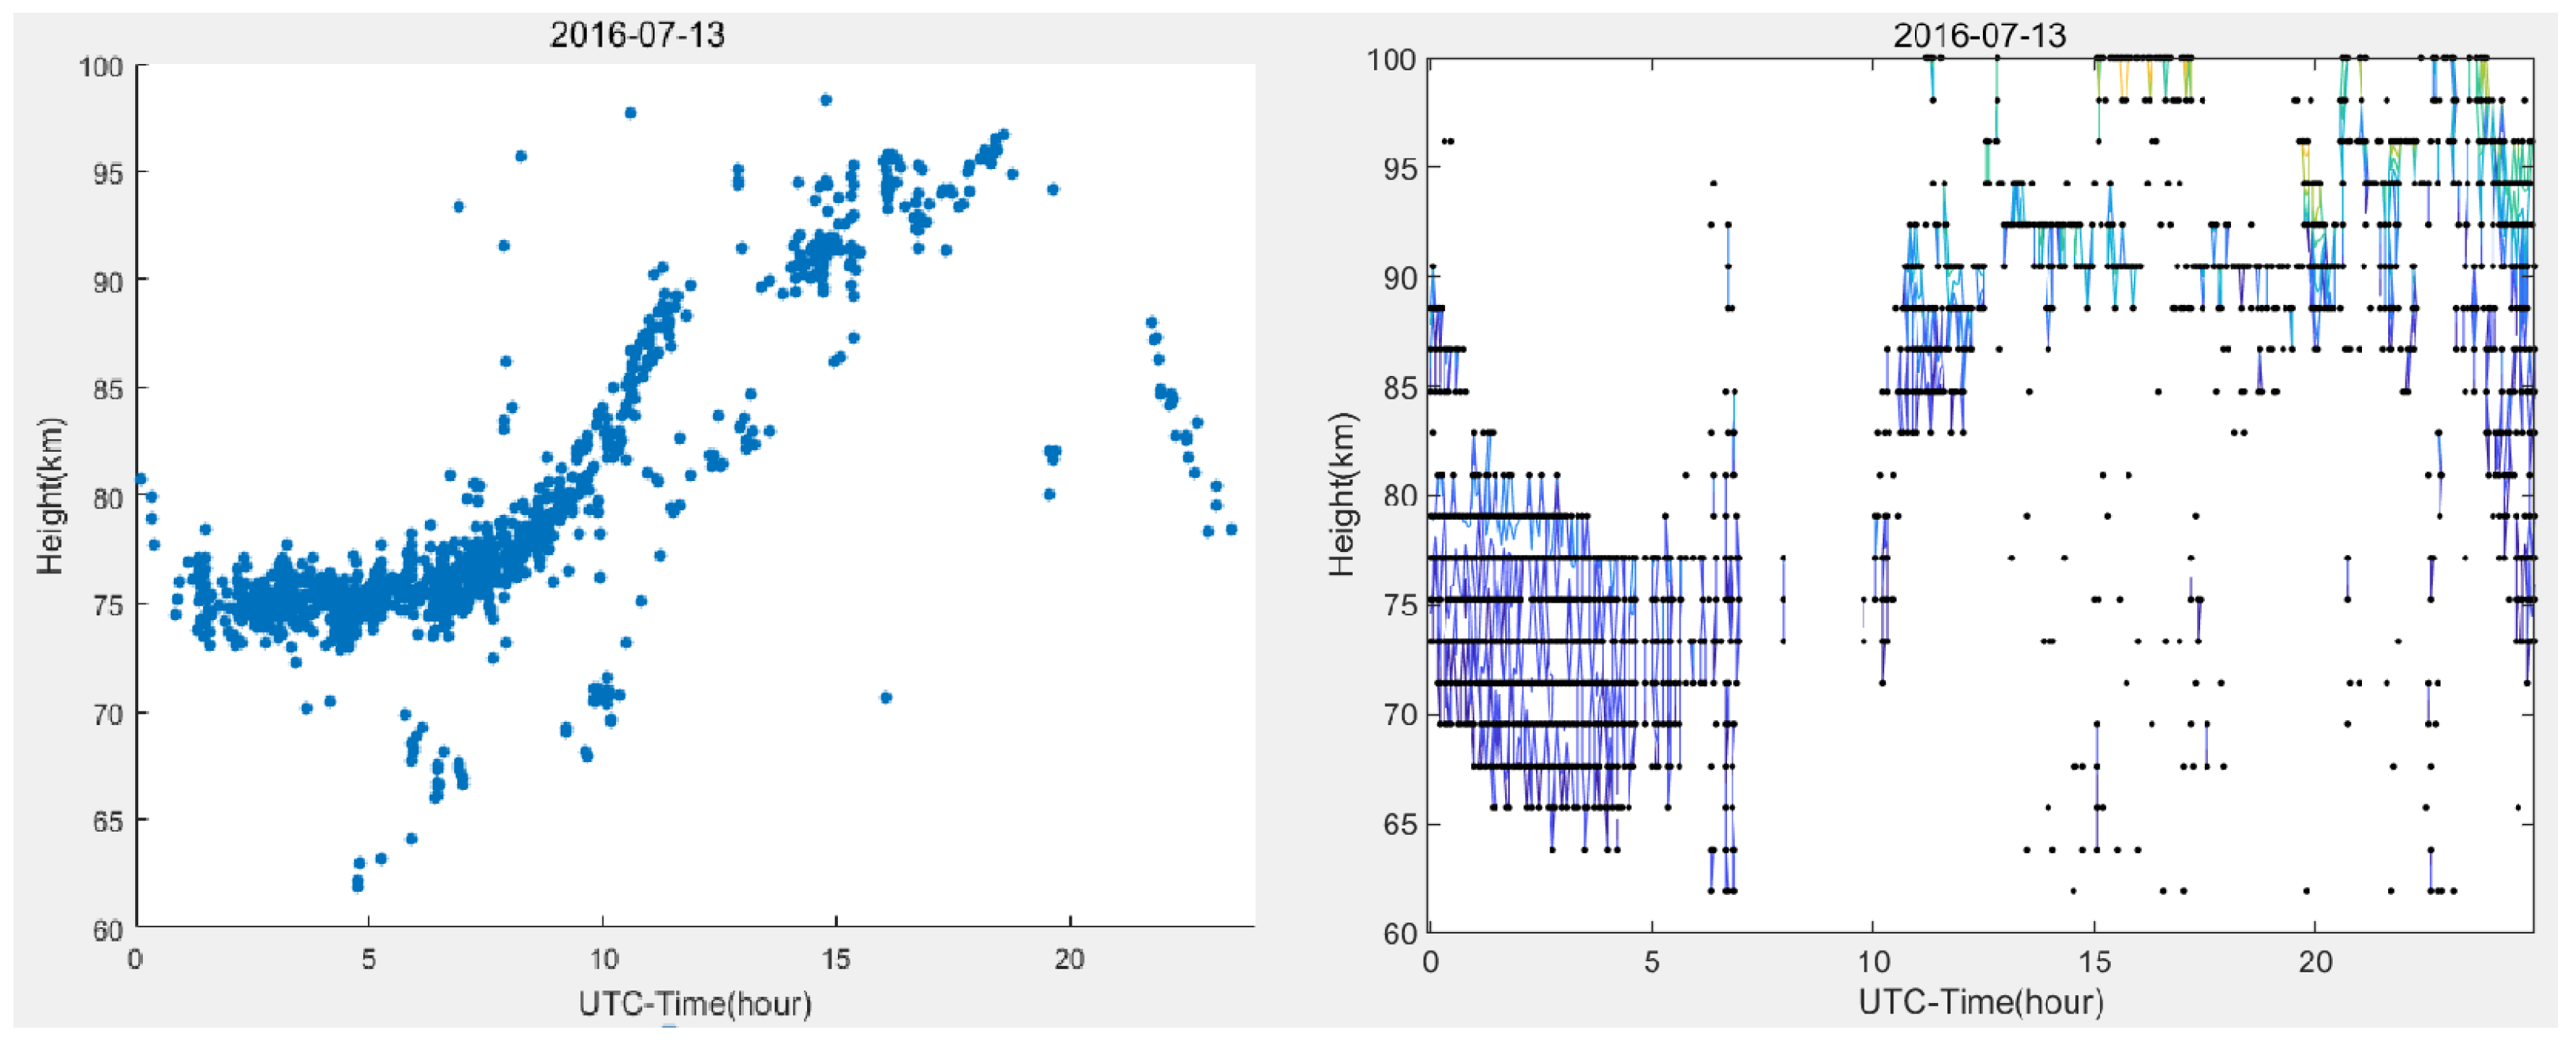
To examine the reliability of the MF radar observations, we compare the observations from MF radar and those reversed by a lightning-generated VLF long-wave signal. Figure 7 depicts the D-region ionospheric equivalent reflection height from the VLF long-wave signal generated by lightning system(left) and MF radar(right) on 13 July 2016, at Kunming Station. It is clearly shown that the height range of the equivalent reflection height reversed by the VLF signal stays at 74–76 km during daytime and at 90–97 km during nighttime. The height range derived from MF radar stays at 64–80 km during daytime and at 88–100 km during nighttime. To summarize, the two methods to obtain the D-region ionospheric equivalent reflection height range maintain good agreement, which directly demonstrates that the MF radar observations are greatly reliable.

5. Conclusions

So far, there are two main methods to detect the D-region ionosphere—VLF experiments and MF radar. The data obtained by VLF experiments are usually used to analyze the response of the equivalent reflection height in the D-region ionosphere to large solar flares. MF radar is a convenient instrument to achieve routine observations of the Ne in the D-region ionosphere. In this paper, the Ne values from 64 to 80 km under low solar activity (2008–2009) observed by Kunming MF radar were used to analyze and discuss the diurnal, seasonal, and altitudinal variations. The meaningful results are listed as follows.
i.
The diurnal variation in the Ne was larger around noon and smaller around sunrise and sunset. Meanwhile, the Ne had a strong negative correlation with the solar zenith angles, which was also presented in the simulation results by IRI2016. But the Ne observed by Kunming MF radar showed significant diurnal asymmetry, which existed in all the seasons. Moreover, in summer and spring, the Ne reached a maximum of about 2 h before noon, while the maximum occurred about 1 h after noon in winter and 2 h after noon in fall. This asymmetry phenomenon cannot be seen in the simulated Ne by IRI2016.
ii.
The seasonal feature was different below and above 74 km. Below 74 km, the Ne value was largest in fall, followed by summer, but the Ne value was largest in summer, followed by fall above 76 km, which may be attributed to the main ionization source being solar radiation above 76 km and Lyman-α rays.
iii.
The results of the IRI2016 are 1–2 times larger than the measured data, and show a completely negative correlation with the solar zenith angle. The difference between them shows that the closest magnitude occurred in the height range of 66–70 km, and the maximum of difference was as high as 350 electrons/cm3, appearing around 78 km and 64 km. The IRI2016 model cannot perfectly describe the changes in the D-region ionosphere.
These results suggest that solar radiation can strongly affect the diurnal, seasonal, and altitudinal variations in the Ne in the D-region. There are still some phenomena that cannot be explained clearly in the variations in the Ne detected by MF radar, and more observations and model simulations are needed to support the follow-up work.

Author Contributions

Conceptualization, Z.T. and N.L.; methodology, Z.D.; software, Z.T.; project administration, L.Z. and L.D.; supervision, J.C. and J.W.; writing—original draft, Z.T., N.L. and Z.D.; funding acquisition, N.L. All authors have read and agreed to the published version of the manuscript.

Funding

This research was funded by the JKW Foundation and the Academician Wei F.S. Studio Foundation, grant numbers 6142403210103, 6142403200101, and A392201103.

Institutional Review Board Statement

Not applicable.

Informed Consent Statement

Not applicable.

Data Availability Statement

The data presented in this study are available on request from the corresponding author. The data are not publicly available due to privacy.

Acknowledgments

The authors thank all the editors and reviewers for their valuable comments that greatly improved the presentation of this paper. The authors are very grateful to the China Research Institute of Radiowave Propagation for providing the data derived from the MF radar in the Kunming area.

Conflicts of Interest

The authors declare no conflict of interest.

References

  1. Fejer, J.A.; Vice, R.W. An investigation of the ionospheric D region. J. Atmos. Terrest. Phys. 1955, 16, 7322. [Google Scholar] [CrossRef]
  2. Thomas, L. Recent developments and outstanding problems in the theory of the D region. Radio Sci. 1974, 9, 121–136. [Google Scholar] [CrossRef]
  3. Zhulina, E.M. Calculation of short-radio-wave absorption in the ionosphere on the basis of different empirical models of electron density and collision frequency. Ionos. Issled. 1978, 26, 85–88. [Google Scholar]
  4. Beharrell, M.; Honary, F. A new method for deducing the effective collision frequency profile in the D-region. J. Geophys. Res. Space Phys. 2008, 113, A05303. [Google Scholar] [CrossRef]
  5. Chakrabarty, D.K.; Chakrabarty, P. Some studies on D-region Ne profiles. Indian J. Radio Space Phys. 1973, 2, 211. [Google Scholar]
  6. Chakrabarty, D.K.; Chakrabarty, P.; Witt, G. A theoretical attempt to explain some observed features of the D region. J. Geophys. Res. 1978, 83, 5763–5767. [Google Scholar] [CrossRef]
  7. Mechtly, E.A. Accuracy of rocket measurements of lower ionosphere electron concentrations. Radio Sci. 1974, 9, 373–378. [Google Scholar] [CrossRef]
  8. Ishisaka, K.; Okada, T.; Hawkins, J.; Murakami, S.; Miyake, T.; Murayama, Y.; Nagano, I.; Matsumoto, H. Investigation of Ne profile in the lower ionosphere by SRP-4 rocket experiment. Earth Planets Space 2005, 57, 879–884. [Google Scholar] [CrossRef]
  9. Friedrich, M.; Torkar, K.M.; Lehmacher, G.A.; Croskey, C.L.; Mitchell, J.D.; Kudeki, E.; Milla, M. Rocket and incoherent scatter radar common-volume electron measurements of the equatorial lower ionosphere. Geophys. Res. Lett. 2006, 33. [Google Scholar] [CrossRef]
  10. Mathews, J.D. Incoherent scatter radar probing of the 60–100 km atmosphere and ionosphere. IEEE Trans. Geosci. Remote Sens. 1986, GE-24, 765–776. [Google Scholar]
  11. Arrington, R.E.; Thrane, E. The determination of D-region electron densities from the observations of cross modulation. J. Atmos. Terrest. Phys. 1962, 24, 31–42. [Google Scholar] [CrossRef]
  12. Friedrich, M.; Torkar, K.M.; Hoppe, U.P.; Bekkeng, T.-A.; Barjatya, A.; Rapp, M. Multi-instrument comparisons of D-region plasma measurements. Ann. Geophys. 2013, 31, 135–144. [Google Scholar] [CrossRef]
  13. Bainbridge, G.; Inan, U.S. Ionospheric D region Ne profiles derived from the measured interference pattern of VLF waveguide modes. Radio Sci. 2003, 38, 1077. [Google Scholar] [CrossRef]
  14. Žigman, V.; Grubor, D.; Šulić, D. D-region electron density evaluated from VLF amplitude time delay during X-ray solar flares. J. Atmos. Sol. Terr. Phys. 2007, 69, 775–792. [Google Scholar] [CrossRef]
  15. Singh, A.K. Solar flare induced D-region ionospheric perturbations evaluated from VLF measurements. Astrophys. Space Sci. 2014, 350, 1–9. [Google Scholar] [CrossRef]
  16. Gasdia, F.; Marshall, R.A. Assimilating VLF Transmitter Observations with an LETKF for Spatial Estimates of the D-Region Ionosphere. IEEE Trans. Geosci. Remote Sens. 2019, 99, 1–18. [Google Scholar] [CrossRef]
  17. Wait, J.R.; Spies, K.P. Characteristics of the Earth-Ionosphere Waveguide for VLF Radio Waves; Technical Note 300; Bureau of Standards: Boulder, CO, USA, 1965. [Google Scholar]
  18. Gardner, F.F.; Pawsey, J.L. Study of the ionospheric D region using partial reflections. J. Atmos. Terrest. Phys. 1953, 7, 321–344. [Google Scholar] [CrossRef]
  19. Fritts, D.C.; Isler, J.R. First observations of mesospheric dynamics with a partial reflection radar. Geophys. Res. Lett. 1992, 19, 409–412. [Google Scholar] [CrossRef]
  20. Reid, I.M. Radar observations of stratified layers in the mesosphere and lower thermosphere (50 km–100 km). Adv. Space Res. 1990, 10, 7–19. [Google Scholar] [CrossRef]
  21. Cervera, M.A.; Reid, I.M. Comparison of simultaneous wind measurements using collocated VHF meteor radar and MF spaced antenna radar systems. Radio Sci. 1995, 30, 1245–1261. [Google Scholar] [CrossRef]
  22. Holdsworth, D.A.; Reid, I.M. A Simple model of atmospheric radar backscatter description and application to the fall Correlation Analysis of spaced antenna data. Radio Sci. 1995, 30, 1263–1280. [Google Scholar] [CrossRef]
  23. Rupa, V. Mid-Latitude D-Region MF Radar Ne Observation. Ph.D. Thesis, Adelaide University, Adelaide, Australia, 2003. [Google Scholar]
  24. Igarashi, K.; Murayama, Y.; Nagayama, M.; Kawana, S. D-region electron density measurements by MF radar in the middle and high latitudes. Adv. Space Res. 2000, 25, 25–32. [Google Scholar] [CrossRef]
  25. Zhang, D.H.; Xiao, Z.; Wu, J.; Gong, J.C.; Liu, S.Q. The study of the Ne in ionospheric D region using MF radar during flares period. Chin. J. Space Sci. 2003, 23, 334–342. [Google Scholar] [CrossRef]
  26. Venkatesham, K.; Singh, R.; Maurya, A.K.; Dube, A.; Kumar, S.; Phanikumar, D.V. The 22 July 2009 total solar eclipse: Modeling D region ionosphere using narrowband VLF observations. J. Geophys. Res. Space Phys. 2019, 124, 616–627. [Google Scholar] [CrossRef]
  27. da Silva, C.L.; Salazar, S.D.; Brum, C.G.M.; Terra, P. Survey of electron density changes in the daytime ionosphere over the Arecibo Observatory due to lightning and solar flares. Sci. Rep. 2021, 11, 10250. [Google Scholar] [CrossRef]
  28. Baumann, C.; Kero, A.; Raizada, S.; Rapp, M.; Sulzer, M.P.; Verronen, P.T.; Vierinen, J. Arecibo Measurements of D-Region Electron. Densities during Sunset and Sunrise in August 2016 [dataset]. Ann. Geophys. 2022, 40, 519–530. [Google Scholar] [CrossRef]
  29. Li, N.; Lei, J.; Lei, J.; Luan, X.; Chen, J.; Zhong, J.; Wu, Q.; Xu, Z.; Lin, L. Responses of the D region ionosphere to solar flares revealed by MF radar measurements. J. Atmos. Sol. Terr. Phys. 2019, 182, 211–216. [Google Scholar] [CrossRef]
  30. Ding, Z.H.; Dai, L.D.; Yang, S.; Miao, J.; Wu, J. Preliminary analysis of daytime electron density in the ionospheric E-F valley based on the Qujing incoherent scatter radar observations. Chin. J. Radio Sci. 2022, 37, 357–363. (In Chinese) [Google Scholar] [CrossRef]
  31. Shi, Y.; Yang, C.; Wang, J.; Zheng, Y.; Meng, F.; Chernogor, L.F. A Hybrid Deep Learning-Based Forecasting Model for the Peak Height of Ionospheric F2 Layer. Space Weather 2023, 21, 2023sw003581. [Google Scholar] [CrossRef]
  32. Wang, J.; Shi, Y.; Yang, C.; Zhang, Z.; Zhao, L. A Short-term Forecast Method of Maximum Usable Frequency for HF Communication. IEEE Trans. Antennas Propag. 2023, 71, 5189–5198. [Google Scholar] [CrossRef]
  33. Weng, J.; Liu, Y.; Wang, J. A Model-Assisted Combined Machine Learning Method for Ionospheric TEC Prediction. Remote Sens. 2023, 15, 2953. [Google Scholar] [CrossRef]
  34. Li, F.Q.; Hu, X.; Zhang, X.X. Mesospheric MF radar in Wuhan and its preliminary observation results. Chin. J. Space Sci. 2002, 22, 65–71. [Google Scholar] [CrossRef]
  35. Hu, X.; Zeng, Z.; Zhang, D.Y. Observation of the mesosphere and lower thermosphere angular spectrum with an MF radar at Wuhan. Chin. J. Space Sci. 2003, 23, 256–261. [Google Scholar] [CrossRef]
  36. Zhang, D.Y.; Hu, X.; Zhang., X.X. Observations of the Mesospheric and Lower Thermospheric Mean Winds at 30° N With MF radars. Chin. J. Space Sci. 2005, 25, 267–272. [Google Scholar] [CrossRef]
  37. Zhang, D.Y.; Yi, F.; Hu, X. MF radar observation of tides and their interactions over Wuhan (30° N, 114° E). Chin. J. Space Sci. 2003, 23, 430–435. [Google Scholar] [CrossRef]
  38. Zhang, X.C.; Yi, F. MF Radar Observations of Mesospheric Tides Over Wuhan. Chin. J. Space Sci. 2007, 27, 29–34. [Google Scholar] [CrossRef]
  39. Li, N.; Chen, J.S.; Zhao, L.; Zhao, Z.W. The study of eclipse effects in D region based on MF radar measurement. Chin. J. Geophys. 2011, 54, 942–949. (In Chinese) [Google Scholar]
  40. Zhao, L.; Chen, J.S.; Li, N.; Zhao, Z.W. MF radar in Kunming and its preliminary observation results. Chin. J. Space Sci. 2011, 31, 27–33. [Google Scholar] [CrossRef]
  41. Ding, Z.H.; Yu, L.; Dai, L.D.; Xu, Z.W.; Wu, J. The preliminary measurement and analysis of the power profiles by the Qujing incoherent scatter radar. Chin. J. Geophys. 2014, 57, 3564–3569. (In Chinese) [Google Scholar] [CrossRef]
  42. Mechtly, E.A.; Smith, L.G. Changes of lower ionosphere electron densities with solar zenith angle. Radio Sci. 1970, 5, 1407–1412. [Google Scholar] [CrossRef]
  43. Lei, Z.; Chen, J.; Li, N.; Zhao, Z.; Jian, W. ST radar in Kunming and its preliminary observation results. Chin. J. Space Sci. 2014, 29, 1165–1170. [Google Scholar] [CrossRef]
  44. Siskind, D.E.; Bacmeister, J.; Summers, T.; Russell, J.M., III. Two dimensional model calculations of nitric oxide transport in the middle atmosphere and comparison with Halogen Occultation Experiment data. J. Geophys. Res. 1997, 102, 3527–3545. [Google Scholar] [CrossRef]
  45. Chakrabarty, D.K.; Meek, C.E.; Manson, A.H. Asymmetry in the diurnal variation of temperature and electron loss coefficient in the mesosphere. J. Atmos. Terr. Phys. 1983, 45, 309–314. [Google Scholar] [CrossRef]
  46. Larsen, T.R.; Reagan, J.B.; Imhof, W.L.; Montbriand, L.E.; Belrose, J.S. A coordinated study of energetic electron precipitation and D region electron concentrations over Ottawa during disturbed conditions. J. Geophys. Res. Atmos. 1976, 81, 2200–2212. [Google Scholar] [CrossRef]
  47. Bilitza, D. International Reference Ionosphere 2000. Radio. Sci. 2001, 36, 261–275. [Google Scholar] [CrossRef]
  48. Bilitza, D.; Rawer, A.K. International Reference Ionosphere 2012. J. Space Weather Space Clim. 2014, 4, A07. [Google Scholar] [CrossRef]
  49. Bilitza, D.; Altadill, D.; Truhlik, V.; Shubin, V.; Galkin, I.; Reinisch, B.; Huang, X. International Reference Ionosphere 2016: From ionospheric climate to real-time weather predictions. Space Weather Int. J. Res. Appl. 2017, 15, 418–429. [Google Scholar] [CrossRef]
  50. Bilitza, D.; Pezzopane, M.; Truhlik, V.; Altadill, D.; Reinisch, B.W.; Pignalberi, A. The International Reference Ionosphere model: A review and description of an ionospheric benchmark. Rev. Geophys. 2022, 60, e2022RG000792. [Google Scholar] [CrossRef]
  51. Haug, A.; Jespersen, M.; Kane, J.A.; Thrane, E.V. Electron densities measured by the partial reflection method compared with simultaneous rocket measurements. J. Atmos. Terr. Phys. 1970, 32, 1139–1142. [Google Scholar] [CrossRef]
  52. Wratt, D.S. Variations in Ne in the middle latitude D-region above Urbana, Illinois. J. Atmos. Terr. Phys. 1977, 39, 607–617. [Google Scholar] [CrossRef]
  53. Manson, A.H.; Gregory, J.B.; Stephenson, D.G. The effect of atmospheric gravity waves upon wind determinations in the lower thermosphere (80–100 km). Planet. Space Sci. 1974, 22, 181–183. [Google Scholar] [CrossRef]
  54. Liu, X.; Yue, J.; Xu, J.; Garcia, R.R.; Russell, J.M., III; Mlynczak, M.; Wu, D.L.; Nakamura, T. Variations of globalgravity waves derived from 14 years ofSABER temperature observations. J. Geophys. Res. Atmos. 2017, 122, 6231–6249. [Google Scholar] [CrossRef]
  55. Qin, Z.L.; Zhu, B.Y.; Lv, F.C. Using time domain waveforms of return strokes to retrieve the daytime fluctuation of ionospheric D layer. Chin. Sci. Bull. 2015, 60, 654–663. [Google Scholar]
  56. Xu, W.; Marshall, R.A.; Bortnik, J.; Bonnell, J.W. An Ne Model of the D- and E-Region Ionosphere for Transionospheric VLF Propagation. J. Geophys. Res. Space Phys. 2021, 126, e2021JA029288. [Google Scholar] [CrossRef]
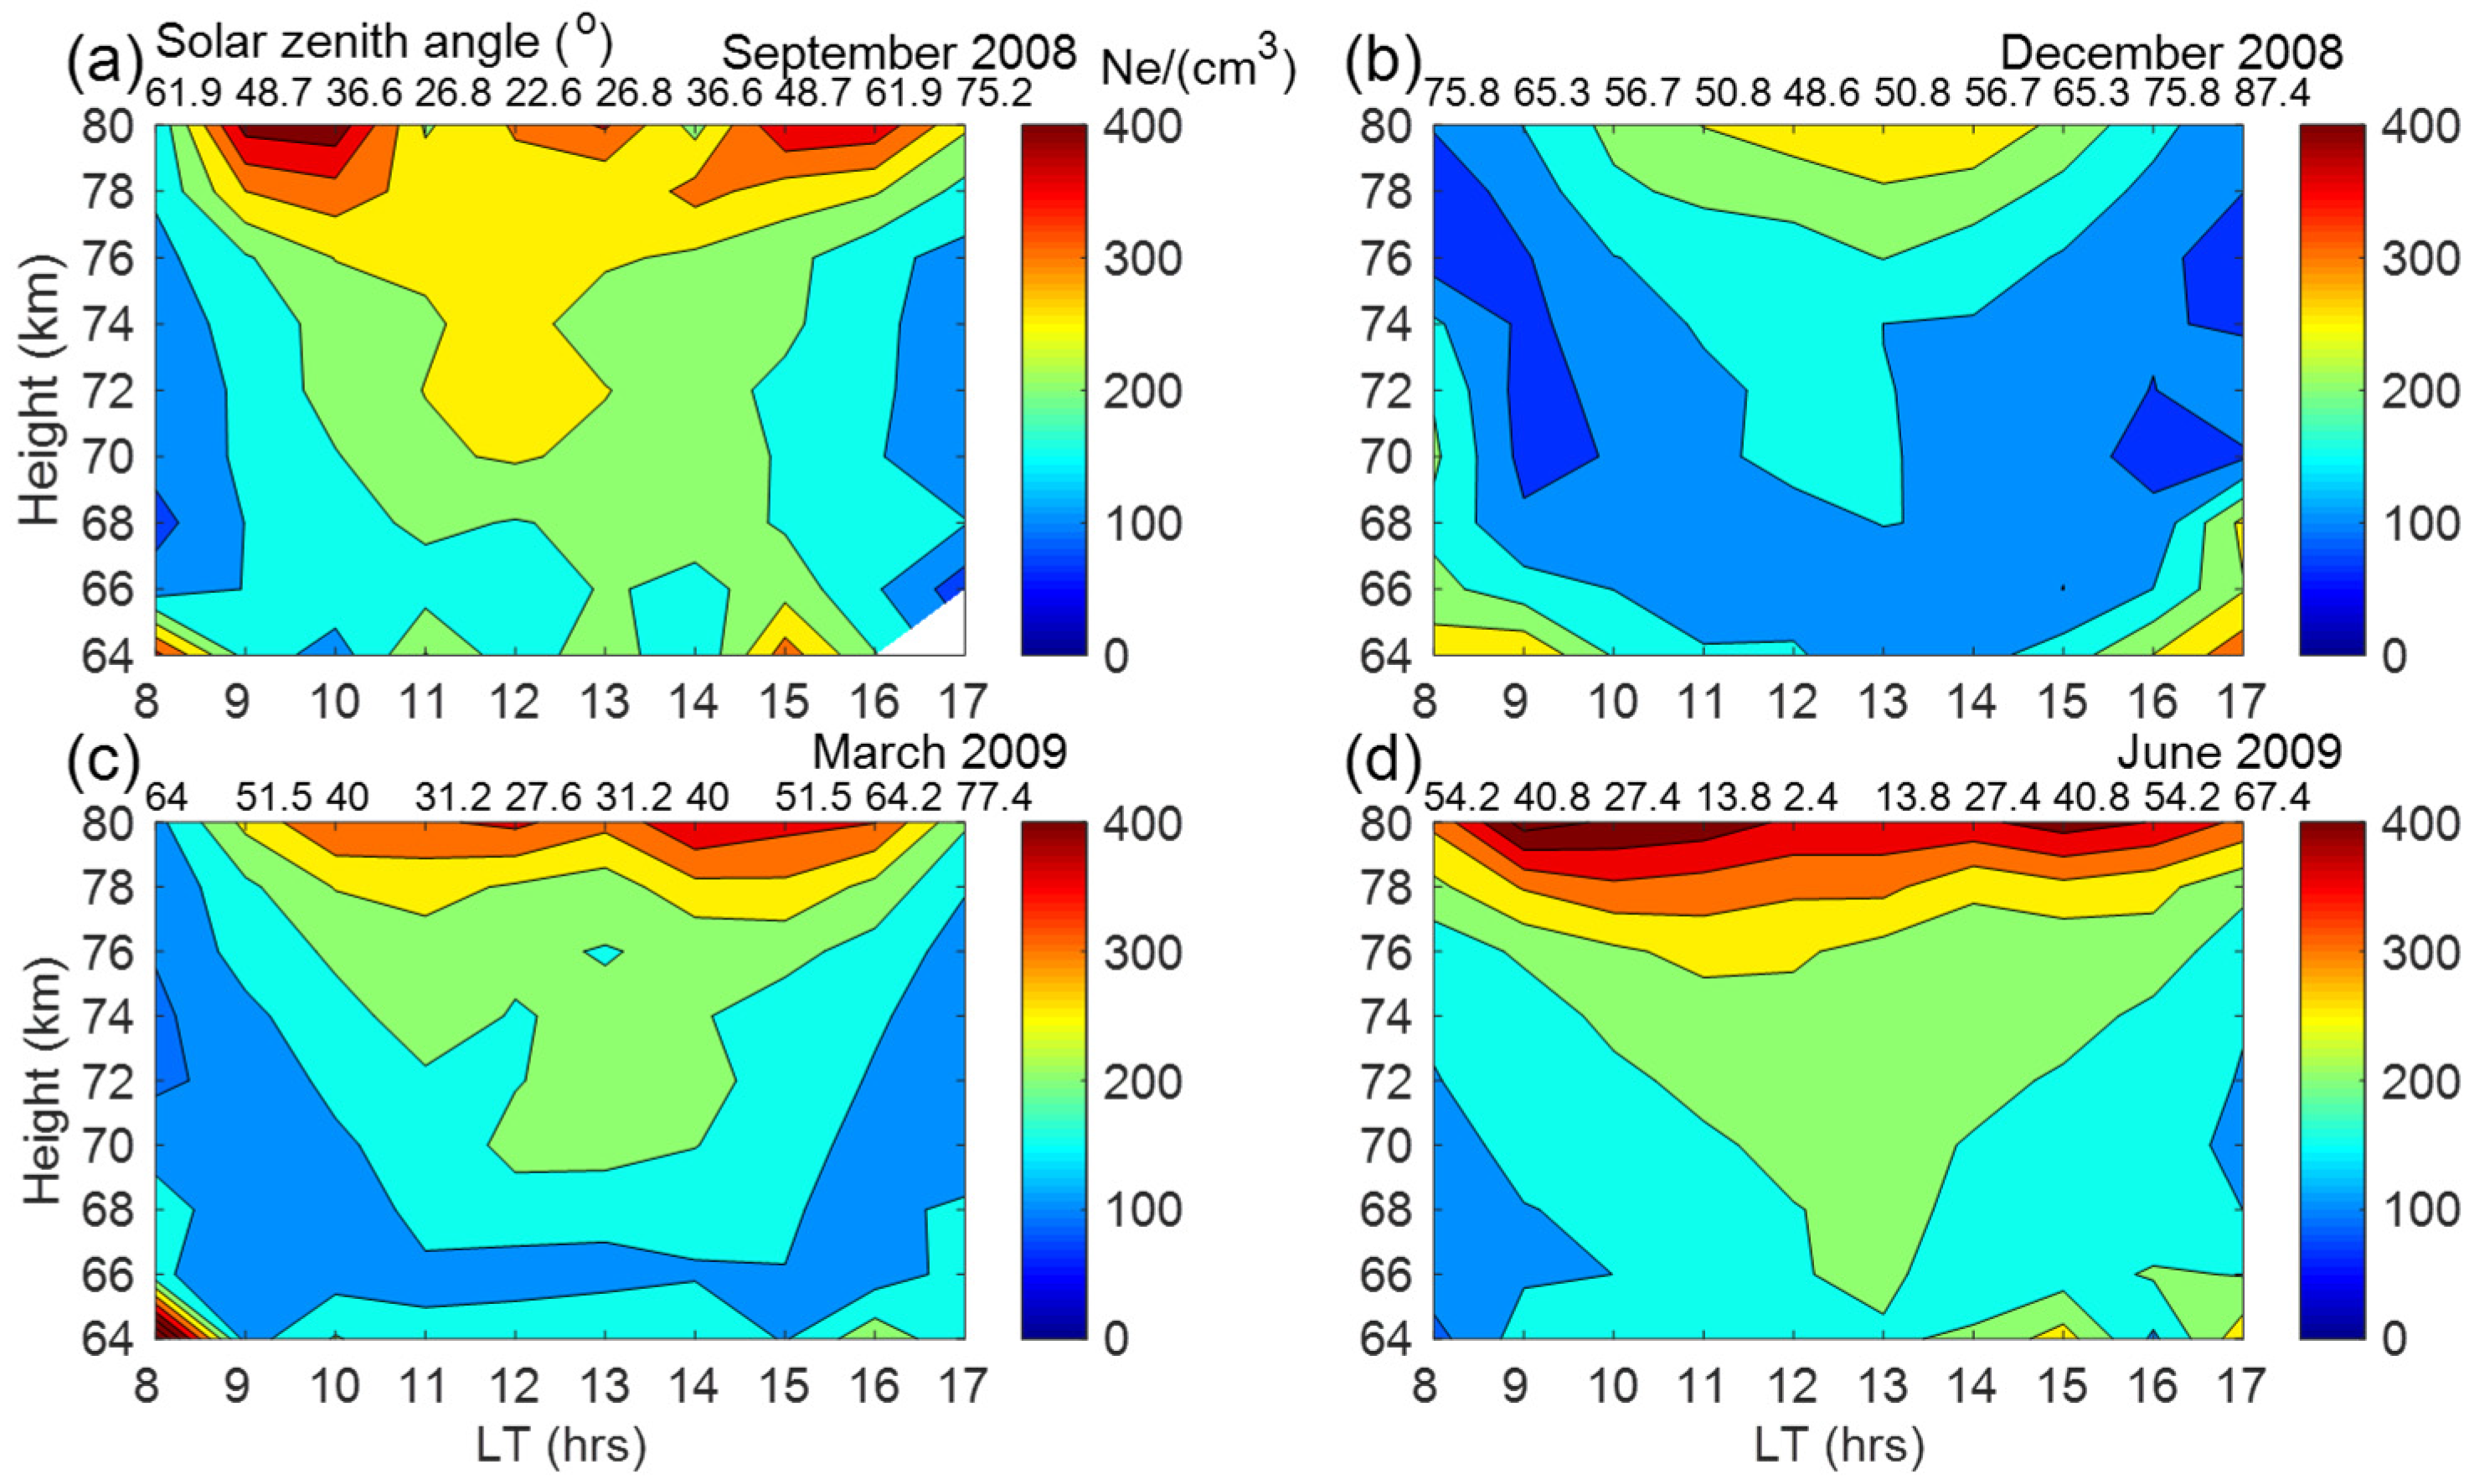
Figure 1. Contour plots of monthly average Ne observed from Kunming MF radar over the four seasons in 2008–2009 during the daytime at 8–17 LT in the altitude range of 64–80 km. The topside of the figure is the solar zenith angle, and the unit of Ne is electron/cm3. (ad) shows the monthly mean values of the Ne observed by MF radar, corresponding to September 2008 (fall), December 2008 (winter), March 2009 (spring), and June 2009 (summer), respectively. In each subplot, the abscissa is the local time (LT), and the ordinate is the height, where the superscript is the SZA corresponding to the season and local time.
Atmosphere 14 01764 g001
Figure 2. Diurnal variation of hourly mean Ne at 72–78 km in the four seasons during the daytime at 8–17 LT. The blue, red, black, and purple solid lines indicate the diurnal variations of Ne in spring, summer, fall and winter, respectively. (ad) are the monthly mean Ne at 72 km, 74 km, 76 km, 78 km, respectively. The blue, red, black and purple dot solid lines correspond to spring, summer, autumn and winter, respectively.
Atmosphere 14 01764 g002
Figure 3. The height profiles of midday Ne in the four seasons in the altitude range of 64–80 km. The blue, red, black, and purple solid lines indicate the diurnal variations in Ne in spring, summer, fall, and winter, respectively.
Atmosphere 14 01764 g003
Figure 4. The same as Figure 1, but for IRI 2016 simulations. (ad) shows the simulated Ne corresponding to September 2008 (fall), December 2008 (winter), March 2009 (spring), and June 2009 (summer), respectively. The axis annotation is the same as in Figure 1.
Atmosphere 14 01764 g004
Figure 5. Four seasonal Ne height profiles at noon (red solid line) and comparison with IRI2016 model (black curve) in the altitude range of 64–80 km. (ad) shows the monthly mean Ne at noon (12 LT) corresponding to September 2008 (fall), December 2008 (winter), March 2009 (spring) and June 2009 (summer), respectively. The red solid line is the measured Ne by Kunming MF radar, and the black curve is the simulated Ne by IRI2016.
Atmosphere 14 01764 g005
Figure 6. Difference between the Ne measured by MF radar and simulation by IRI2016 model in four seasons. (ad) represents the differences corresponding to September 2008 (fall), December 2008 (winter), March 2009 (spring), and June 2009 (summer), respectively.
Atmosphere 14 01764 g006
Figure 7. Comparison of ionospheric equivalent reflection height in D-region observed by VLF long-wave signal generated by lightning system (left) and MF radar (right) on 13 July 2016. The blue dot on the left is the equivalent reflection height inverted by VLF observations. The color solid line on the right is the contour of the diurnal Ne. The black dot is the height (60-100 km) of Ne observed by Kunming MF radar.
Atmosphere 14 01764 g007
Table 1. Main parameters of Kunming MF radar DAE observations.
ParameterDaytimeNighttime
Height Resolution2 km2 km
Start Range50 km50 km
PolarizationO-modeX-mode
PRF (Hz)8040
Related Overlays168
Sampling Points285285
Record Length (s)5757
Disclaimer/Publisher’s Note: The statements, opinions and data contained in all publications are solely those of the individual author(s) and contributor(s) and not of MDPI and/or the editor(s). MDPI and/or the editor(s) disclaim responsibility for any injury to people or property resulting from any ideas, methods, instructions or products referred to in the content.