Article

Differences of East Asian Summer Monsoon Precipitation Responses between Transient and Stabilization Simulations

1
Information Center, Ministry of Water Resources of China, Beijing 100053, China
2
Key Laboratory of Meteorological Disaster/KLME/ILCEC/CIC-FEMD, Nanjing University of Information Science and Technology, Nanjing 210044, China
3
Joint Innovation Center for Modern Forestry Studies, College of Biology and Environment, Nanjing Forestry University, Nanjing 210037, China
*
Author to whom correspondence should be addressed.
Atmosphere 2023, 14(12), 1763; https://doi.org/10.3390/atmos14121763
Submission received: 9 October 2023 / Revised: 14 November 2023 / Accepted: 25 November 2023 / Published: 29 November 2023

Abstract

:
The differences between the two global warming targets of the Paris Agreement, 1.5 °C and 2 °C above pre-industrial levels, have drawn much attention from the scientific community. However, there is a remaining gap to distinguish regional climate responses in these two most typical pathways, i.e., transient and stabilization simulations, toward specific warming levels. In this study, we discern the East Asia summer monsoon (EASM) responses between these two types of simulations at low-warming targets, based on the fully coupled community Earth system model (CESM). The two types of responses display a similar increase pattern in the EASM precipitation. However, the quantitative differences between these two types of responses are as large as those between the 1.5 °C and 2 °C warming scenarios. The moist budget analysis reveals that the EASM precipitation differences are mainly caused by the thermodynamic, dynamic, and transient eddy effects. Specifically, the thermodynamic effect contributes to the precipitation increment in the coastal area of East Asia in both types of responses, with the enhanced low-level specific humidity. The dynamic contribution shows tripolar and bipolar patterns in East Asia in the transient and stabilization responses, respectively. Remarkably, the transient eddy effect contribution emerges only in the stabilization responses. Further, we reveal the dominant role of the East Asian subtropical jet (EASJ) in determining the contributions from dynamic and transient eddy effects. The changes in the EASJ’s position and intensity are greatly regulated by the temperature change patterns at the mid-high levels in response to different greenhouse gas emission pathways. Our study highlights the differences between transient and stabilization climate states on a regional scale.

1. Introduction

The East Asian summer monsoon (EASM; majorly covering 100–150° E; 20–50° N), one of the most important climate systems in East Asian regions, exerts significant influence on local water resources, agriculture, social activities, and economic development. Many previous studies have focused on the historical responses of EASM under global warming [1] and made future projections of the EASM in warmer climates [2]. In the past half century, the EASM precipitation has exhibited a strong inter-decadal variability, while the mean precipitation in eastern China has shown no clear trend [1,3,4]. It is reported that the position of the EASM rainfall band, not the intensity, is the primary response to global warming since the 1950s from observation [5,6,7]. However, climate models generally project stronger EASM precipitation and circulation throughout the 21st century under various scenarios [2].
The mechanisms of changes in the regional hydrological cycle are often investigated by the moisture budget analysis [8,9]. And, the EASM summer precipitation changes can be well explained by the thermodynamic and dynamic components [9,10]. As simulated by climate models in the Coupled Models Intercomparison Project Phase 5 (CMIP5), the thermodynamic component of the moisture budget increased consistently among these models under global warming, which is mainly induced by the higher specific humidity [9,10]. However, the role of the dynamic component is still under debate because of the uncertain EASM circulation changes in a warming climate. Large model spread exists in simulating the positions of the western North Pacific subtropical high (WNPSH) [11] and the East Asian subtropical jet (EASJ) [12], and these systems are closely related to the positions of EASM precipitation [13]. In addition, the enhanced latent heating over the Tibetan Plateau is reported to be responsible for stronger EASM circulation in warmer climates [14].
Since the Paris Agreement set the two low-warming goals of long-term global mean surface temperature (GMST), i.e., 1.5 °C and 2 °C, some studies have investigated the EASM responses at specific global warming targets [13,15]. However, as mentioned in the IPCC special report on global warming of 1.5 °C, the definition of a ‘1.5 °C or 2 °C climate projection’ remains a major challenge in assessing climate change under low-warming targets [16]. Thus, it is important and necessary to further distinguish climate responses between transient and stabilization states, as some research has exposed substantial differences between these two types of responses in both terrestrial and marine extreme events [17,18]. As for drylands, the temperature and drylands-area-coverage increase are higher in transient responses than those in stabilization responses [19]. On a regional scale, the Chinese summer precipitation also exhibits divergent responses in these two types of scenarios [20].
In transient climate responses, the GMST passes through 1.5 °C or 2 °C during a long-term increase. It only takes a few decades for the GMST to reach 1.5 °C or 2 °C in the RCP8.5 (representative concentration pathway) scenario and continue to soar thereafter. As for stabilization climate responses, the GMST would stabilize at 1.5 °C or 2 °C after several decades to centuries. Greenhouse gas emissions are specifically designed to decline quickly in the CESM (community Earth system model) low-warming experiments [21]. Therefore, the GMST would stabilize at 1.5 °C or 2 °C during the last 30 years of the 21st century. Given this, the differences between these two types of climate responses should mainly come from greenhouse gases concentrations, response time scales, and the GMST trends.
In this study, we aim to distinguish the differences between the transient and stabilization responses of the EASM at low-warming targets based on the specifically-designed fully coupled CESM experiments. In this way, we try to figure out two main questions, which are whether the EASM responds differently in transient and stabilization simulations and what exactly the differences are. Moreover, we investigate the major underlying mechanisms that modulate the EASM responses in both types of scenarios. By these means, we attempt to answer the question: what leads to the differences? As these questions remain a major challenge in assessing climate change under low-warming targets, we apply state-of-the-art model experiments to explore the answer concerning the complicated EASM system. The paper is organized as follows. Section 2 describes the CESM experiments, observational datasets, and diagnostic methods. Section 3 presents the differences between the EASM responses in the transient and stabilization scenarios and analyzes the mechanisms that modulate the EASM responses. Conclusions and discussions are given in Section 4.

2. Data and Methods

2.1. Data

We apply experiments in the CESM large ensemble project [22] and the CESM low-warming experiments [21] as the transient and stabilization simulations, respectively, because the CESM is currently the only fully coupled model, providing both transient and stabilization experiments online. Both types of experiments branch from the same historical simulations with the same version of CESM. The CESM 1.1.1 version includes the community atmosphere model (version 5, CAM5) and the parallel ocean program (version 2, POP2). All components of CESM1.1.1 are at an approximately 1° horizontal resolution and 30 vertical levels. We use the RCP8.5 simulations in the CESM large ensemble project to obtain transient responses. All forcings (such as land use, aerosol emissions, and ozone) in the CESM low-warming experiments follow RCP8.5 throughout the 21st century as in Kay et al. [22], except that well-mixed greenhouse gas concentrations are specially designed. We take two sets of simulations in the low-warming experiments, which would stabilize at 1.5 °C and 2 °C, respectively. We apply 11 ensembles each in all three projection simulations and the corresponding historical simulations.
In addition, we use several observational datasets to evaluate the model performance during the historical period (1979–2005), including precipitation data from the global precipitation climatology project (GPCP) [23] and CPC (climate prediction center) merged analysis of precipitation (CMAP) [24], and 850 hPa wind data from ERA-interim reanalysis [25] and the modern-era retrospective analysis for research and applications version 2 (MERRA-2) reanalysis [26].
Overall, the major features of the EASM during the historical period (Figures S1 and S2) can be well captured by the CESM1, although the rainfall band from eastern China to Japan is slightly weaker than observations, which is a common issue for most global climate models [27]. In addition, the CESM can also well reproduce the south wind over East Asia, which transports a large amount of moisture from the western North Pacific to East Asia.

2.2. Methods

(1)
Several warming levels
We set the 1850–1920 mean climate to represent the pre-industrial levels following Sanderson et al. [21], which serves as the benchmark to define the levels of global warming. The present-day level is represented by the last 30 years of historical simulations (1976–2005). Transient 1.5 °C and 2 °C warming levels are taken as the time slices in which the 30-year GMST reaches 1.5 °C and 2 °C above pre-industrial levels under the RCP8.5 scenario in the CESM large ensemble project for the first time. On average, the GMST reaches transient global warming of 1.5 °C and 2 °C during 2015–2044 (centers at 2029) and 2027–2056 (centers at 2041), respectively. Stabilized 1.5 °C and 2 °C warming levels are the last 30-year time slices in the 21st century (2071–2100) under specially designed 1.5 °C and 2 °C warming scenarios in the CESM low-warming experiments.
(2)
Moisture budget
We use the moisture budget equation to diagnose the contribution of different factors to future EASM precipitation changes and the underlying mechanisms as well. This diagnostic approach has been widely used in the literature [8,9,28]. The equation in response to global warming could be expressed as follows:
P = 1 ρ w g 100 h P a s u r f a c e ( ω ¯ P q + ω P q ¯ + ω P q + V ¯ · q + V · q ¯ + V · q ) + E + T E
T H = 1 ρ w g 100 h P a s u r f a c e ( ω ¯ P q + V ¯ · q )
D Y = 1 ρ w g 100 h P a s u r f a c e ( ω P q ¯ + V · q ¯ )
N L = 1 ρ w g 100 h P a s u r f a c e ( ω P q + V · q )
where the overbar indicates a climatological mean of 1976–2005 in the historical runs and the prime indicates departures from the climatology. P is precipitation, ω is vertical pressure velocity, q is specific humidity, V is the horizontal wind vector, E is evaporation from the surface, ρ w is the density of water, and g is the gravitational acceleration. The model output has the variable of surface pressure, which is referred to as the surface.
In transient responses, the mean moisture convergence (P-E) responses in East Asia mainly result from the changes in the dynamic (DY’) and thermodynamic (TH’) terms at the high level of global warming, whereas the transient eddy (TE’) and nonlinear (NL’) terms are relatively small [29]. Note that the interactions between dynamic and thermodynamic processes are not considered here in this study.

3. Results

3.1. EASM Responses and Their Differences

Based on the results from the CMIP3 and CMIP5 models [27,30,31], the EASM precipitation is expected to increase remarkably under a high-emission scenario, with the GMST exceeding 2 °C above the pre-industrial levels. However, we found that the EASM precipitation would increase significantly over most regions of East Asia even if the GMST is limited at two low-warming targets for both transient and stabilization responses, especially over southern East Asia (Figure 1a–d). Quantitatively, the climatological summer mean precipitation in East Asia (100–150° E; 20–50° N) is projected to increase by 5.17% and 9.16% relative to the present-day level at 1.5 °C and 2 °C, respectively, in transient responses, and with values of 10.79% and 13.37% in stabilization responses.
The stabilization responses of the EASM precipitation (Figure 1c,d) are consistent with the transient responses (Figure 1a,b) in both sign and pattern, with stronger increases along southern China, South Korea, and Japan (Figure 1e,f). The climatological mean EASM precipitation differences are 5.62% and 4.21% between the stabilization and transient responses at 1.5 °C and 2 °C, respectively. Note that the differences between the two types of responses are even larger than the differences between the two low-warming targets (that is, the EASM precipitation is increased by 3.99% and 2.58% from 1.5 °C to 2 °C for the transient and stabilization responses, respectively).
While the EASM precipitation is sensitive to the GMST change, the EASM low-level (i.e., 850 hPa) circulation only changes slightly at low-warming targets. This may be related to the small change in the WNPSH in both position and intensity (not shown), although some other climate models project a significantly strengthened EASM circulation under the high levels of global warming [32,33]. Given this, we focus on the EASM precipitation changes in the following sections.

3.2. Moisture Budget Analysis

The mechanisms of how the hydrological cycle responds to global warming have been proposed in many previous studies [8,9,10]. For large-scale responses, the increase in low-level water vapor (i.e., thermodynamic contribution) plays a crucial role in determining the changes in surface net water flux (i.e., precipitation minus evaporation or P-E), which is the so-called “wet-get-wetter” or “rich-get-richer” mechanism [8,34]. In addition, dynamic feedback can also substantially alter precipitation anomalies in the convergence zones in the tropics [35], and the “warmer-get-wetter” mechanism emphasizes the importance of the SST warming pattern under global warming [36].
According to the transient simulations by CMIP5 models, the future increment of global monsoon rainfall is attributed to the enhanced atmospheric moisture and surface evaporation [37,38]. However, the monsoon circulation is projected to become weaker in warmer climates, which could partly offset the positive thermodynamic effect on the rainfall change [39]. As a result, the Asian monsoon benefits from a larger surface evaporation increase and less slowdown of circulation than the other monsoon regions, which leads to more rainfall increase [40].
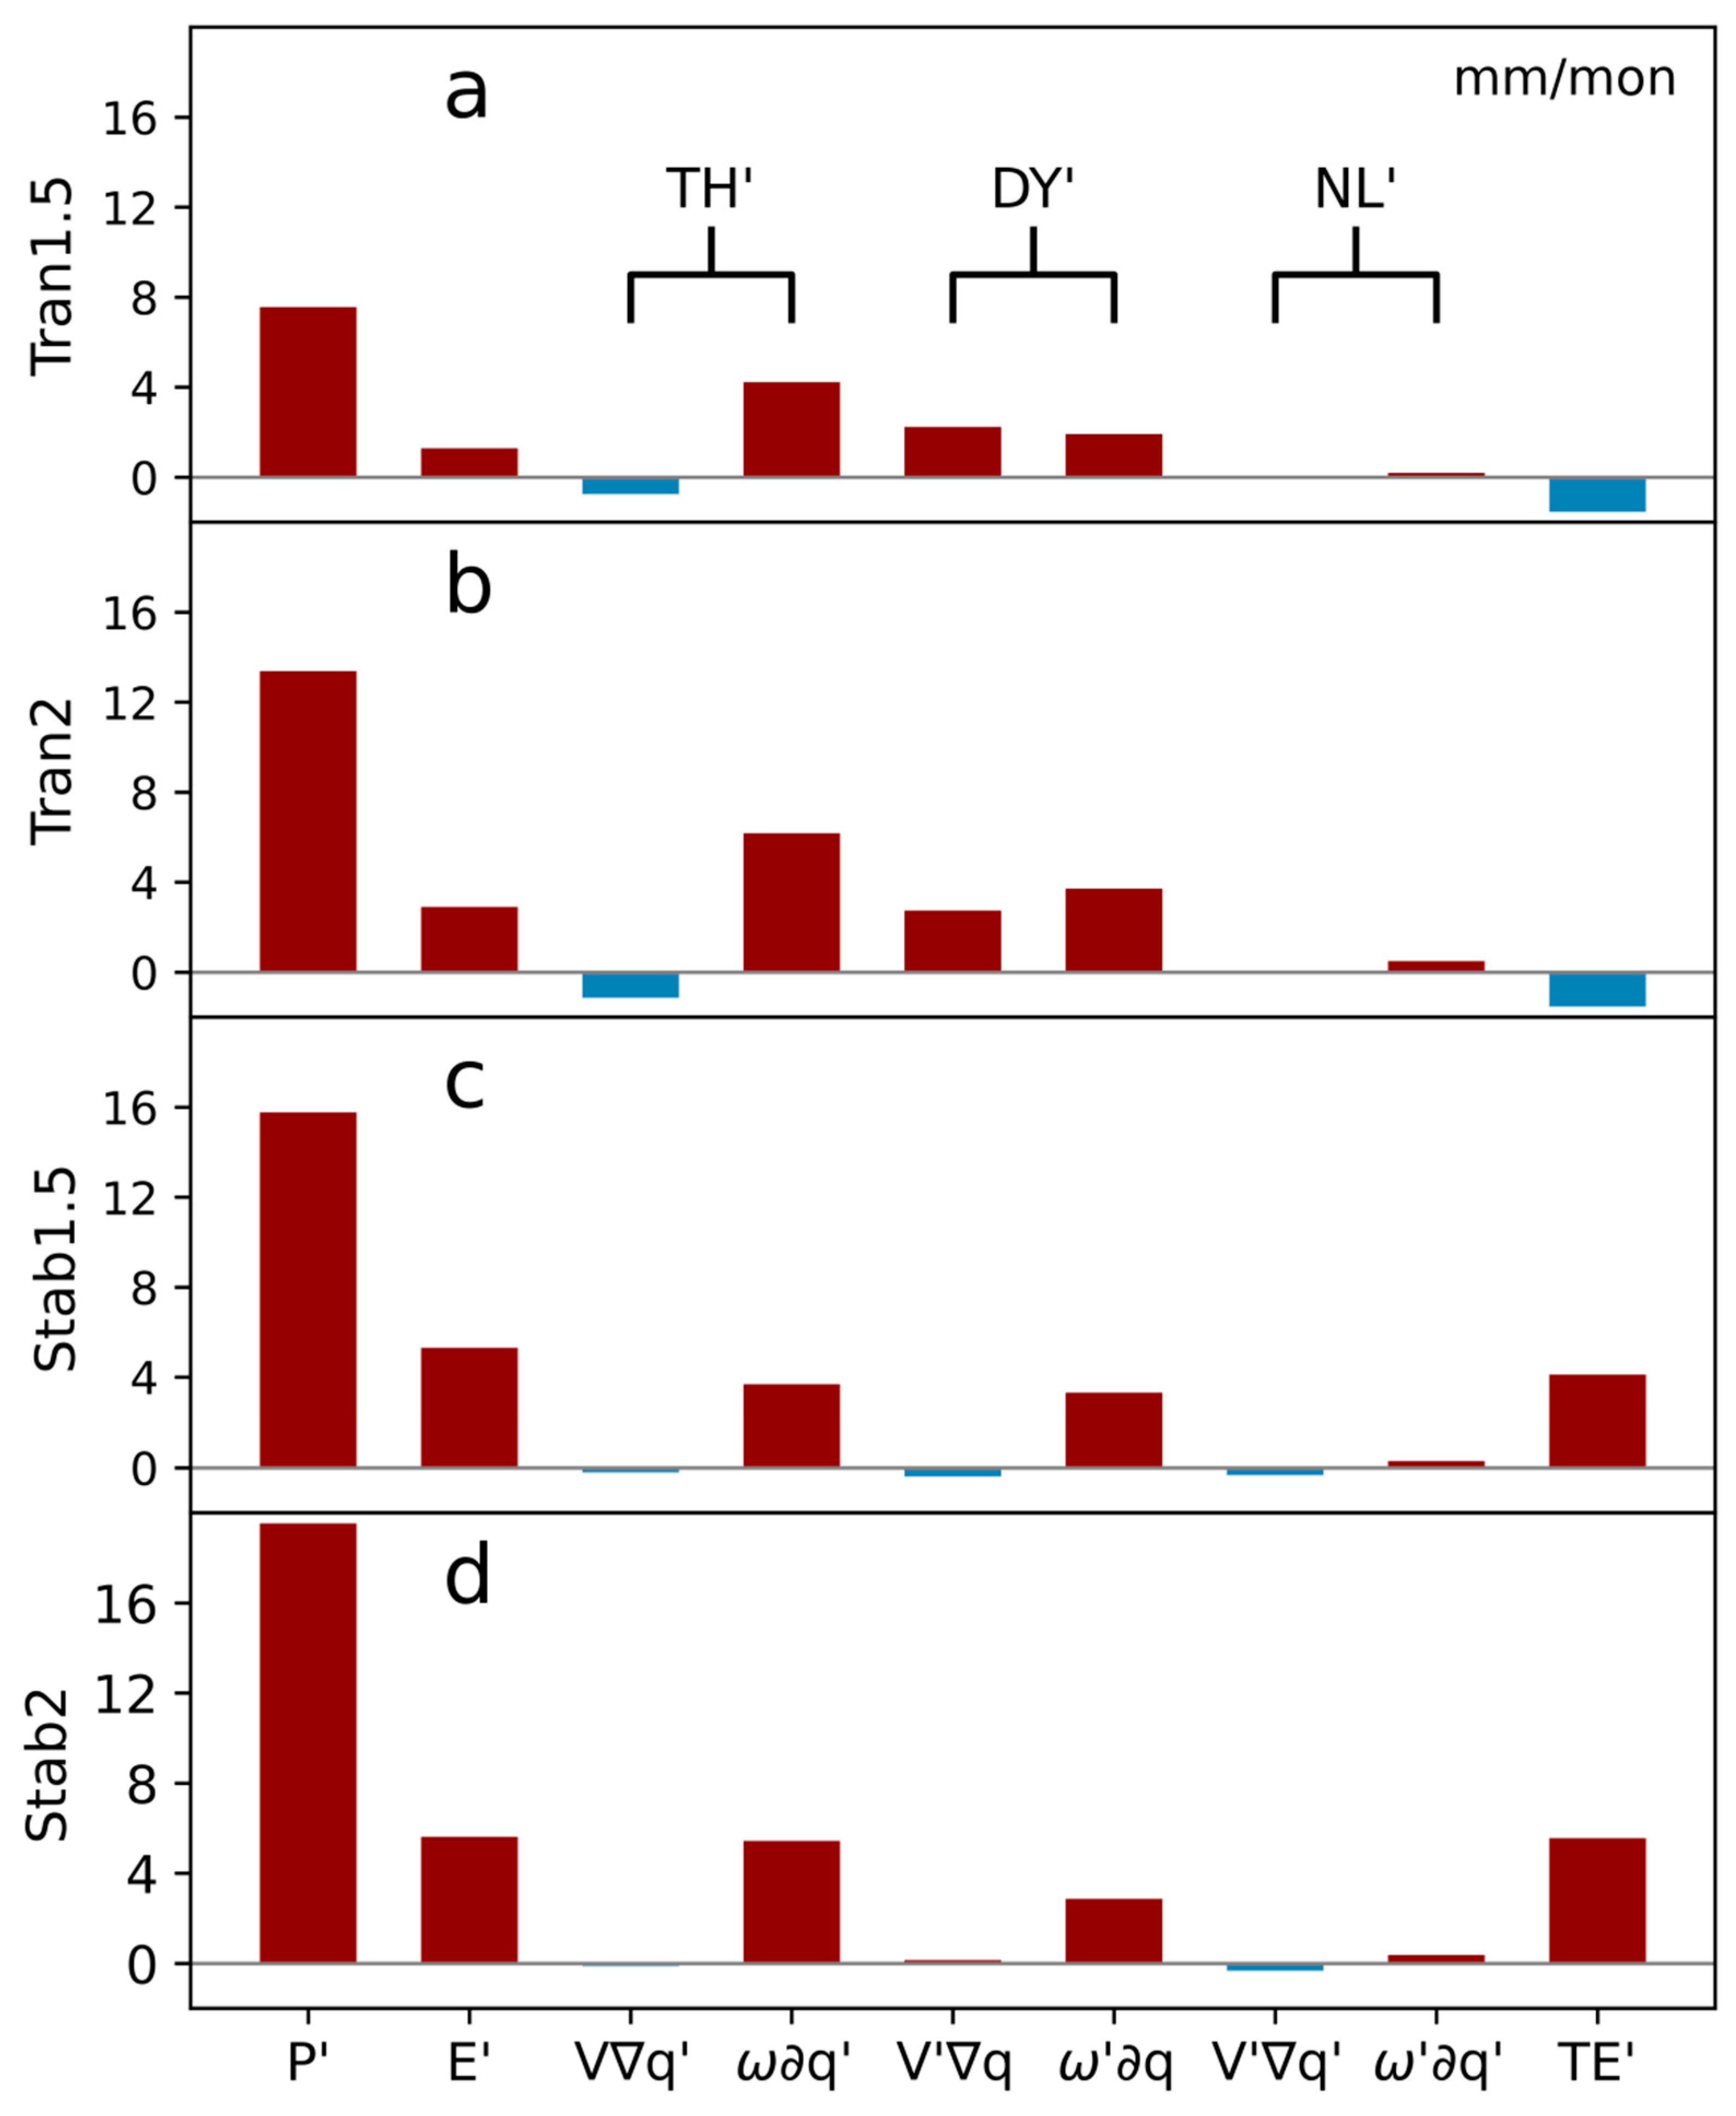
We perform the moisture budget diagnosis to explore the mechanisms of the EASM precipitation responses at 1.5 °C and 2 °C (Figure 2). It is found that the evaporation, thermodynamic, and dynamic terms exert positive contributions to the increased EASM precipitation in both transient and stabilization responses. The thermodynamic contribution is due to the enhancement of low-level specific humidity that enlarges the vertical moisture gradient. Note that the effect from the nonlinear term is negligible.
In transient responses, the thermodynamic and dynamic contributions are more important than the evaporation contribution (Figure 2a,b). The horizontal and vertical circulation changes can jointly enhance the dynamic effect. In contrast, the evaporation plays a more important role in stabilization responses, while the dynamic contribution is only caused by the vertical circulation change (Figure 2c,d). Interestingly, the transient eddy term only works for the stabilized responses, which contributed little to the transient responses.
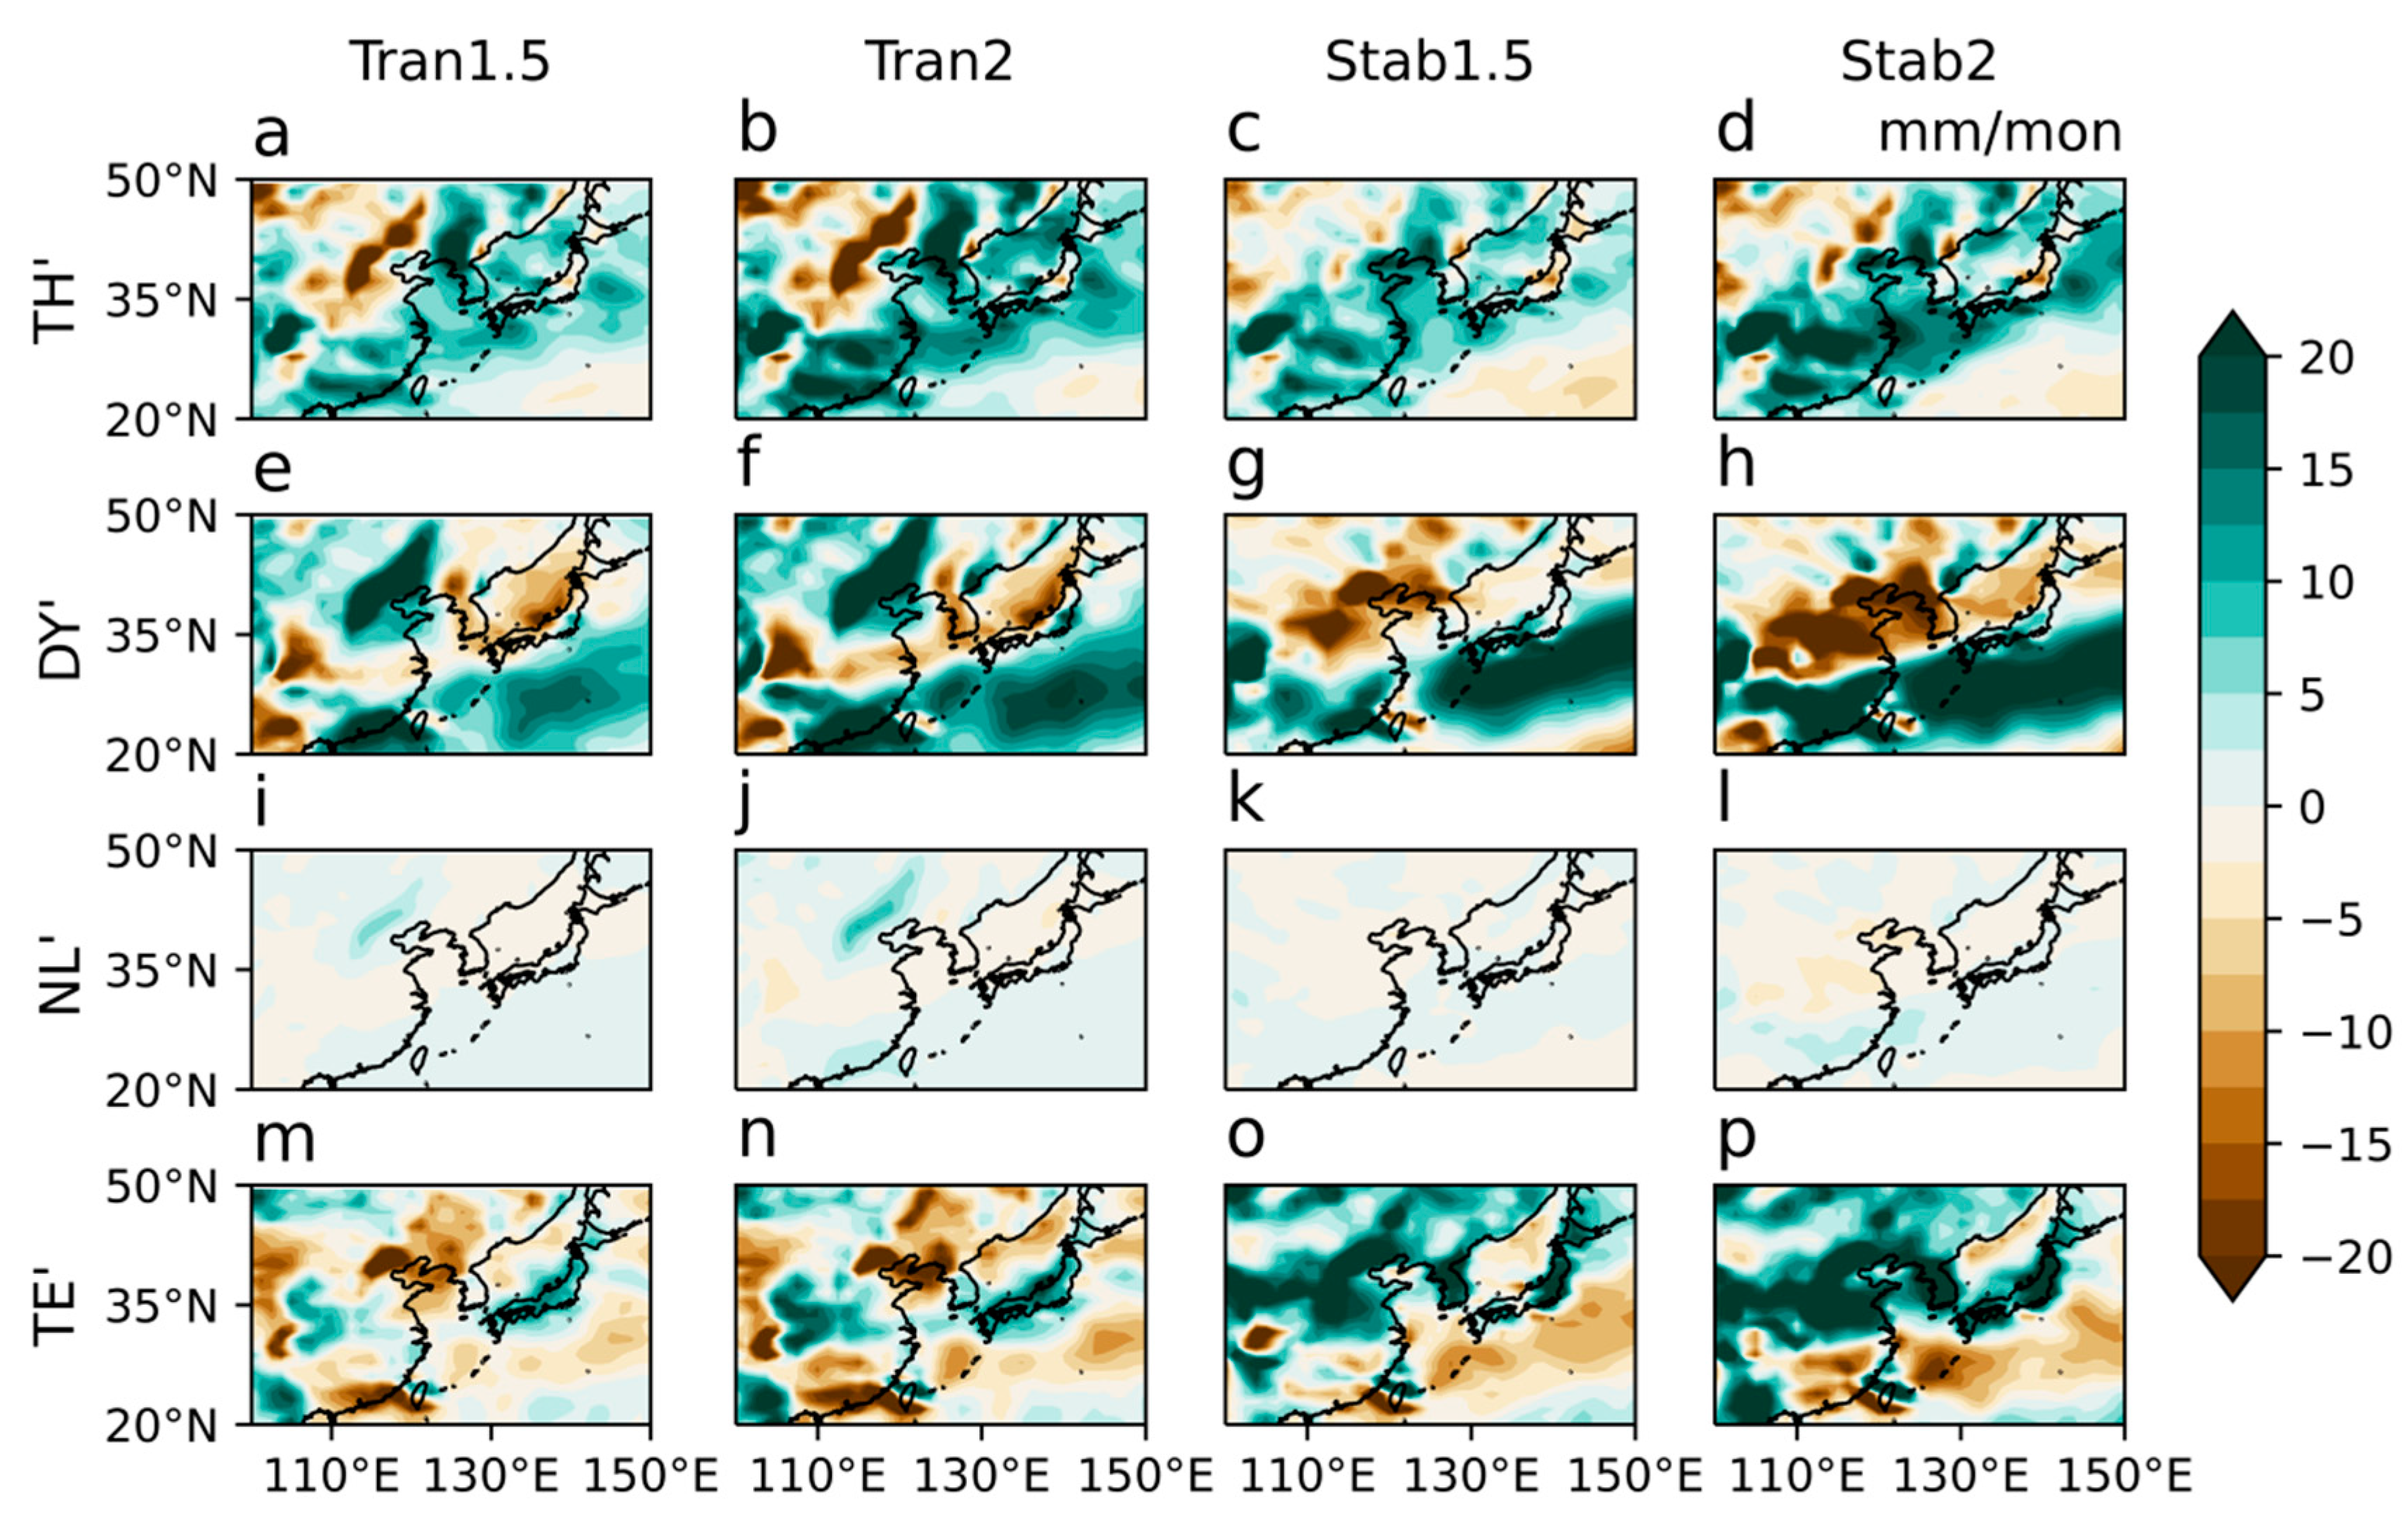
Figure 3 further shows the spatial patterns features of changes in each moisture budget term for the transient and stabilization responses in the EASM region. The thermodynamic term exhibits robust positive changes in the coastal area (Figure 3a–d) in both types of responses which are due to the rapid increase in low-level specific humidity in the coastal area. Yet, the dynamic term exhibits tripole and bipole patterns in transient and stabilization responses, respectively (Figure 3e–h). In addition, changes in the transient eddy term are only obvious in the stabilization responses, favoring more land precipitation over East Asia north of 30° N (Figure 3m–p).
In general, thermodynamic and dynamic terms are still important factors driving the precipitation change in the stabilization responses, while the transient eddy term only works for the stabilization responses. Again, the non-linear term remains negligible (Figure 3i–l).

3.3. Roles of the EASJ

As suggested previously [41], the WNPSH and the EASJ are the two most significant environmental factors in modulating the large-scale dynamics of the EASM. The low-level southerly wind along the western flank of the WNPSH is critical for moisture supply to the East Asian summer rainfall. In the upper troposphere, the EASJ acts to anchor the position of the rainfall band trough inducing the warm horizontal temperature advection in the mid-troposphere and thus the mean ascending motion [42]. In addition, the EASJ can steer transient eddies to regulate active weather disturbances. The jet stream is identified with the surface front that produces extensive Meiyu [43]. The ageostrophic secondary circulation associated with the upper-tropospheric jet promotes convection to its south, forming the rain band [41].
At 1.5 °C and 2 °C warming levels, we found that the EASJ displays remarkable changes (Figure 4), while the WNPSH changes little. In transient responses, the EASJ is significantly decreased over its climatological core area located at about 40° N and 250 hPa (Figure 4a,b). This leads to the upward motion weakening above the Meiyu rainband, consistent with the negative dynamic term change in this region (Figure 3e,f). As a result, the EASM precipitation is slightly suppressed along ~30° N (i.e., the approximate location of the Meiyu rainband), while the summer mean precipitation increases significantly over other East Asian regions (Figure 1a,b). In stabilization responses, the westerly wind is intensified to the south of the climatological EASJ core (Figure 4c,d), leading to a southward shift of the EASJ and thereby anomalous subsidence (ascendance) south (north) of ~30° N. Therefore, the dynamic term (Figure 3g,h) and the EASM precipitation (Figure 1c,d) strengthen in the south of East Asia.
As shown by the differences between the EASJ responses in stabilization and transient simulations, the positive difference is quite obvious at the westerly jet core (Figure 4e,f). The shift of the EASJ position regulates the secondary circulation over East Asia, leading to the apparent difference in the pattern of dynamic term changes (compare Figure 3e,f with Figure 3g,h) and summer precipitation responses (Figure 1e,f).
Further, we diagnose the responses of weather disturbances associated with the EASJ (Figure 5). The energetic weather disturbances along the EASJ create favorable conditions for strong convection [41]. We measure the weather disturbances by the standard deviation of the high-frequency meridional wind at 200 hPa. A high-pass filter with a cutoff period of 8 days is used. In transient responses, weather disturbances weaken significantly at 35–45° N (Figure 5a,b), along with the decreased EASJ intensity (Figure 4a,b). In stabilization responses, weather disturbances increase in the southern part of the EASJ near the Korean Peninsula (Figure 5c,d), in association with a southward-shifted EASJ; meanwhile, the synoptic disturbances reduce significantly over southern China (Figure 4c,d). Therefore, active weather disturbances in the westerly waveguide reveal the significant differences between the two types of responses (Figure 5e,f), explaining the differences of the transient eddy term (Figure 3m–p).
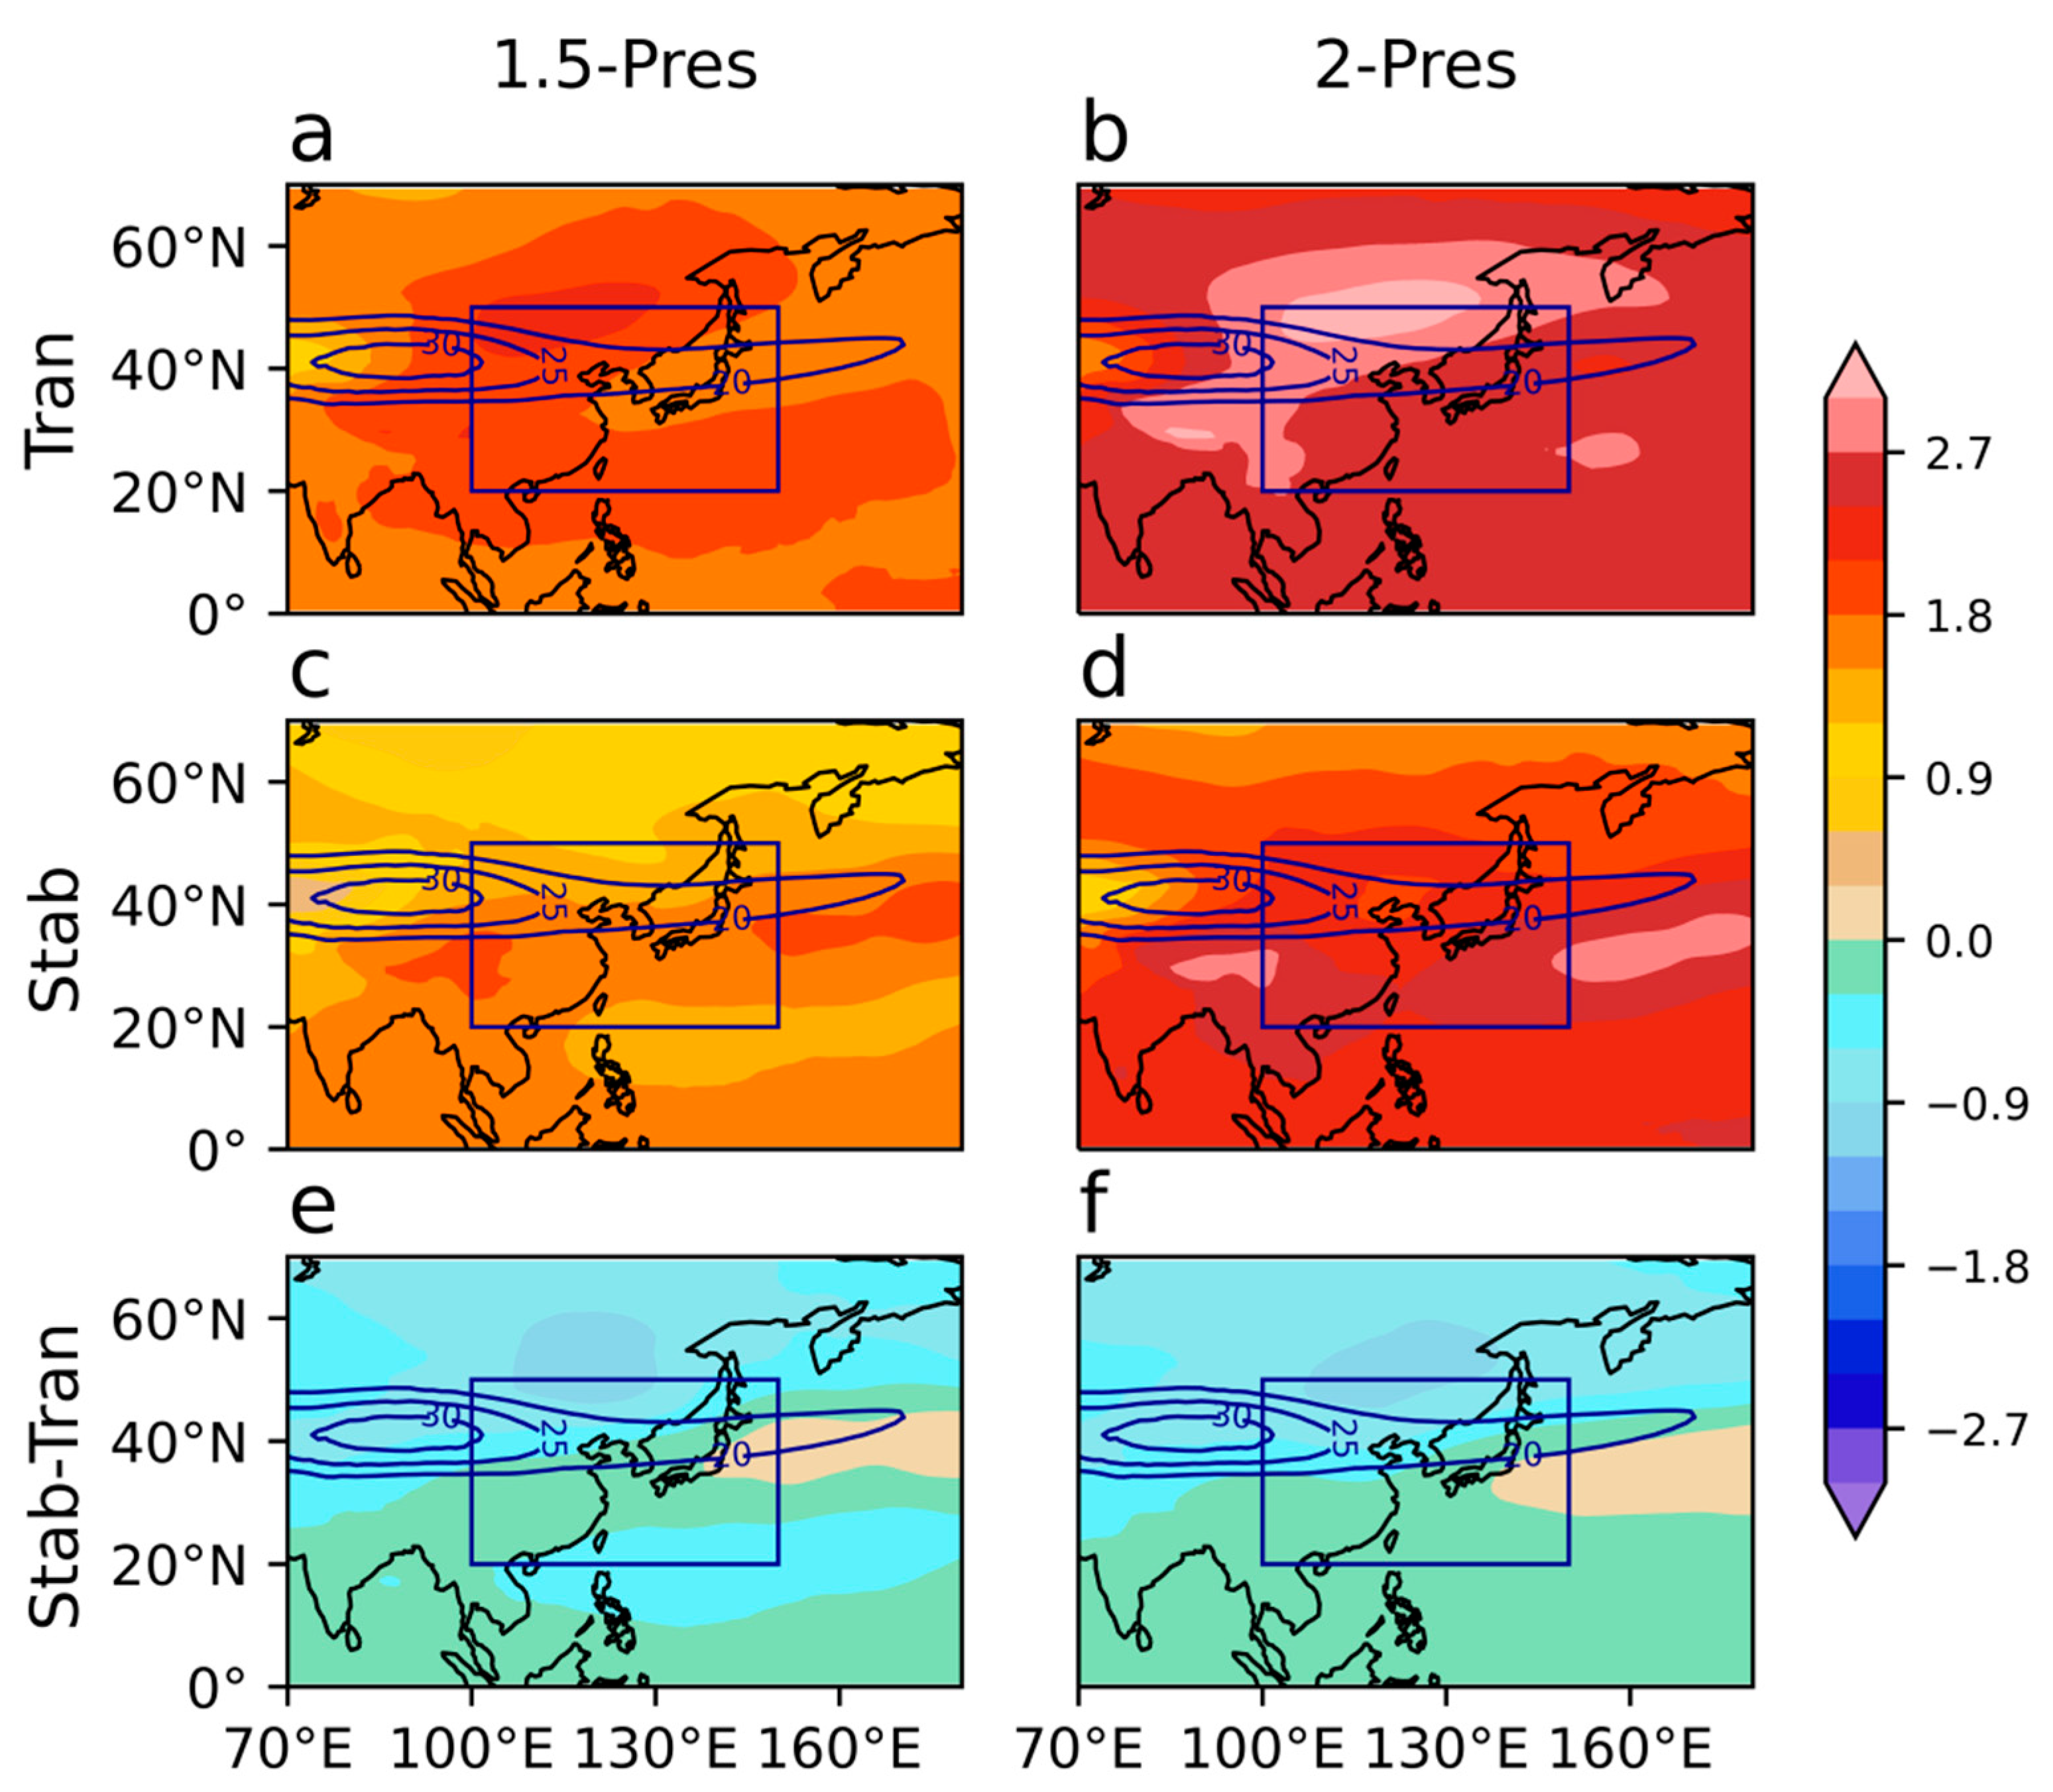
While the uniform thermodynamic responses result from the mean temperature warming, changes in the EASJ play a crucial role in modulating the contributions from dynamic and transient eddy terms and thus lead to the differences between the transient and stabilization responses. Thus, we attempted to figure out what causes such differences in the EASJ responses. We found that the temperature response patterns in the mid-high troposphere can act to regulate the EASJ responses (Figure 6). Specifically, the strongest upper-level warming over East Asia is located north of the EASJ in the transient simulations (Figure 6a,b), leading to the decreased meridional temperature gradient near the EASJ core region and thus the weakened EASJ (Figure 4a,b). On the contrary, the strongest upper-level warming is shifted southward to the south of the EASJ over East Asia (Figure 6c,d); thus, the meridional temperature gradient is increased near the EASJ core region and the southern part of the EASJ is intensified (Figure 4c,d).
The upper-level temperature warming in the stabilization simulation is relatively weaker than that in transient responses (Figure 6e,f), which may be due to the mitigation of greenhouse gas emissions in stabilization responses. Moreover, the temperature in higher latitudes seems more sensitive to the change in greenhouse gas emissions, as shown by larger negative differences. As a result, the distinct temperature warming patterns in the mid-upper troposphere give rise to the different EASJ responses, which causes the EASM precipitation responses via dynamic and transient eddy processes.

4. Summary and Discussion

Here, we distinguish the differences of the EASM between transient and stabilization responses at low-warming targets, utilizing the fully coupled CESM experiments. Although the EASM precipitation shares a similar significant increase pattern in both transient and stabilization responses, the stabilization responses reveal stronger increases than the transient responses along southern China, South Korea, and Japan (Figure 1). Notably, the quantitative differences in EASM precipitation between the transient and stabilization responses are even larger than the differences between the two warming targets (1.5 °C and 2 °C) in East Asia. By contrast, the low-level circulation displays little change.
Then, we apply the moisture budget analysis to decompose the responses of the EASM precipitation (Figure 2 and Figure 3). The thermodynamic term contributes to more precipitation in the coastal area of East Asia in both types of responses, which is similar in pattern. The enhanced low-level specific humidity plays an important role in determining the thermodynamic contribution, which is consistent with the general understanding of the hydrological cycle in response to global warming.
The dynamic contributions are also positive in both types of responses. While the horizontal and vertical circulation changes cooperate to enhance the dynamic effect in transient responses, only vertical circulation change works to enhance the dynamic effect in the stabilization responses. More importantly, the dynamic term displays tripolar and bipolar patterns in East Asia in the transient and stabilization responses, respectively.
Remarkably, the effect of the transient eddy term emerges in the stabilization responses, exerting positive contributions to precipitation in northern China, South Korea, and Japan.
While the WNPSH and low-level circulation exhibit little change in East Asia at the two low-warming targets, the EASJ and high-level circulation are the critical factors, leading to the differences between transient and stabilization responses (Figure 4). The intensity of the EASJ decreases at its climatological core area and intensifies south of its climatological core area in transient and stabilization responses, respectively. The differences in the EASJ intensity and position in the two types of responses result in the differences in secondary circulation over East Asia, especially the intensity and position of the upward motion. Therefore, the dynamic term displays the distinct patterns in the two types of responses, consistent with the circulation shift. Then, the EASM precipitation difference in the south of East Asia is largely attributed to the EASJ difference via the dynamic effect.
In addition, the EASJ also regulates the energetic weather disturbances along the EASJ (Figure 5). Hence, the two types of responses display distinguishable weather disturbances in the westerly waveguide, impacting the EASM precipitation via the transient eddy effect. Especially, the positive transient eddy effect offsets the negative dynamic effect in northern China in stabilization responses, leading to the increment in boreal summer precipitation.
Here, we reveal the crucial role of the EASJ in determining the distinct EASM precipitation changes in transient and stabilization responses. Furthermore, it is the mid- to high-level temperature change patterns that lead to the different EASJ alteration (Figure 6). The maximum mid- to high-level temperature warming locates north (south) of the EASJ in East Asia, in transient (stabilization) responses. The mid- to high-level warming patterns change the temperature gradient along the EASJ, modifying the EASJ intensity and position.
In the first place, it is the inequality of regional climate impacts and local capacities that motivates many countries to support and pursue the more stringent 1.5 °C warming target [44]. Our results expose the considerable differences in the most important regional weather and climate system in East Asia, i.e., the EASM system, between transient and stabilization responses. Specifically, southern China would be exposed to more severe extreme precipitation and flood risk in stabilization responses. It was largely underestimated in research based on traditionally transient simulations. Consequently, local agriculture is closely related to the amount of precipitation, and flooding is one of the major disasters affecting people’s living and economic activities. Fundamentally, it is the different greenhouse gas emission pathways behind the two types of responses. Therefore, how GMST reaches specific goals is also crucial to regional climate responses. Our study not only highlights the differences between transient and stabilization climate states on a regional scale, but also indicates potential differences in different scenarios applying different greenhouse gas emission pathways.
In this study, we apply the single CESM model, because the CESM was the only model providing fully coupled stabilization simulations. However, the coupled model intercomparison project Phase 6 (CMIP6) has now released their results. The scenario model intercomparison project (ScenarioMIP) is the primary activity within CMIP6. It provides the basis for investigating a number of targeted science and policy questions that are especially relevant to scenario-based analysis, including the consequences of scenarios that limit warming to below 1.5 °C/2 °C [44]. We believe future work based on ScenarioMIP simulations could provide more comprehensive results.

Supplementary Materials

The following supporting information can be downloaded at: https://www.mdpi.com/article/10.3390/atmos14121763/s1, Figure S1: The summer precipitation climatology in East Asia during historical period (1979–2005). a uses the GPCP data, b uses the CMAP data, c is simulated by the CESM. The red rectangle denotes the EASM region (100–150° E, 20–50° N); Figure S2: The summer 850-hPa wind climatology in East Asia during historical period (1979–2005). a uses the ERA-Interim reanalysis data, b uses the MERRA-2 reanalysis data, c is simulated by the CESM. The red rectangle denotes the EASM region (100–150° E, 20–50° N).

Author Contributions

Conceptualization, J.L.; methodology, J.L.; software, J.L.; validation, H.X., J.M., J.D. and L.Z.; formal analysis, J.L.; investigation, J.L.; data curation, J.L.; writing—original draft preparation, J.L.; writing—review and editing, H.X., J.M., J.D. and L.Z.; visualization, J.L.; supervision, H.X.; project administration, H.X.; funding acquisition, H.X. All authors have read and agreed to the published version of the manuscript.

Funding

This work was funded by the National Key R&D Program of China (Grant No. 2021YFB3900601) and the National Natural Science Foundation of China (Grant No. 41975106).

Institutional Review Board Statement

Not applicable.

Informed Consent Statement

Not applicable.

Data Availability Statement

We acknowledge the NCAR for making available the CESM model simulation outputs. All CESM simulations are obtained from the Climate Data Gateway at NCAR (https://www.earthsystemgrid.org/ (accessed on 16 July 2019)). The GPCP datasets [23] are available at http://gpcp.umd.edu/ (accessed on 21 April 2022). The CMAP datasets [24] are available at https://psl.noaa.gov/data/gridded/data.cmap.html (accessed on 21 April 2022). The ERA-interim reanalysis datasets [25] are available at http://apps.ecmwf.int/datasets/ (accessed on 23 April 2022). MERRA-2 reanalysis datasets [26] are available at https://disc.gsfc.nasa.gov/datasets?page=1&keywords=MERRA-2 (accessed on 22 April 2022).

Conflicts of Interest

The authors declare no conflict of interest.

References

  1. Chen, W.; Wang, L.; Feng, J.; Wen, Z.; Ma, T.; Yang, X.; Wang, C. Recent progress in studies of the variabilities and mechanisms of the East Asian monsoon in a changing climate. Adv. Atmos. Sci. 2019, 36, 887–901. [Google Scholar] [CrossRef]
  2. Kitoh, A. The Asian monsoon and its future change in climate models: A review. J. Meteorol. Soc. Jpn. Ser. II 2017, 95, 7–33. [Google Scholar] [CrossRef]
  3. Zhou, T.; Gong, D.; Li, J.; Li, B. Detecting and understanding the multi-decadal variability of the East Asian summer monsoon-Recent progress and state of affairs. Meteorol. Z. 2009, 18, 455–467. [Google Scholar] [CrossRef]
  4. Zhang, R. Changes in East Asian summer monsoon and summer rainfall over eastern China during recent decades. Sci. Bull. 2015, 60, 1222–1224. [Google Scholar] [CrossRef]
  5. Li, J.; Wu, Z.; Jiang, Z.; He, J. Can global warming strengthen the East Asian summer monsoon? J. Clim. 2010, 23, 6696–6705. [Google Scholar] [CrossRef]
  6. Zhu, Y.; Wang, H.; Zhou, W.; Ma, J. Recent changes in the summer precipitation pattern in East China and the background circulation. Clim. Dyn. 2011, 36, 1463–1473. [Google Scholar] [CrossRef]
  7. Liu, H.; Zhou, T.; Zhu, Y.; Lin, Y. The strengthening East Asia summer monsoon since the early 1990s. Chin. Sci. Bull. 2012, 57, 1553–1558. [Google Scholar] [CrossRef]
  8. Seager, R.; Naik, N.; Vecchi, G.A. Thermodynamic and dynamic mechanisms for large-scale changes in the hydrological cycle in response to global warming. J. Clim. 2010, 23, 4651–4668. [Google Scholar] [CrossRef]
  9. Qu, X.; Huang, G.; Zhou, W. Consistent responses of East Asian summer mean rainfall to global warming in CMIP5 simulations. Theor. Appl. Climatol. 2014, 117, 123–131. [Google Scholar] [CrossRef]
  10. Zhou, S.; Huang, G.; Huang, P. Changes in the East Asian summer monsoon rainfall under global warming: Moisture budget decompositions and the sources of uncertainty. Clim. Dyn. 2018, 51, 1363–1373. [Google Scholar] [CrossRef]
  11. He, C.; Zhou, T. Responses of the western North Pacific subtropical high to global warming under RCP4. 5 and RCP8. 5 scenarios projected by 33 CMIP5 models: The dominance of tropical Indian Ocean–tropical western Pacific SST gradient. J. Clim. 2015, 28, 365–380. [Google Scholar] [CrossRef]
  12. Horinouchi, T.; Matsumura, S.; Ose, T.; Takayabu, Y.N. Jet–precipitation relation and future change of the mei-yu–baiu rainband and subtropical jet in CMIP5 coupled GCM simulations. J. Clim. 2019, 32, 2247–2259. [Google Scholar] [CrossRef]
  13. Liu, J.; Xu, H.; Deng, J. Projections of East Asian summer monsoon change at global warming of 1.5 and 2 °C. Earth Syst. Dynam. 2018, 9, 427–439. [Google Scholar] [CrossRef]
  14. He, C.; Wang, Z.; Zhou, T.; Li, T. Enhanced latent heating over the Tibetan Plateau as a key to the enhanced East Asian summer monsoon circulation under a warming climate. J. Clim. 2019, 32, 3373–3388. [Google Scholar] [CrossRef]
  15. Chen, L.; Qu, X.; Huang, G.; Gong, Y. Projections of East Asian summer monsoon under 1.5 °C and 2 °C warming goals. Theor. Appl. Climatol. 2019, 137, 2187–2201. [Google Scholar] [CrossRef]
  16. Hoegh-Guldberg, O.; Jacob, D.; Taylor, M.; Bindi, M.; Brown, S.; Camilloni, I.; Diedhiou, A.; Djalante, R.; Ebi, K.L.; Engelbrecht, F.; et al. Impacts of 1.5 °C Global Warming on Natural and Human Systems. In Global Warming of 1.5 °C. An IPCC Special Report on the Impacts of Global Warming of 1.5 °C above Pre-Industrial Levels and Related Global Greenhouse Gas Emission Pathways, in the Context of Strengthening the Global Response to the Threat of Climate Change, Sustainable Development, and Efforts to Eradicate Poverty; Masson-Delmotte, V., Zhai, P., Pörtner, H.-O., Roberts, D., Skea, J., Shukla, P.R., Pirani, A., Moufouma-Okia, W., Péan, C., Pidcock, R., et al., Eds.; Cambridge University Press: Cambridge, UK; New York, NY, USA, 2018; pp. 175–312. [Google Scholar] [CrossRef]
  17. King, A.D.; Lane, T.P.; Henley, B.J.; Brown, J.R. Global and regional impacts differ between transient and equilibrium warmer worlds. Nat. Clim. Chang. 2020, 10, 42–47. [Google Scholar] [CrossRef]
  18. Liu, J.; Luo, J.-J.; Xu, H.; Ma, J.; Deng, J.; Zhang, L.; Bi, D.; Chen, X. Robust regional differences in marine heatwaves between transient and stabilization responses at 1.5 °C global warming. Weather. Clim. Extrem. 2021, 32, 100316. [Google Scholar] [CrossRef]
  19. Wei, Y.; Yu, H.; Huang, J.; Zhou, T.; Zhang, M.; Ren, Y. Drylands climate response to transient and stabilized 2 °C and 1.5 °C global warming targets. Clim. Dyn. 2019, 53, 2375–2389. [Google Scholar] [CrossRef]
  20. Jiang, Z.; Hou, Q.; Li, T.; Liang, Y.; Li, L. Divergent responses of summer precipitation in China to 1.5°C global warming in transient and stabilized scenarios. Earth’s Future 2021, 9, e2020EF001832. [Google Scholar] [CrossRef]
  21. Sanderson, B.M.; Xu, Y.; Tebaldi, C.; Wehner, M.; O’Neill, B.; Jahn, A.; Pendergrass, A.G.; Lehner, F.; Strand, W.G.; Lin, L.; et al. Community climate simulations to assess avoided impacts in 1.5 and 2 °C futures. Earth Syst. Dynam. 2017, 8, 827–847. [Google Scholar] [CrossRef]
  22. Kay, J.E.; Deser, C.; Phillips, A.; Mai, A.; Hannay, C.; Strand, G.; Arblaster, J.M.; Bates, S.C.; Danabasoglu, G.; Edwards, J.; et al. The Community Earth System Model (CESM) large ensemble project: A community resource for studying climate change in the presence of internal climate variability. Bull. Am. Meteorol. Soc. 2015, 96, 1333–1349. [Google Scholar] [CrossRef]
  23. Adler, R.F.; Sapiano, M.R.P.; Huffman, G.J.; Wang, J.-J.; Gu, G.; Bolvin, D.; Chiu, L.; Schneider, U.; Becker, A.; Nelkin, E.; et al. The Global Precipitation Climatology Project (GPCP) monthly analysis (new version 2.3) and a review of 2017 global precipitation. Atmosphere 2018, 9, 138. [Google Scholar] [CrossRef]
  24. Xie, P.; Arkin, P.A. Global precipitation: A 17-year monthly analysis based on gauge observations, satellite estimates, and numerical model outputs. Bull. Am. Meteorol. Soc. 1997, 78, 2539–2558. [Google Scholar] [CrossRef]
  25. Dee, D.P.; Balmaseda, M.A.; Balsamo, G.; Engelen, R.; Simmons, A.J.; Thépaut, J.-N. Toward a consistent reanalysis of the climate system. Bull. Am. Meteorol. Soc. 2014, 95, 1235–1248. [Google Scholar] [CrossRef]
  26. Gelaro, R.; McCarty, W.; Suárez, M.J.; Todling, R.; Molod, A.; Takacs, L.; Randles, C.A.; Darmenov, A.; Bosilovich, M.G.; Reichle, R.; et al. The modern-era retrospective analysis for research and applications, version 2 (MERRA-2). J. Clim. 2017, 30, 5419–5454. [Google Scholar] [CrossRef]
  27. Seo, K.-H.; Ok, J.; Son, J.-H.; Cha, D.-H. Assessing future changes in the East Asian summer monsoon using CMIP5 coupled models. J. Clim. 2013, 26, 7662–7675. [Google Scholar] [CrossRef]
  28. Lee, D.; Min, S.-K.; Fischer, E.; Shiogama, H.; Bethke, I.; Lierhammer, L.; Scinocca, J.F. Impacts of half a degree additional warming on the Asian summer monsoon rainfall characteristics. Environ. Res. Lett. 2018, 13, 044033. [Google Scholar] [CrossRef]
  29. Li, X.; Ting, M.; Li, C.; Henderson, N. Mechanisms of Asian summer monsoon changes in response to anthropogenic forcing in CMIP5 models. J. Clim. 2015, 28, 4107–4125. [Google Scholar] [CrossRef]
  30. Chen, H.; Sun, J. Projected change in East Asian summer monsoon precipitation under RCP scenario. Meteorol. Atmos. Phys. 2013, 121, 55–77. [Google Scholar] [CrossRef]
  31. Seo, K.-H.; Ok, J. Assessing future changes in the East Asian summer monsoon using CMIP3 models: Results from the best model ensemble. J. Clim. 2013, 26, 1807–1817. [Google Scholar] [CrossRef]
  32. Li, Z.; Sun, Y.; Li, T.; Ding, Y.; Hu, T. Future changes in East Asian summer monsoon circulation and precipitation under 1.5 to 5 °C of warming. Earth’s Future 2019, 7, 1391–1406. [Google Scholar] [CrossRef]
  33. Held, I.M.; Soden, B.J. Robust responses of the hydrological cycle to global warming. J. Clim. 2006, 19, 5686–5699. [Google Scholar] [CrossRef]
  34. Chou, C.; Neelin, J.D.; Chen, C.-A.; Tu, J.-Y. Evaluating the “rich-get-richer” mechanism in tropical precipitation change under global warming. J. Clim. 2009, 22, 1982–2005. [Google Scholar] [CrossRef]
  35. Xie, S.-P.; Deser, C.; Vecchi, G.A.; Ma, J.; Teng, H.; Wittenberg, A.T. Global warming pattern formation: Sea surface temperature and rainfall. J. Clim. 2010, 23, 966–986. [Google Scholar] [CrossRef]
  36. Hsu, P.; Li, T.; Murakami, H.; Kitoh, A. Future change of the global monsoon revealed from 19 CMIP5 models. J. Geophys. Res. Atmos. 2013, 118, 1247–1260. [Google Scholar] [CrossRef]
  37. Lee, J.-Y.; Wang, B. Future change of global monsoon in the CMIP5. Clim. Dyn. 2014, 42, 101–119. [Google Scholar] [CrossRef]
  38. Kitoh, A.; Endo, H.; Kumar, K.K.; Cavalcanti, I.F.A.; Goswami, P.; Zhou, T. Monsoons in a changing world: A regional perspective in a global context. J. Geophys. Res. Atmos. 2013, 118, 3053–3065. [Google Scholar] [CrossRef]
  39. Endo, H.; Kitoh, A. Thermodynamic and dynamic effects on regional monsoon rainfall changes in a warmer climate. Geophys. Res. Lett. 2014, 41, 1704–1711. [Google Scholar] [CrossRef]
  40. Sampe, T.; Xie, S.-P. Large-scale dynamics of the Meiyu-Baiu rainband: Environmental forcing by the westerly jet. J. Clim. 2010, 23, 113–134. [Google Scholar] [CrossRef]
  41. Chowdary, J.S.; Hu, K.; Srinivas, G.; Kosaka, Y.; Wang, L.; Rao, K.K. The Eurasian Jet Streams as Conduits for East Asian Monsoon Variability. Curr. Clim. Chang. Rep. 2019, 5, 233–244. [Google Scholar] [CrossRef]
  42. Yamazaki, N.; Chen, T.C. Analysis of the East Asian monsoon during early summer of 1979: Structure of the Baiu front and itsrelationship to large-scale fields. J. Meteorol. Soc. Jpn. 1993, 71, 339–355. [Google Scholar] [CrossRef]
  43. Rogelj, J.; Luderer, G.; Pietzcker, R.C.; Kriegler, E.; Schaeffer, M.; Krey, V.; Riahi, K. Energy system transformations for limiting end-of-century warming to below 1.5 °C. Nat. Clim. Change 2015, 5, 519–527. [Google Scholar] [CrossRef]
  44. O’Neill, B.C.; Tebaldi, C.; van Vuuren, D.P.; Eyring, V.; Friedlingstein, P.; Hurtt, G.; Knutti, R.; Kriegler, E.; Lamarque, J.-F.; Lowe, J.; et al. The Scenario Model Intercomparison Project (ScenarioMIP) for CMIP6. Geosci. Model Dev. 2016, 9, 3461–3482. [Google Scholar] [CrossRef]
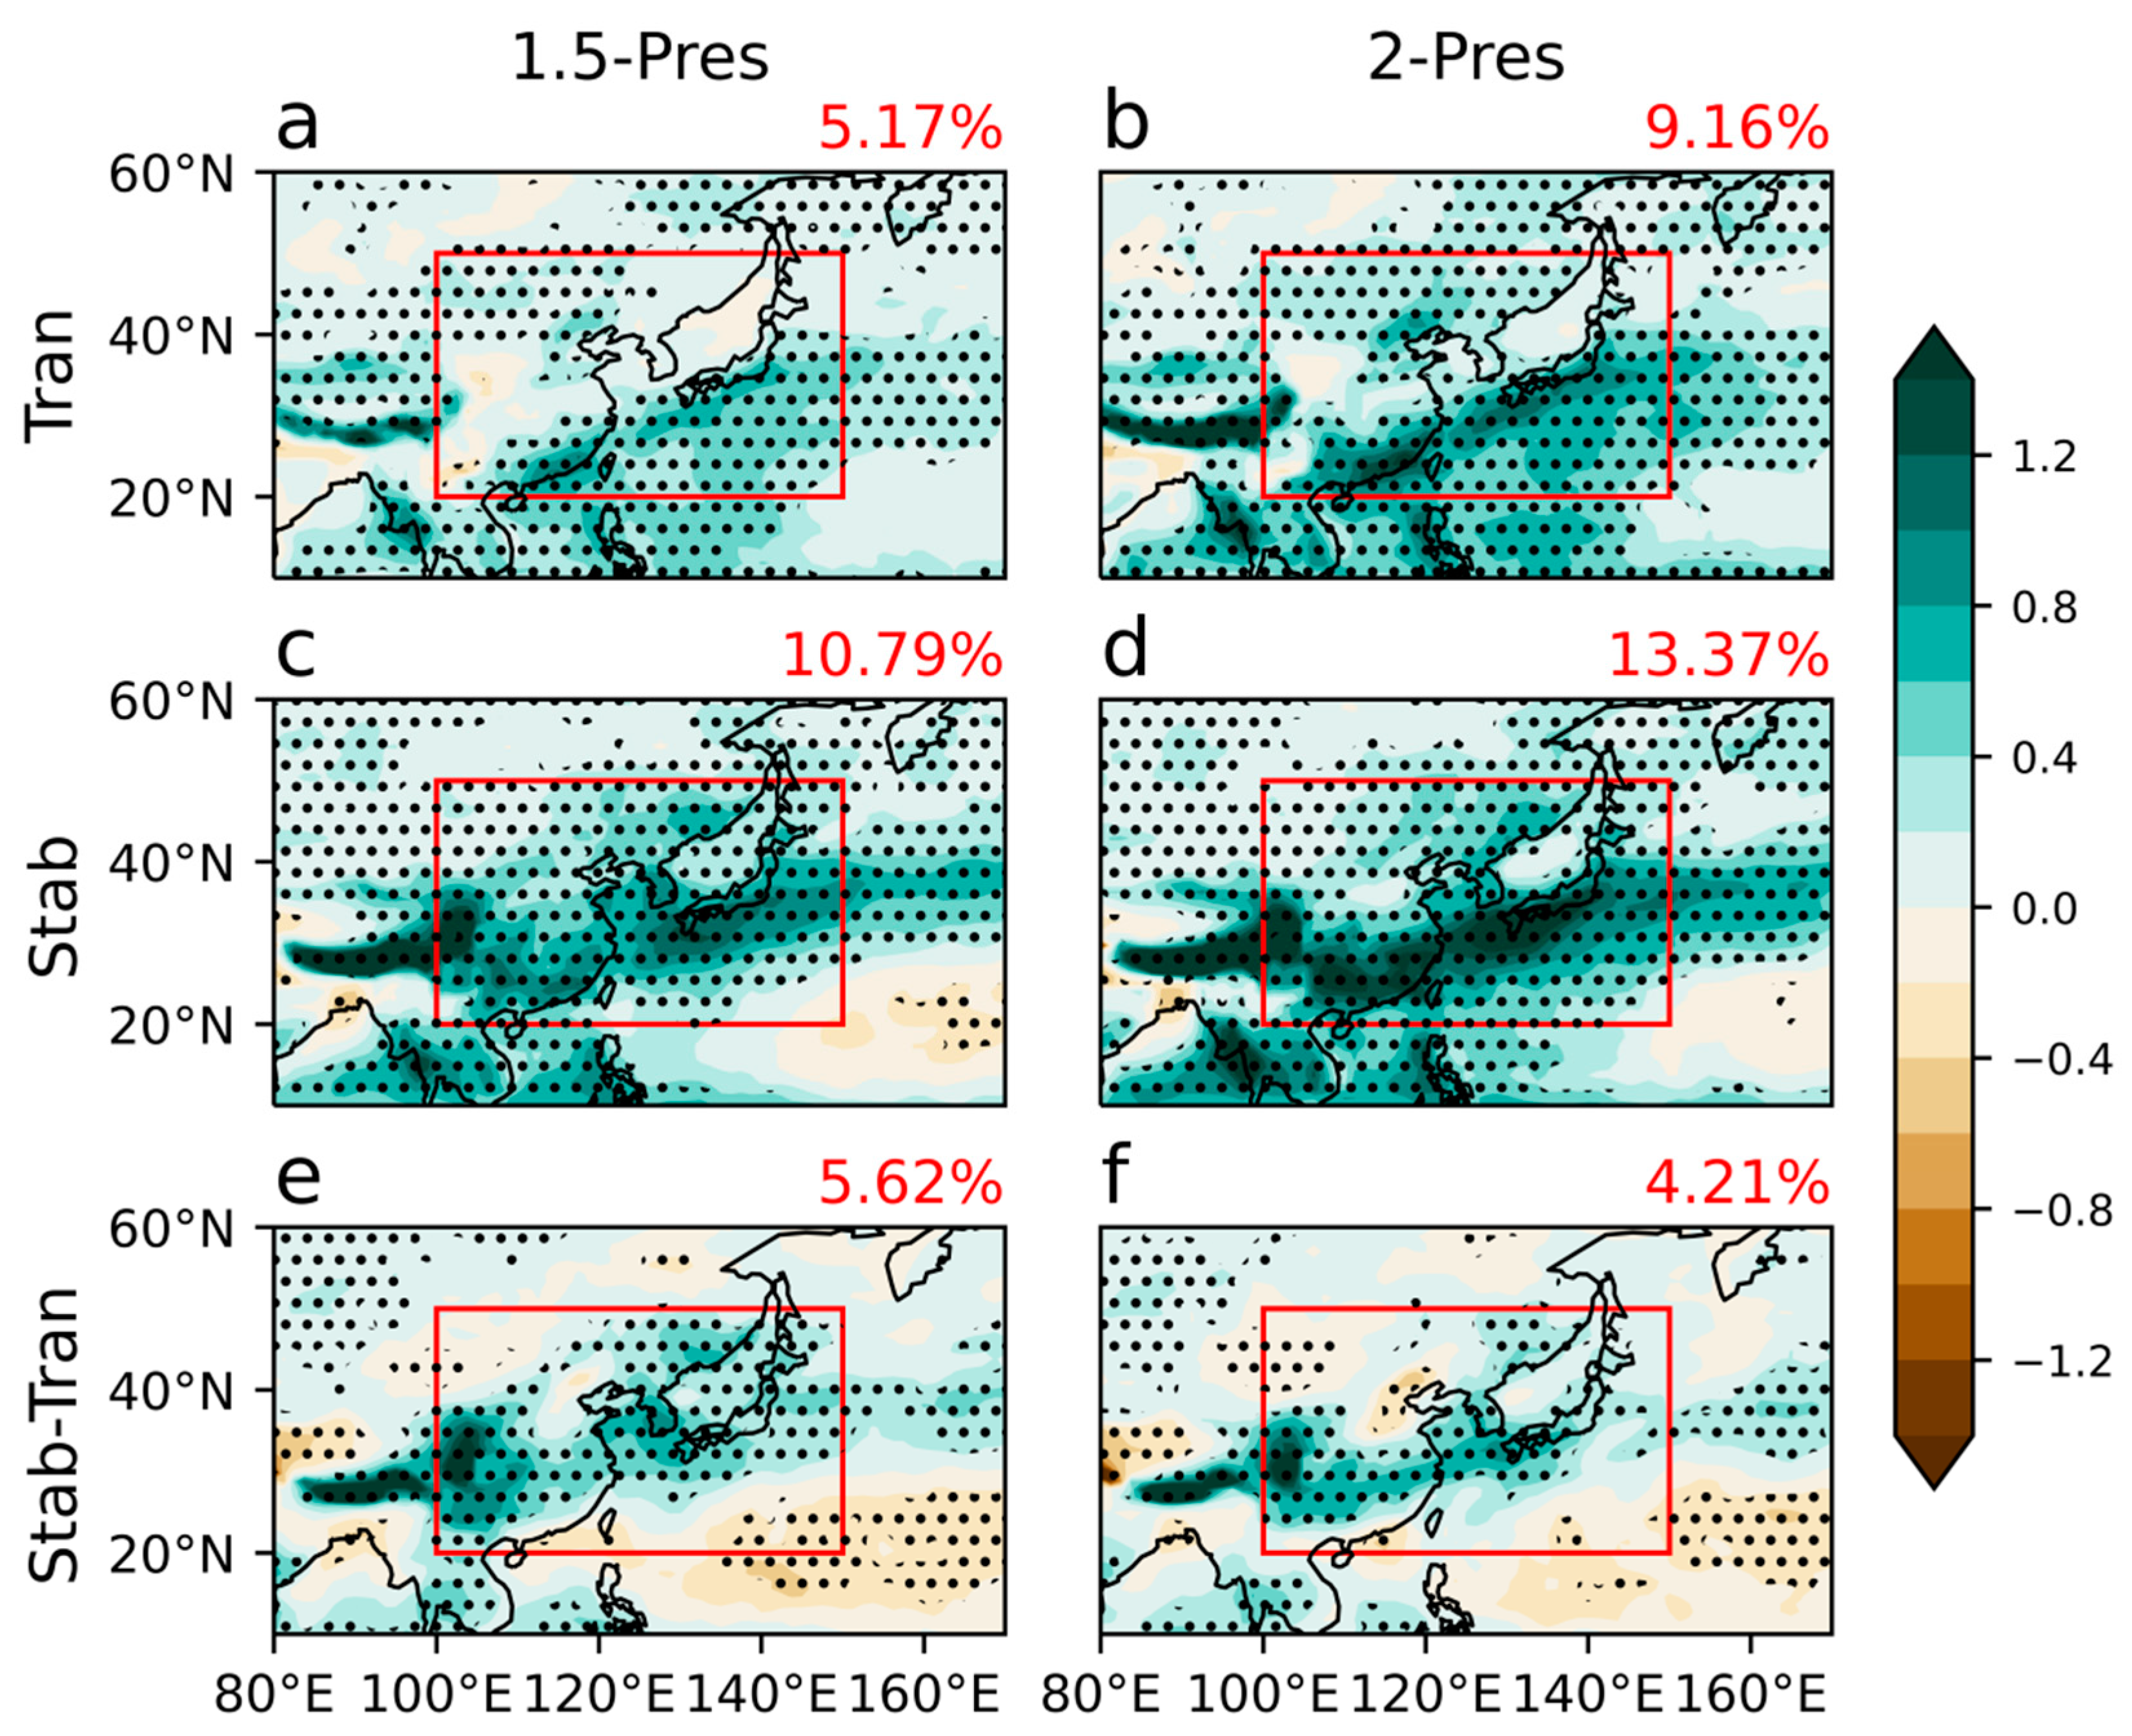
Figure 1. The responses of EASM precipitation (mm/day; shading) at 1.5 °C (a,c) and 2 °C (b,d) and their differences (e,f) (i.e., the stabilization minus transient responses). The EASM region (100–150° E; 20–50° N) is outlined by red rectangles. The red number in the upper-right corner of each panel indicates mean precipitation changes in the EASM region. The stippling denotes significance above the 95% confidence level, determined by the two-tailed Student t-test.
Atmosphere 14 01763 g001
Figure 2. The responses of summer (JJA) mean moisture budget terms (mm/mon) in the EASM region (100–150° E; 20–50° N) at 1.5 °C (a,c) and 2 °C (b,d), in transient (a,b), and stabilization (c,d) responses. TH’, DY’, NL’, and TE’ denote thermodynamic, dynamic, nonlinear, and transient eddy terms, respectively. For terms in detail, please see Section 2.2.(2).
Atmosphere 14 01763 g002
Figure 3. The spatial patterns of changes in summer (JJA) mean moisture budget terms (mm/mon) in the EASM region (100–150° E; 20–50° N) at transient 1.5 °C (a,e,i,m), transient 2 °C (b,f,j,n), stabilized 1.5 °C (c,g,k,o), and stabilized 2 °C (d,h,l,p). TH’ (ad), DY’ (eh), NL’ (il), and TE’ (mp) denote changes in the thermodynamic, dynamic, nonlinear, and transient eddy term contributions, respectively.
Atmosphere 14 01763 g003
Figure 4. The meridional sections of summer (JJA) mean zonal wind change (shading; m/s) and the meridional and vertical wind change (arrow; m/s and −10−2 Pa/s, respectively) averaged over 115 °E–120 ° E in transient (a,b) and stabilization (c,d) simulations and their differences (e,f) at 1.5  °C (a,c,e) and 2  °C (b,d,f). Contours denote the climatological-mean zonal wind speed (m/s) averaged over 1976–2005. The arrow in the legend denotes 0.5 m/s and 0.5 × (−10−2 Pa/s) in the meridional and vertical direction, respectively.
Atmosphere 14 01763 g004
Figure 5. The responses of standard deviation of the high-frequency (cutoff period of 8 days) meridional wind (shading; m/s) at 200 hPa in transient (a,b) and stabilization (c,d) simulations and their differences (e,f) at 1.5  °C (a,c,e) and 2  °C (b,d,f). The dark green contours indicate the climatological-mean zonal wind speed (m/s) averaged over 1976–2005. Stippling denotes significance above the 95% confidence level, determined by the two-tailed Student t-test.
Atmosphere 14 01763 g005
Figure 6. The responses of mid- to high-level temperature (shading; °C; 500–200 hPa mean) in transient (a,b) and stabilization (c,d) simulations and their differences (e,f) at 1.5  °C (a,c,e) and 2  °C (b,d,f). The blue contours indicate the climatological-mean zonal wind speed (m/s) of 1976–2005. The EASM region (100–150° E; 20–50° N) is outlined by blue rectangles.
Atmosphere 14 01763 g006
Disclaimer/Publisher’s Note: The statements, opinions and data contained in all publications are solely those of the individual author(s) and contributor(s) and not of MDPI and/or the editor(s). MDPI and/or the editor(s) disclaim responsibility for any injury to people or property resulting from any ideas, methods, instructions or products referred to in the content.