Article

Characteristics of Lightning Activities over the Tibetan Plateau Based on Satellite Detection and Its Circulation Background Analysis

1
Key Laboratory of Radiometric Calibration and Validation for Environmental Satellites, National Satellite Meteorological Center (National Center for Space Weather), China Meteorological Administration, Beijing 100081, China
2
Shanghai Typhoon Institute, China Meteorological Administration, Shanghai 200030, China
3
Innovation Center for FengYun Meteorological Satellite (FYSIC), Beijing 100081, China
4
Jiangxi Meteorological Observatory, Nanchang 330096, China
*
Authors to whom correspondence should be addressed.
Atmosphere 2023, 14(12), 1765; https://doi.org/10.3390/atmos14121765
Submission received: 11 October 2023 / Revised: 21 November 2023 / Accepted: 24 November 2023 / Published: 29 November 2023
(This article belongs to the Section Meteorology)

Abstract

:
Based on the detection data obtained by the LMI (Lightning Mapping Imager)—China’s first satellite-based lightning observation payload—from 2018–2022, combined with the ERA5 (ECMWF Reanalysis v5) reanalysis data of the same period, the temporal and spatial characteristics of lightning activities over the Tibetan Plateau and its response to the atmospheric circulation background are studied in detail in this paper. Based on the LMI data, we obtained consistent and continuous long-time-series lightning observation data for the whole region of the plateau for the first time, and the results show that the lightning density in the Tibetan Plateau is much smaller than that in the central and eastern land regions of China (CELR) at the same latitude. Lightning activity was unevenly distributed over the plateau and had obvious seasonal variation characteristics. The monthly amount of lightning and its ratio in the total amount of lightning for the whole year show the characteristics of “increasing first and then decreasing”. Most lightning occurs in June and July, which is about a month earlier than that in the CELR. The amount of lightning fluctuated in May and decreased rapidly after August, which is consistent with the local convective thunderstorm season. The hourly lightning frequency at different altitudes over the Tibetan Plateau is consistent with local convections and unique topography, and it is closely related to the features of the local night rain. The results also reveal comparative features between lightning and the atmospheric circulation background on the plateau, such as the wind field, CAPE (convective available potential energy), temperature, and humidity at 500 hPa. In the context of global warming, the average temperature in the central and western regions of the plateau increased in the past five years. This shows that the Tibetan Plateau, as a summer heat source, has a gradual warming trend, and the corresponding convections and lightning activities are also increasing gradually. Lightning activities can be used as an indicator of DCSs (deep convective systems). This paper gives a more comprehensive understanding of the characteristics of lightning activities all over the Tibetan Plateau, especially in the western part of the plateau, which lacked ground-based lightning observation data before. In addition, it reveals the comparative features between the lightning activities and the circulation background over the plateau in the past five years, which is helpful for further understanding the contribution of lightning activities to the plateau’s climate change. It can provide some reference for monitoring and researching the severe convective weather over the Tibetan Plateau.

1. Introduction

The interaction between the Asian summer monsoon and the complex topography of the Tibetan Plateau makes the convective process and lightning activities extremely active and presents unique regional characteristics, which have a far-reaching significance for the water cycle and climate change in China and even across the world.
Because of its unique topography, the Tibetan Plateau has unique weather and climate characteristics. For the weather, convections over the Tibetan Plateau take on a major responsibility in material and energy exchange between the stratosphere and troposphere, impacting the weather over the plateau, China, and even East Asia. Under the joint action of dynamic circulation and heat exchange, active cumulus clouds and thunderstorms are more likely to occur, which makes the Tibetan Plateau have more convection and frequent precipitation in the summer [1]. For the climate, the Tibetan Plateau stands in the middle of the troposphere, and the diversion, guidance, and obstruction of the free atmosphere over the plateau have changed the direction and velocity of the air flow, making the plateau show unique climate change characteristics and have a far-reaching impact on the downstream plain area. In recent years, the Tibetan Plateau, as the highest region in the world, has been significantly affected by global warming. Studies show that in the past 60 years [2], the Tibetan Plateau has almost been the fastest warming region in China. While the temperature is rising, the precipitation is also increasing, which makes the Tibetan Plateau one of the “wettest” regions in China. In the long term, the Tibetan Plateau will get warmer and wetter, raising the risk of unpredictable extreme weather. Many studies have shown that in the past 40 years [3], the frequency of extreme weather, such as high temperatures, heavy precipitation, and strong thunderstorms, has increased significantly in most areas of the Tibetan Plateau, and derived disasters, such as debris flows, landslides, collapses, and glacial lake outbursts, have intensified. Convective activities over the Tibetan Plateau play an important role in the exchange of energy and material between the troposphere and the stratosphere. Lightning is regarded as a key indicator of deep convective systems (DCSs) [4], which have been the focus of study for the distribution and evolution of convective activities over the Tibetan Plateau.
In most parts of the Tibetan Plateau, especially in its western region, high altitude, sparse population, complex terrain conditions, bad weather conditions, and a limited continuous power supply are not conducive to the deployment of ground-based lightning observation networks [5]. Due to these factors, there are some blind spots in ground-based lightning observations, and observation data are relatively scarce [6,7,8]. For a long time, research on local lightning and convection processes was also insufficient. These analyses were mainly based on observations of cloud-to-ground (CG) data [9] or using a fast antenna lightning mapping array (FALMA) instrument [10]. Due to the limitations of observation conditions, the previous research on lightning activities over the Tibetan Plateau mainly relied on ground-based lightning observation equipment, such as the WWLLN (World Wide Lightning Location Network), the CGLLS (Cloud-to-Ground Lightning Location System), and the low-orbit satellite-based LIS (Lightning Imaging Sensor) boarded on the TRMM (Tropical Rainfall Measuring Mission) [11,12]. The detection efficiency and location accuracy of these instruments are relatively low. Due to the uneven layout of ground-based lightning observation stations and the restriction of low-orbit lightning observations, it is difficult to reflect all the features of lightning activities over the Tibetan Plateau using the above two methods. The LMI (Lightning Mapping Imager) data were acquired by China’s first high-orbit satellite (FY-4A), launched in late 2016 [13], which provide top-down, unified, and continuous observations of all lightning events occurring within the field of view in China and surrounding areas [14]. It provides more comprehensive observation data for the research on the characteristics of lightning activities over the Tibetan Plateau and its correlation with the circulation background. The LMI (Lightning Mapper Imager), boarded on the FY-4A satellite, was successful. LMI-based lightning is one of the intuitive characteristics of convective activities and is, therefore, often used to monitor convective activities. Before the FY-4A satellite was launched and put into operational applications, the lightning observation results from US satellites were often used for analysis. Based on the observation data before 2002, in the highland area, the diurnal variation of the lightning activity shows a prominent peak from 1500 to 1700 LT for most of the plateau, with earlier activity on the eastern and southern plateau and a delay on the western, northern, and central plateau. Few lightning flashes are observed between 0000 and 1000 LT [15]. Other research shows the diurnal variation of the maximum flash rate peaked during 14:00~16:00 LT, with the exceptions of the prominent high mountain region, which peaked earlier, and prominent low basins, which peaked later [16]. The peak lightning activity appears at about 17:00. The sensitivity of lightning activity to the CAPE changes on the plateau is up to 30 times more sensitive than other prominent low-altitude regions [17]. But some research indicates that the maximum flash density is in July, and there is more lightning in the spring than one may expect [18]. After the FY-4A satellite was launched and put into use, more studies on the convective activities in the Tibetan Plateau region could be carried out based on the satellite’s LMI data. Compared to the lightning event data over the Tibetan Plateau from the FY-4A/LMI with the International Space Station’s (ISS) LIS, the mean radiance of lightning events over the Tibetan Plateau, measured by the FY-4A/LMI, was only 1/5 of that measured by the ISS LIS, and the mean coincidence ratio (CR) of lightning events is as low as 3.66% [19]. High-density lightning is located near Naqu and northeastern Qinghai, where the flash densities can be above 5 fl⸱km−2 yr−1. About 95% of the flashes occur during May to September, with a peak in July in most regions of the plateau [5]. Most of these studies are based on data from short periods, and no research results have been seen with LMI data more than 5 years old. In this context, based on the observation data of China’s first satellite-based lightning observation payload LMI from 2018 to 2022, combined with the ERA5 [20] data during the same period, the temporal and spatial characteristics of lightning activities over the Tibetan Plateau were analyzed comprehensively, and its response to changes in the atmospheric circulation background was investigated in detail.
The work of this paper effectively makes up for the relative lack of ground-based lightning detection data and the low temporal resolution lightning data derived from the polar-orbiting satellite in the western region of the Tibetan Plateau and gives a more comprehensive and statistical understanding of the distribution characteristics and variation of lightning in the Plateau. Additionally, this paper reveals the dynamic comparative analysis features between the plateau’s lightning activities and the atmospheric environmental background in the past five years, which is helpful for further understanding the contribution of lightning activities to the plateau’s climate changes and provides some references for the aid monitoring and research of the severe convective weather in the plateau and the surrounding plains at the same latitude and even the signals for the trend of global climate change.

2. Materials and Methods

In particular, unlike similar international lightning detectors, the LMI does not adopt the full disk observation mode, and its field of view (FOV) is shown in Figure 1. According to its design requirements, the FY-4A/LMI detects the lightning that occurs in the Northern Hemisphere from mid-March to mid-September annually, covering most of the inland and sea areas of China and the neighboring regions (positive). The FY-4A/LMI turns around to observe the Southern Hemisphere during the rest of the year (negative) [21].
An “event” is the basic unit of the LMI’s lightning data, and “group”, “flash”, and other data are formed on the basis of “event” through the clustering algorithm. Among them, “group” represents a K or return process of lightning activity, which has a clear physical meaning and can better reflect the occurrence of lightning [22]. So, in this paper, “group” data observed by the FY-4A/LMI were selected. The LMI data were preprocessed into grid form, and the lightning density was calculated, which reflects the number of lightning groups per square kilometer per year.
The Tibetan Plateau is a famous inland plateau in Asia. It is the world’s highest plateau and China’s largest plateau, and it is known as the “roof of the world” and the “third pole of the world” [15]. It is about 2800 km long from east to west and 300 to 1500 km wide from north to south.
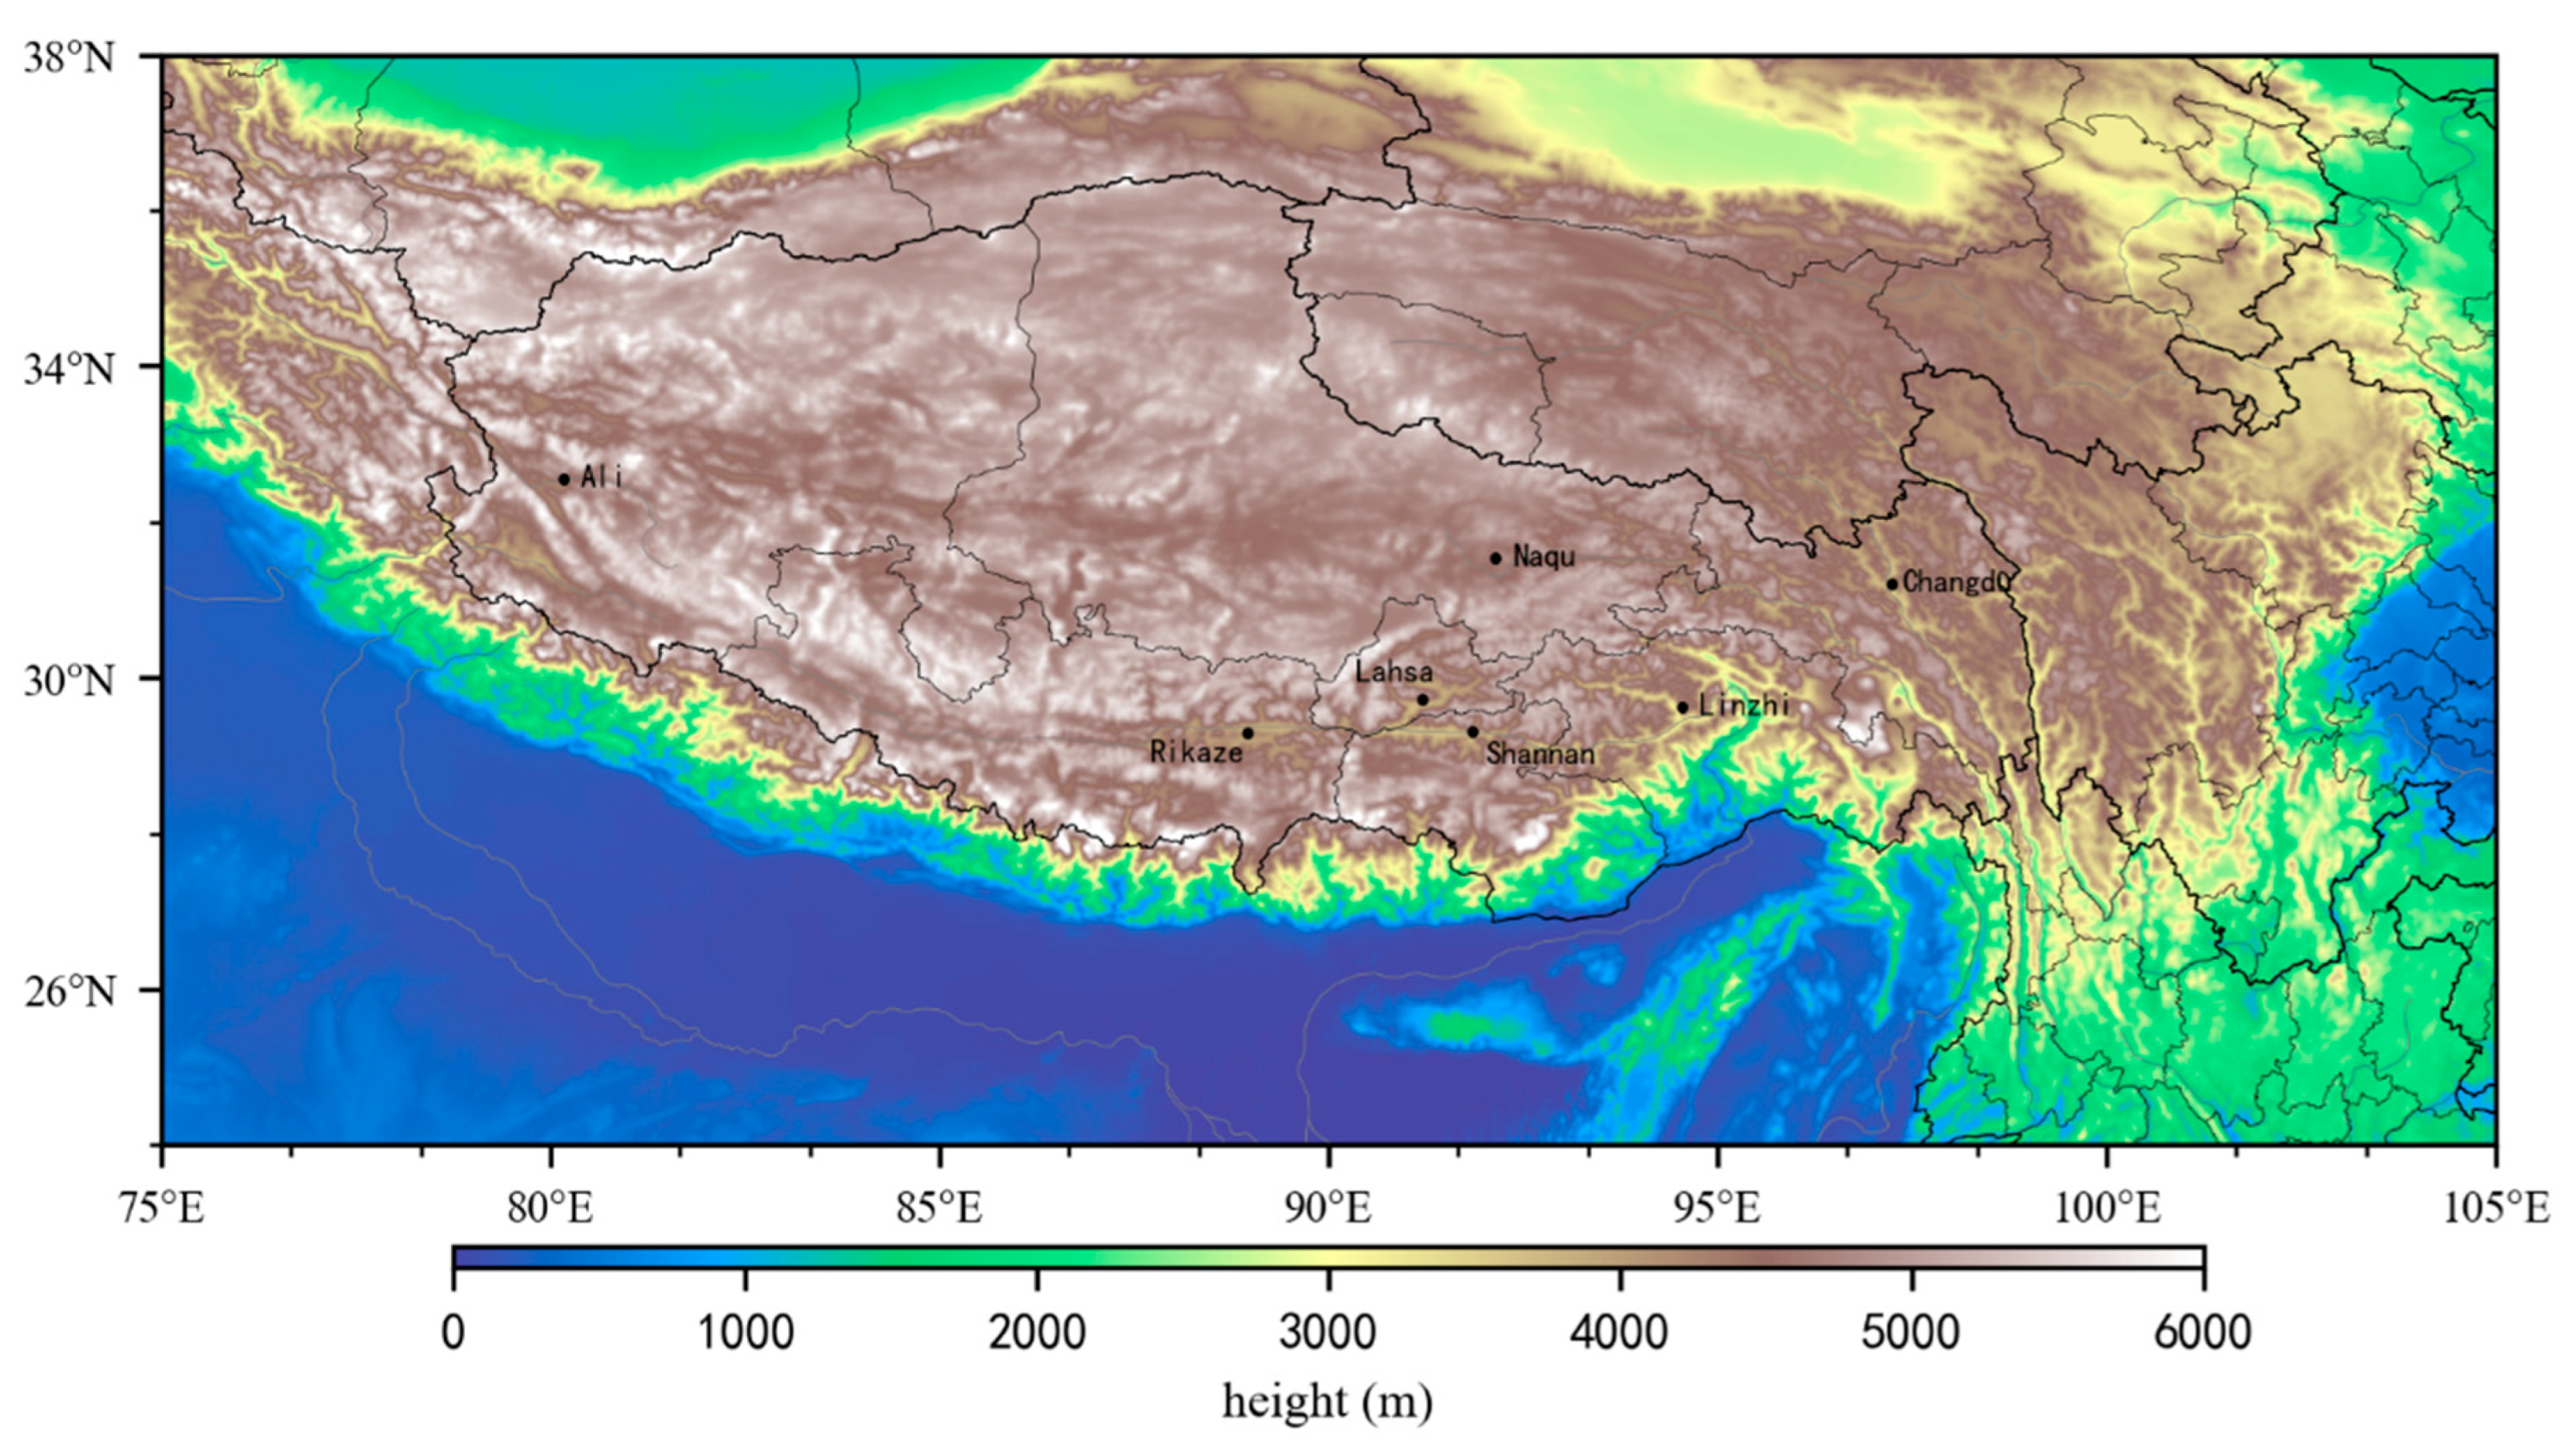
It has a wide range of falls, and the terrain is generally characterized by “high in the west and low in the east” [16,17]. There are many high mountains and large rivers in the plateau, and it has complex topographic and surficial characteristics (Figure 2). In order to study the characteristics of lightning activities in this region, 75~105° E and 24~38° N were selected for analysis in this paper.
To study the effect of the atmospheric circulation background on lightning activities, the wind field, convective available potential energy (CAPE), temperature, and water vapor reanalysis data derived from the ERA5 (European Center) were also selected for analysis [23], of which the spatial and temporal resolutions were 0.25 × 0.25 lat/lon and 1 h, respectively.

3. Results

3.1. Temporal and Spatial Distribution of Lightning Activities over the Tibetan Plateau Based on LMI Data

3.1.1. Spatial Distribution Features of LMI Lightning Groups

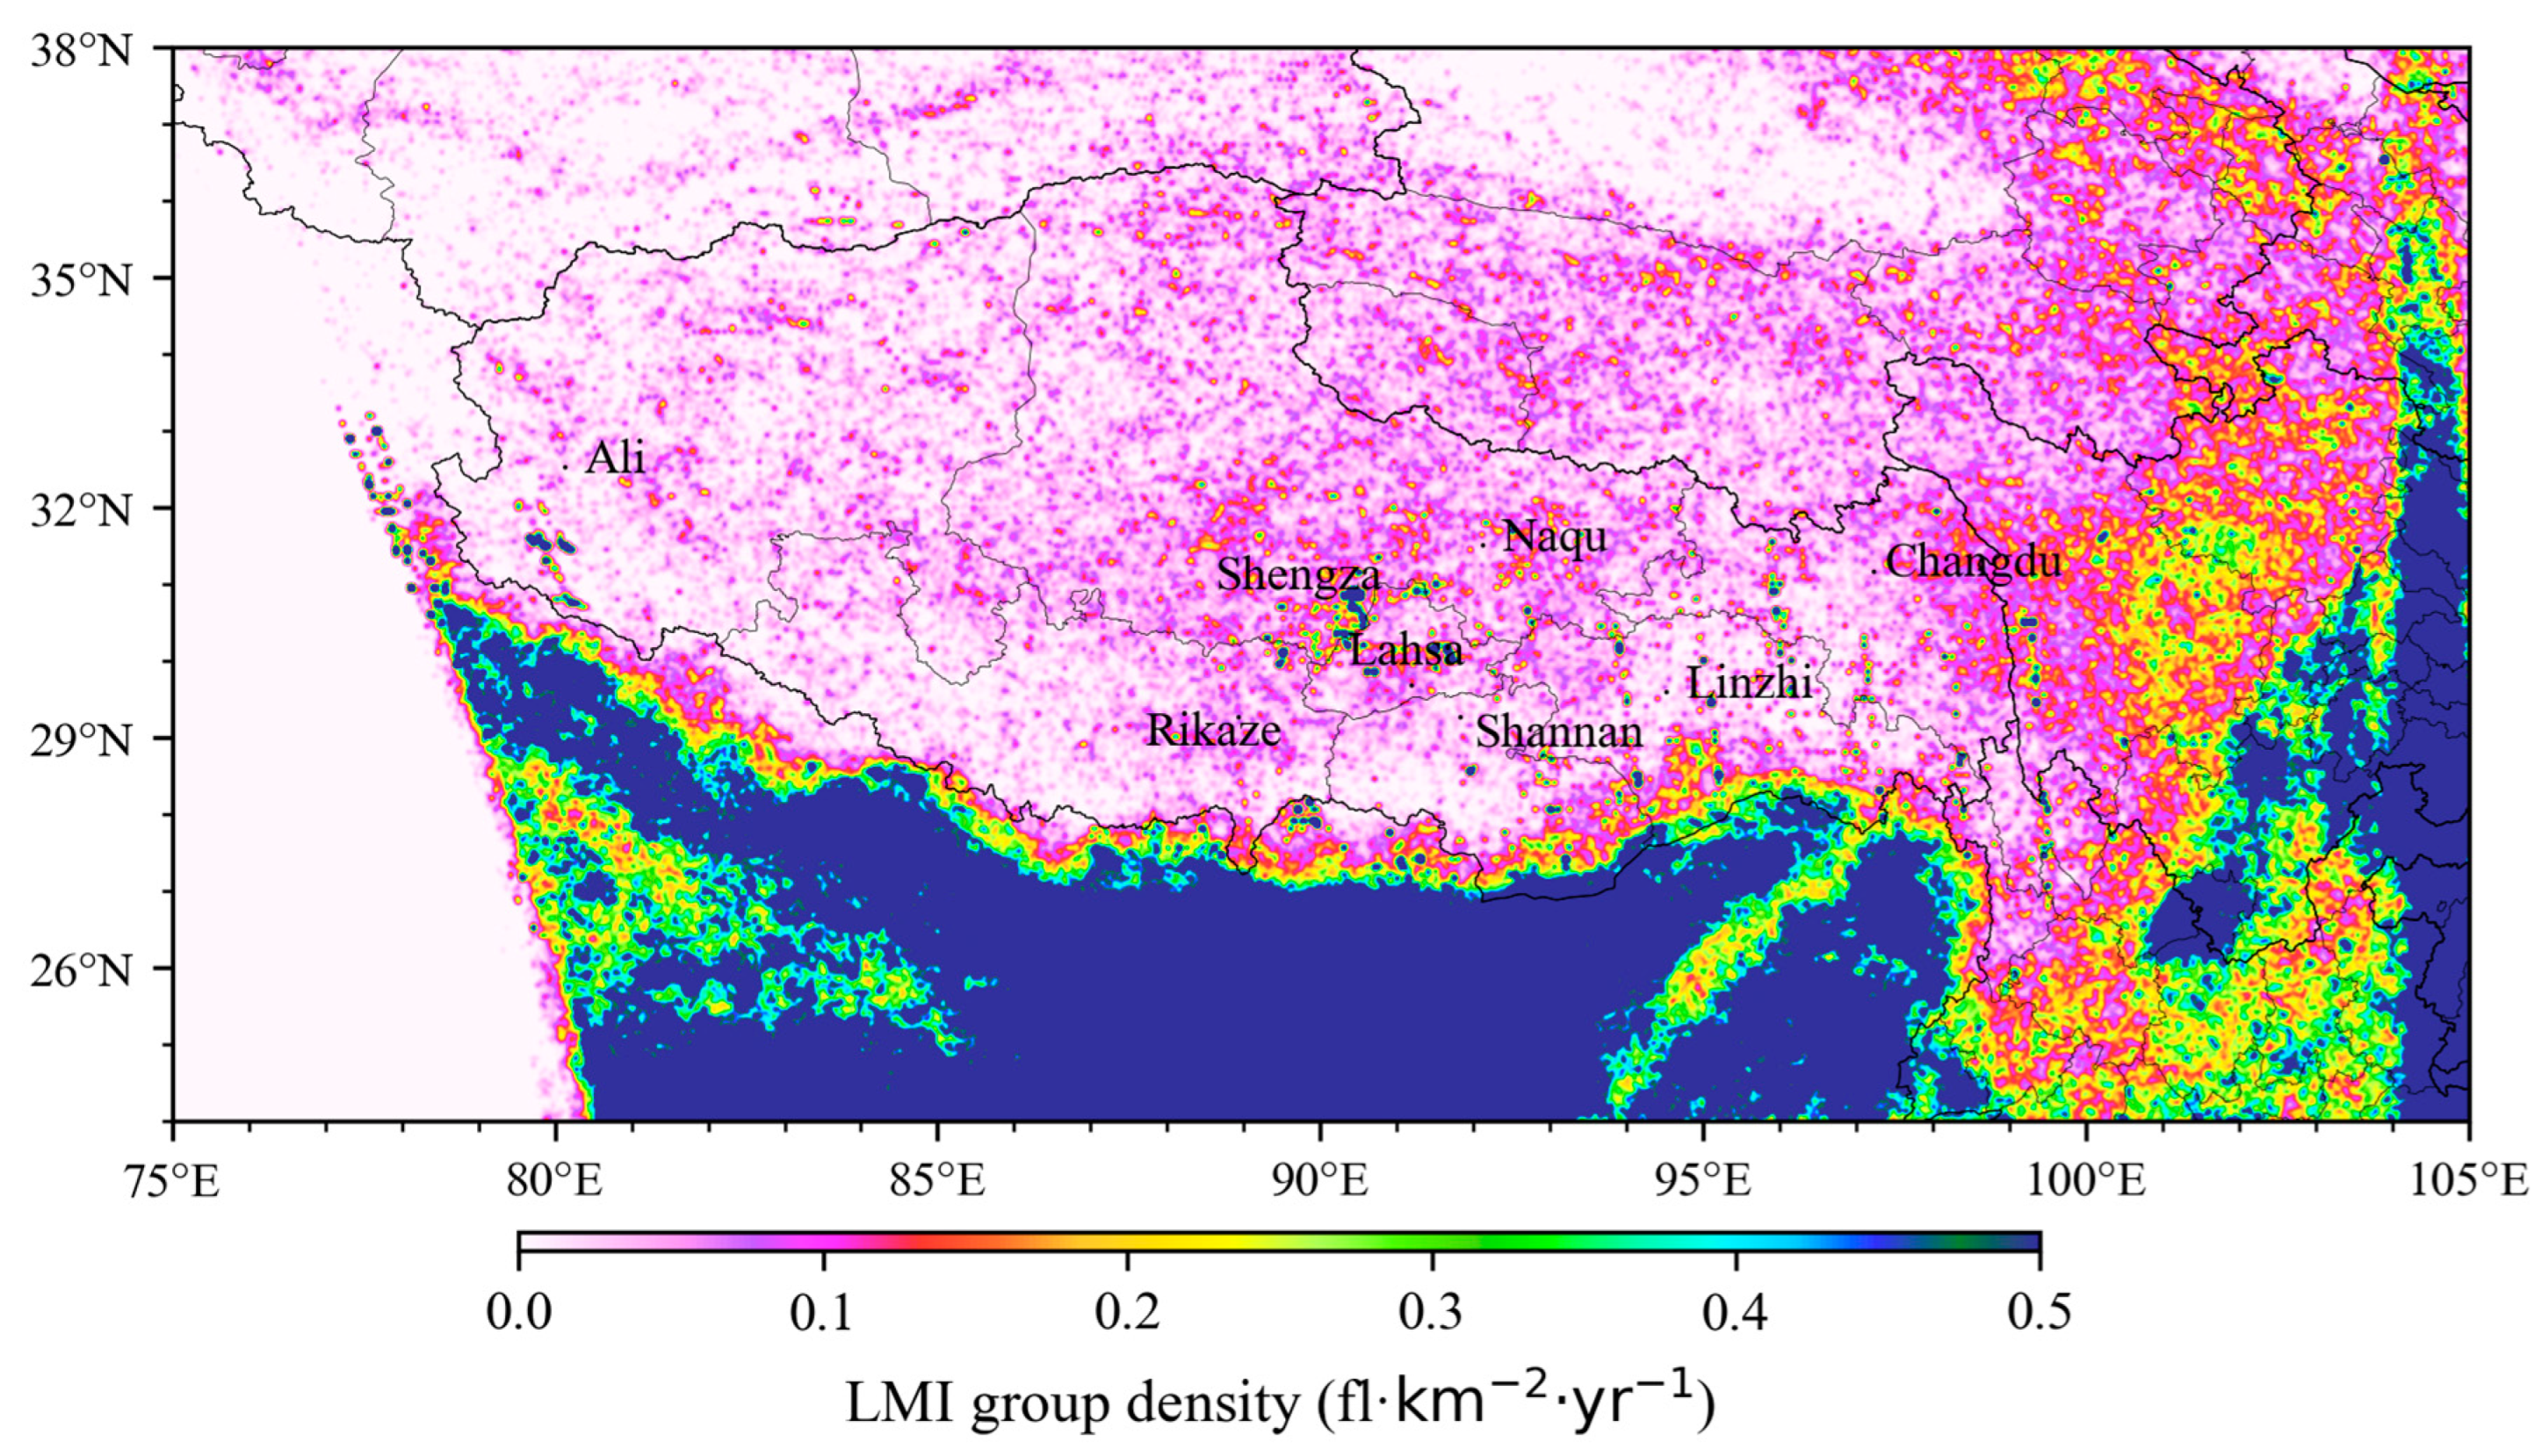
The annual mean lightning density distribution over the Tibetan Plateau and the surrounding areas, based on the LMI’s group grid-cell data during the period of 2018–2022, is shown in Figure 3. This figure demonstrates that the lightning density on the Tibetan Plateau was much smaller than that in central and eastern China. This may be related to the radiation of the lightning in the plateau area, which is relatively small, while the LMI is more inclined to detect lightning with a strong radiation energy. Furthermore, due to the shallow troposphere, convective systems over the Tibetan Plateau have a lower water vapor content and a relatively weaker and unstable energy, which results in less lightning activities. The topographic and land surface thermodynamic features of the Tibetan Plateau are also possible factors.
It was also found that the high lightning density areas in the plateau are from the eastern part of Tibet to the western part of Sichuan, based on satellite observations, and the area with an annual lightning density exceeding 0.15 fl × km−2yr−1 was large. Central Tibet is the second highest-value area, mainly located in Lhasa and its adjacent areas, and the average annual lightning density is higher in some areas, at more than 0.4 fl × km−2yr−1. The average annual lightning density is lower in other areas of the plateau, especially in western Tibet, southern Qinghai, and southwestern Xinjiang, at less than 0.1 fl × km−2yr−1. These areas are usually at higher elevations, have lower temperatures all year round, and are sparsely populated.

3.1.2. Monthly LMI Group Changes and Distribution

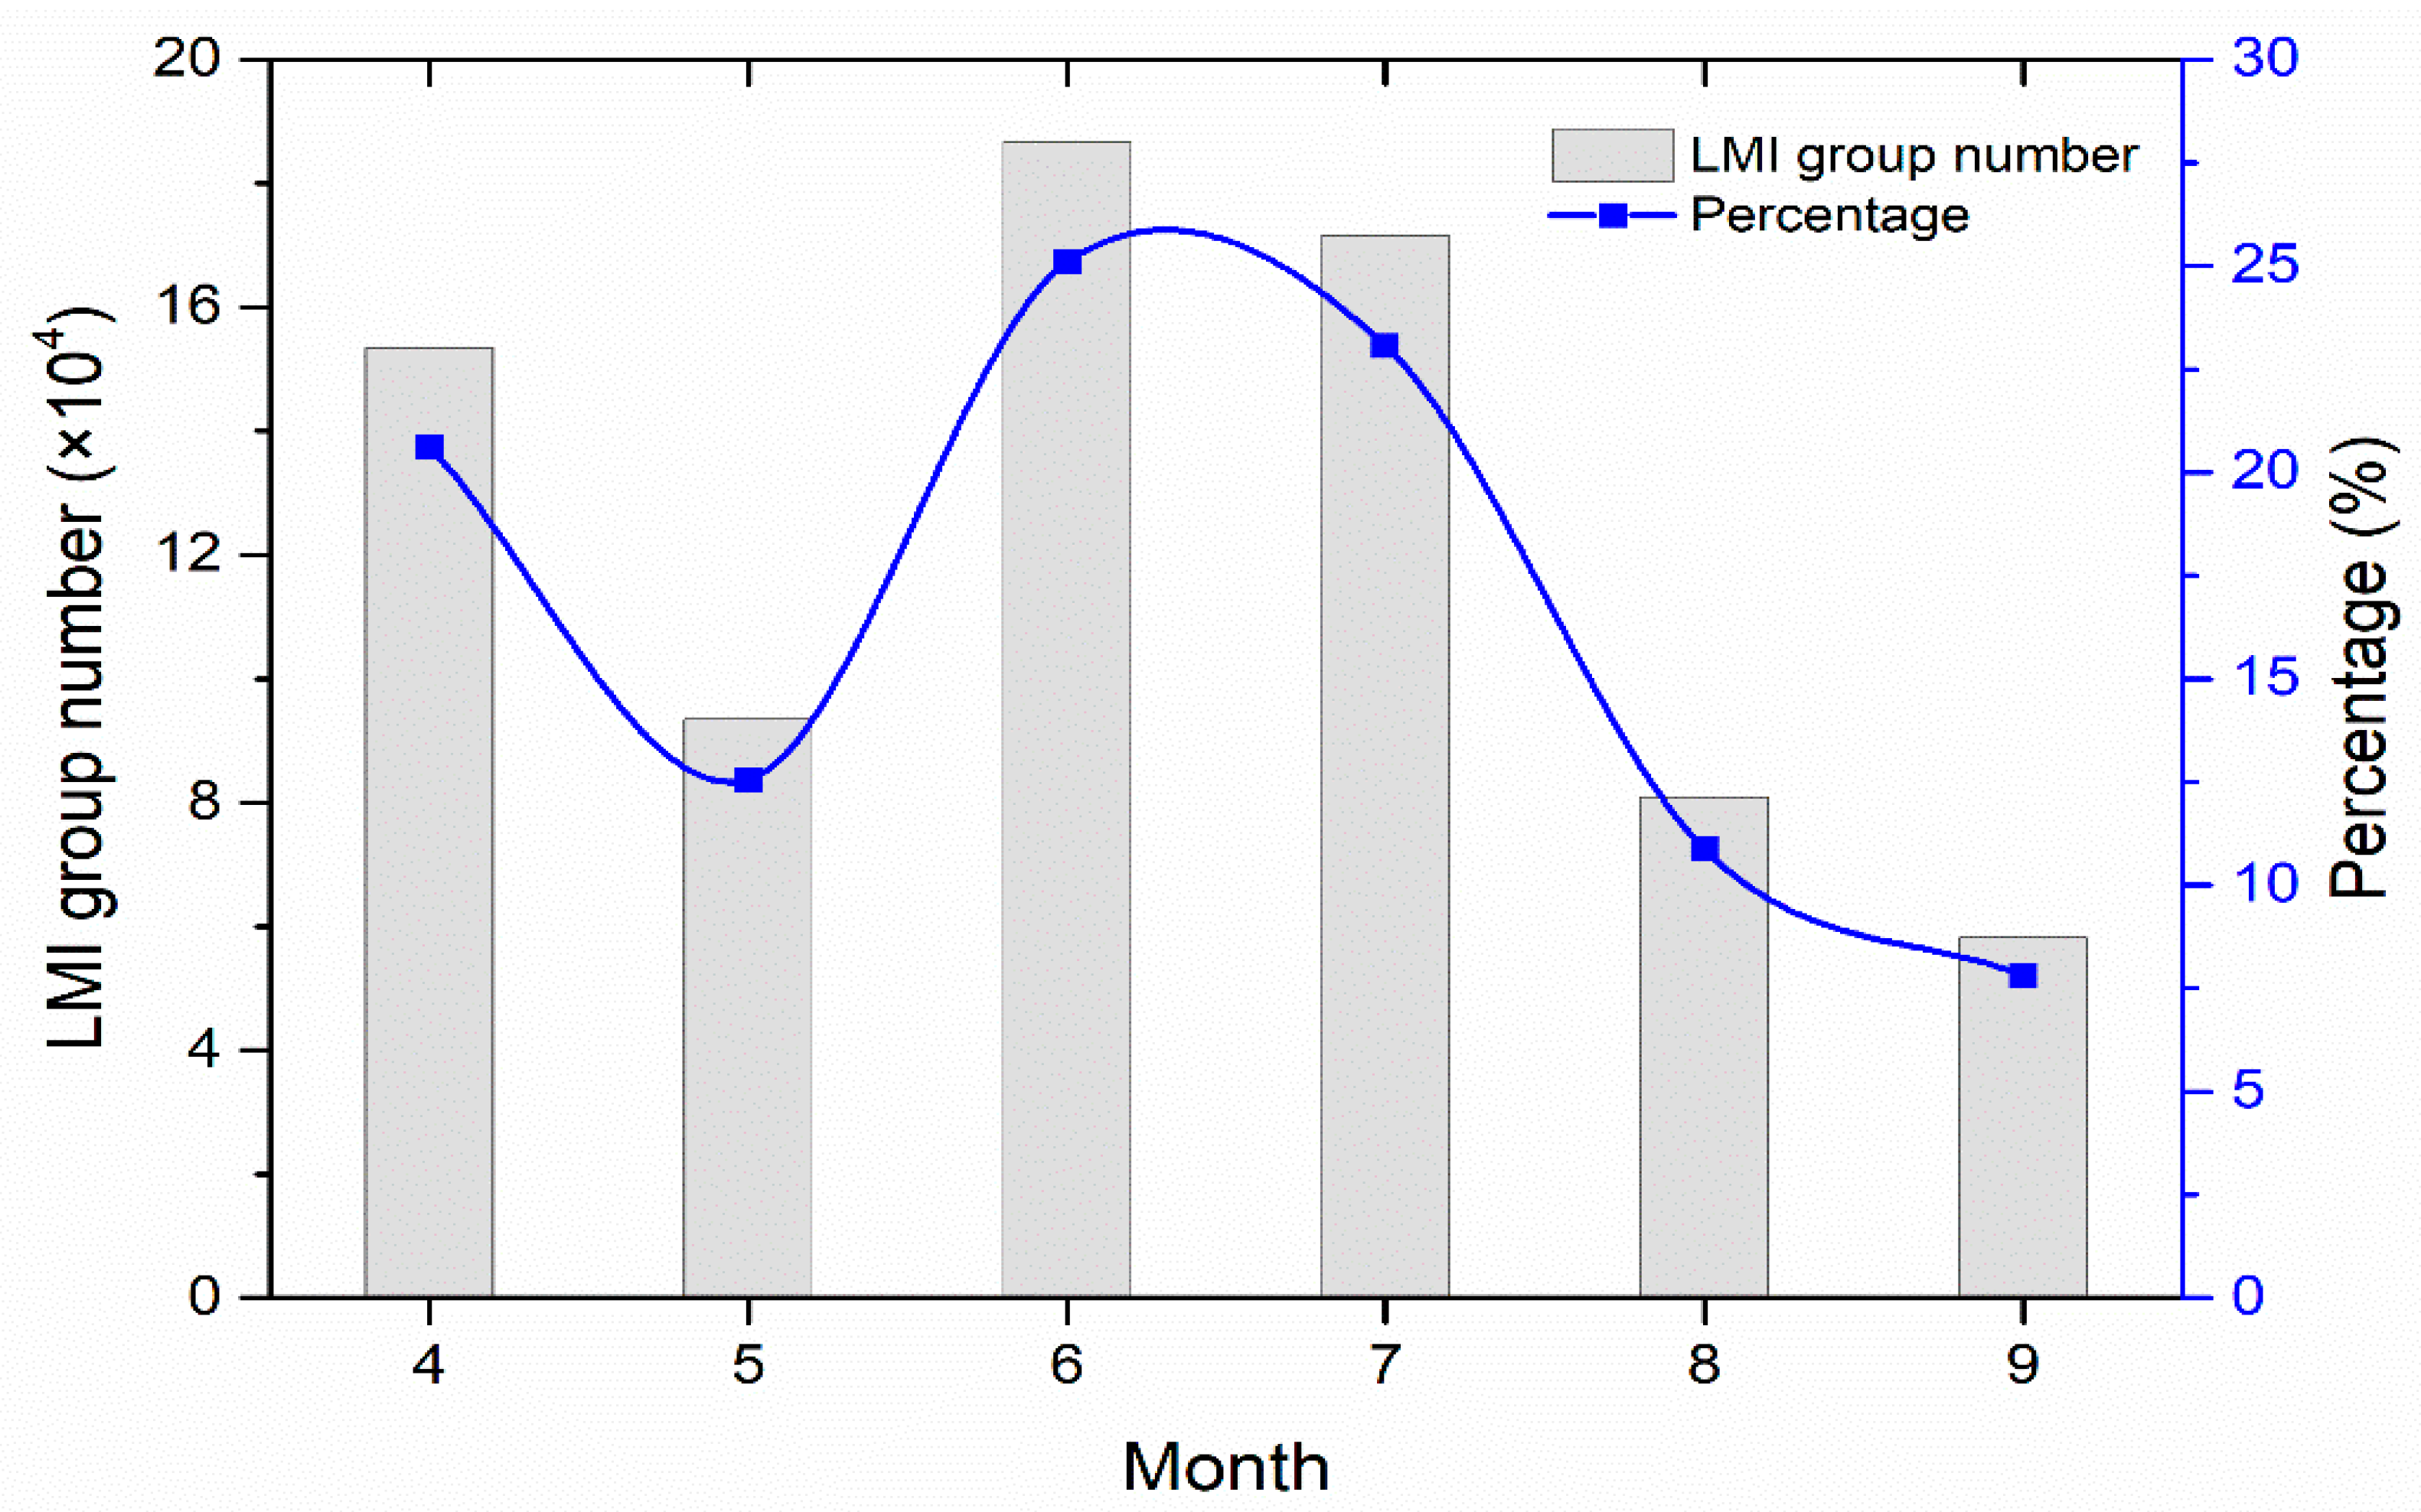
The variation of lightning frequency over the Tibetan Plateau shows obvious seasonal characteristics. The monthly variation of LMI groups over the Tibetan Plateau from April to September (2018–2022) is shown in Figure 4. It can be seen that the monthly variation trend of the LMI groups was first increasing and then decreasing during the study period. June and July are the two months with the highest number of LMI groups, and the two were similar, in which the number of LMI groups was 1.9 × 10⁵. The number of LMI groups fluctuated in May and rapidly decreased after August. The monthly change in the percentage of LMI groups was completely consistent with the change in the LMI group number, among which June accounts for the highest proportion (25.1%), followed by July and August, and September has the smallest proportion, accounting for only 7.8%. This reflects that the thunderstorm season over the plateau is mainly in June and July, and it gradually weakens from August, which is about one month earlier than the CELR. This also indicates that DCSs occur earlier and more frequently over the Tibetan Plateau than the CELR.
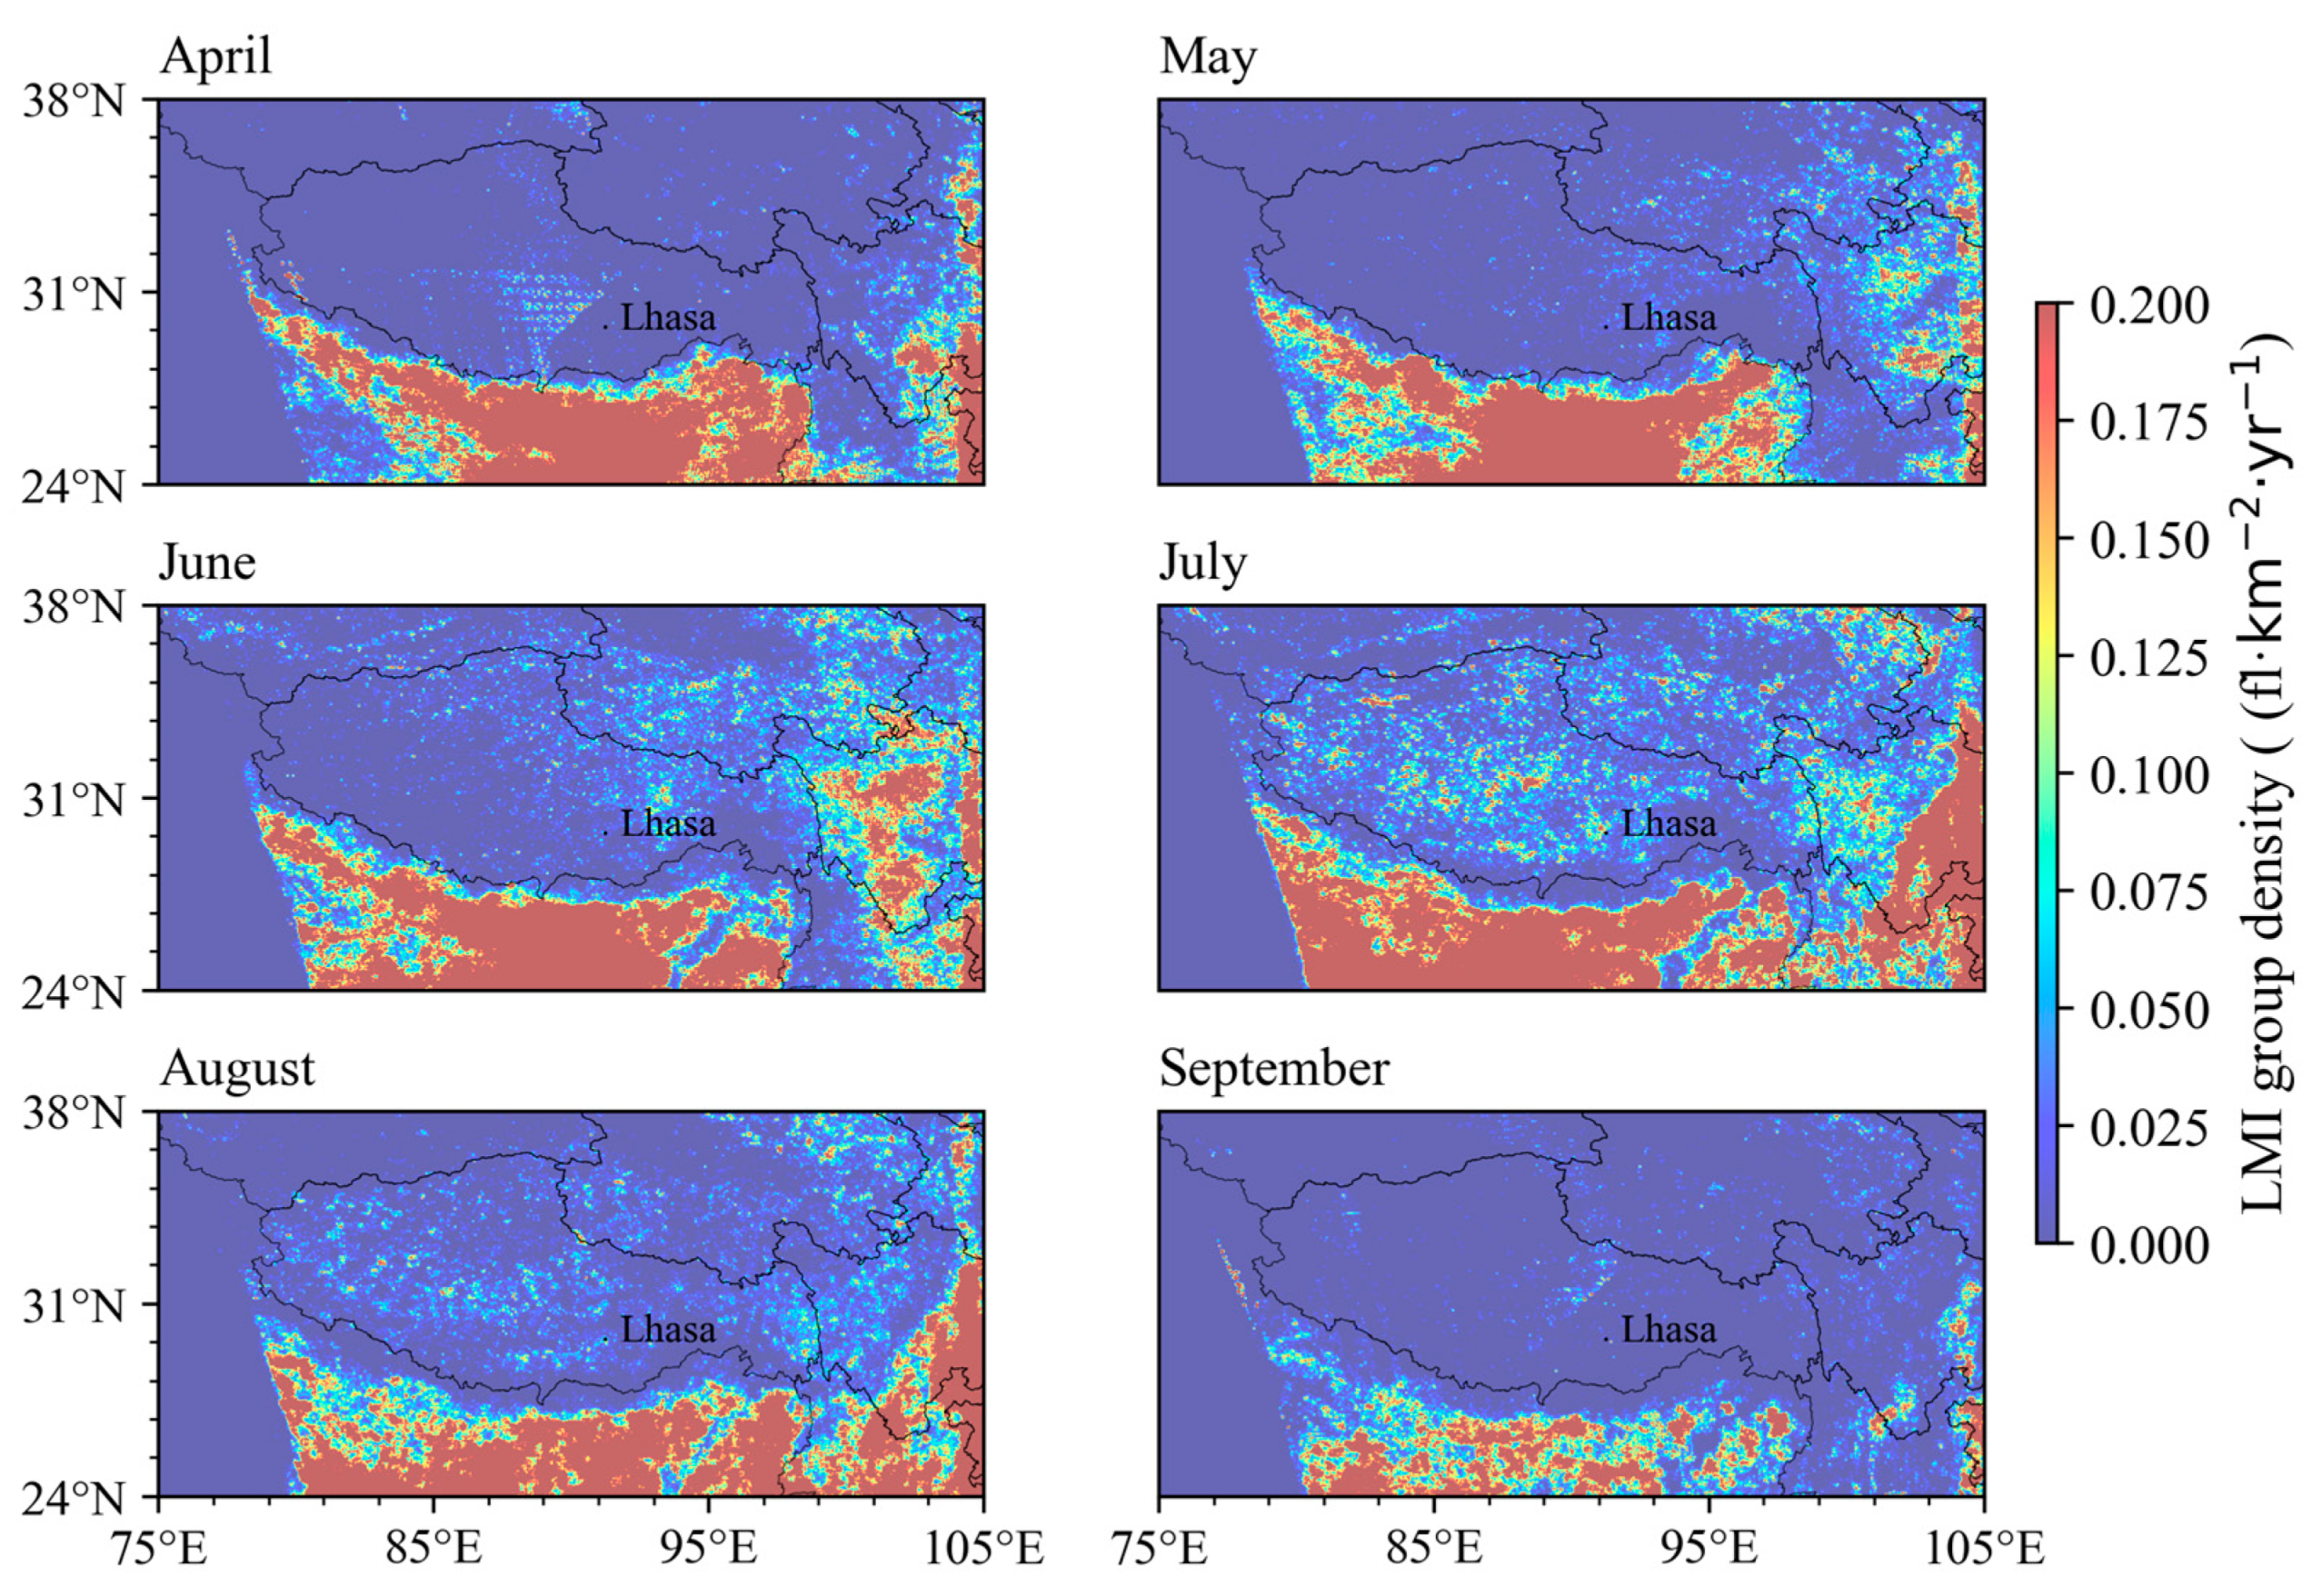
Figure 5 shows the monthly LMI lightning groups’ distribution from 2018 to 2022. It was found that lightning activities on the plateau are most significant from June to August and are weaker from April to May and September. As time goes by, the high-value areas of lightning activity in the plateau spread from the middle east to the west, showing the “propagation” of deep convective systems (DCs) to higher elevations. Most lightning occurs in June and July, which is about a month earlier than that in the CELR, consistent with the local thunderstorm season. Especially in July, the area of the high value of lightning density increased significantly in the western part of the plateau, indicating that this month is the most active period of lightning activity on the plateau, which may be related to more intense sunshine and more local DCs in the high-altitude area of the plateau in the midsummer season. The amount of lightning fluctuated in May and decreased rapidly after August, which is consistent with the local convective thunderstorm season. The lightning activities in the Plateau has an indicative significance to the DCs in the Plateau, even in the central and eastern parts of China.

3.1.3. Hourly LMI Lightning Group Changes

Based on the satellite-based lightning observation data, the difference in the lightning distribution at different altitudes of the Tibetan Plateau was analyzed, which made up the shortage of the missing or inconsistent data caused by the uneven distribution of the ground-based lightning observation network on the plateau, which contributes to a more comprehensive understanding of the lightning distribution features of the plateau.
The hourly lightning frequency at different altitudes over the Tibetan Plateau was also calculated (as shown in Figure 6). Based on the topographic characteristics, we divided the Tibetan Plateau into three research sub-regions according to the following altitudes: 3–4 km, 4–5 km, and more than 5 km. It was found that the most lightning occurred at an altitude of 4–5 km, followed by 3–4 km, with less lightning occurring at altitudes above 5 km. This may be due to the fact that the average altitude of the Tibetan Plateau is above 4 km, an altitude of 3–4 km is less, and for a high-altitude area (above 5 km), the temperature is often low, which is not conducive to the formation and development of deep convection activities, so the amount of lightning is relatively small.
It was also found that the diurnal variation of the plateau’s convective activity is consistent with that of its lightning activity. Because of the unique thermal and dynamic influences on the plateau, the afternoon to the evening is not only a period of concentrated convection, but it is also a period of intense lightning activities. The peak of lightning activities appeared from 15:00 to 16:00 PM (BT, Beijing Time, the same below) and maintained at a high level later. This shows that convective activities last longer in the evening and at night on the plateau. In addition, it is worth noting that, at around 0:00, more intensive lightning activities also occurred, which may be related to the local night rain. The Tibetan Plateau has a long sunshine time and strong solar radiation during the day. At night, the temperature decreases rapidly, and the stability of the cloud becomes worse, which causes the formation of convection [24]. In addition, due to the unique topographic and geomorphological characteristics of the Tibetan Plateau, the valley wind circulation contributes to the development and enhancement of the convergent updraft at night, which promotes the water vapor transport process. These factors lead to the occurrence of more night rain over the Tibetan Plateau, accompanied by increased lightning activities.
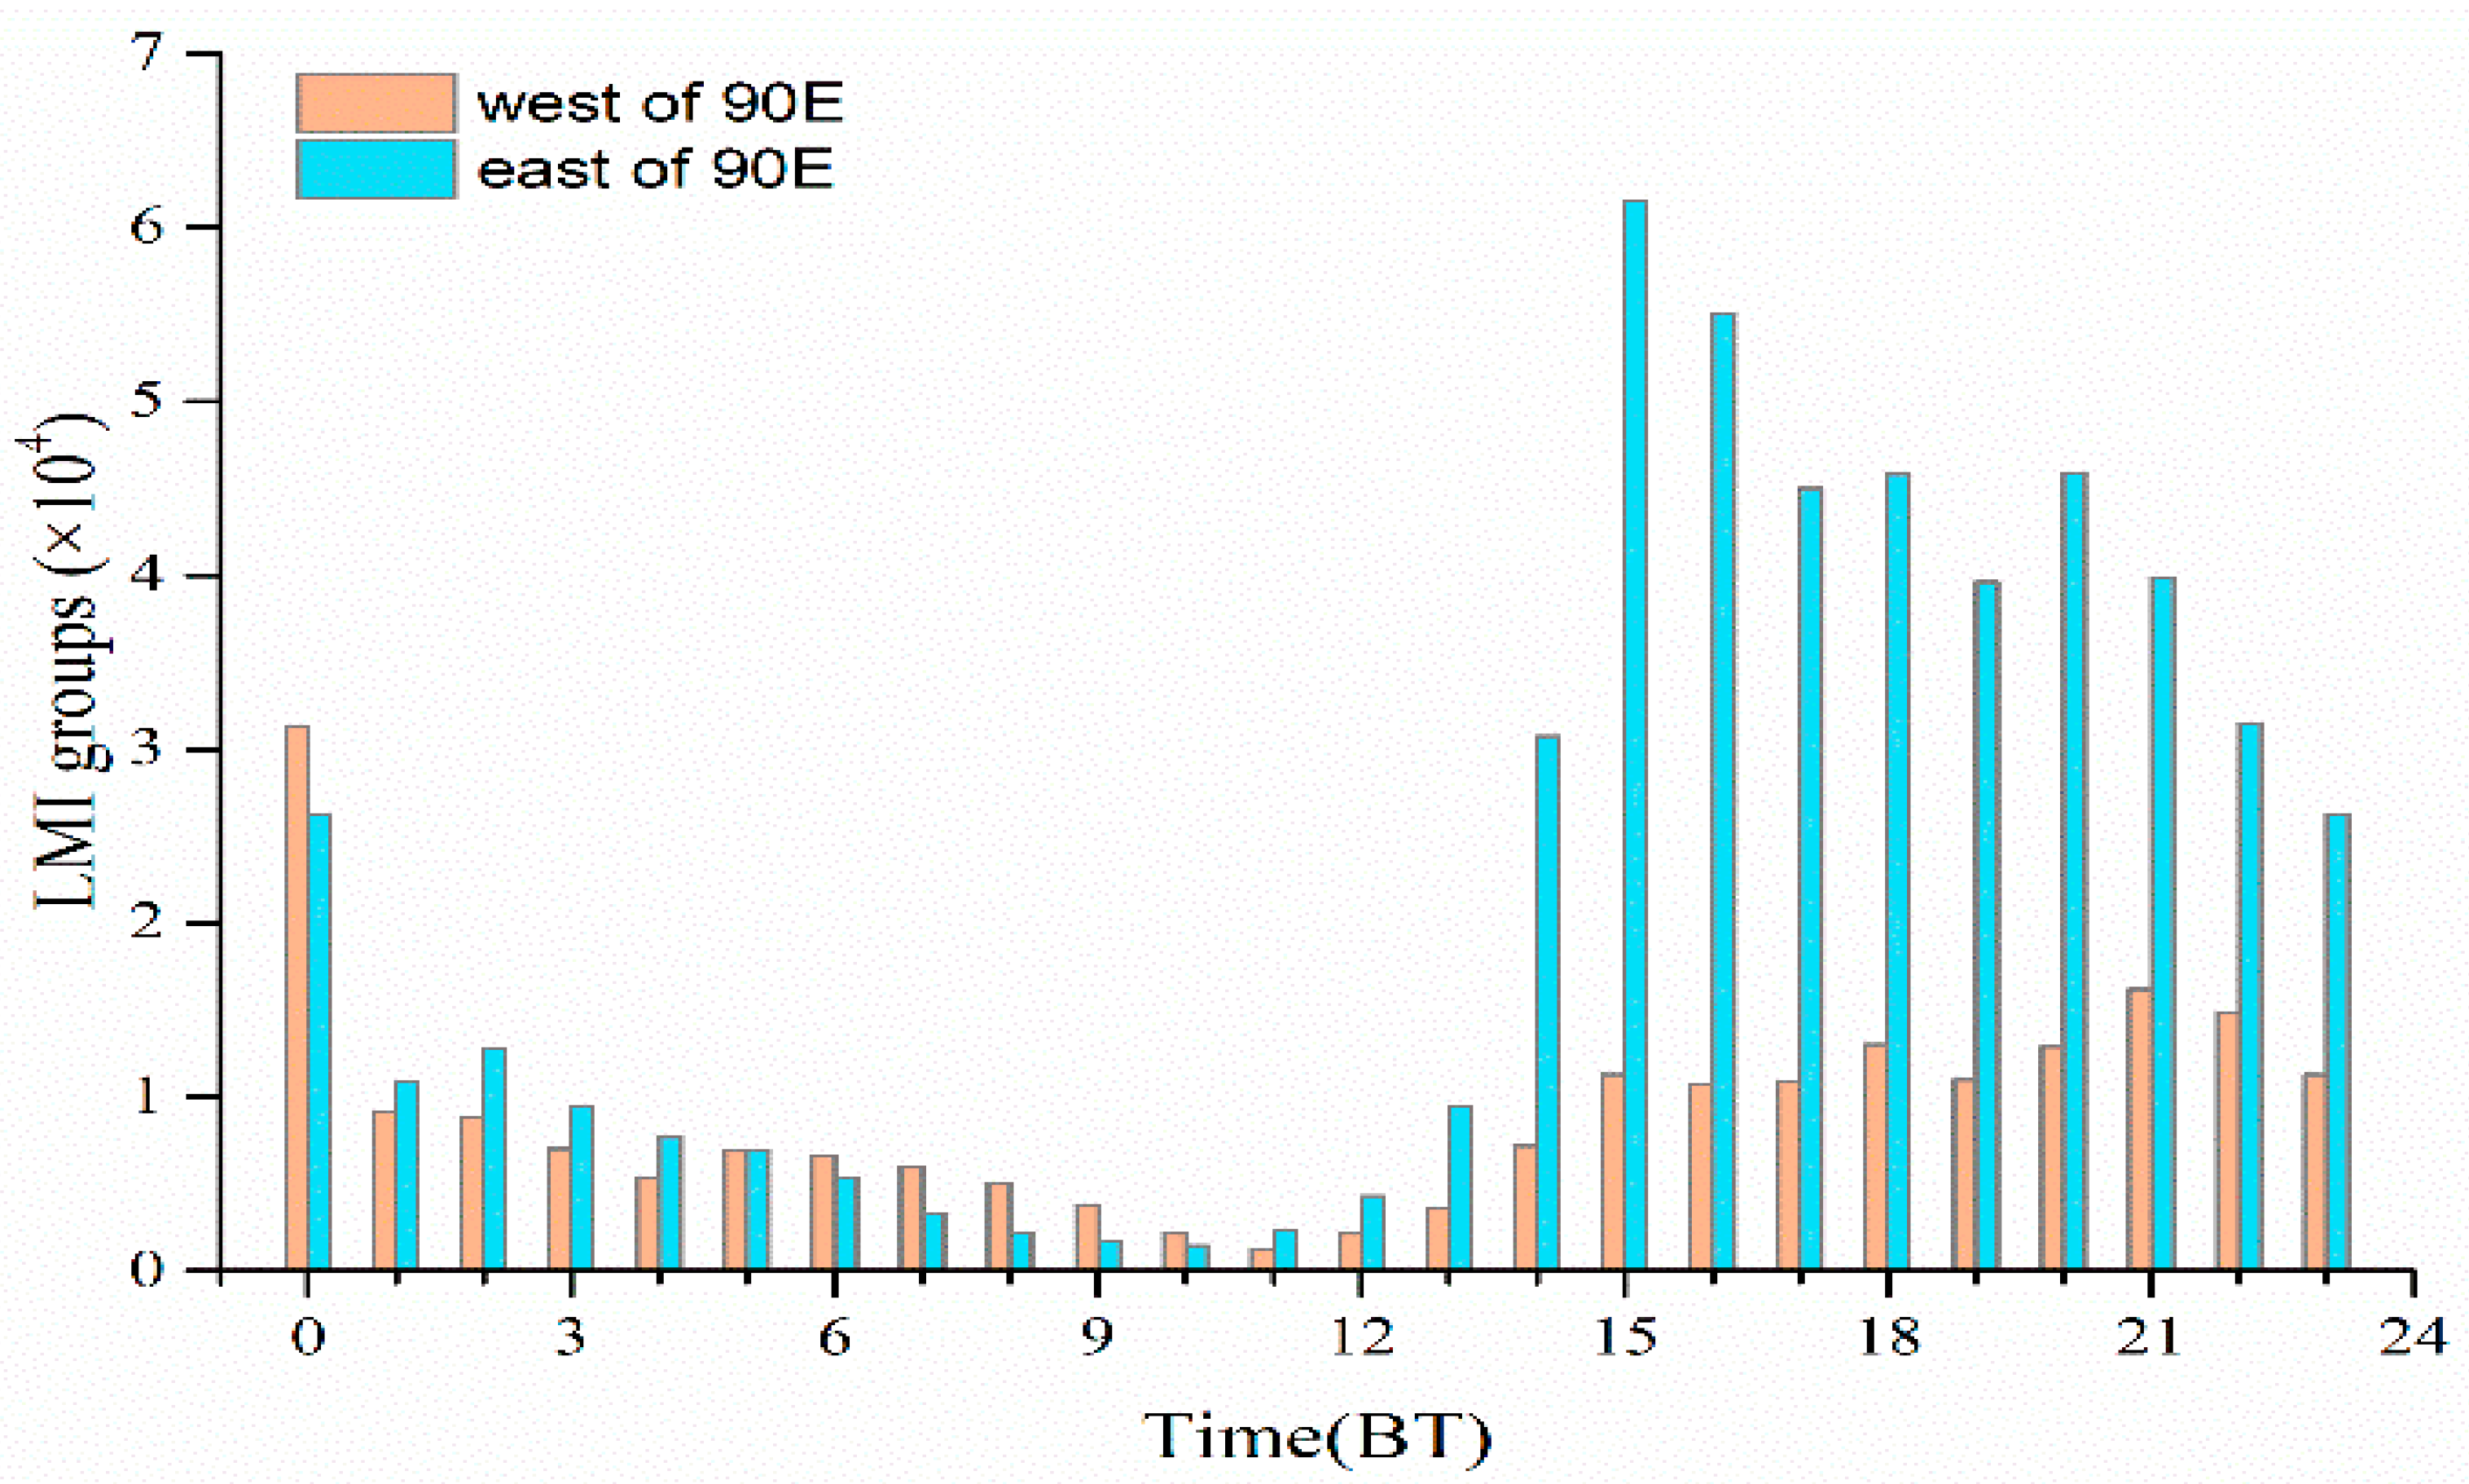
In order to better understand the relationship between the hourly changes of lightning activities and terrain on the plateau, 90° E was chosen as the boundary to divide the study area into two parts: the western sub-region (75~90° E) and the eastern sub-region (90~105° E). They were similar in area, but the western sub-region was higher and mainly mountainous, while the eastern sub-region was relatively lower in altitude and had large topographic fluctuations. The hourly changes of the LMI groups of the two sub-regions are shown in Figure 7. This figure reveals that the hourly variation of the amount of lightning in the two sub-regions is characterized by a single peak, and the terrain and altitude have important effects on lightning activities. The eastern sub-region has significantly more lightning than the western sub-region, mainly because the western sub-region is higher in elevation, cooler in temperature, and has relatively less convective activities.

3.2. Convection Background and Comparative Analysis

Deep convective systems (DCSs with 20 dBZ radar echo tops exceeding 14 km) [25] often cause extreme weather processes such as winds, heavy precipitation, hail, and so on, accompanied by thunderstorms and lightning. In particular, the Tibetan Plateau has unique characteristics of lightning and DCSs [26], and it is very different from the CELR of China at the same latitude [9]. So, studying the relationship between lightning and the DCSs’ background over the Tibetan Plateau is of great significance.
Based on the analysis of the lightning distribution characteristics over the Tibetan Plateau, the comparative response features between the lightning activity and the changes of the atmospheric circulation background were studied in this paper. This helps to explore the contribution of the plateau’s lightning activity to the regional climate changes and to understand the dynamic relationship between the plateau’s thunderstorms and DCSs.

3.2.1. Lift Conditions for Convection

The monthly mean flow field of 500 hPa and the vertical velocity of 850 hPa from 2018 to 2022 (Figure 8) show that the westerly wind prevailed over most of the Tibetan Plateau in April, and only the eastern part of Tibet was affected by a southerly air flow. In May, a trough was established in the central part of Tibet, and the wind speed in the northern part of the plateau weakened significantly. In June, the trough had deepened significantly, and most of Tibet was located within the trough, and, at the same time, the warm and wet air in the southwest was significantly enhanced, and the wind speed in the central and southern regions of Tibet generally exceeded 8 m⸱s−1, indicating that the warm and wet air crossed the high mountains near the border and entered the hinterland of the plateau, which jointly provided favorable dynamic conditions for the enhancement of precipitation and convection in most areas of the plateau. In July and August, especially, the trough still maintained, and the strength of the trough also increased in central Tibet in August, corresponding to the low-pressure area of the plateau, while the southwest wind’s speed decreased. In September, the long-existing plateau trough disappeared, and the height field presented an east–west flat distribution feature. Therefore, the convection became weaker in the central and western regions of Tibet, and the convective conditions gradually deteriorated, so the local convective and lightning activities also gradually decreased.
From the distribution and variation of the vertical velocity, it can be seen that from April to September, the velocity in southern Qinghai was mostly positive, indicating that the sinking air flow was dominant, while in most areas of Tibet, there were sinking and rising air motions alternately, and precipitation and convection also showed uneven distribution characteristics. There is always a negative velocity low-value zone near the Himalayan mountains, which has a long period of rain and snow. After April, the negative velocity area in Tibet began to increase gradually, indicating that the precipitation was becoming more obvious. From July to August, the eastern and southern parts of the plateau were controlled by a large negative velocity region, and there were few positive velocity regions, indicating that upward air movement was dominant, which was consistent with the significant increase in precipitation and convection in this season. In September, the negative velocity zone decreased, and convection and precipitation also weakened. Therefore, the spatial distribution and seasonal variation of the rising and sinking air motions reflected by the vertical velocity are basically consistent with the distribution and characteristics of a lightning density.

3.2.2. Unstable Energy Conditions for Convection

An important condition for the initiation and intensification of convective weather is sufficient unstable energy, which is often expressed in terms of convective available potential energy (CAPE) [27]. CAPE represents the energy increase of air micro clusters under net buoyancy, which is closely related to deep convective activities [28]. On the Emagram graph, it represents the area of the enclosed region between the temperature stratification curve and the state curve [29]. The monthly distribution (April to September 2018–2022) of the CAPE is shown in Figure 9. It can be seen that the CAPE in the plateau has gradually increased since June (Figure 9a). Generally speaking, the average CAPE in the eastern region is higher than that in the central and western regions, especially in the summer (July to August), and the CAPE in eastern Tibet and western Sichuan generally exceeds 500 J×kg−1, with a maximum of 1000~1200 J×kg−1. This is consistent with a high lightning density, indicating that there is a good spatial positive comparative feature between the high CAPE value and the intense lightning activity. Particularly, in the central area of the Tibetan Plateau, the comparative features between the lightning density and the CAPE are the strongest, with a correlation coefficient of about 0.8. At the same time, the lightning frequency corresponding to the unit CAPE in the plateau is significantly higher than that in the low-altitude plain region, indicating that the CAPE of the plateau can stimulate lightning more effectively. Therefore, the lightning activity on the plateau provides a good indication of the development of its convection, especially for DCSs.
In order to understand more about the characteristics of the lightning activity and its possible influencing factors on the plateau, the LMI flashes during the above five years in the region with heights greater than 3500 m were counted and compared with the convective instability energies in the same period, and the results are shown in Figure 9b. In terms of the median value, the lightning number, month by month, is mostly less than 60; it gradually increases between April and June and then decreases after July, with the median lightning number in June and July being about double that of April and that of April being about double that of September, reflecting the very rapid monthly changes of lightning activity on the plateau. It can also be seen in the figure that the median lightning number in May is only about half of that in April, and the number of flashes also starts to decrease sharply after August. It can also be seen that the distribution of flashes from June to July is very concentrated, mostly around the mean and above 120 events, while the other months are more diffused. For example, although the median number of flashes in August is below 13, there are more areas with more than 70, accounting for 3% of the total; the same is true for May and September, with 10% and 4% of the areas with more than 70 flashes, respectively, reflecting that there are still more areas with more flashes than in all of them; in other words, flashes start to decrease in general in August, but there are still more areas with a lot of flashes. This is also true for May, where there were significantly more regions with greater than 70 flashes than in April, although the median and mean number of flashes were slightly lower than in April. During the same period, the CAPE shows a trend of increasing and then decreasing, i.e., the lowest values occur in April and the highest in August, reflecting that July–August is the summer season of the plateau, and then the fall–winter season starts rapidly in September, and the convective conditions also deteriorate significantly but are still slightly stronger than those in April–May. A comparison of the two results shows that the LMI flashes peeked ahead of the CAPE, which declined later than the LMI flashes.

3.2.3. Heat Conditions for Convection

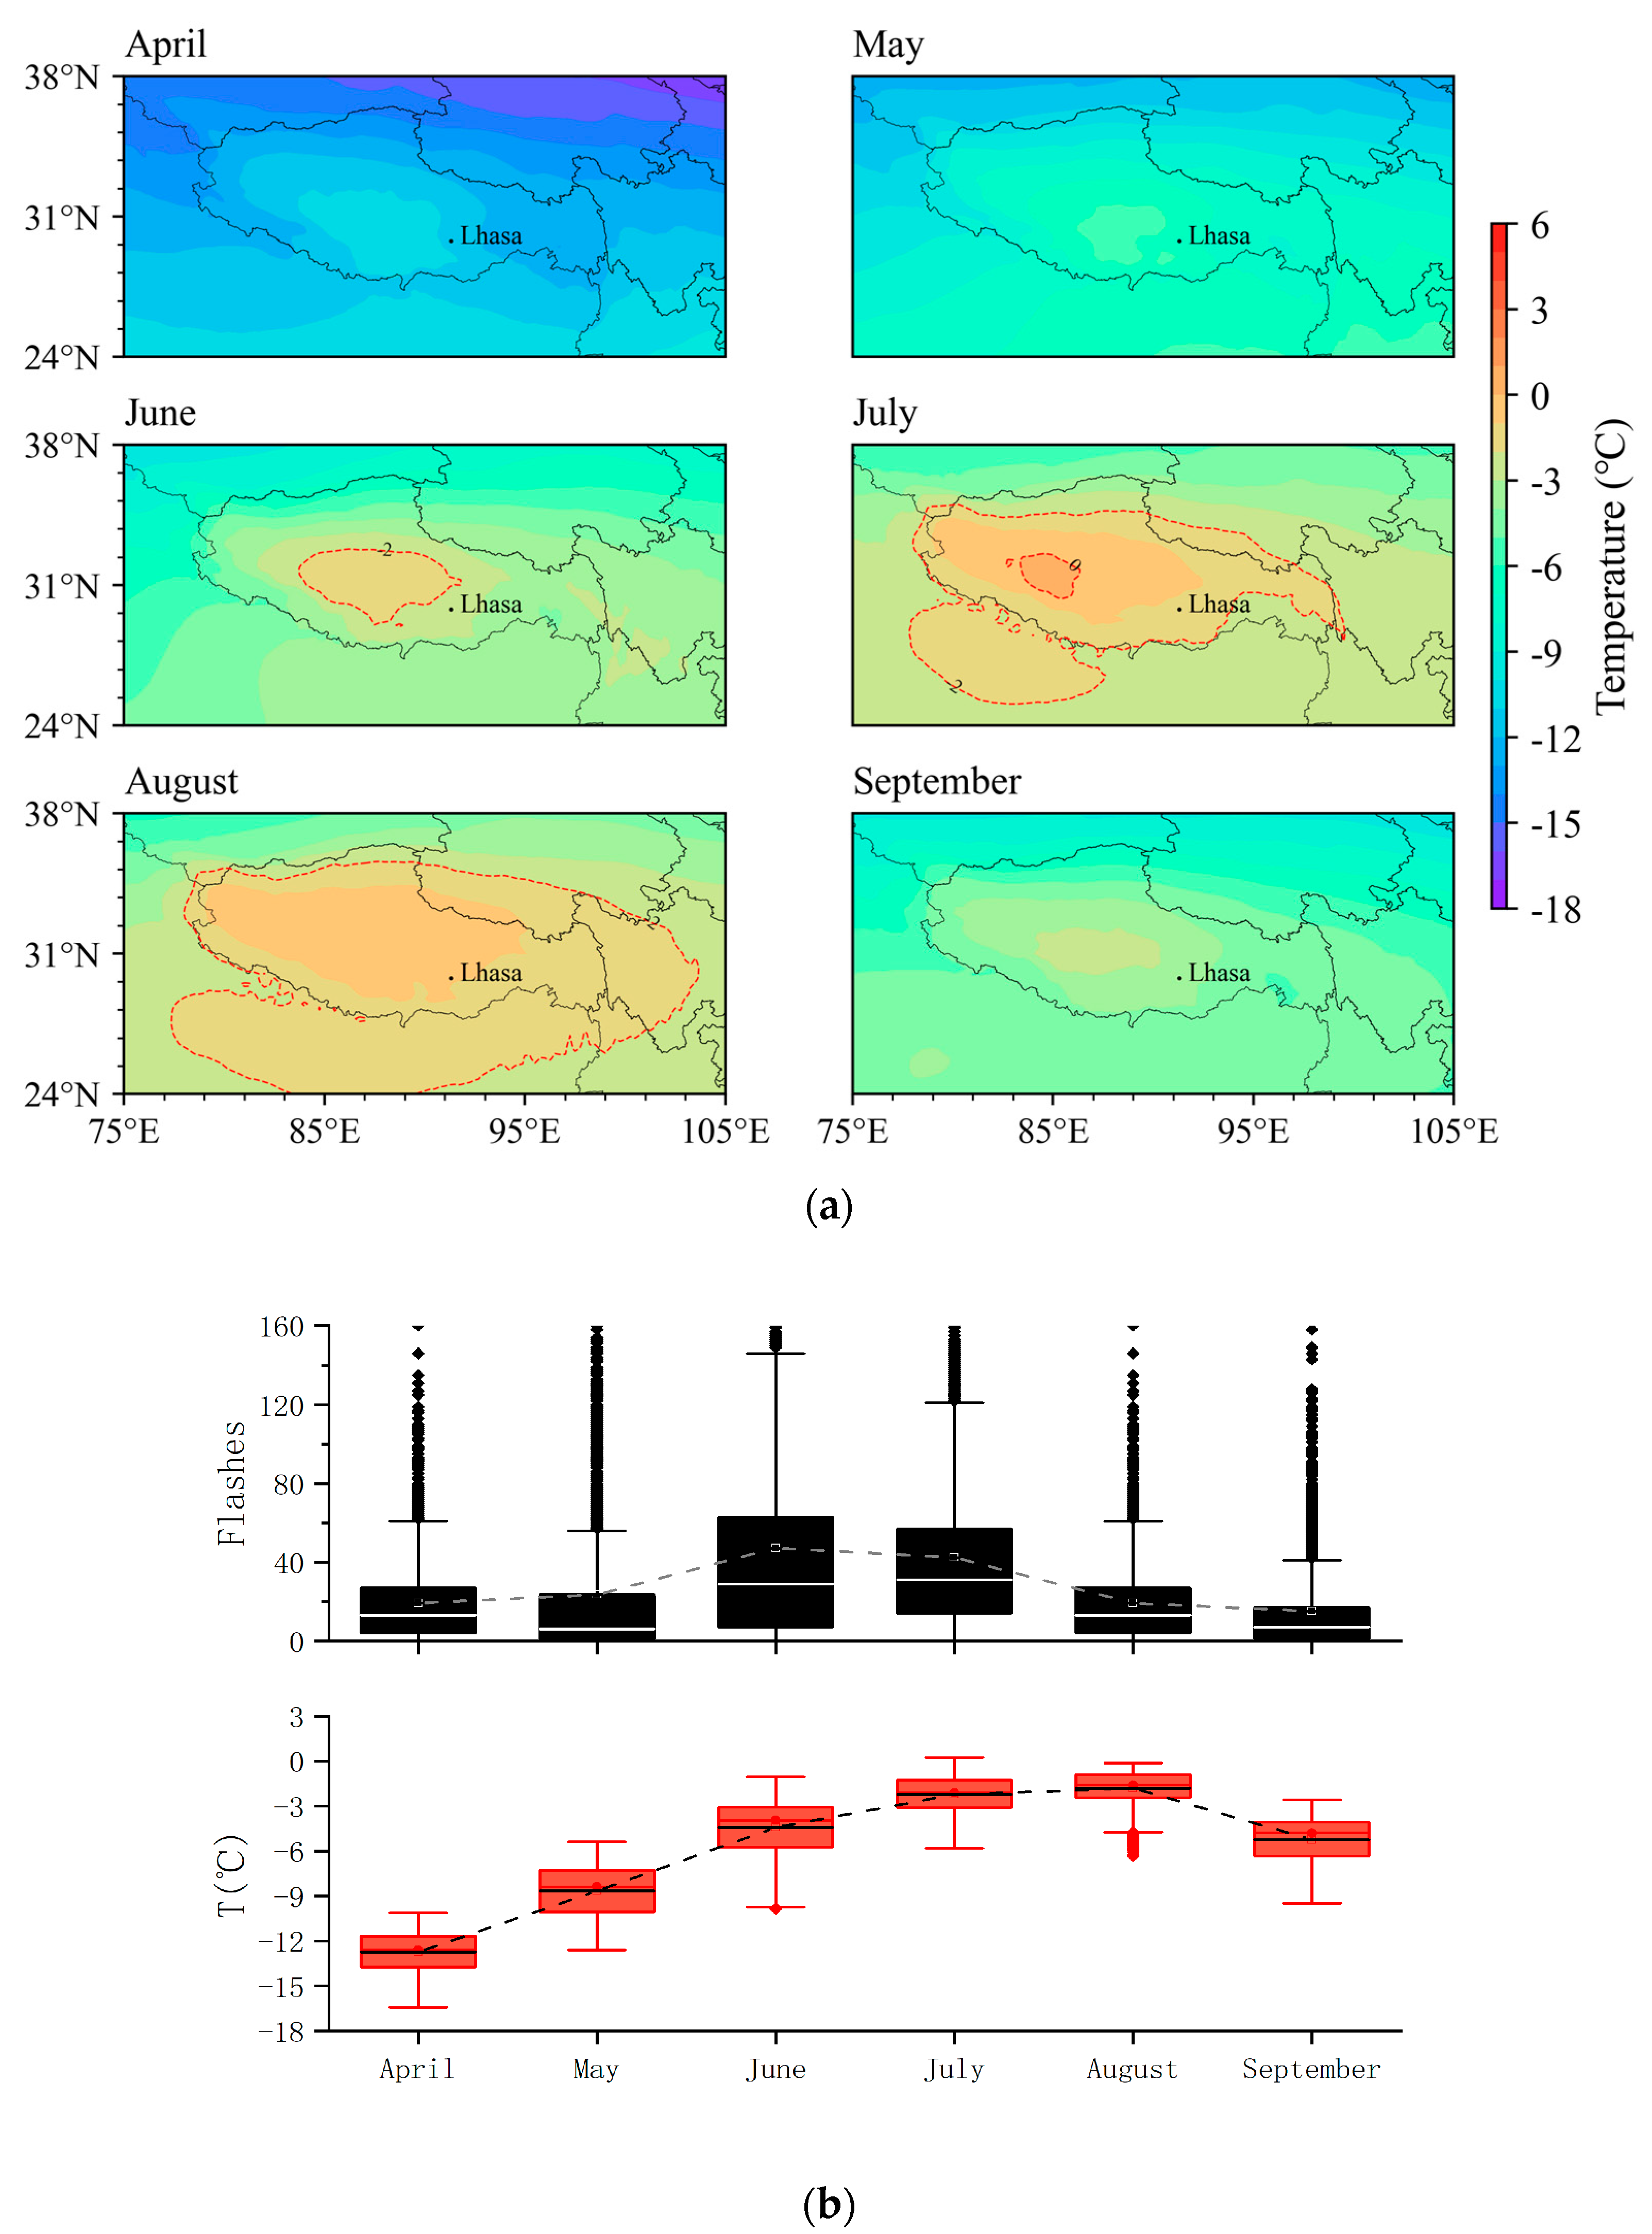
Another important condition of convection is good thermal effect [8], and a temperature rise is an important factor in inducing an increase and enhancement of convection. Figure 10a displays the spatial and monthly average temperature changes at 500 hPa over the Tibetan Plateau during April to September from 2018 to 2022. After June, a relatively high-value area above 0 °C appeared for the first time on the plateau, mainly in the central and western regions of Tibet. Then, it expanded rapidly from July to August, and the average temperature in the southwest region of Tibet even exceeded 3 °C, indicating that the temperature rose more obviously in the midsummer period, which was conducive to the increase in convective activities, and this is completely consistent with the distribution characteristics of the lightning density. Similar to the monthly variation characteristics of the CAPE, the 500 hPa temperature also experienced a process of increasing and then decreasing on the plateau at elevations above 3500 m (Figure 10b), with the highest in August and the lowest in April. The median and mean LMI flashes for the same period were highest in June, followed by July, and decreased significantly in August, which was different from the trend of temperature, i.e., the flashes changed earlier.
Due to the different spatial–temporal distribution characteristics of each component of the heat source and their contribution to the total heat source, the spatial–temporal variation of the plateau’s heat source has obvious seasonal and regional properties, but, in general, the plateau’s heat source-concentration area has good corresponding comparative features with the high lightning activity density area. The results show that the 500 hPa thermal condition contributes positively to the enhancement of lightning activities. This is also evidence for global warming potentially leading to increased lightning activities. Increased lightning means more potential for property damage and a loss of life [30,31,32], as well as wildfires and an increase in nitrogen oxides in the atmosphere [33,34], which deserves continued attention.

3.2.4. Water Vapor Conditions for Convection

In the summer, there are many low-pressure activities over the Tibetan Plateau, which strongly attract the warm and wet air over the South Asian continent, making the southwest monsoon significantly enhanced [35,36]. Some of the warm and wet air circumvents the eastern part of the plateau to the north and east and joins with the southerly warm and wet air from the west side of the western Pacific [8], which transports abundant water vapor to the central and northern land regions of China. Meanwhile, the water vapor on the plateau also increases significantly, leading to a rainy season in these regions [37,38].
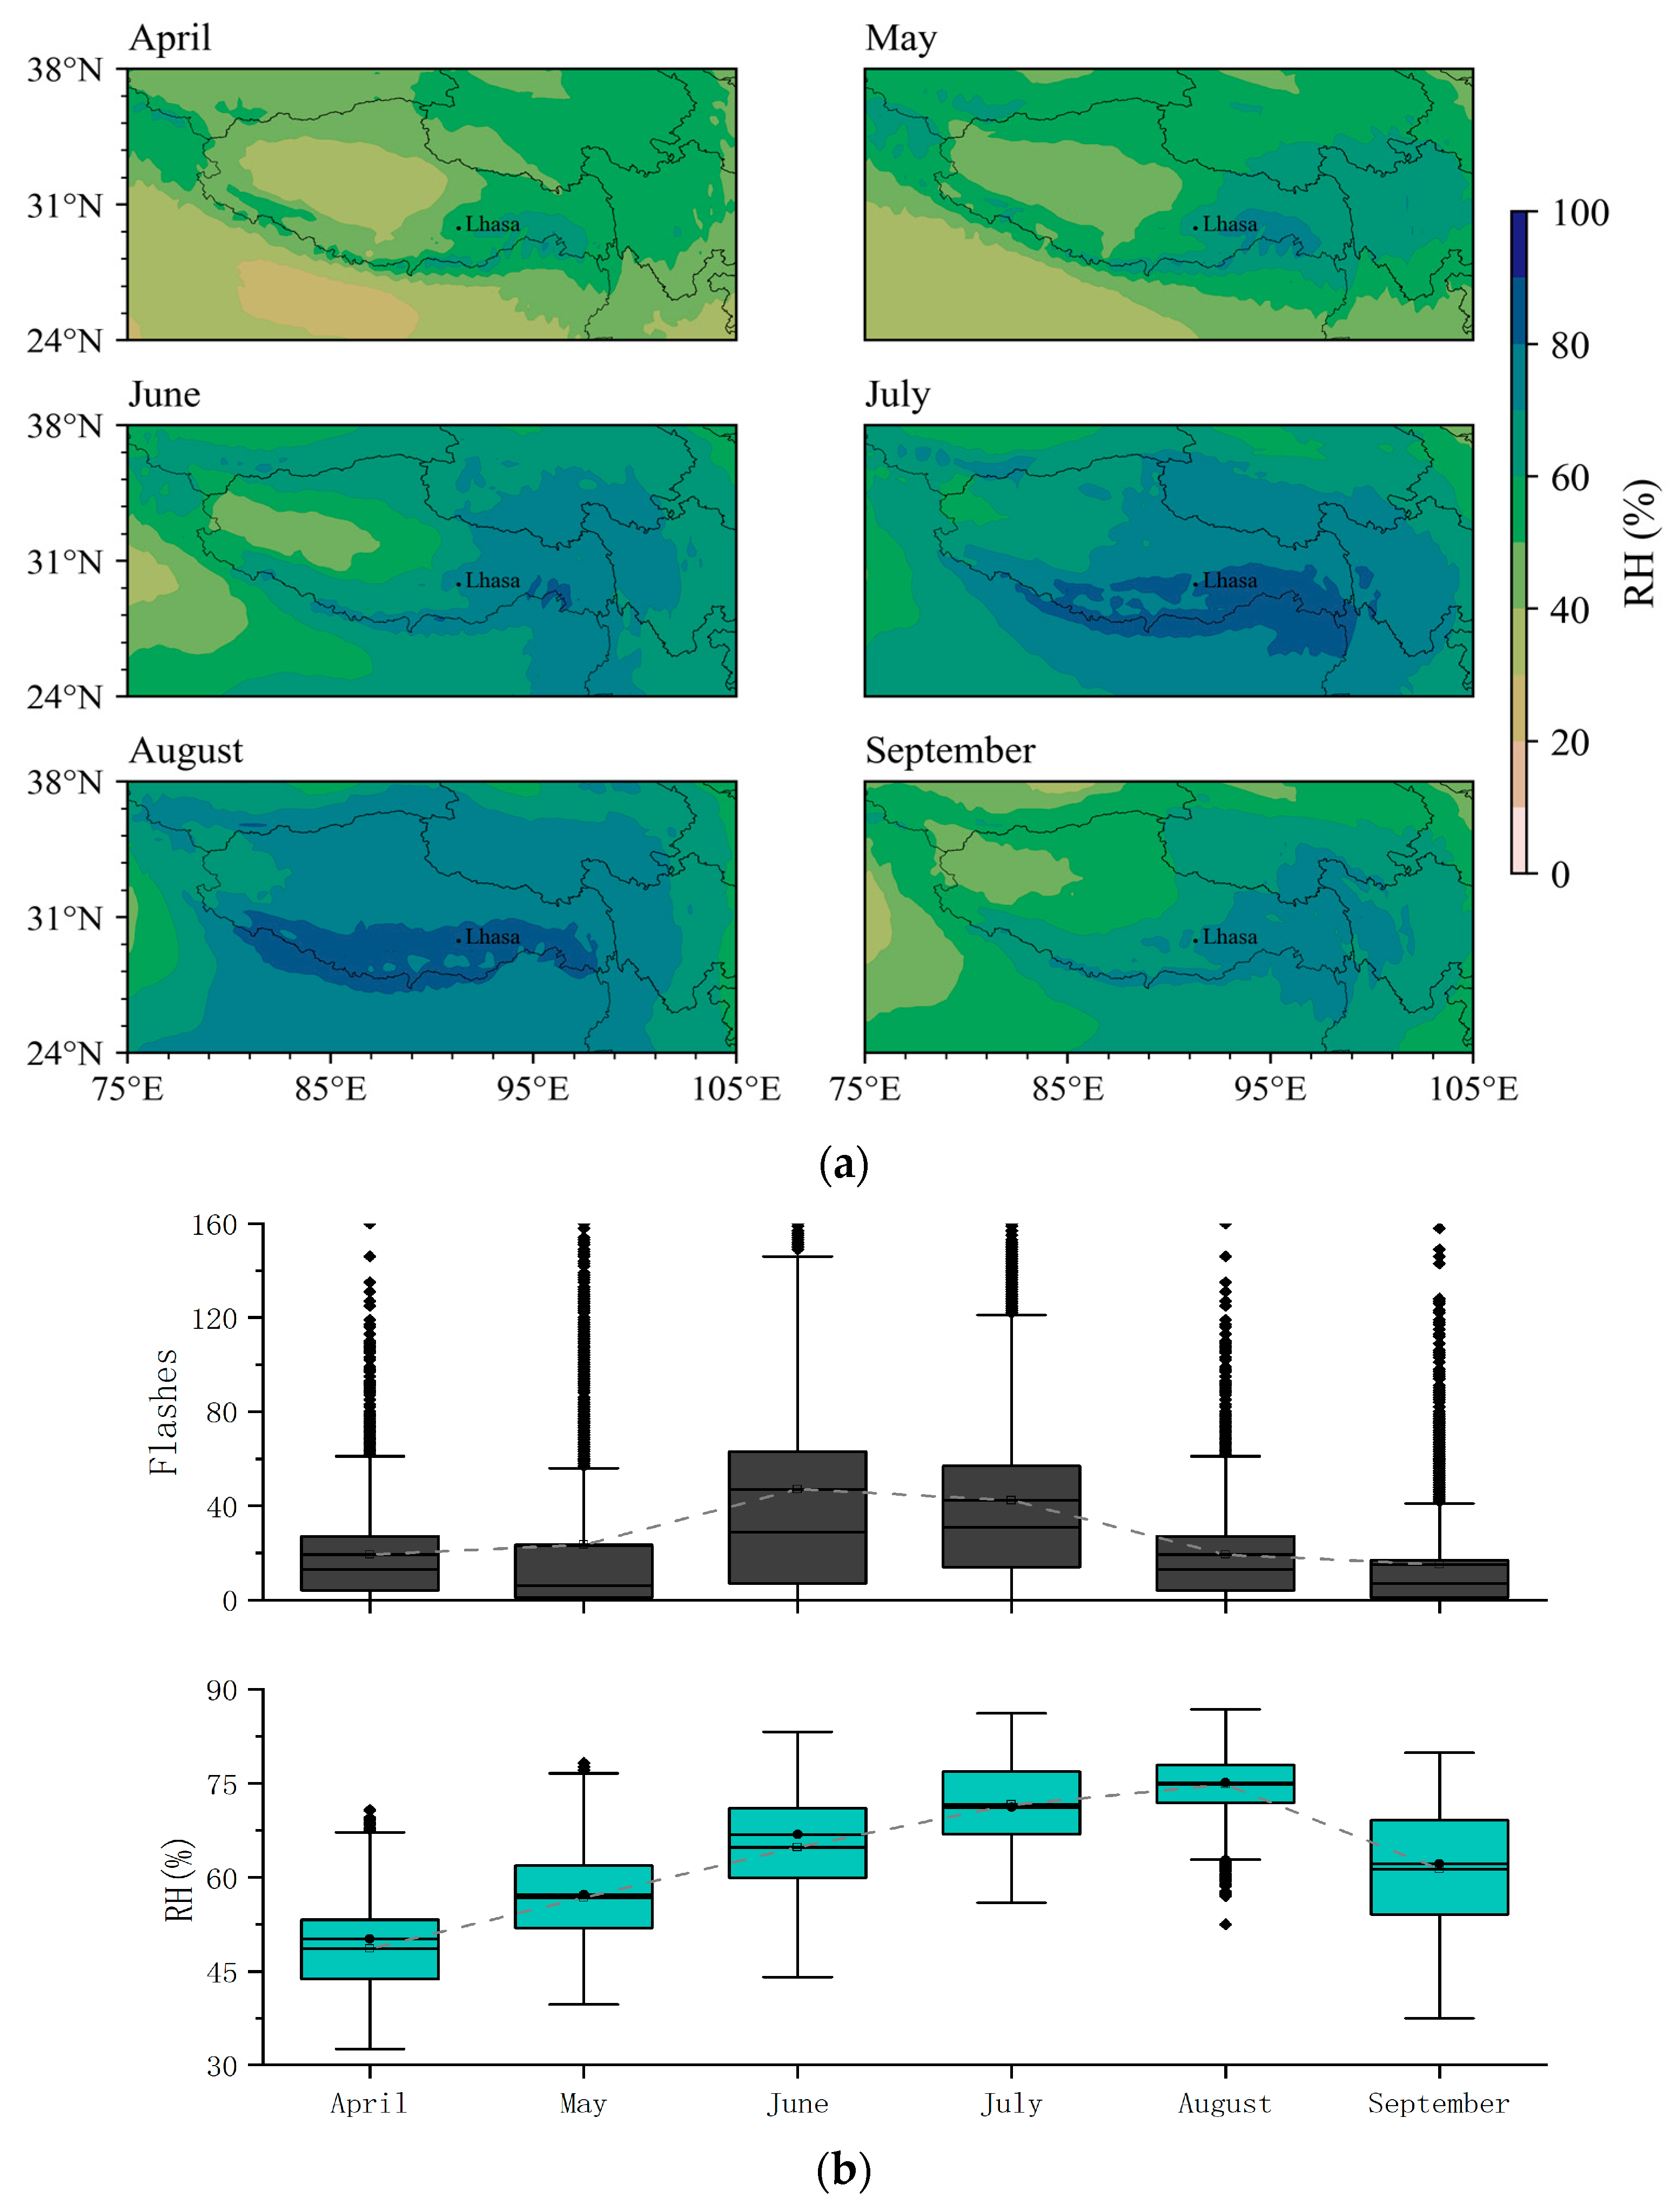
Figure 11a shows the monthly spatial distribution variations of the relative humidity (RH) of 500 hPa. It can be seen that the humidity of southeastern Tibet and western Sichuan in April and May is relatively high, exceeding 60%, but the range is small. Humidity in the high-altitude areas of western Tibet is generally below 40%. From June, the humidity in the plateau increased significantly, and the high humidity areas were mainly located in eastern Tibet and the western Sichuan Plateau, where the humidity generally exceeded 80%, and even the humidity in southeastern Tibet and along the Himalayan mountains reached 100%. The maximum humidity was reached in July–August, indicating that the humidity conditions became significantly better after entering the midsummer which was conducive to the enhancement of precipitation and convective activities. In September, the range of the humidity high-value area was significantly reduced, especially in western and southern Tibet, which mostly dropped below 50%, which is highly consistent with the characteristics of the monthly distribution of the lightning density, reflecting that water vapor conditions have a considerable influence on the lightning frequency during the seasonal change.
Figure 11b shows the month-to-month variation of flashes versus the relative RH value at 500 hPa in the plateau region, and it can be seen that, similar to the CAPE and temperature, the RH gradually increases before August and begins to decrease in September; the median RH values are all greater than 60% between June and August, and the rest of the months are 50~60%, and the distribution is the most concentrated in August and the most dispersed in September. As with the variation characteristics of the CAPE and temperature, the number of LMI flashes in the same period still overshoots and varies ahead of the RH value.
From the above analysis, it can be seen that the unstable energy, temperature, and humidity in the central and western parts of the plateau reach their maximum in July and August, which represents the peak of the summer, but the 5-year LMI lightning data obtained by the FY-4A satellite show that the lightning number decreases in August, i.e., the lightning is not completely synchronized with the change of the environmental characteristic quantity, and the lightning number is more ahead of the change. This distribution feature is closer to Yuan’s finding that years of satellite observations show that July is the most active period for lightning activity on the plateau [18]. Another possible reason for this phenomenon is that the satellite’s ability to detect lightning in the plateau region has not been examined by many years of historical data, and the examination carried out by Hui et al. based on the satellite’s data before 2020 may not be applicable after that year, whereas this paper adopts five years of data, including 2021–2022, so it may be different from the existing results of the satellite’s detection ability assessment, and, in addition, as the satellite exceeds its design service life, the satellite will not be able to detect lightning in the future. The lightning detection capability of the satellite decreases to some extent as it exceeds its design lifetime.

4. Discussion and Conclusions

The FY-4A satellite carries a lightning detector, the first of its kind in China, which effectively overcomes the shortcomings of ground-based observations in plateau areas and provides more conditions for learning more about local convective activities. Previous research results are based on observation data, such as the TRMM satellites, and are mostly analyzed for some convective weather processes, and there are few results of statistical analysis based on a long time series of satellite observation data. This paper is based on the FY-4A/LMI observational data and adopts 5 years of observational data, which is work never seen before. Based on their data, we obtained consistent and continuous long-time-series lightning observation data for the whole region of the plateau for the first time, which makes up for the deficiency of ground-based lightning observations and improves the cognition of the distribution characteristics of the lightning activity on the plateau and its comparative features with the atmospheric background. Our main conclusions are summarized below.
(1) Characteristics of lightning activities over the Tibetan Plateau: Lightning density in the Tibetan Plateau is much smaller than that in the central and eastern land regions of China (CELR) at the same latitude. Based on the LMI data, eastern Tibet to western Sichuan are the high lightning-density-value areas, and central Tibet is the second highest-value area, mainly located in Lhasa and its adjacent areas, and other areas are low. The lightning activities on the plateau have obvious seasonal variation characteristics, and the monthly amount of lightning and its ratio in the total amount of lightning for the whole year show the characteristics of “increasing first and then decreasing”. The most lightning occurred in June and July, which is about a month earlier than that in the CELR. The amount of lightning fluctuated in May and decreased rapidly after August, which is consistent with the local convective thunderstorm season. As time goes on, along with the “propagation” of convections to high-altitude areas, the frequency of lightning activities also showed a change trend of “increasing first in the central and eastern regions, and then increasing in the western regions”. The diurnal variation of lightning activities over the Tibetan Plateau is consistent with that of local convections and topography. In general, the interval from 13:00 LT (Local Time, the same below) to 24:00 LT is the period when convections and lightning activities are relatively concentrated, and at around 21:00 LT, there are fluctuations and lightning activities are relatively frequent, which is related to the local night rain.
(2) Lightning activities over the Tibetan Plateau’s response to the convective condition characteristics: The distribution of lightning activities over the Tibetan Plateau is consistent with the spatial seasonal variation of the monthly geopotential, wind shear, and vertical velocity. The convective available potential energy (CAPE) has a significant role in promoting the generation and development of lightning activities over the plateau. The increase in temperature at 500 hPa and humidity have a significant positive contribution to the enhancement of lightning activities over the plateau. In the context of global warming, the average temperature in the central and western regions of the plateau increased in the past five years, which reflects that the Tibetan Plateau, as a summer heat source, has a gradual warming trend, and the corresponding convections and lightning activities are also increasing gradually. Lightning activities can be used as an indicator of deep convective systems (DCSs).
These findings will deepen our knowledge of the unique lightning activities over the Tibetan Plateau and will offer vital information for research on local deep convective systems and their far-reaching impact on the climate and weather. This is crucial for the study of climate change over the Tibetan Plateau and even in Asia, and this also provides some references for the local refined lightning protection.
This paper only compares the comparative features between lightning and environmental characteristics in the plateau region with an altitude of more than 3500 m, reflecting that the seasonal activity of the LMI lightning on the plateau will weaken earlier, which is different from that at lower altitudes. In addition, the formation mechanism and evolution of lightning in the plateau region are complex. The FY-4A overcomes the lack of detection data in this region to a certain extent and provides a reference for a better understanding of the characteristics of the lightning activity in the region, but it is limited by the quality of the data and the accuracy of the detections which are still insufficient to test. So, the detailed characteristics of the lightning activity and its influencing factors and mechanisms can be further explored. Fortunately, the FY4C (as FY-4A’s successor) will launch in 2024 and will be expected to be operational soon. It will provide more stable operations and higher resolution sounding data, resulting in a better understanding of the convective activity over a broader region, including the plateau area.

Author Contributions

Conceptualization, J.Z.; methodology, J.Z.; software, S.Z.; validation, S.R.; formal analysis, J.Z.; investigation, J.Z.; resources, J.Z.; data curation, S.Z.; writing—original draft preparation, J.Z.; writing—review and editing, J.Z.; visualization, S.Z.; supervision, S.R.; project administration, J.Z.; funding acquisition, S.R. All authors have read and agreed to the published version of the manuscript.

Funding

This research was jointly funded by the National Natural Science Foundation of China (Grant No. 42175014), the National Natural Science Foundation’s Youth Fund (Grant No. 42205137), and Shanghai Typhoon Research Foundation (TFJJ202209).

Institutional Review Board Statement

Not applicable.

Informed Consent Statement

Not applicable.

Data Availability Statement

The satellite-based lightning detection data—Lightning Mapping Imager (LMI) data—were obtained from the National Satellite Meteorological Center (NSMC), the China Meteorological Administration (CMA). The ground-based cloud-to-ground lightning detection data were provided by the Chinese NLDN (the National Lightning Detection Network in China), the Atmospheric Observation Technology Centre, the China Meteorological Administration (CMA). A variety of meteorological observation data were collected by the CMA.

Acknowledgments

We are grateful to Lin Zhu of the NSMC for her constructive suggestions on the satellite data’s processing and analysis. Valuable comments from anonymous reviewers resulted in significant improvements in this manuscript. We also express our sincere thanks to them.

Conflicts of Interest

The authors declare that they have no known competing financial interests or personal relationships that could have appeared to influence the work reported in this paper.

References

  1. Luo, Y.L.; Zhang, R.H.; Qian, W.M.; Luo, Z.Z.; Hu, X. Intercomparison of Deep Convection over the Tibetan Plateau–Asian Monsoon Region and Subtropical North America in Boreal Summer Using CloudSat/CALIPSO Data. J. Clim. 2014, 24, 2164–2177. [Google Scholar] [CrossRef]
  2. Xue, X.Y.; Ren, G.Y.; Sun, X.B.; Ren, Y.Y. Climatological characteristics of meso-scale and micro-scale strong convective weather events in China. Clim. Environ. Res. 2019, 24, 199–213. (In Chinese) [Google Scholar]
  3. Williams, E.; Guha, A.; Boldi, R.; Christian, H.; Bechler, D. Global lightning activity and the hiatus in global warming. J. Atmos. Sol. Terr. Phys. 2019, 189, 27–34. [Google Scholar] [CrossRef]
  4. Zheng, D.; Zhang, Y.J.; Zhang, Y.; Yao, W.; Wang, F.; Lyu, W.T.; Meng, Q.; Fan, X.P.; Ma, Y.; Yang, J. Lightning and deep convective activities over the Tibetan Plateau. Earth Sci. 2020, 7, 487–488. [Google Scholar] [CrossRef]
  5. Fan, P.L.; Zheng, D.; Zhang, Y.J.; Gu, S.Q.; Zhang, W.J.; Yao, W.; Yan, B.W.; Xu, Y.B. A performance evaluation of the World-Wide Lightning Location Network (WWLLN) over the Tibetan Plateau. J. Atmos. Ocean. Technol. 2018, 35, 927–939. [Google Scholar] [CrossRef]
  6. Wu, X.; Yuan, T.; Qie, K.; Luo, J. Geographical distribution of extreme deep and intense convective storms on Earth. Atmos. Res. 2020, 235, 104789. [Google Scholar] [CrossRef]
  7. Mach, D.M. Geostationary Lightning Mapper clustering algorithm stability. J. Geophys. Res. Atmos. 2020, 125, e2019JD031900. [Google Scholar] [CrossRef]
  8. Xia, R.D.; Zhang, D.L.; Wang, B. A 6-yr cloud-to-ground lightning climatology and its relationship to rainfall over central and eastern China. J. Appl. Meteorol. Climatol. 2015, 54, 2443–2460. [Google Scholar] [CrossRef]
  9. Hui, L.; Zhou, Y.J.; Yan, Z.T. The Characteristics of Thunderstorms and Their Lightning Activity on the Qinghai-Tibetan Plateau. Adv. Meteorol. 2022, 2022, 9102145. [Google Scholar] [CrossRef]
  10. Gao, P.; Wu, T.; Wang, D. Initial Results of Long-term Continuous Observation of Lightning Discharges by FALMA in Chinese Inland Plateau Region. Atmosphere 2021, 12, 514. [Google Scholar] [CrossRef]
  11. Abarca, S.F.; Corbosiero, K.L.; Galarneau, T.J. An evaluation of the Worldwide Lightning Location Network (WWLLN) using the National Lightning Detection Network (NLDN) as ground truth. J. Geophys. Res. Atmos. 2010, 115, D18206. [Google Scholar] [CrossRef]
  12. Zhang, W.J.; Hui, W.; Lyu, W.T.; Cao, D.J.; Li, P.F.; Zheng, D.; Fang, X.; Zhang, Y.J. FY-4A LMI Observed Lightning Activity in Super Typhoon Mangkhut (2018) in Comparison with WWLLN Data. J. Meteor. Res. 2020, 34, 336–352. [Google Scholar] [CrossRef]
  13. Chen, Z.X.; Qie, X.S.; Sun, J.Z.; Xiao, X.; Zhang, Y.X.; Cao, D.J.; Yang, J. Evaluation of Fengyun-4A Lightning Mapping Imager (LMI) Performance during Multiple Convective Episodes over Beijing. Remote Sens. 2021, 13, 1746. [Google Scholar] [CrossRef]
  14. Wen, H.; Zhang, W.J.; Lyu, W.T.; Li, P. Preliminary Observations from the China Fengyun-4A Lightning Mapping Imager and Its Optical Radiation Characteristics. Remote Sens. 2020, 12, 2622. [Google Scholar]
  15. Qie, X.S.; Toumi, R.; Yuan, T. Lightning Activities on the Tibetan Plateau as Observed by the Lightning Imaging Sensor. J. Geophys. Res. Atmos. 2003, 108, 4551. [Google Scholar] [CrossRef]
  16. Qie, X.S.; Yuan, T.; Xie, Y.R.; Ma, Y.M. Spatial and temporal distribution of lightning activities over the Tibetan plateau. Chin. J. Geophys. 2004, 47, 997–1002. (In Chinese) [Google Scholar]
  17. Qie, X.S.; Toumi, R.; Zhou, Y.Y. Lightning activity on the central Tibetan Plateau and its response to convective available potential energy. Chin. Sci. Bull. 2003, 48, 296–299. [Google Scholar] [CrossRef]
  18. Yuan, T.; Qie, X.S. Seasonal variation of lightning activities and related meteorological factors over the central Qinghai-Xizang Plateau. Acta Meteor. Sin. 2005, 63, 123–127. [Google Scholar]
  19. Hui, W.; Huang, F.X.; Liu, R.X. Characteristics of lightning signals over the Tibetan Plateau and the capability of FY-4A LMI lightning detection in the Plateau. Int. J. Remote Sens. 2020, 41, 4605–4625. [Google Scholar] [CrossRef]
  20. Xu, W.X. Thunderstorm Climatologies and Their Relationships to Total and Extreme Precipitation in China. J. Geophys. Res. Atmos. 2020, 125, e2020JD033152. [Google Scholar] [CrossRef]
  21. Liu, R.X.; Lu, Q.F.; Chen, M.; Zhang, Y.; Hui, W.; Li, X.Q. Quality assessment of FY-4A lightning data in inland China. J. Trop. Meteor. 2020, 26, 286–299. [Google Scholar]
  22. Zhu, J. Comparison of the Satellite-Based Lightning Imaging Sensor (LIS) against the Ground-Based National Lightning Monitoring Network. Prog. Geophys. 2018, 33, 541–546. (In Chinese) [Google Scholar]
  23. Li, Y.; Liu, Y.B.; Chen, Y.; Chen, B.J. Characteristics of Deep Convective Systems and Initiation during Warm Seasons over China and Its Vicinity. Remote Sens. 2021, 13, 4289. [Google Scholar] [CrossRef]
  24. Luo, J.L.; Leung, M.; Xu, P.P.; Xue, H.Y.; Zhang, M.; Shang, L.; Tian, H.Y. Seasonal Features and a Case Study of Tropopause Folds over the Tibetan Plateau. Adv. Meteorol. 2019, 25, 4375123. [Google Scholar] [CrossRef]
  25. Hui, W.; Guo, Q. Preliminary characteristics of measurements from Fengyun-4A Lightning Mapping Imager. Int. J. Remote Sens. 2021, 42, 4922–4941. [Google Scholar] [CrossRef]
  26. Wu, X.K.; Qie, X.S.; Yuan, T. Regional distribution and diurnal variation of deep convective systems over the Asian monsoon region. Sci. China Earth Sci. 2013, 56, 843–854. [Google Scholar] [CrossRef]
  27. Zou, Y.; Wang, Y.; Wang, S. Characteristics of lighting activity during severe convective weather in Dalian area based on satellite data. J. Meteorol. Environ. 2021, 37, 128–133. [Google Scholar]
  28. Xu, W.; Zipser, E.J. Diurnal variations of precipitation, deep convection, and lightning over and east of the eastern Tibetan Plateau. J. Clim. 2011, 24, 448–465. [Google Scholar] [CrossRef]
  29. Xu, W.; Adler, R.F.; Wang, N.Y. Improving geostationary satellite rainfall estimates using lightning observations: Underlying lightning-rainfall-cloud relationships. J. Appl. Meteor. Climatol. 2013, 52, 213–229. [Google Scholar] [CrossRef]
  30. Qi, P.; Zheng, D.; Zhang, Y.J. Climatological Characteristics and spatio-temporal Correspondence of Lightning and Precipitation over the Tibetan Plateau. J. Appl. Meteor. Sci. 2016, 27, 88–497. [Google Scholar]
  31. Chowdhuri, I.; Pal, S.C.; Saha, A. Significant decrease of lightning activities during COVID-19 lockdown period over Kolkata megacity in India. Sci. Total Environ. 2020, 747, 141321. [Google Scholar] [CrossRef]
  32. Chen, Y.; Romps, D.M.; Seeley, J.T.; Veraverbeke, S.; Riley, W.J.; Mekonnen, Z.A.; Randerson, J.T. Future increases in Arctic lightning and fire risk for permafrost carbon. Nat. Clim. Chang. 2021, 11, 404–410. [Google Scholar] [CrossRef]
  33. Luo, H.Y.; Yu, H.P.; Hu, Z.Y. Progress of the Impact of the Qinghai-Xizang Plateau Heat Sources on Climate Anomalies in Drylands of China. Plateau Meteorol. 2023, 42, 257–271. [Google Scholar]
  34. Wang, Y.; Zhang, Y.J.; Ma, M. Lightning activities in China offing sea area observed by satellite-based lightning imaging sensor. J. Appl. Meteor. Sci. 2010, 21, 157–163. (In Chinese) [Google Scholar]
  35. Avila, E.E.; Buergesser, R.E.; Castellano, N.E.; Collier, A.B.; Compagnucci, R.H.; Hughes, A.R. Correlations between deep convection and lightning activity on a global scale. J. Atmos. Sol. Terr. Phys. 2010, 72, 1114–1121. [Google Scholar] [CrossRef]
  36. Zhang, W.J.; Zhang, Y.J.; Zheng, D.; Xu, L.T.; Lyu, W.T. Lightning Climatology over the northwest Pacific region: An 11-year study using data from the World-Wide Lightning Location Network. Atmos. Res. 2018, 210, 41–57. [Google Scholar] [CrossRef]
  37. Xu, M.Y.; Qie, X.S.; Pang, W.J.; Shi, G.Y.; Liang, L.; Sun, Z.L.; Yuan, S.F.; Zhu, K.X.; Zhao, P.T. Lightning climatology across the Chinese continent from 2010 to 2020. Atmos. Res. 2022, 275, 106251. [Google Scholar] [CrossRef]
  38. Li, J.L.; Wu, X.K.; Yang, J.; Jiang, R.B. Lightning activity and its association with surface thermodynamics over the Tibetan Plateau. Atmos. Res. 2020, 245, 105–118. [Google Scholar] [CrossRef]
Figure 1. Field of view (FOV) of FY-4A/LMI.
Atmosphere 14 01765 g001
Figure 2. Topography of the Tibetan Plateau.
Atmosphere 14 01765 g002
Figure 3. The annual mean lightning density distribution over the Tibetan Plateau (2018–2022).
Atmosphere 14 01765 g003
Figure 4. Monthly changes in the FY-4A/LMI groups over the Tibetan Plateau (from April to September).
Atmosphere 14 01765 g004
Figure 5. Monthly distribution of LMI lightning groups over the Tibetan Plateau.
Atmosphere 14 01765 g005
Figure 6. Hourly lightning frequency at different altitudes over the Tibetan Plateau.
Atmosphere 14 01765 g006
Figure 7. Contrast of hourly LMI group changes in western and eastern line of 90° E over the Tibetan Plateau.
Atmosphere 14 01765 g007
Figure 8. Distributions of monthly mean flow field of 500 hPa (contour) and vertical velocity of 850 hPa (shaded) over the Tibetan Plateau.
Atmosphere 14 01765 g008
Figure 9. Monthly distributions of CAPE (a) and a comparison with LMI flashes (b) over the Tibetan Plateau (April to September).
Atmosphere 14 01765 g009
Figure 10. Monthly average temperature changes (a) and a comparison with LMI flashes (b) of 500 hPa (a) over the Tibetan Plateau.
Atmosphere 14 01765 g010
Figure 11. Monthly relative humidity distributions (a) and a comparison with LMI flashes (b) at 500 hPa over the Tibetan Plateau.
Atmosphere 14 01765 g011
Disclaimer/Publisher’s Note: The statements, opinions and data contained in all publications are solely those of the individual author(s) and contributor(s) and not of MDPI and/or the editor(s). MDPI and/or the editor(s) disclaim responsibility for any injury to people or property resulting from any ideas, methods, instructions or products referred to in the content.