1. Introduction
In comparison to other parts of the world, the Indian subcontinent has a relatively high rate of lightning-related fatalities, particularly in the Himalayan Mountains, Brahmaputra Valley, and Western Ghats [
1]. Lightning and other natural disasters like cloud bursts, floods, and landslides are frequently linked to convective systems worldwide [
2,
3]. Over the last few decades, more than 2500 deaths per year have been reported in India as a result of direct lightning strikes, while this number was ~300 in Bangladesh and ~100 in Nepal [
4,
5,
6]. Lightning fatalities are lower in developed countries such as the United States (20 per year) and less than one per million in European countries [
4]. Improved predictive skills of such convective systems can help to reduce lightning related fatalities and damages. We therefore need to simulate and analyze such processes through high-resolution numerical models.
Lightning is commonly associated with thunderclouds, which are deep convective cells 5–10 km wide or wider, and 4 km deep or deeper, which can produce multiple flashes per second for 30–60 min. The presence of supercooled water, hail, and small ice crystals in the updraft process of thunderclouds produces separation of electrical charges [
7,
8], which may eventually result in lightning. The tropics receive the most lightning, followed by the subtropics over land [
7]. Lightning prediction is still an outstanding challenge due to its random-like occurrence in space and time. Furthermore, the limited understanding of how lightning is triggered within thunderclouds complicates prediction. With rising temperatures in a global warming scenario, the likelihood of lightning events increases [
7], with some studies also suggesting an increase in intensity [
8]. The study by Pérez-Invernón et al. (2023), based on convective mass flux and upward cloud–ice flux, projected a 15% global decrease in lightning activity by the end of the 21st century [
9].
Traditionally, a variety of indices and parameters are used to predict thunderstorm potential, such as the K-Index (KI), lifted index (LI), total totals index (TTI), convective available potential energy (CAPE), and convective inhibition (CIN) [
5,
10]. In addition, earlier research has used the product of CAPE and precipitation (CP) as a reasonable indicator of lightning events [
11,
12]. This method takes advantage of the fact that CAPE fosters the development of convective systems, and when combined with precipitation, it becomes a reliable indicator of lightning activity. Furthermore, it is crucial to consider the various categories of lightning occurrences when forecasting the likelihood of thunderstorms. Thunderstorms can generate many forms of lightning, such as cloud-to-ground (CG), cloud-to-cloud (CC), and intra-cloud (IC) discharges [
8]. Cloud-to-ground lightning is the most frequently witnessed form of lightning and presents substantial safety hazards because it has the capacity to hit the ground, resulting in wildfires and electrical disturbances [
9]. In contrast, intra-cloud lightning happens exclusively within the storm cloud and does not have a direct influence on the earth’s surface.
The lightning potential index (LPI) is a relatively new index developed and integrated into numerical weather models for assessing the potential of lightning activity [
2]. Previous studies using various model simulations have suggested that the LPI can be used to predict lightning activity [
5,
10,
12,
13,
14,
15]. The LPI is calculated as the volume integral of the total mass flux of supercooled water within the developing deep convective cells; it is a derived quantity from model-simulated updraft velocities and mass mixing ratios of water, ice, snow, and graupel [
2]. Since ice and graupel are the main carriers of charges within a convective cloud, the updraft speed of ice and graupel can provide a good proxy for lightning initialization. Several investigations of LPI simulations with the model Icosahedral Nonhydrostatic Climate Limited-Area Mode (ICON-CLM) and its predecessor, the COSMO-CLM, have been conducted in various regions of the world [
10,
16]. The ICON model’s physical parameterizations are derived from the COSMO model, with additional saturation modifications for greater accuracy and performance [
17,
18]. Currently, no ICON-CLM-simulated LPI study is available for the complex and important Third Pole region.
In this paper, we aim to quantify to what extent the ICON-CLM model with km-scale grid spacing is capable of replicating lightning activity over the Third Pole region, utilizing the indicators LPI and CP. To reach this aim, we organized the paper into four sections. This introduction section is followed by the data and methodology section. The third section briefly discusses the lightning climatology over the Third Pole region. The fourth section of the paper examines the performance of the ICON-CLM model in predicting lightning activities. Finally, a summary and conclusion section closes the paper.
3. Results and Discussion
The spaceborne long-term observation of lightning events using the TRMM provides an overview of lightning activity around the world. The monthly TRMM combined flash rate product (LISOTD_LRMTS_V2.3) from January 1995 to January 2015 was used to understand the yearly variation in lightning activity around the world.
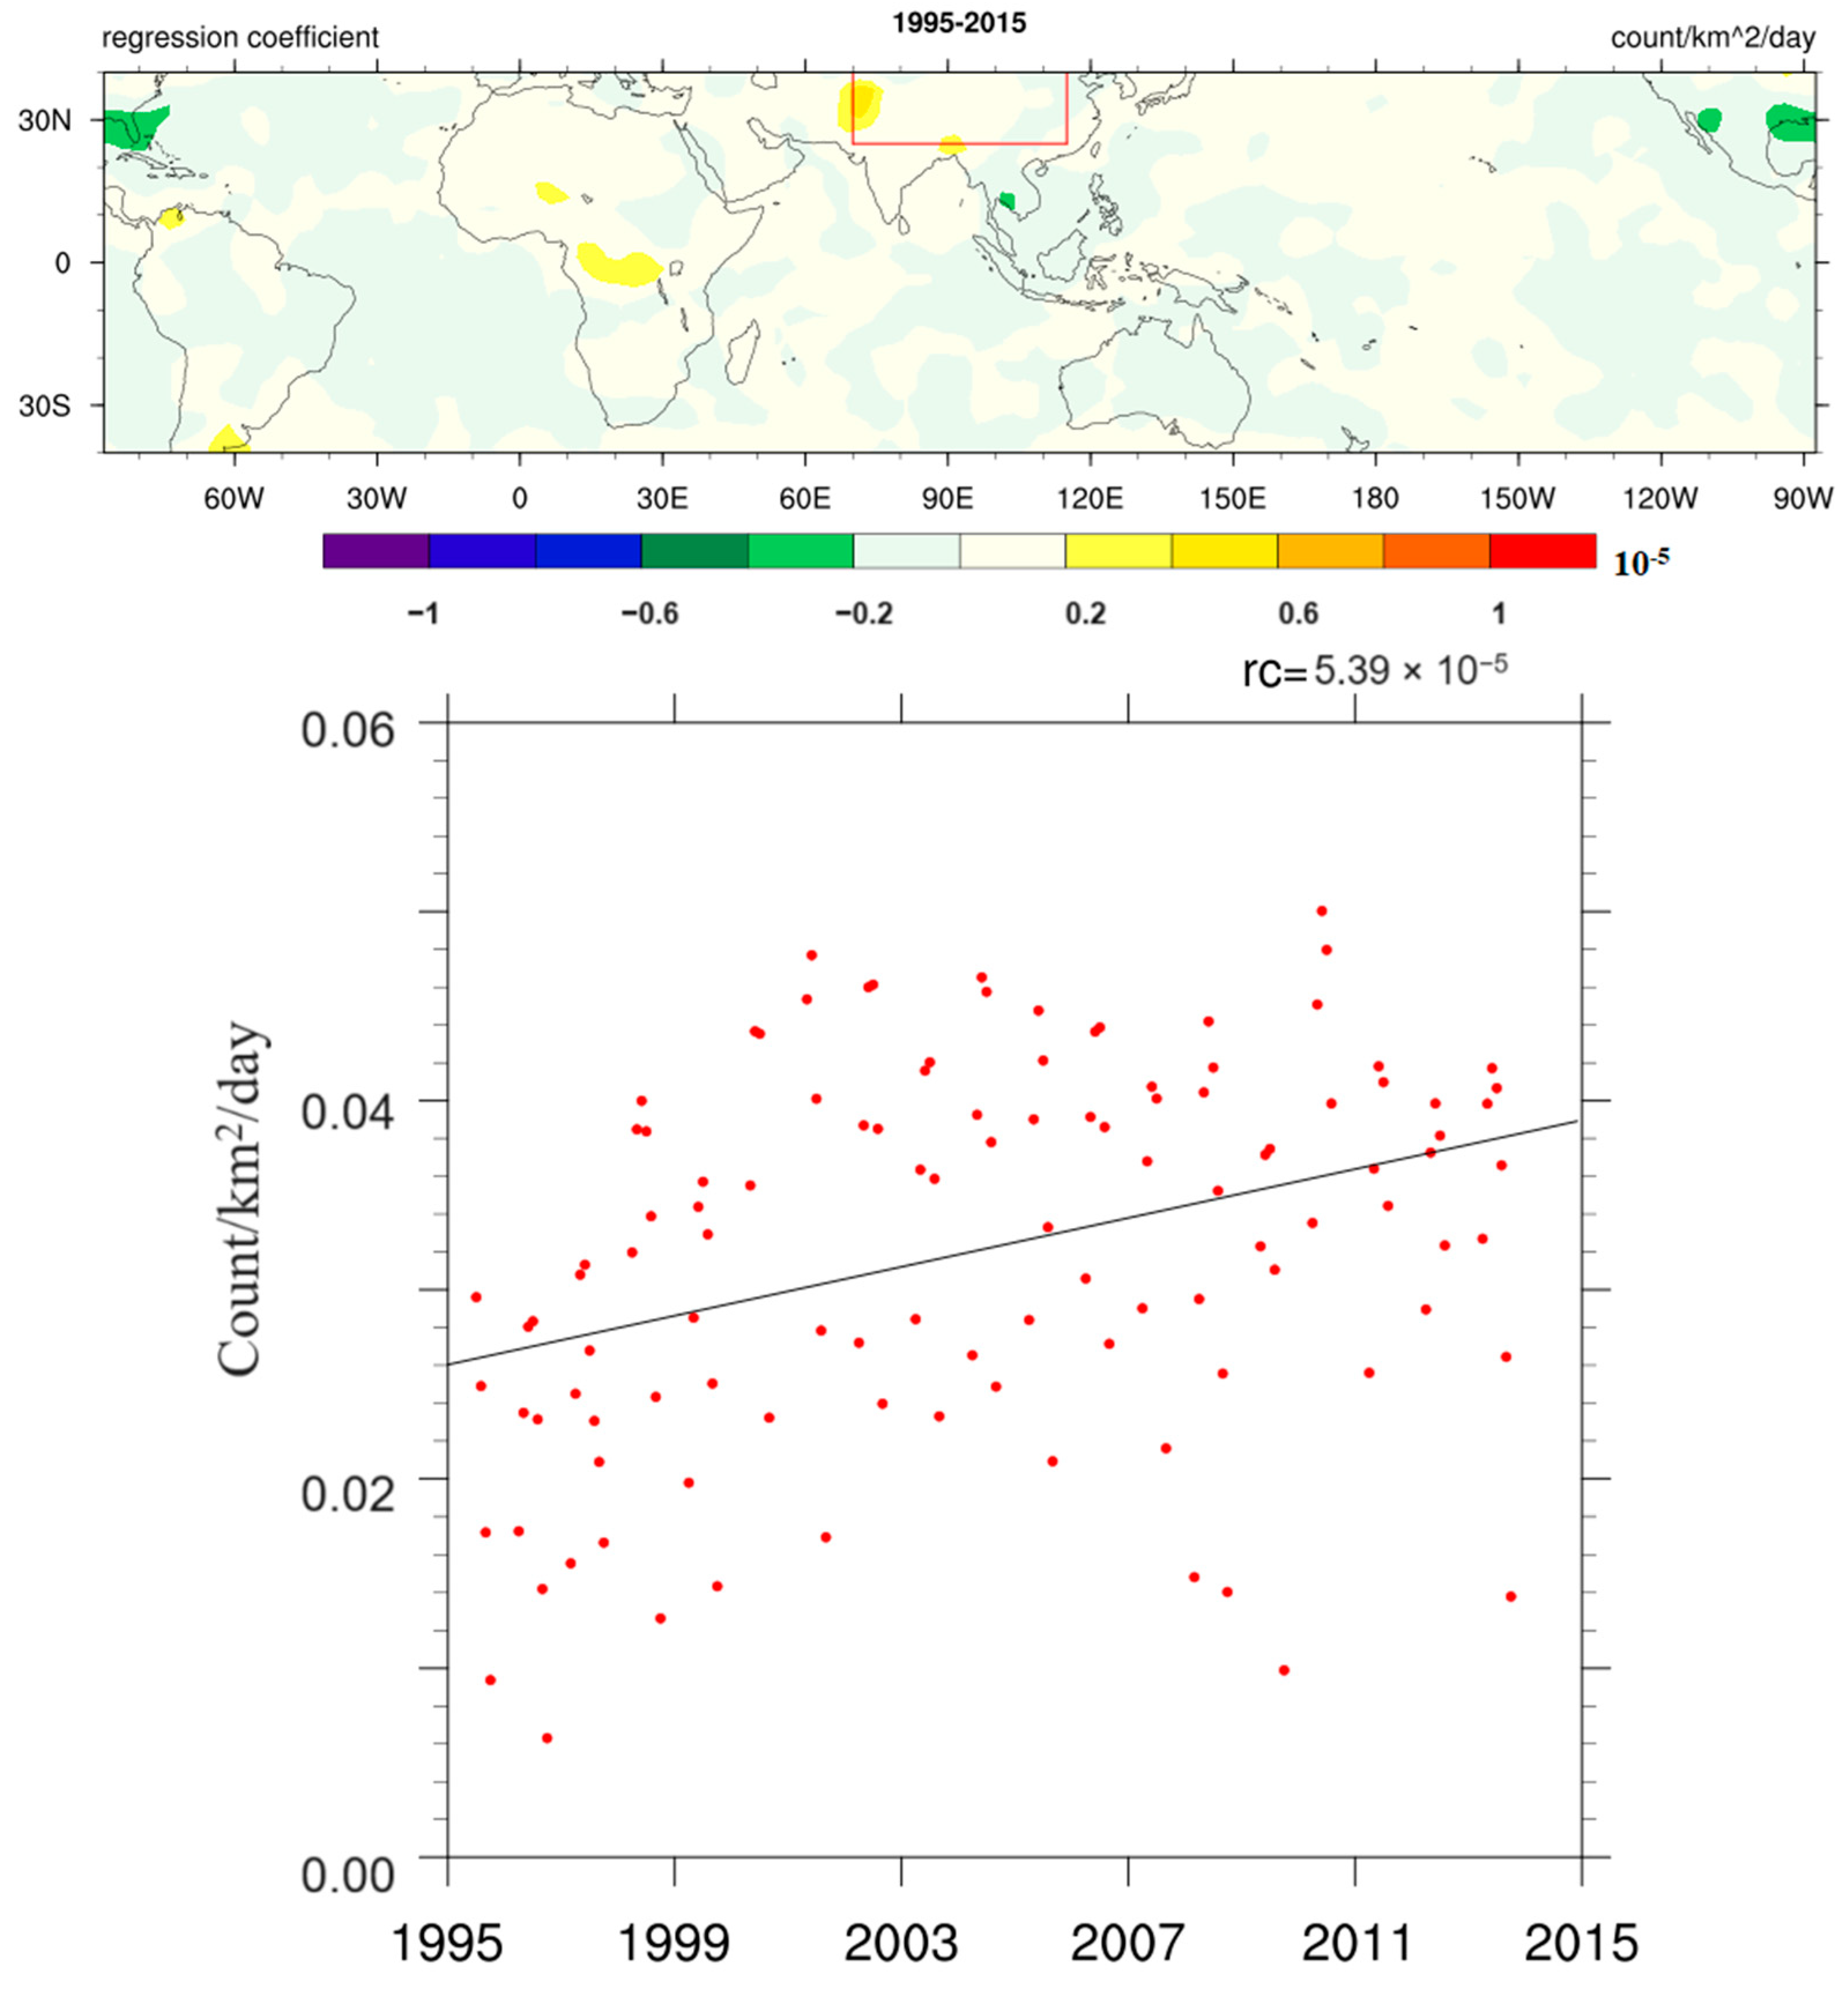
Figure 1 represents the time series regression coefficient (RC) of lightning activity over the TRMM coverage area. Most of the area shows a positive value of the regression coefficient, which means that over the past few years, there was an increase in lightning activity around the coverage area of the TRMM. The Western Himalayan Mountains show a higher value of the regression coefficient (2 × 10
−4 count/km
2/day) in comparison to other parts of the world. The whole Indian subcontinent shows a positive value of the regression coefficient but is significantly lower than the Western Himalayan Mountains. The area’s average lightning activity for the study domain (25°–40° N, 70°–115° E) throughout the study showed a positive value for the RC (5.39 × 10
−5 count/km
2/day). The subdomains’ (
Figure S1 in Supplementary Material) analyses suggest that the trends vary from the Western Himalayan region to the Eastern Himalayan region and in the Tibetan Plateau. The Western Himalayan (WH) subdomain shows the highest increasing trend (6.1 × 10
−5 count/km
2/day), followed by the Central Himalayan (CH) region (5.28 × 10
−5 count/km
2/day), and the Eastern Himalayan (EH) region (3.08 × 10
−5 count/km
2/day). However, the selected domain over the Tibetan Plateau (TP) shows no significant change in the trend (0.001 × 10
−5 count/km
2/day).
In a previous study, under the highest concentration scenario (RCP8.5), the global circulation models (GCMs) showed a substantial increase in convective available potential energy (CAPE) over the tropics and subtropics [
7]. The CAPE ensemble mean from GCMs for the current climate (1981–2000) to the future climate (2081–2100) shows a ~1000 J/kg increase over the Western Himalayan region and up to 500 J/kg over the Indo-Gangetic Plains (IGP) [
7]. The increased value of CAPE indicates a greater possibility of intense and frequent lightning activity over the Western Himalayan region, like what we observed from the lightning climatology trend in
Figure 1. Previous research on the Indian subcontinent has revealed a significant increase in lightning activity over the Western and Eastern Himalayan region (
Figure 1), as well as the eastern coastal region of India [
27], in the last two decades. The study suggested that this increasing trend of lightning activity was contributed to by changes in the surface latent heat flux (SLHF), sea surface temperature (SST), CAPE, and wind shear over the Indian subcontinent. Another long-term analysis of lightning data with respect to thermodynamic variables (CAPE, moisture, wind, etc.) along with aerosol optical depth (AOD) suggested a ~1% per year increase in lightning activity over the Indian subcontinent [
28]. Most of the previous studies over the Indian subcontinent have suggested an increase in the lightning trend, especially over the Western Himalayan region and the Eastern Himalayan region (Brahmaputra Valley). As discussed in
Figure 1, previous studies also showed a maximum increase rate in the Himalayan region and coastal region. This rate of increase varies over the domain depending on the availability of moisture, convection mechanisms, aerosols, etc.
The annual average values of lightning activity from the TRMM showed a significant trend using a linear regression trend test (
p = 0.01), whereas the Mann–Kendall test showed a non-significant trend (
p = 0.07). The significant increase in lightning activity over the selected domain represents a more organized and severe convective process in that region. For the very first time, a one-year-long ICON-CLM simulation at the km-scale was simulated over the HKH and the Tibetan Plateau region (TPR). The km-scale simulation can resolve deep convective processes explicitly without using convection parameterization [
3,
22], which can help to improve the simulation of extreme processes with greater precision compared to low-resolution simulations [
29]. In recent years, the Oceanic Niño Index (ONI) for the period of October 2019 to September 2020 was within the threshold value of ±0.5 °C. This implies less climate variability due to the El Niño–Southern Oscillation (ENSO) during the period of simulation. Previous research has indicated that lightning activity increased and decreased during El Niño and La Niña years, respectively [
30,
31,
32]. A neutral ENSO period suggests a neutral effect of the ocean over the monsoon season and precipitation; therefore, for this study, we preferred to simulate October 2019 to September 2020.
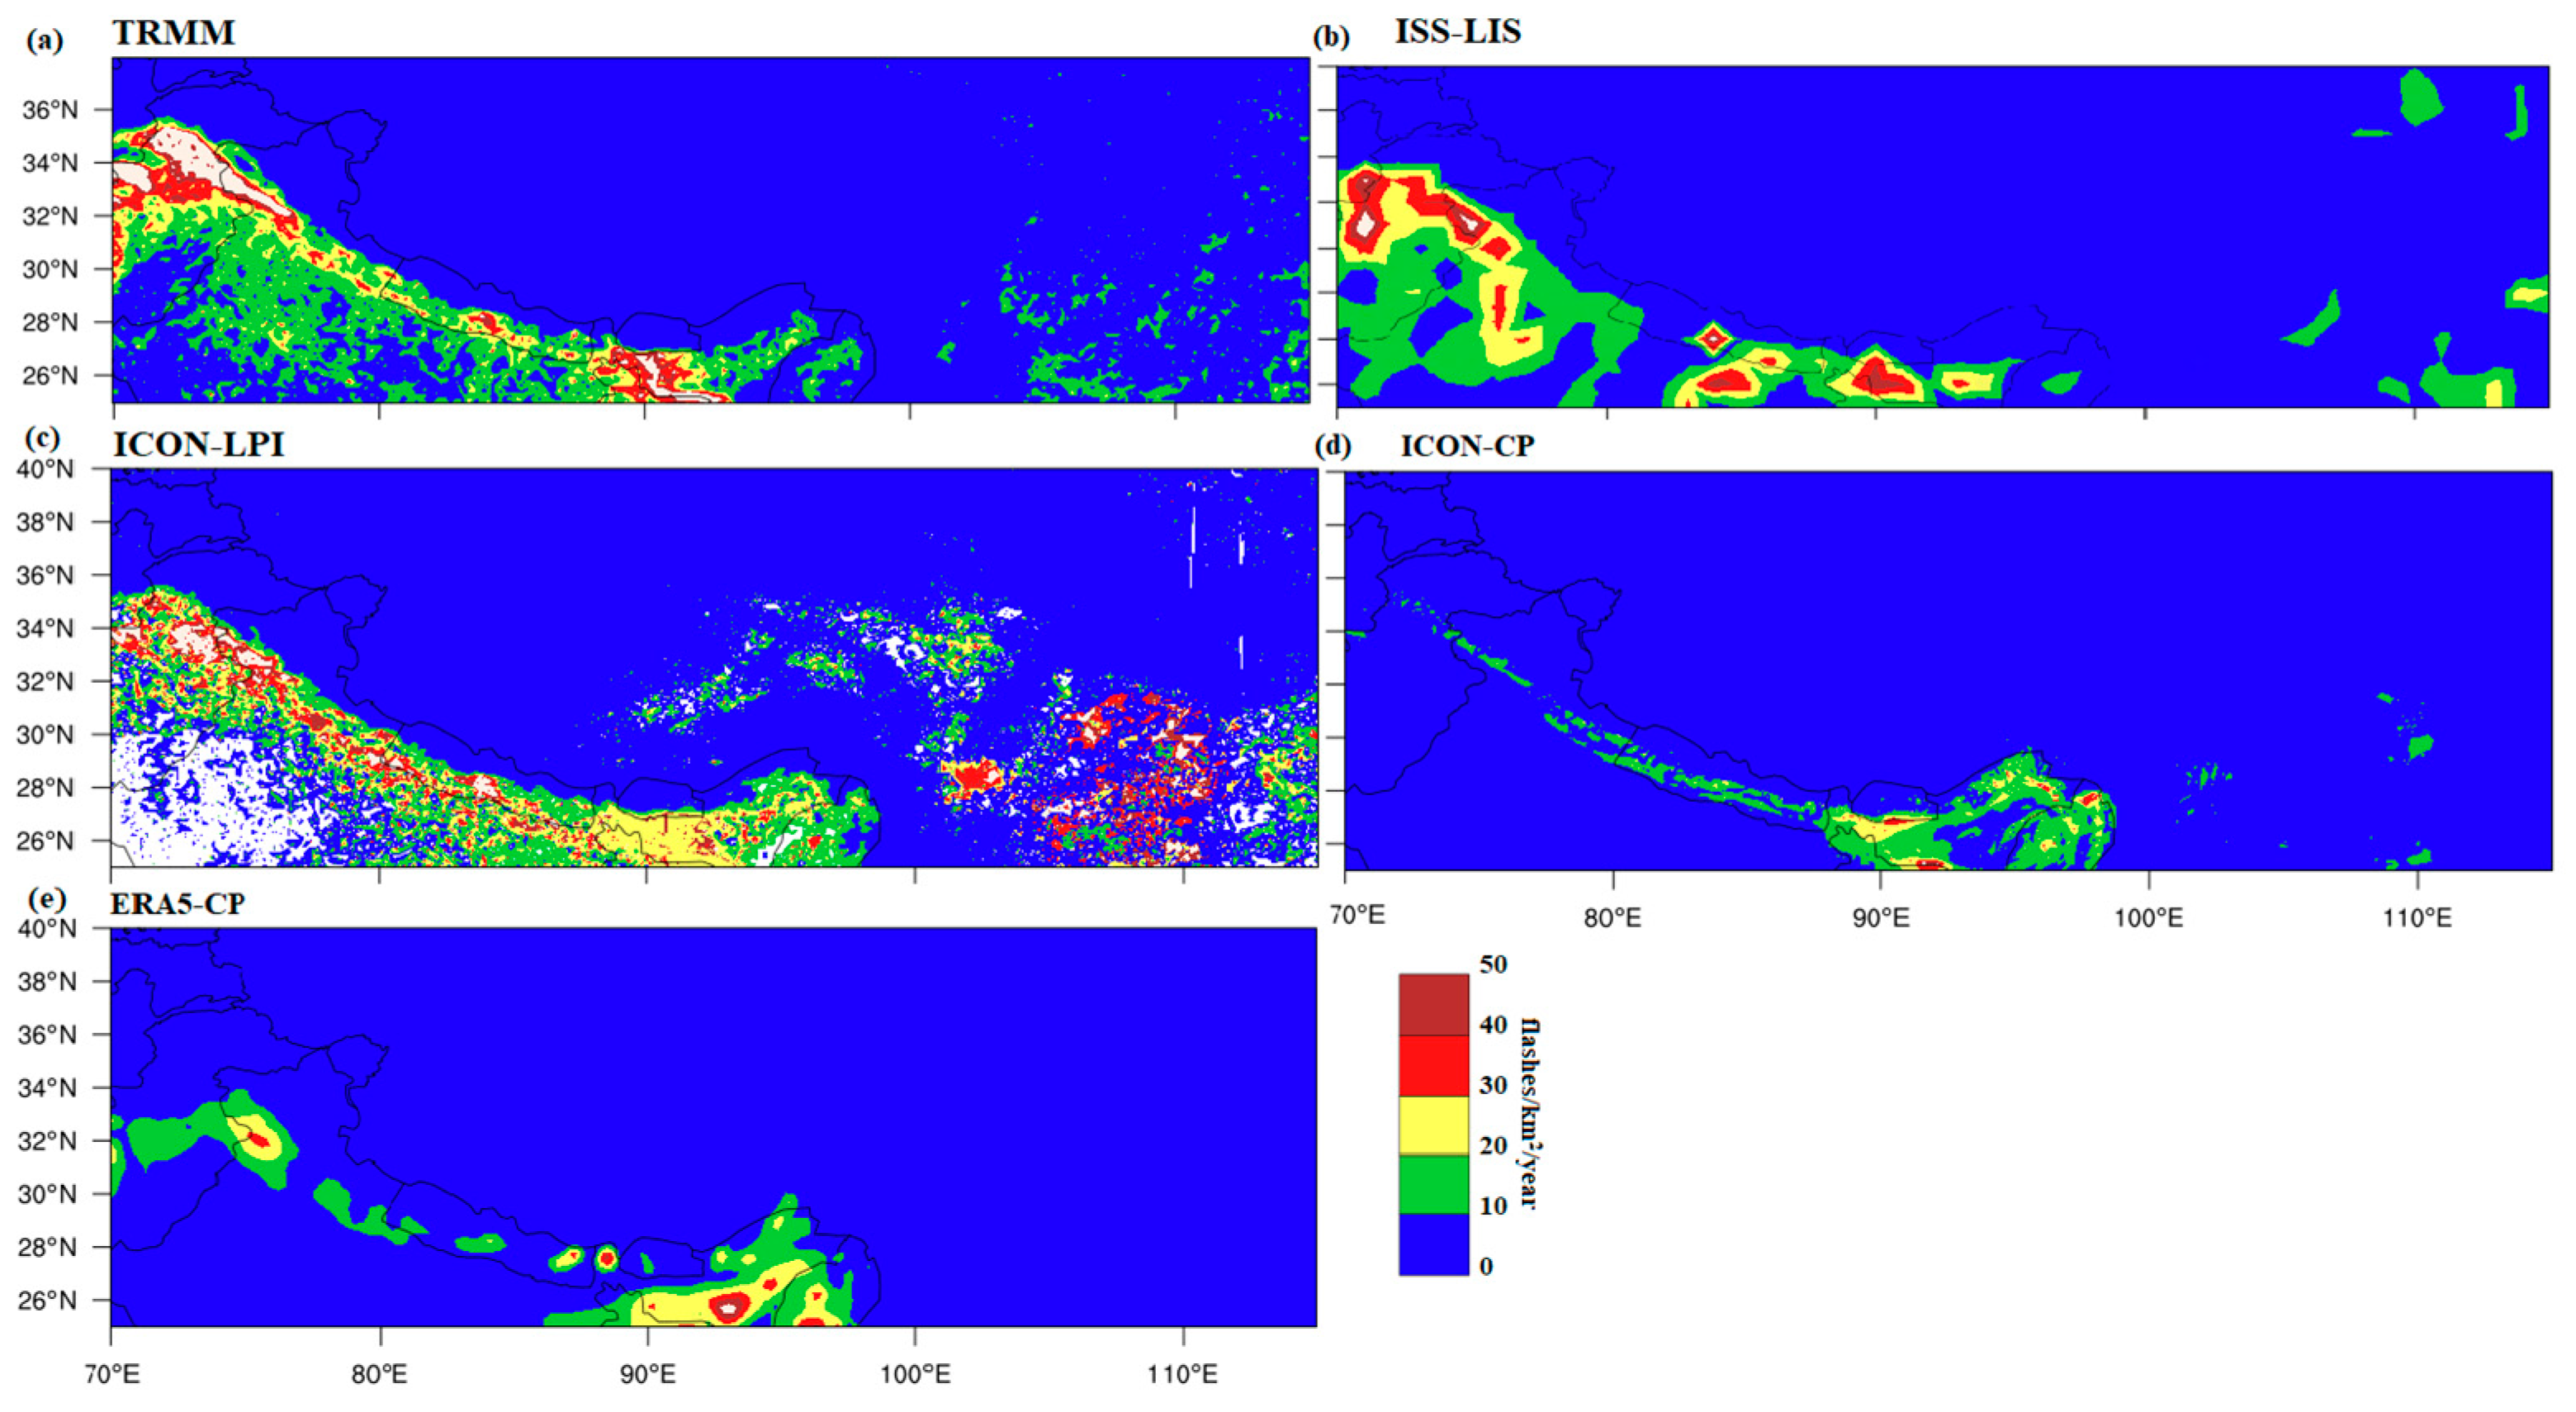
As shown in
Figure 2a, the TRMM climatology in the Himalayan region shows higher lightning activity compared to other regions in the domain. The Western Himalayan region shows more than 50 flashes/km
2/year, followed by the Brahmaputra Valley in the Eastern Himalayan region with 50 flashes/km
2/year. The southern part of the Central Himalayan region also shows significantly higher lightning activity of ~30 flashes/km
2/year.
Figure 2b shows the observed average lightning flashes from October 2019 to September 2020 by the ISS-LIS over the domain. For the qualitative understanding of spatial features from the ISS-LIS data, we averaged all the lightning events observed in the 1° × 1° grid box throughout the domain of study. The ISS-LIS also shows similar hotspots of lightning as TRMM climatology, with higher activity in the Western and Eastern Himalayan regions along with the southern part of the Central Himalayan region. Since a direct comparison was not possible due to the different units and scales of observed lightning flashes and simulated LPI [
11], the adjusted LPI was used for the comparison. The adjusted LPI showed similar spatial features as observed from the ISS-LIS and the TRMM climatology.
Figure 2c shows the ICON-CLM simulated time average adjusted LPI from October 2019 to September 2020 over the domain. The simulation represents similar hotspot regions in the Western Himalayan region, the Central Himalayas, and the Brahmaputra Valley. The ICON-CLM simulated significant lightning over the Central Tibetan Plateau, which is evident in climatology too, though due to scale, it was not that pronounced in
Figure 2a. In previous studies, a 5-year, WWLLN-based, and TRMM-based analysis showed similar spatial features of lightning activity over the study area. Those studies showed higher lightning over the Western Himalayas and foothills, followed by the Brahmaputra Valley and Tibetan Plateau [
28,
33,
34]. Significant variation in lightning activity was reported with an elevation over the Tibetan Plateau region; the ratio of strong lightning activity was reported higher at the TP and the northern HM compared to any other region in the domain.
Figure 2d shows the average CAPE × precipitation (CP) across the domain as derived from the ICON-CLM. The central and eastern Himalayan foothills were identified as lightning hotspots by the CP, but the Western Himalayan region, which is extremely prominent in lightning observation and climatology, is completely missing. The CP from ERA5 shows hotspots in the western and eastern parts of the domain, but these spatial features are quite far away from where the TRMM, ISS-LIS, and adjusted LPI present lightning hotspots (
Figure 2e). All over the domain, the CP has values that are lower than the TRMM climatology. In the region where TRMM climatology indicates a low level of lightning activity, like the Central and Eastern TP, the adjusted LPI shows higher values than the TRMM. However, in the region where the hotspot is located, this trend varies (
Figure S2).
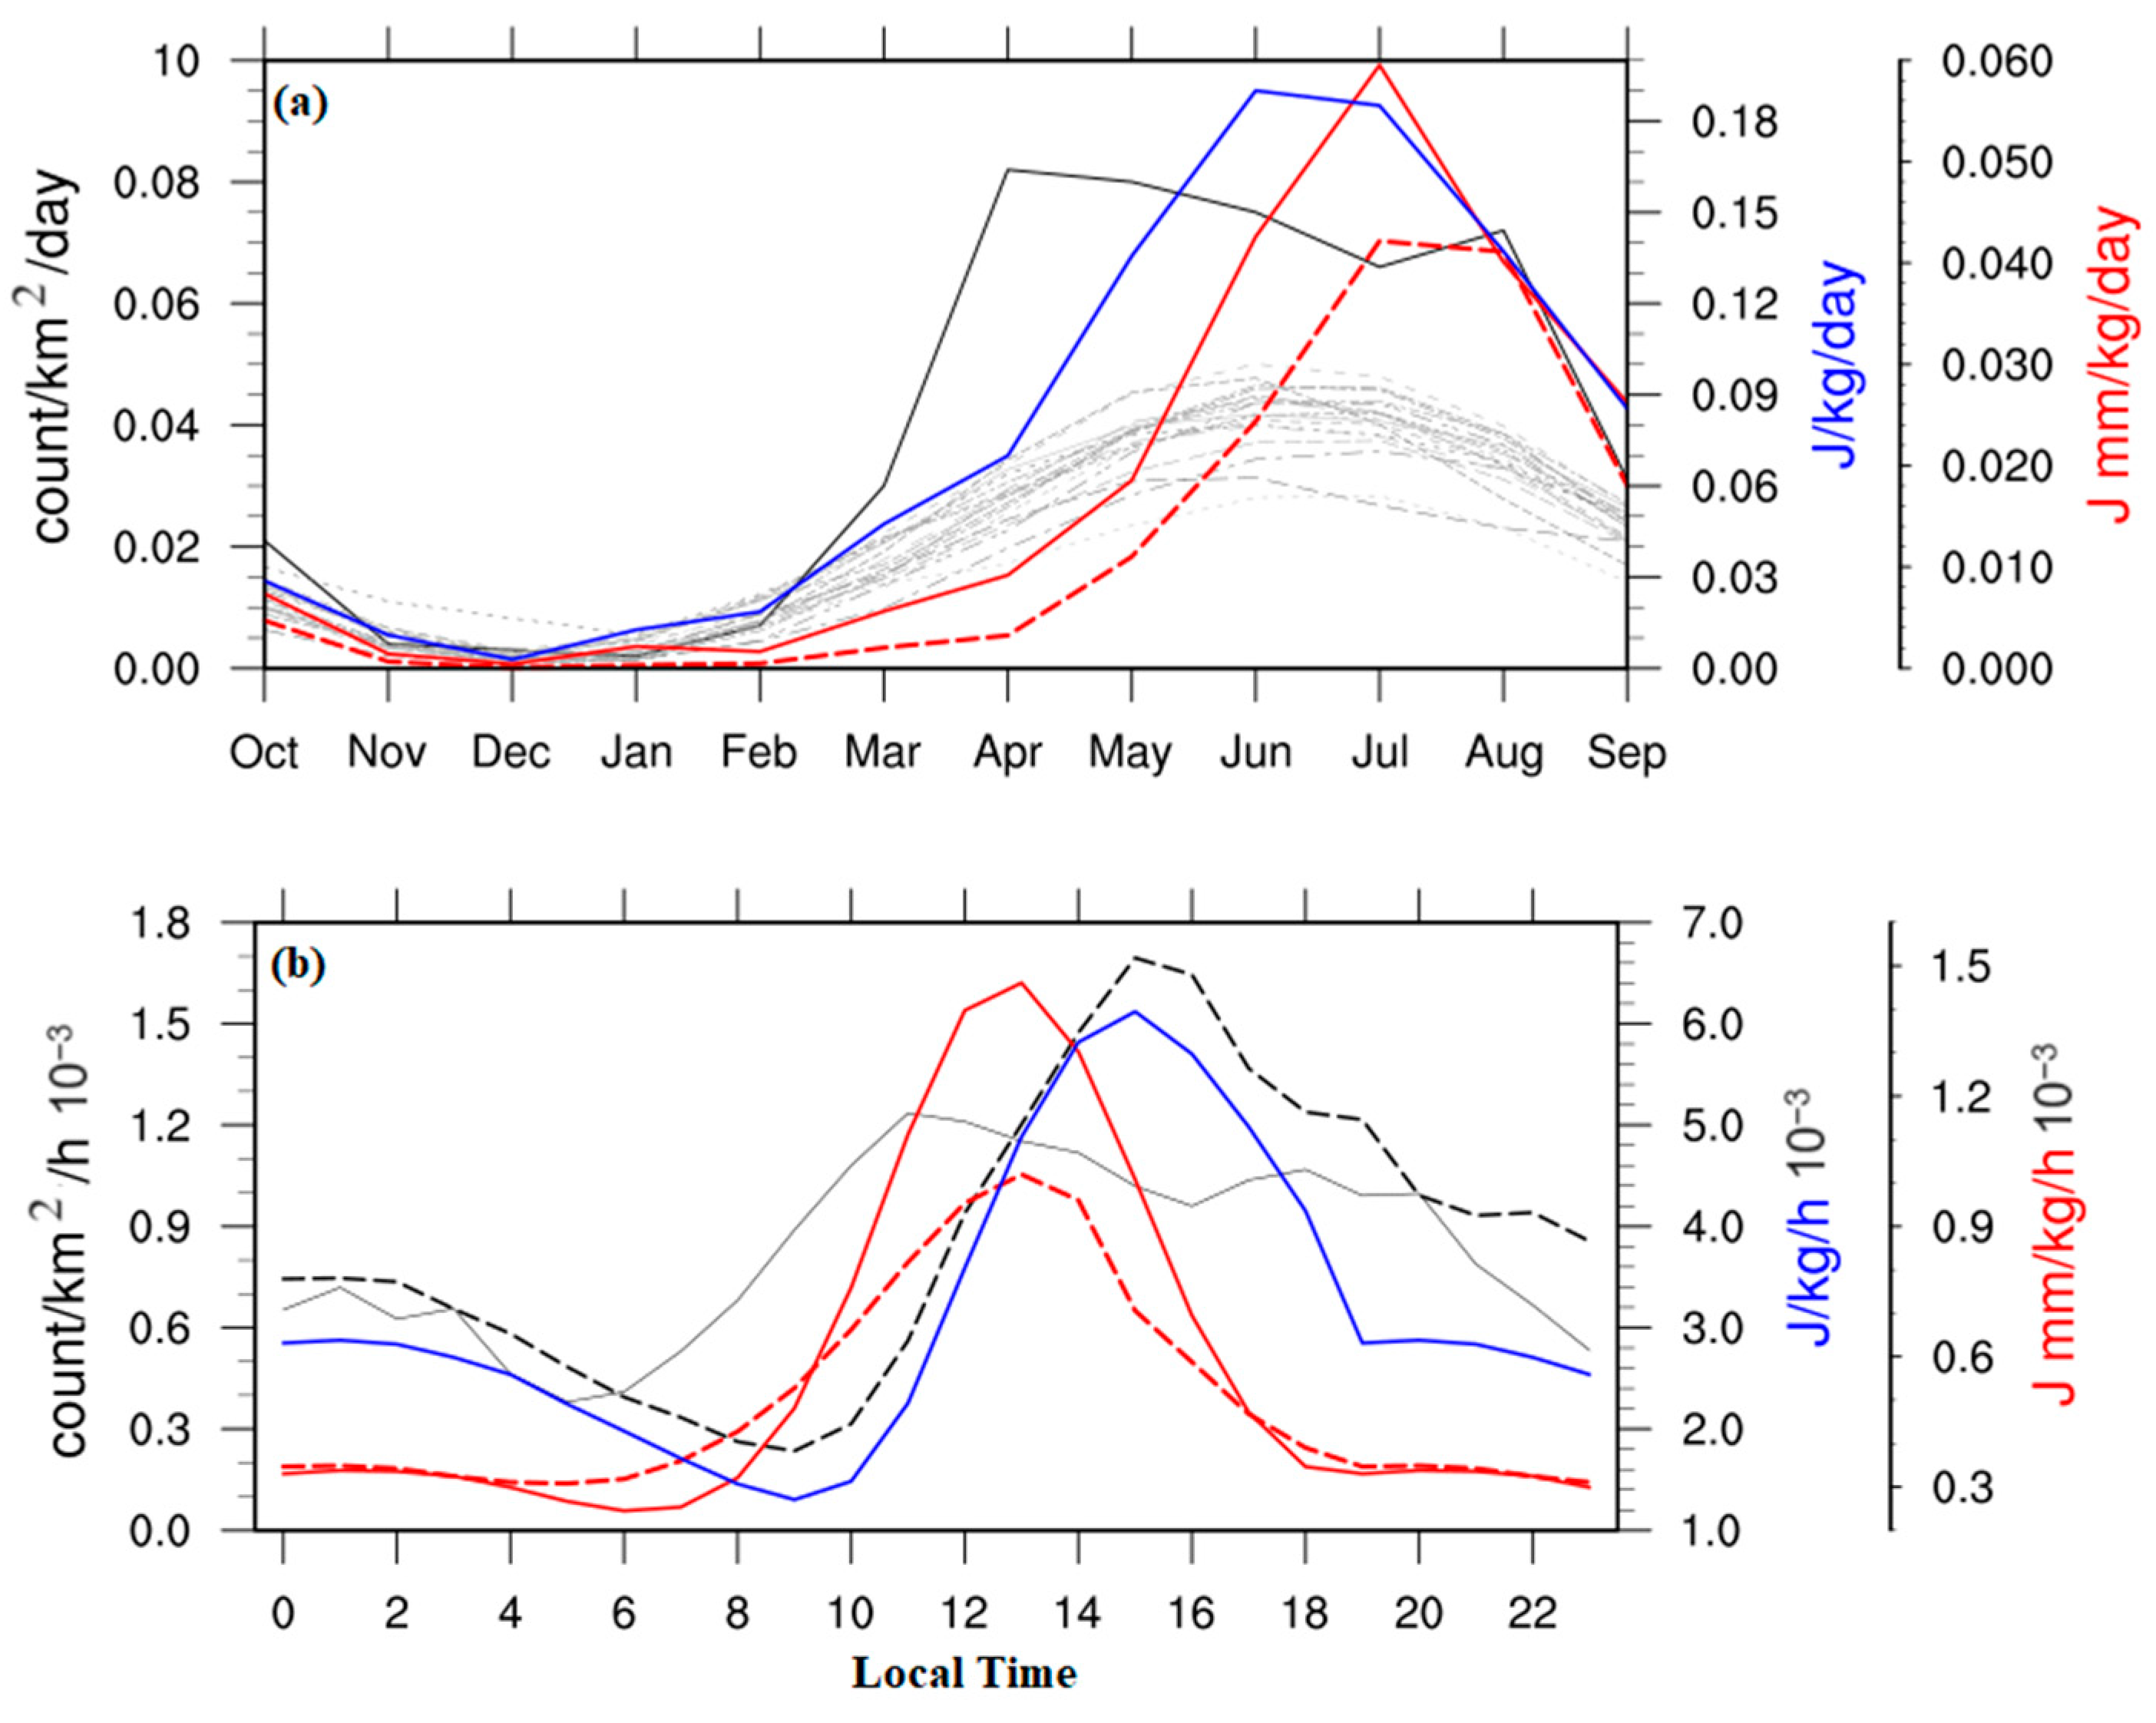
To avoid any bias due to the adjustment technique, we used the LPI and CP in their raw format for the temporal evaluation (
Figure 3). In
Figure 3a, the area averaged monthly means of lightning flash counts from the TRMM from 1996 to 2015 show the lowest lightning activity during the winter months of November–December–January (black dashed), whereas most of the lightning activity was observed during the June–July–August period over the Third Pole region. The ISS-LIS observed lightning activity from October 2019 to December 2020 (black) shows a similar low lightning activity period during November–December–January, but the higher activity period shows a plateau from April to August. Limited observations from the ISS-LIS and the flash count limit in the ISS-LIS might be one of the reasons for such a pattern during the monsoon season. The average value of the simulated LPI shows low lightning activity during November, December, and January (blue), which is consistent with observations and climatology. Like in climatology, the peak lightning activity period was simulated during June and July. Model simulation and observations both show a higher signature of lightning activity during the pre-monsoon months of April and May. Statistically, the monthly LPI values show a slightly higher coefficient of determination (r
2) with the climatology of lightning activity (0.90), compared to the observed (0.72) value over the Third Pole region, where climatology and observed data show a high r
2 (0.93) (sample size (
n = 120)). When we examined the smaller domains, as shown in
Figure S1, the LPI over the Tibetan Plateau (TP) had the highest coefficient of determination with climatology (0.96), while the Central Himalayan region had the lowest (0.81). Similar relations are observed between the LPI and observed flash counts; the TP shows a higher value of the coefficient of determination (0.94), and the Central Himalayan region shows the lowest (0.62). Unexpectedly similar coefficients of determination are present between the observations and climatology; the TP shows a higher value (0.91) and the Central Himalayan region shows the lowest (0.72) (
Table S1). The significant bias in observation and simulation, as well as in observation and climatology, over the Central Himalayan region is due to a lack of satellite observation. The average value of the CP (red) shows a peak during July, whereas in other months, especially during the pre-monsoon, it shows the lowest activity, contrary to lightning climatology, observations, and the simulated LPI. The CP peak typically coincides with the seasonal convection peak over the region during July–August [
35], as represented by the ERA5 CP (red dashed curve). This indicates that the LPI represents a more realistic lightning peak during the pre- and early-monsoon periods.
Further analysis of subdomains suggested different domains have peaks of lightning activity in different months. TRMM climatology suggested the TP faces maximum lightning activity in June–July [
31]. The model-simulated LPI also showed a peak in June. In addition, the simulated CP and ERA5 CP showed peaks in similar months. Previous research in the TP region using WWLLN and TRMM yielded different results. The TRMM had a peak in June–July, whereas the WWLLN had a peak in August–September [
36]. The authors argue this variation may be due to the WWLLN’s higher efficiency in cloud-to-ground lightning detection. Toumi and Qie (2004) discovered a June–July lightning peak using TRMM lightning data; further analyses from reanalyzed data show that pre-monsoon lightning over the TP is driven by sensible heat, whereas monsoon lightning is driven by the CAPE, and total heat flux over the region showed a similar peak as lightning activity [
37]. Another study over the TP using WWLLN data showed a shift in lightning peaks from July to September as elevation increased [
33]. All the previous studies have suggested a winter or post-monsoon period with the lowest lightning events over the TP, which was also replicated in the model simulation.
Lightning peaks in the western Himalayan domain occur in June–July; the LPI showed similar peaks in June–July, with a small increase in activity during the pre-monsoon period. Surprisingly, this small peak during the pre-monsoon matches an early spike presented in the CP (ICON and ERA5) during March. A few years of the lightning climatology data show this kind of pre-monsoon increase in lightning activity. The CP from both ICON and ERA5 showed a sharp peak during July–August, which coincided with the right tail of lightning climatology and the LPI curve. Previous TRMM-based studies showed a lightning peak during June–July over the WH domain [
34,
38]. Most research has suggested that when the northwestern monsoon transports moisture from the Arabian Sea (AS) that meets westerlies at WH slops, it creates a strong updraft that results in a lightning cloud over the WH region. In addition, terrain with a higher slope or higher elevation was reported to have a higher potential for lightning in the WH region [
39]. Over the Central Himalayas, a peak of lightning activity was recorded during May in the TRMM lightning climatology as well as the LPI. The LPI also presented a smaller peak during July, which matched perfectly with the CP (ICON and ERA5) peak. Unlike the TP, in previous studies, TRMM-based and WWLLN-based analyses over Nepal showed a similar lightning peak during May [
40]. During the summer, heating of the atmosphere in the south of the CH (Terai) region amplifies atmospheric instability due to orographic lifting, resulting in deep convective events in that region [
34]. Previous studies using the orographic moisture flux (OMF) and evapotranspiration showed that orographic lifting influences precipitation significantly [
3,
41,
42]. Trapero et al. (2013) argued that the OMF values were high in a conditionally unstable environment (high CAPE) [
42]. Therefore, using CP as a lightning predictor can be useful for capturing a mesoscale convection and its interaction with orography, as reflected in
Figure 3a.
According to lightning climatology and the ICON-CLM LPI, the Eastern Himalayan region experiences its highest lightning activity between April and May. Higher lightning activity over the EH region during the pre-monsoon season was reported in previous studies too. Contrary to the lightning climatology of observed lightning, the CP (ICON and ERA5) showed a higher lightning peak from May to July. During the pre-monsoon season, warm air leads to convection in this region; in addition, westerlies and moisture from the Bay of Bengal provide favorable conditions for thunderclouds [
34]. In the EH region, more lightning was reported in the lower area below a 500 m elevation, whereas in the WH region, higher elevations of 1000–2000 m showed high lightning [
39]. Except for the Central Himalayan region, all other subdomains experience the least amount of lightning activity in December.
On average, the hourly lightning count from TRMM lightning climatology (black dashed curve) shows a peak in the afternoon over the domain of study (
Figure 3b). The ISS-LIS observational data show a plateau peak structure of lightning activity that begins at early noon and lasts until late afternoon (black curve). This is because the upper observational limit of the ISS-LIS was limited to 99, resulting in a plateau structure. The simulated LPI (blue curve) shows a similar peak in the afternoon as observed in climatology. The average value of lightning flashes from the climatology over the domain of study shows a good coefficient of determination (
n = 240) with the simulated value of the LPI (r
2 = 0.89). According to subdomain analysis, these values are quite low in the TP region (0.14) and very high in the Eastern Himalayan region (0.89). At the diurnal scale, TRMM lightning climatology had a very low r
2 (0.26) with the ISS-LIS observed hourly flash count over the domain. The coefficient of determination between observation and climatology was even lower in the TP region (0.13) but significantly higher in the Central Himalayan region (0.65). The coefficient of determination for the observed flash count from the ISS-LIS was low (r
2 = 0.25), but the coefficient of determination over the TP region was quite high (0.84) and higher in another subdomain (
Table S2). The simulated CP (red curve) and ERA5 CP (red dashed curve) show a diurnal peak during the pre-afternoon period, which is earlier than the LPI and climatology peak in the region. The ICON and ERA5 CP peak in afternoon agrees with the ERA5 convective available potential energy diurnal peak [
43].
Diurnal analysis from the LPI and climatology suggests a sharp afternoon peak during afternoon time over the TP region (12–4 LT); the CP from both the ICON-CLM and ERA5 shows an early peak of lightning (10–12 LT). Meanwhile, the Western Himalayas show two peaks: a higher peak during late afternoon (14–18 LT) and another lower one during early morning (00–04 LT). The CP from both the ICON and ERA5 shows two peaks over the WH region: a higher peak slightly earlier than LPI (12–14 LT) and another one that matches the LPI. Similarly, two peaks were simulated and present in climatology over the Central Himalayan region, which were less intense than in the Western Himalayas. However, over the CH region, the CP from both the ICON and ERA5 were not able to reproduce the early morning peak.
The Eastern Himalayan region showed a slightly opposite trend from the Central and Western Himalayan regions. The higher peak over the Eastern Himalayan region was in the nighttime to early morning time (22–02 LT), and another smaller peak was present during the afternoon time (12–14 LT). The CP from the ICON was able to produce a second peak over the EH region during the early morning as the LPI, but the ERA5 CP showed very low values. According to Kumar and Kumar (2021), the majority of the Himalayan region (EH, CH, and WH) has a bi-modal diurnal cycle, with a higher peak in the afternoon and a lower peak in the early morning, whereas the TP has a mono-modal diurnal pattern, with a single peak in the afternoon [
34].
The TRMM lightning climatology of diurnal convection over the TP suggests a mono-modal peak during the afternoon associated with surface heating over the region [
44,
45]. The Indian subcontinent shows a similar convection pattern to the TP during the afternoon, with an additional peak during the evening. This justifies the observed and simulated mono-modal and bi-modal diurnal patterns over the TP and the Himalayan region, respectively. Since lightning flashes are highly correlated with surface temperature, CAPE, and moisture flux, diurnal variation is strongly dependent on the diurnal pattern of these factors. Most of the afternoon peaks correlate with high surface temperatures and CAPE, whereas the late-night peaks during the monsoon are related to moisture flux uplifted through orography over the Himalayan ranges.
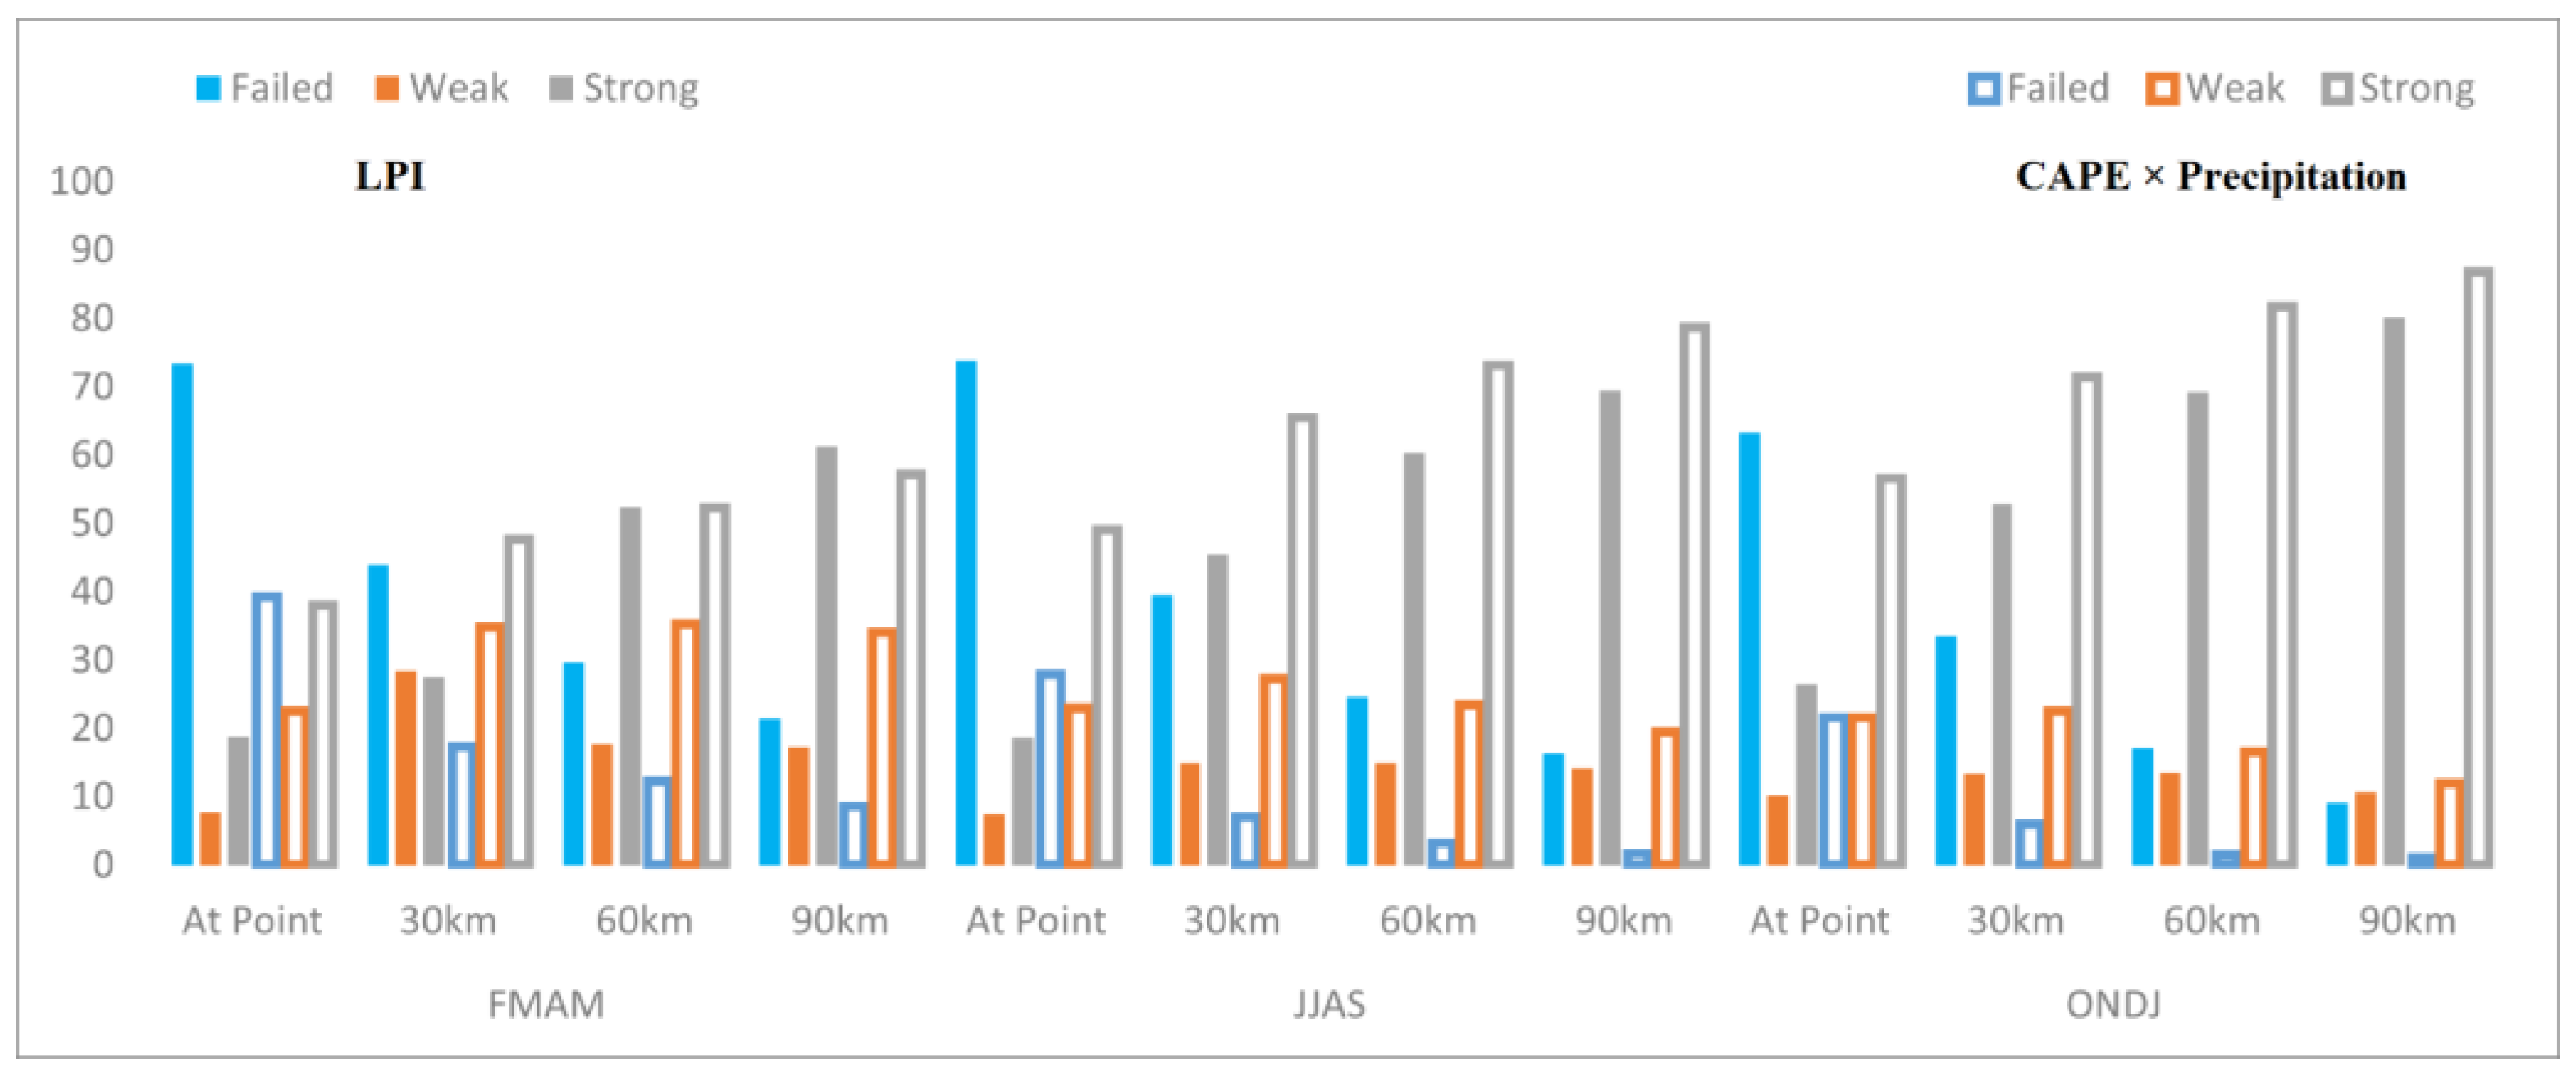
When we compared lightning patterns from TRMM lightning climatology, ISS-LIS observations, and other studies, the ICON-CLM-simulated LPI did well at average spatial and temporal (seasonal and diurnal) scales. Furthermore, we wanted to look at the performance of the LPI and adjusted LPI from event-to-event observed lightning activity by the ISS-LIS from October 2019 to September 2020. The ISS-LIS observed 41,000 events, which added up to more than 3.6 million flashes during the study period, because each observed event showed LFDI values between 10 and 99. We compared the LPI at each grid point with the observations from the ISS-LIS. During the pre-monsoon period (FMAM), the model failed to produce lightning potential (LPI = 0) for more than 73% of events at the grid level. Since lightning activity is linked to convective clouds, we tried to perform all the calculations within a certain amount of time (2 h) of the event, as suggested in the ICON-CLM evaluation [
46]. At the grid level, the simulation only caught 18% of events, and 7% of the time, the model simulated a very weak signal of the LPI (<0.5 J/kg). The success rate went up to 27.57%, 52.47%, and 61.26%, respectively, when the average of all the points within 30 × 30 km
2, 60 × 60 km
2, and 90 × 90 km
2 of the point of observation was considered. From 30 × 30 km
2 to 90 × 90 km
2, there was also a significant change in the weak cases: 28.56%, 17.75%, and 17.30%. During the monsoon season (JJAS), the model showed similar results at grid points but showed an increase at 90 × 90 km
2 (
Figure 4). The model-simulated LPI showed good results during the post-monsoon period (ONDJ) at the grid level, where the model was able to produce a significant LPI for 26%, and this number went up to 80% at 90 × 90 km
2 spatial coverage. Lynn and Yair (2010) suggested that an LPI area averaged over 36 × 36 km
2 demonstrated good results [
2]. ICON-CLM simulation over the European region reported in the previous study showed an area average LPI over 20 × 20 km
2 with good results [
46]. The ICON CP performed quite better than the LPI when we considered the grid point observation of lightning events. As we considered more neighboring points around the observed event, this difference between the CP and LPI reduced significantly.
When all grids within 90 × 90 km
2 of the observed lightning events were considered, the model produced some LPI signature events. These values varied from very low (<0.5 J/kg) to two-digit numbers, but mostly they were not comparable to the observed flashes directly. On the other hand, the observed upper flash density index was also limited to 99. Due to the inconsistency of the observation data, adjusting the LPI value to observe flash counts like in the previous studies by Brisson (2021) and Schroder (2022) was not possible [
11,
46]. Therefore, we used the standardized value of the LPI as discussed in Equation (1) and adjusted the values of
to the observed flash count using the linear factors in Equation (2). We considered all the events up to a count of 80 flashes from the ISS-LIS observation. In
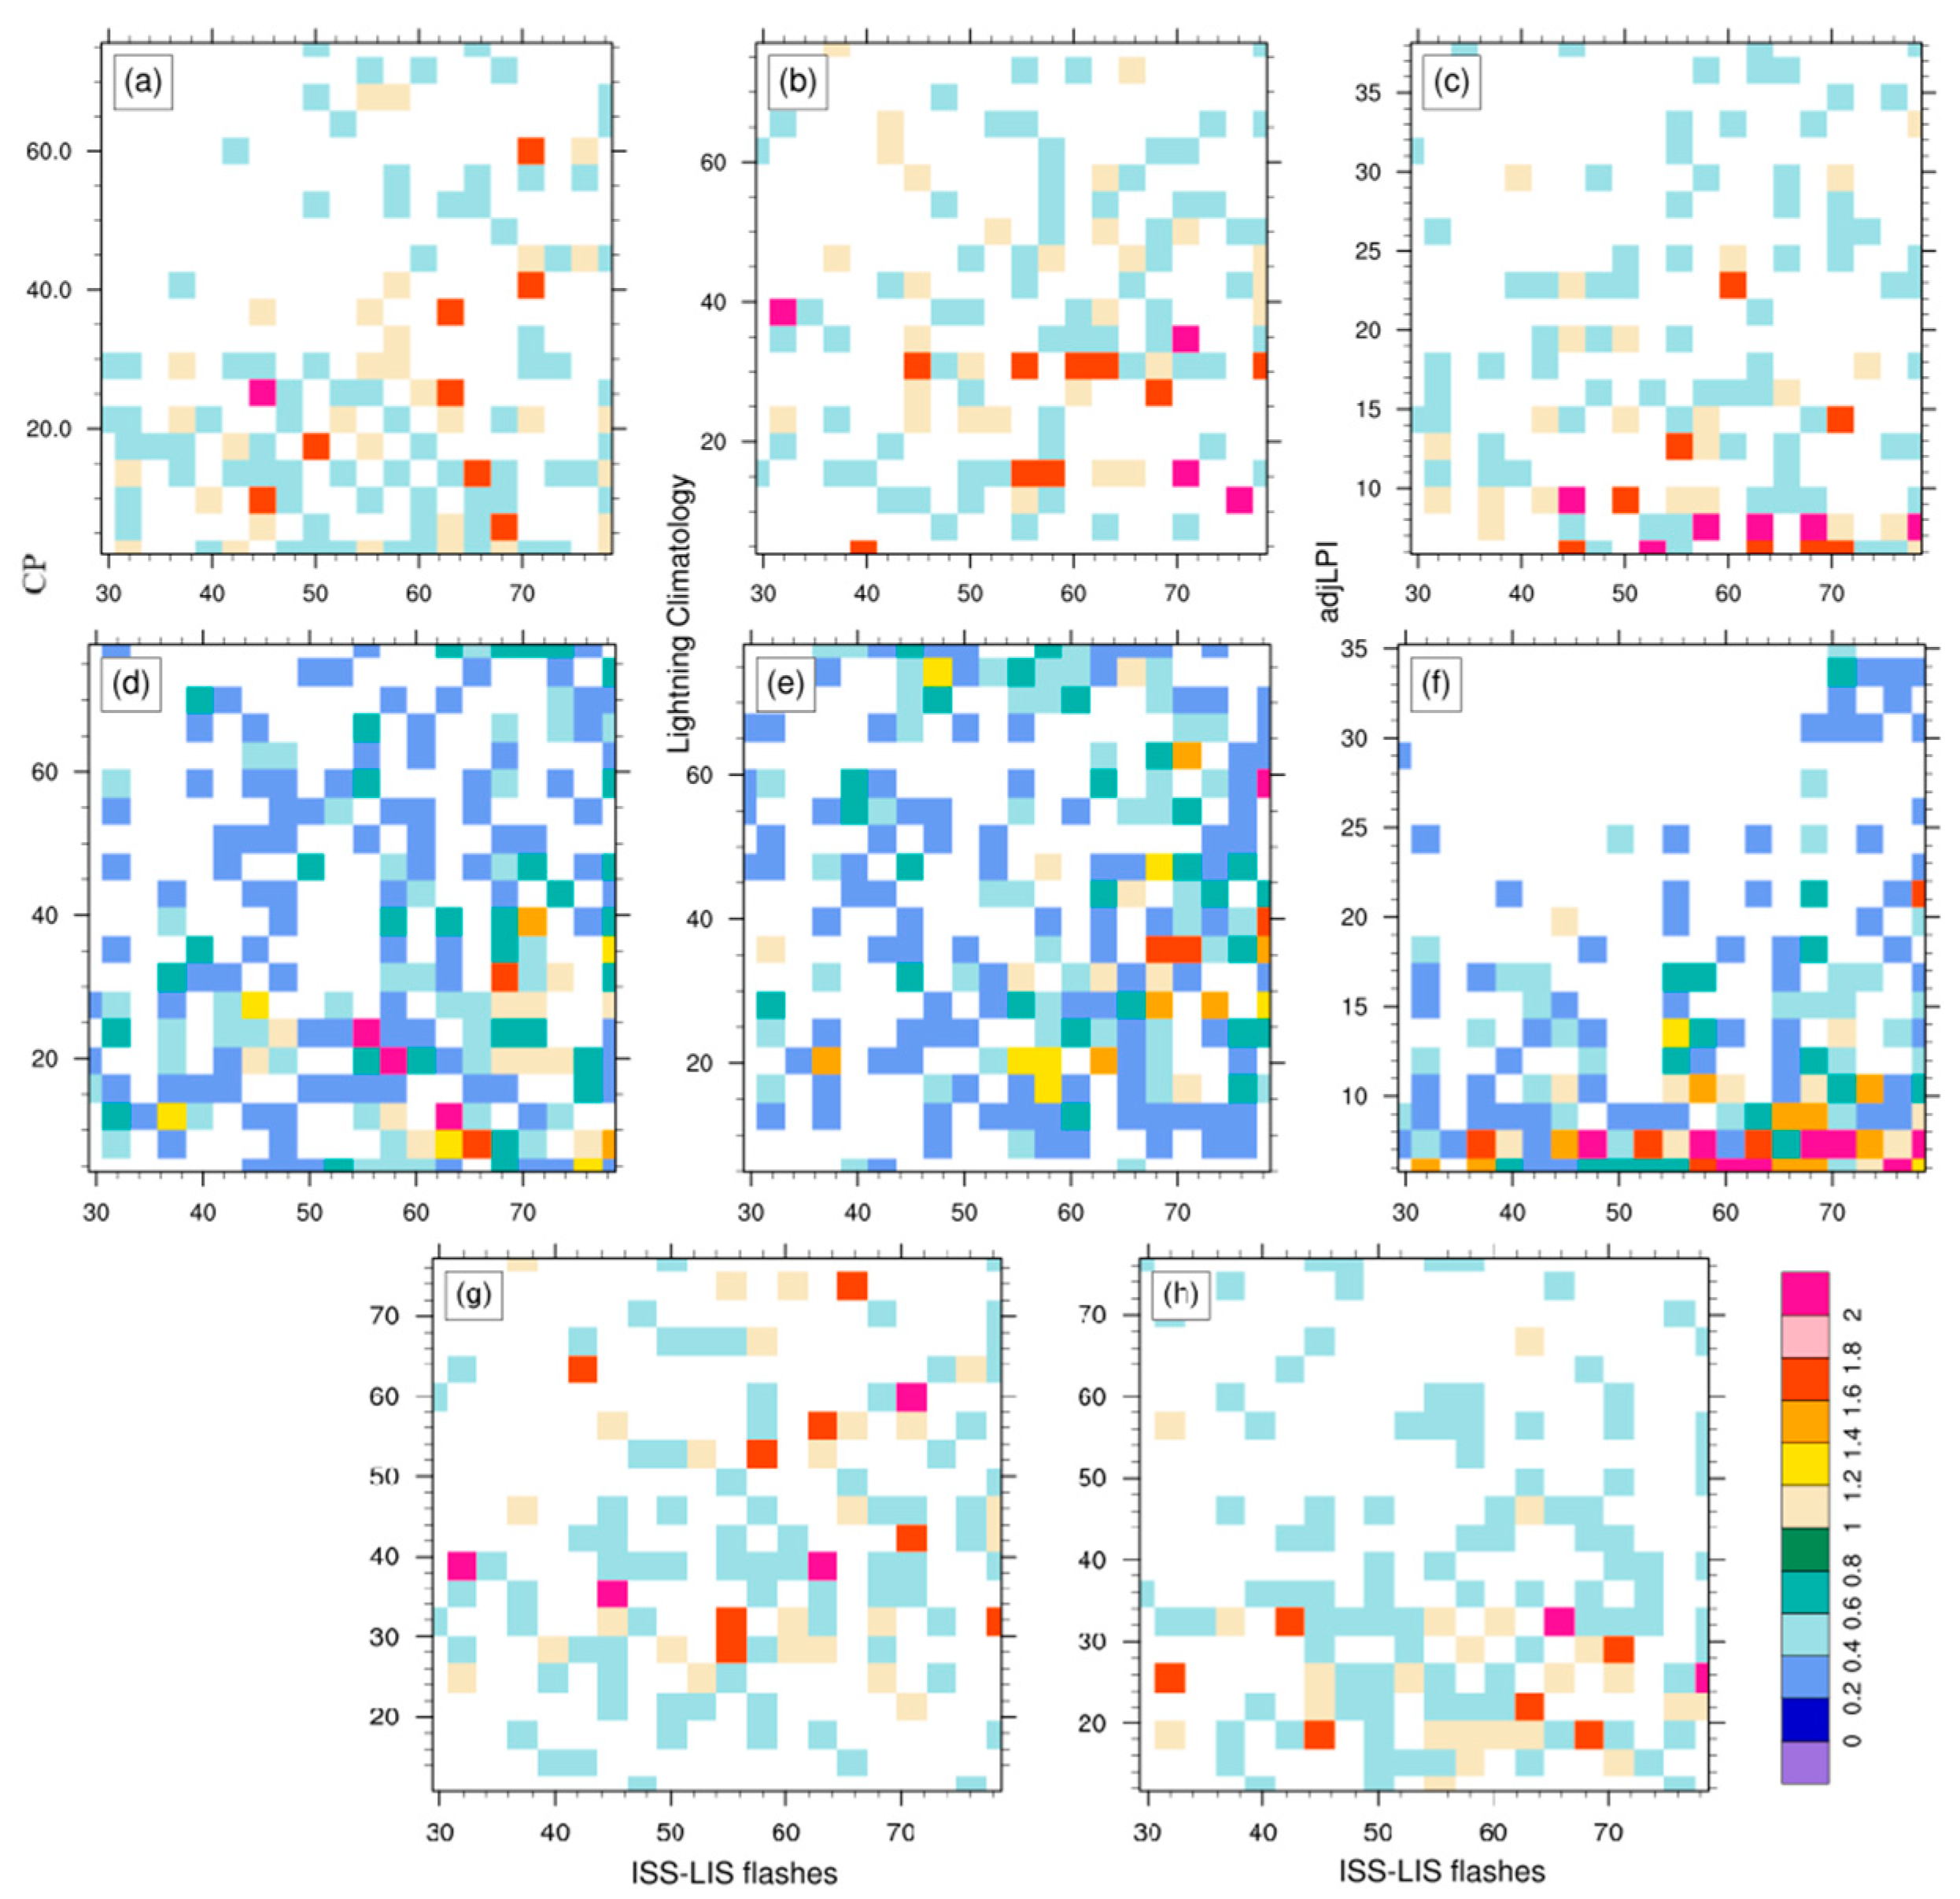
Figure 5, the warm colors (red and orange) indicate regions of higher probability density, while the cool colors (blue and green) indicate regions of low probability density. The relationship between the joint probability distribution function (PDF) of the adjusted LPI and ISS-LIS flashes for respective events is shown in
Figure 5c. The greater the PDF value, the greater the likelihood of a flash count reproduced in model. The results suggest a higher coefficient of determination between the adjusted LPI and flash counts and a higher PDF (>0.5) for the observed flash counts above 50 and the adjusted LPI below 50. While the CP values for specific events show a skewed relationship with observed flashes (
Figure 5a), the TRMM lightning climatology shows a similar coefficient of determination and PDF with respect to observations (
Figure 5b).
When we considered all the points within 90 × 90 km
2 of the observed event location (grid), as suggested in
Figure 4, the model produced a reasonable value of the LPI.
Figure 5d suggests a higher coefficient of determination between the CP and flash counts, with a higher PDF (>0.5) for the observed flash counts above 50 and a lower value of the adjusted LPI below 30 (
Figure 5f). Major events show a low coefficient of determination and a low value of the PDF for the observed events. Lightning climatology also shows a good coefficient of determination with respect to observed events (
Figure 5b,e). This implies the CP performance was better in terms of flash counts compared to the adjusted LPI.
The ICON-CLM at km-scale was able to produce the signature events of lightning for most of the observed events. Grid-scale analysis concerning point of observation shows high PDF values due to the high intensity associated with the grid points (
Figure 5c), whereas when we considered all the points within 90 × 90 km
2, the detection frequency of cases increased but the PDF value decreased. Meanwhile, the CP shows a better probability distribution concerning observations (
Figure 5a,d). In addition, when we considered the higher value of either the CP or LPI according to the climatology of the region for each of the observed events, the combined CP and LPI from the ICON-CLM showed a higher coefficient of determination with observed events (
Figure 5g) at the grid point whereas the coefficient of determination decreased when we considered 90 × 90 km
2 around the observed events (
Figure 5h). Therefore, considering the CP and LPI together for lightning prediction in the Third Pole region can be a better option than considering them separately.
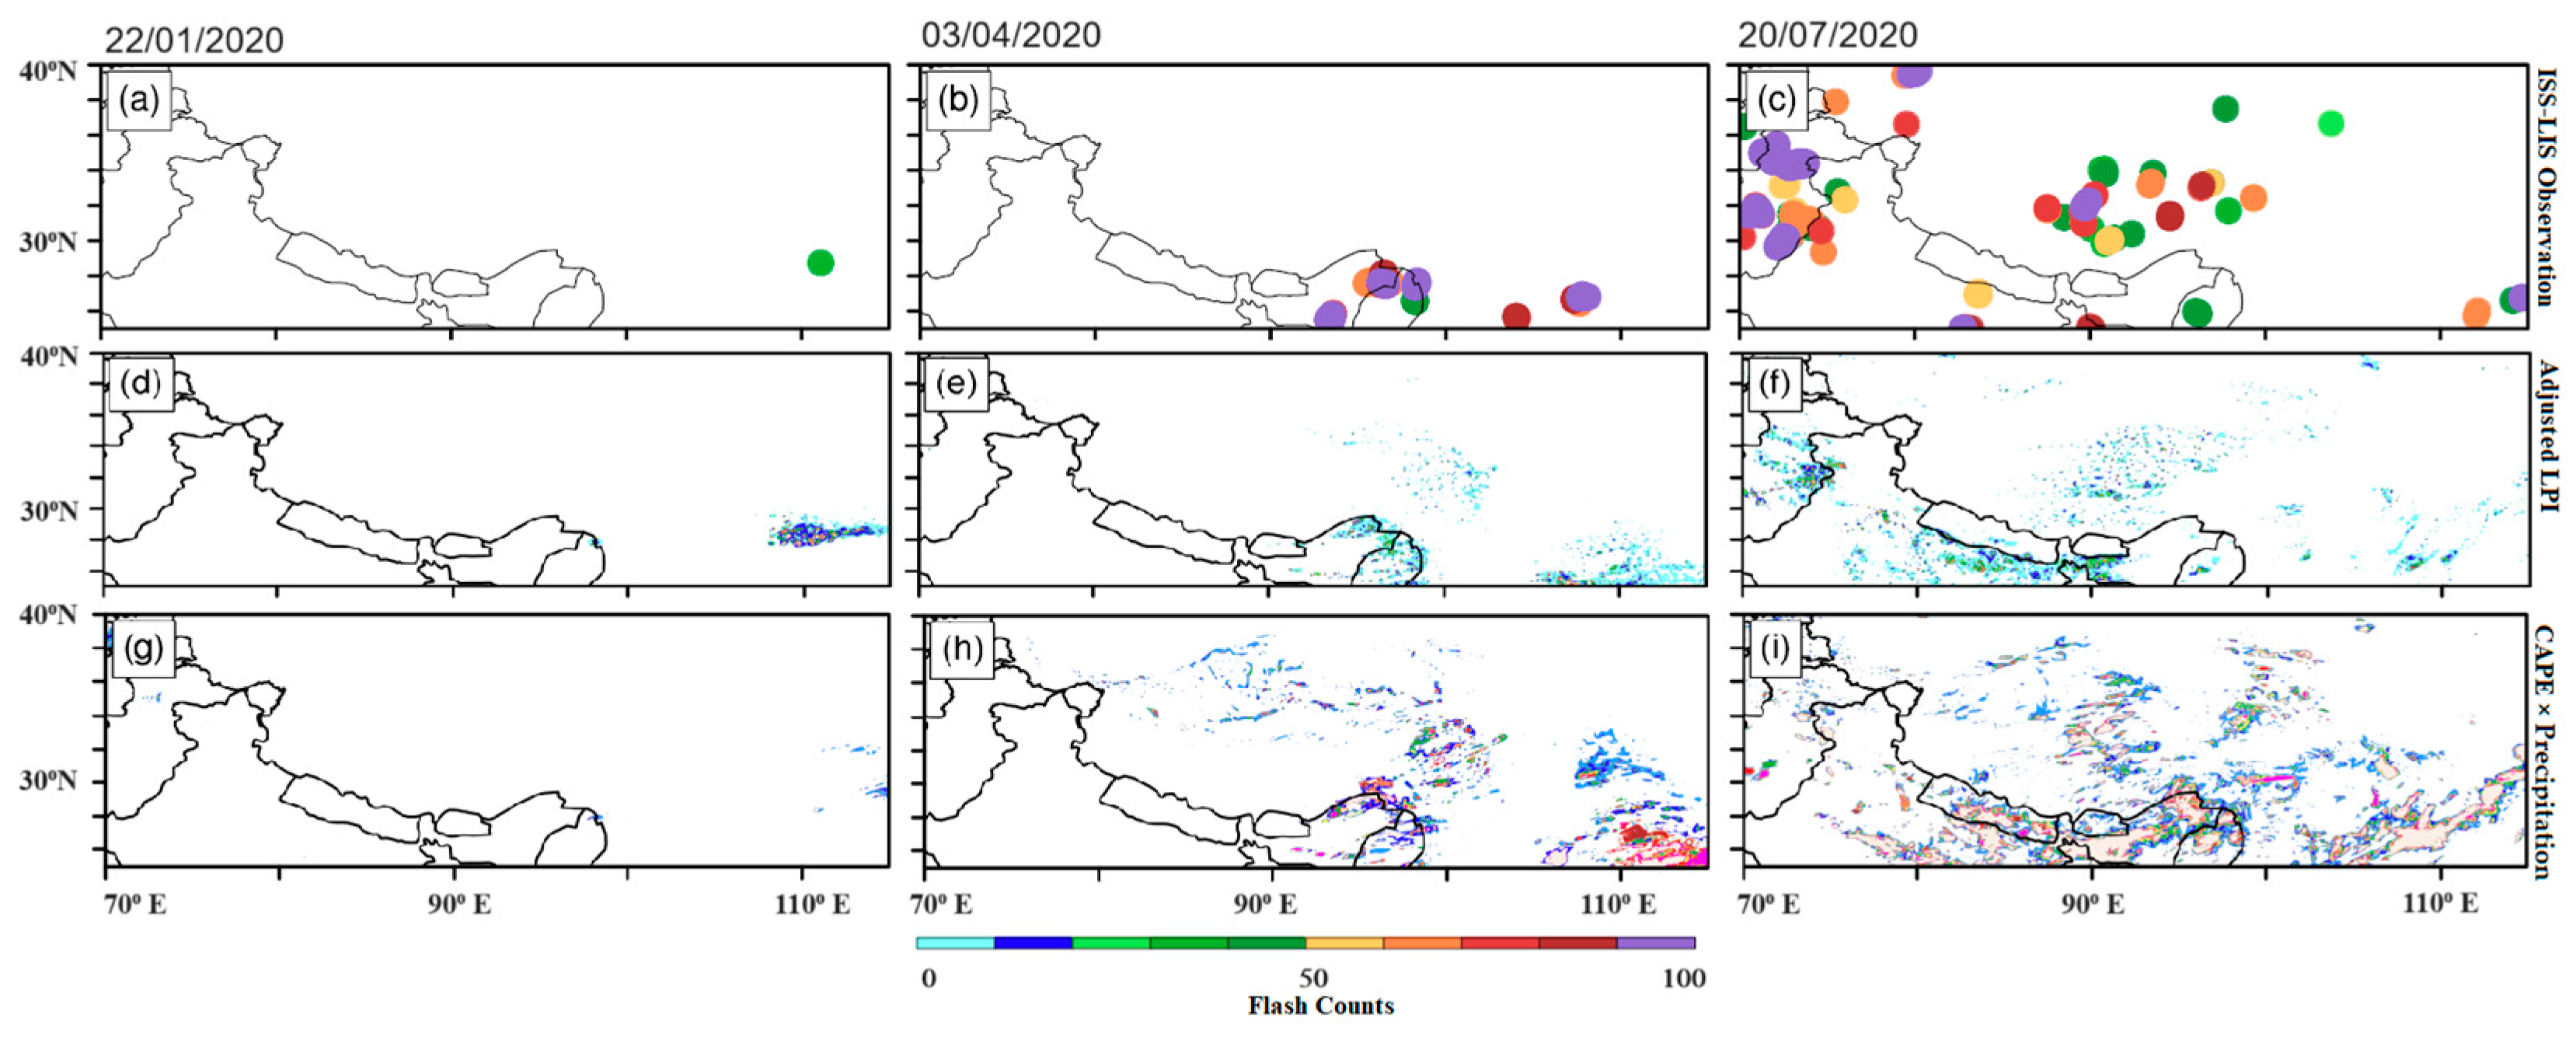
When we look closely at the few chosen events out of the thousands of events that were successfully caught by simulation, we found that both the LPI and CP gave a better picture of lightning both in space and in time.
Figure 6a–c show the number of lightning events and respective lightning flashes by the ISS-LIS on 22 January 2022, 3 April 2022, and 20 July 2022.
Figure 6d–f show the respective values of the adjusted LPI averaged for each event within ±2 h. Similarly,
Figure 6g–i show CP values for the respective events.
Figure 6a shows an isolated winter event; on 22 January, a single event with 38 flashes was detected by the ISS-LIS during local time (~9 LT). The LPI at the point of observation shows a very low value, and within 90 × 90 km
2, the average value was quite low (0.026 J/kg) whereas the adjusted value of the LPI showed 25 flashes when we considered the average value within 90 × 90 km
2. Meanwhile, the CP value over the same period was quite away from the event location but in the same range (31 flashes). The event during the pre-monsoon period on 3 April (
Figure 6b) shows multiple lightning events during the early morning (~6 LT) and afternoon (~14 LT), with flash counts ranging from 40 to 99. The adjusted LPI reproduced flash counts up to 68 (
Figure 6e), and most of the event shows significant values within a 90 × 90 km
2 area. The adjusted LPI to observed flash counts (below 80) shows a high coefficient of determination (r
2 = 0.93) whereas the CP shows a significant value (60 flash counts) concerning observed lightning events in terms of space and time. For the third case during the monsoon period on 20 July (
Figure 6c), multiple lightning events (more than 400) with flash counts varying from 27 to 99 were recorded. Most of the events were recorded during the early afternoon. About 400 cases show some value of the LPI when averaged over a 90 × 90 km
2 grid of observation. The adjusted LPI shows significant comparisons for more than 200 cases. The observed lightning flashes up to 80 with an adjusted LPI show a good coefficient of determination. Many cases over the Tibetan Plateau also show a quite good value of the adjusted LPI. CP values were quite significant concerning space and time for many observed lightning events but few of the crucial observed events were captured very well with the LPI compared to the CP. The model simulated high precipitation for these events, which was complemented by satellite data too (
Figure S3).
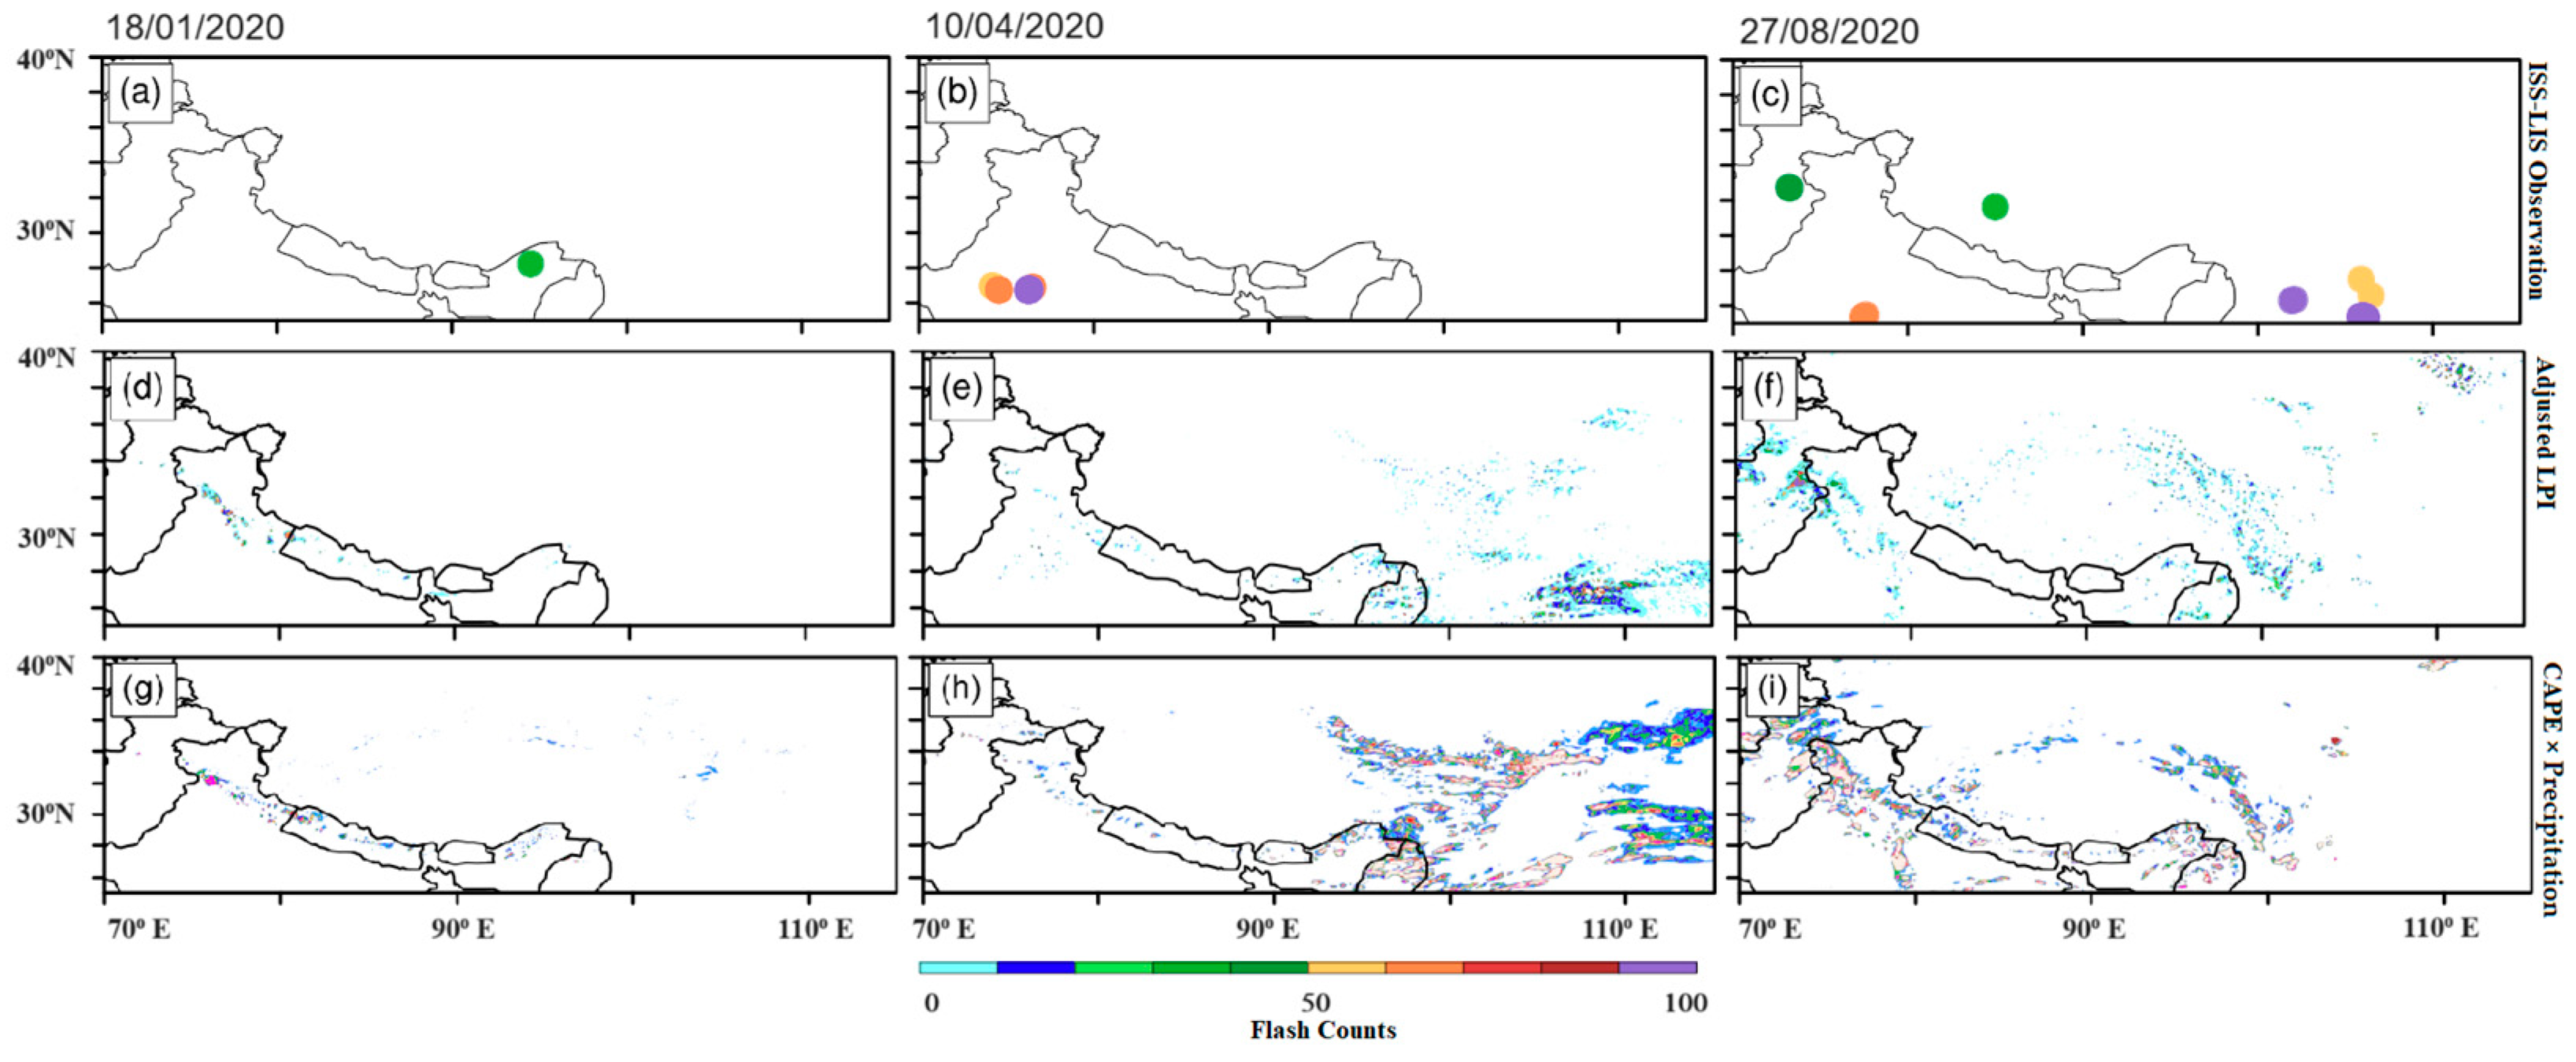
On the other hand, we analyzed, events that were completely ignored through the model-simulated lightning potential index and CAPE × precipitation (CP). In those cases, the LPI and CP both showed no or very low values.
Figure 7a–c show the number of lightning events and respective lightning flashes by the ISS-LIS on 18 January 2022, 10 April 2022, and 27 August 2022. As in the previous section, we selected one case each from the pre-monsoon, monsoon, and post-monsoon (winter) periods. The first event on 18 January (
Figure 7a) shows an isolated event during the afternoon time (~12 LT) with 31 flashes. Over the grid point as well as within 90 × 90 km
2, the model shows zero LPI. The value of the CP (
Figure 7g) shows very low values (<10 flashes) over the area of the observed lightning event; there was insignificant rain simulated through the model as well as during observations whereas the western part of the domain shows significant values of the LPI, CAPE, and precipitation. The GPM also shows significant precipitation over the western part of the domain. During the pre-monsoon period on 10 April, the ISS-LIS showed about 20 lightning events (
Figure 7b), with 50 to 99 flashes during the afternoon (~13 LT). The LPI values over the region of observation were very low, along with low values of the CP, whereas the eastern part of the domain shows a high value of the adjusted LPI and CAPE. Model simulation as well as satellite data show significant precipitation in that area (
Figure S4). During the monsoon on 27 August, the model showed multiple lightning events with 30 to 99 lightning events. Except for in the Western Himalayan region, the model failed to reproduce lightning activity in other parts. The Western Himalayan region during early morning time showed three events with ~40 flashes, whereas the adjusted LPI showed ~43 flashes, as well as a significantly high value of the CP. The model simulated a high amount of precipitation over the Western Himalayan region along with satellite observations, whereas other parts showed very low or negligible precipitation. It looks like the 18 January and 10 April cases were indicated as false alarms by the ISS-LIS, whereas the 27 August event over the western TP region was completely missed in the simulation.
Since the LPI is calculated using the vertical motion of supercooled cloud volume and the CP is calculated using precipitation, changes in microphysics parametrization can be helpful to tune LPI and CP values over the region. Previous studies using multi-microphysical options in cloud-resolving simulations show LPI values can vary with different microphysical schemes, and the LPI along with precipitation (CP) can be helpful to predict lightning compared to the LPI alone [
46,
47]. Previous studies over the Bangladesh region using the WRF model showed LPI values quite off with respect to the location of observed lightning flashes in most of the cases [
5]. On the other hand, ICON-CLM simulated LPIs performed quite well in terms of space and time of observed lightning activity. The CP, along with the LPI, can be a complementary validation for lightning events, but many times, the CP either fails or overpredicts the potential of lightning events. Therefore, this study suggests combining the use of the LPI and CP to capture lightning events over the Third Pole region using km-scale simulations.


