Article

Evaluation of Precipitation Frequency and Intensity as Estimated by the GPM IMERG Precipitation Product at Daily and Hourly Scales over the Tibetan Plateau

1
State Key Laboratory of Operation and Control of Renewable Energy & Storage Systems, China Electric Power Research Institute, Beijing 100192, China
2
Key Laboratory of Cloud-Precipitation Physics and Severe Storms (LACS), Institute of Atmospheric Physics, Chinese Academy of Sciences, Beijing 100029, China
3
University of the Chinese Academy of Sciences, Beijing 100083, China
4
Huadian Jinsha River Upstream Hydropower Development Co., Ltd., Chengdu 610041, China
*
Author to whom correspondence should be addressed.
Atmosphere 2023, 14(11), 1653; https://doi.org/10.3390/atmos14111653
Submission received: 28 September 2023 / Revised: 25 October 2023 / Accepted: 1 November 2023 / Published: 3 November 2023
(This article belongs to the Section Meteorology)

Abstract

:
The IMERG V06 hourly rainfall product at daily and hourly scales was evaluated during the warm season (May to September) from 2015 to 2020 using 651 high-quality rain-gauge stations over the Tibetan Plateau (TP). Based on hourly observed rain-gauge precipitation, four categories were classified: light rainfall (0–12 mm·d−1), moderate rainfall (12–20.1 mm·d−1), torrential rainfall (20.1–32.2 mm·d−1), and extreme torrential rainfall (>32.2 mm·d−1). Precipitation frequency and intensity were calculated to further validate the accuracy and suitability of the IMERG estimated-precipitation product. At the daily scale, IMERG underestimated the number of days with less than moderate rainfall, but overestimated the frequency of torrential and extreme torrential rainfall. IMERG estimated the main characteristics of precipitation frequency at different daily precipitation amount levels better than the precipitation intensity, but its best estimate was at the moderate rainfall level, with the highest correlation coefficient (0.69) and the lowest root mean square error (0.17). At the hourly scale, IMERG underestimated the hourly precipitation amount mainly between the early morning and midday (the average deviation was 0.019 mm·h−1) and overestimated it between the afternoon and late night (the average deviation was 0.047 mm·h−1). IMERG overestimated precipitation frequency and underestimated precipitation intensity between the afternoon and the evening, which means that this analysis shows that IMERG estimated more precipitation hours than the observation and underestimated precipitation intensity. These results further our understanding of the suitability of the IMERG precipitation products over the TP and further improve the IMERG retrieval algorithm to better apply the corresponding precipitation product to light and extreme rainfall over regions with complicated topography.

1. Introduction

Satellite precipitation products have been greatly improved with the improvement of remote sensing techniques in recent decades, such as Precipitation Estimation from Remotely Sensed Information using Artificial Neural Networks (PERSIANN) [1], the National Oceanic and Atmospheric Administration/Climate Prediction Centre (NOAA/CPC) morphing technique (CMORPH) [2], and the Tropical Rainfall Measuring Mission (TRMM) [3]. TRMM’s successor, the Global Precipitation Measurement (GPM) mission, is led by the National Aeronautics and Space Administration (NASA) and the Japan Aerospace Exploration Agency [4,5]. The GPM precipitation products include four levels of data on a global scale: Level 1 data consist of geolocated, calibrated dual-frequency precipitation radar (DPR) power, GPM microwave imager (GMI) brightness temperatures, and intercalibrated brightness temperatures from partner radiometers at the instantaneous field of view (IFOV); Level 2 products include geolocated, geophysical data, and DPR reflectivity at the IFOV; Level 3 products include the Integrated Multi-satellite Retrievals for GPM (IMERG) Final Run products, which consist of gridded time–space sampled geophysical data at half-hourly and monthly temporal resolutions and at a spatial resolution of 0.1°. Level 4 products include merged remote sensing and model information [5].
Among these GPM precipitation products, IMERG precipitation products (level 3) have the highest spatial and temporal resolution. Many previous studies have made efforts to evaluate the applicability of IMERG precipitation products (hereafter referred to as IMERG) to many regions [6,7,8,9,10,11,12,13,14,15]. In general, IMERG can capture the major heavy-rainfall regions in both the northern and southern hemispheres and has been evaluated for many regions of the world, such as India, the Brazilian Amazon rainforest, Far East Asia, Pakistan and Türkiye [16,17,18,19,20,21]. Due to the vast coverage and complex terrain distribution of China, many previous studies have also evaluated the performance of IMERG for different regions [22,23,24,25]. Derin et al. (2016) [26] assessed the performance of satellite-based rainfall as highly dependent on rainfall variability over complex terrain worldwide. The Tibetan Plateau (TP), which covers an area of more than 3 million km2, is the highest plateau in the world [27]. It has significant influence on atmospheric circulation, the water cycle, the global climate, and weather [28,29,30,31]. In addition, it is also widely considered to be an ideal natural laboratory for studying multispheric interactions within the Earth system [32]. Due to the complex terrain and high altitude, there are insufficient ground-based measurements for the TP. Accurate rainfall estimations at different scales are an essential prerequisite for deeply understanding the weather and climatic characteristics of precipitation over the TP. It is extremely important to use these high-resolution satellite precipitation products to discover the characteristics of climatic precipitation over the TP, especially in the western TP. Many experts have made efforts to compare and evaluate the suitability of these satellite precipitation products for the TP [10,14,31,33,34]. The IMERG precipitation product was found to have the best correlation and fewest errors compared to PERSIANN, TRMM, and CMORPH [34,35,36,37,38,39,40]. Zhang et al. (2018) [41] evaluated the diurnal variation of IMERG precipitation over the TP using hourly precipitation observations from a national-level ground-based station. The results indicated that IMERG overestimated the maximum rainfall intensity over the whole TP. Li et al. (2021) [15] found that IMERG was good at capturing the spatial and temporal variability of light precipitation over mainland China, but had limited ability to detect light rainfall events. Wang et al. (2023) [42] indicate that precipitation error between IMERG and China Merged Precipitation Analysis (CMPA) is larger during the night than the day. Other results have shown that IMERG overestimates the proportion of light precipitation globally [43,44,45,46].
It is well known that the distribution of the accumulated precipitation amount is inhomogeneous over different regions of the TP. Although the above studies investigated the suitability of IMERG for different precipitation amounts, other precipitation characteristics, such as precipitation frequency and intensity, are also considered in this study to assess the qualities of IMERG [47,48,49]. In this study, a high-quality rain-gauge network is used to evaluate IMERG performance based on the new local rank of observed daily precipitation amount during the warm season (May to September) from 2015 to 2020. The new findings of this study will provide the application of this data in climatic and hydro-meteorological studies on rainfall over the TP and a reference that will help further improve the IMERG retrieval algorithm, to better apply the corresponding precipitation product on light and extreme rainfall over regions with complicated topography. The paper is organized as follows: Section 2 introduces the method and data; the comparison of the spatial distribution of daily precipitation between the rain gauge and IMERG in different precipitation ranks and the results of the evaluation metrics are presented in Section 3. A comparison of the diurnal variation in precipitation amount, intensity, and frequency between the rain gauge and IMERG is also analyzed in Section 3. The conclusion and discussion are presented in Section 4.

2. Data and Methodology

Observed hourly rainfall amounts from 729 ground-based observation stations provided by the China Meteorological Administration (CMA) were used as references to evaluate the IMERG precipitation product. These datasets have been primarily qualified by the National Meteorological Information Center. After discarding the rain gauges without complete records and deleting the unreasonable values during May to September of 2015~2020, 651 stations were selected to evaluate the IMERG precipitation products (Figure 1). The GPM IMERG V06 precipitation product covers the global area from 60° S to 60° N with 0.1° grids (https://disc.gsfc.nasa.gov/data/directory, accessed on 1 September 2022) [47,48]. To assess its accuracy and suitability, this half-hourly precipitation product was validated against precipitation observations from rain gauges using a bilinear interpolation method. The GPM-gridded precipitation data were interpolated to the 651 selected rain-gauge stations using a bilinear interpolation method [50]. Given the uneven distribution of rain gauges and the highly variable topography of the TP, the bilinear interpolation was intended to smooth out small-scale variations and reduce systematic errors [41].
In addition to evaluating the precipitation amount (PA) of the IMERG precipitation product at daily and hourly scales, precipitation frequency (PF, the percentage of time with measurable precipitation during the observation period and IMERG for the entire study period) and intensity (PI, the mean precipitation rate over all the precipitation hours) are the significant physical quantities to consider to further validate the accuracy and suitability of the satellite-estimated precipitation product [51]. PF at the daily scale is the percentage of the days of daily PA at certain rainfall level to all the days in the dataset. PI at the daily scale is the average daily PA at a certain rainfall level during all the precipitation days. For the hourly scale, PF is the rate of hours within the study period with recorded hourly PA (>0.1 mm·h−1) at certain time (such as 00 Local Standard Time, LST). PI is the mean hourly PA at a certain hour of all the corresponding hours with recorded precipitation. The main evaluation metrics in this paper include correlation coefficient (CC, Formula (1)), root mean square error (RMSE, Formula (2)), and relative bias (RB, Formula (3)) to measure the degree of similarity and difference between the IMERG precipitation product and rain-gauge observations.
C C = i = 1 n ( s i s ¯ ) ( g i g ¯ ) i = 1 n ( s i s ¯ ) 2 i = 1 n ( g i g ¯ ) 2
R M S E = 1 n i = 1 n ( s i g i ) 2
R B = i = 1 n ( s i g i ) i = 1 n g i × 100
n is the total evaluation time of the IMERG and rain-gauge observation data; i is the ith of IMERG product and rain-gauge observation data. s i and s ¯ are the IMERG estimated daily or hourly precipitation amounts and their mean values. g i is the daily or hourly observed precipitation, and g ¯ is the mean result of the observation data.

3. Results

3.1. Spatial Distribution of Daily Precipitation

The north–south boundary range of the TP (the boundary line in Figure 1, boundary data taken from the website (http://data.tpdc.ac.cn/en/data/61701a2b-31e5-41bf-b0a3-607c2a9bd3b3/, accessed on 10 May 2023) starts from the northern foothills of the West Kunlun–Qilian Mountain Range in the north and reaches the southern foothills of the Himalayas and other mountain ranges in the south. The maximum width from north to south is ~1560 km. The west–east border range starts from the western edge of the Hindu Kush Mountains and the Pamir Plateau in the west and reaches the eastern edge of the Hengduan Mountains and other mountain ranges in the east. The maximum length from east to west is about 3360 km. The specific latitude and longitude range is 25°59′30″ N~40°1′0″ N, 67°40′37″ E~104°40′57″ E. The total area is 3,083,400 km2 and the average elevation is about 4320 m [27,52]. In addition to the major mountains and plateaus, including the Pamir Plateau, the Hindu Kush Mountains, the Karakoram Mountains, the Kunlun Mountains, the Himalayas, the Qiangtang Plateau, the Qilian Mountains, the Qionglai Mountains, the Bayan Har Mountains, and the Hengduan Mountains, there are the Yellow River, the Yangtze River, the Lancang River, the Nu River in the eastern part of the TP, and the Yalu Zangbo River in the southern part. The Qaidam Basin, which has the highest elevation of all basins in China, is located in the northwestern region, south of the Qilian Mountains.
Figure 1 shows the spatial distribution of the daily PA averaged during the warm seasons from 2015 to 2020. It clearly shows that the rain-gauge stations were concentrated in the eastern and southern part of the TP. In general, heavy precipitation occurred in the east and south (the eastern side of the Bayan Har Mountains, the Qionglai Mountains, the southeastern edge, and the eastern part of the Yalu Zangbo River), and light precipitation occurred in the west. The heaviest precipitation occurred mainly over the Hengduan Mountains and the southeastern margin and the eastern part of the Yalu Zangbo River. The lowest daily PA occurred mainly in the Qaidam Basin, the Himalayas, the Pamir Plateau, and the western parts of the Qiangtang Plateau (Figure 1a). IMERG could estimate the overall spatial distribution characteristics of the observed precipitation with a high average spatial correlation coefficient (CC, 0.71) and low RMSE (1.17 mm·d−1), but the estimated daily PA was much higher, especially in the regions of the Hengduan, the Qionglai Mountains, and the eastern part of the Yalu Zangbo River. The general spatial distribution of the IMERG-estimated precipitation product with topography was similar to that of the rain gauges, but the precipitation amount was much higher, especially the maximum precipitation over the Hengduan Mountains and the southeastern periphery of the TP (Figure 1b).

3.2. IMERG Precipitation Intensity and Frequency Performance at Different Precipitation Amount Levels

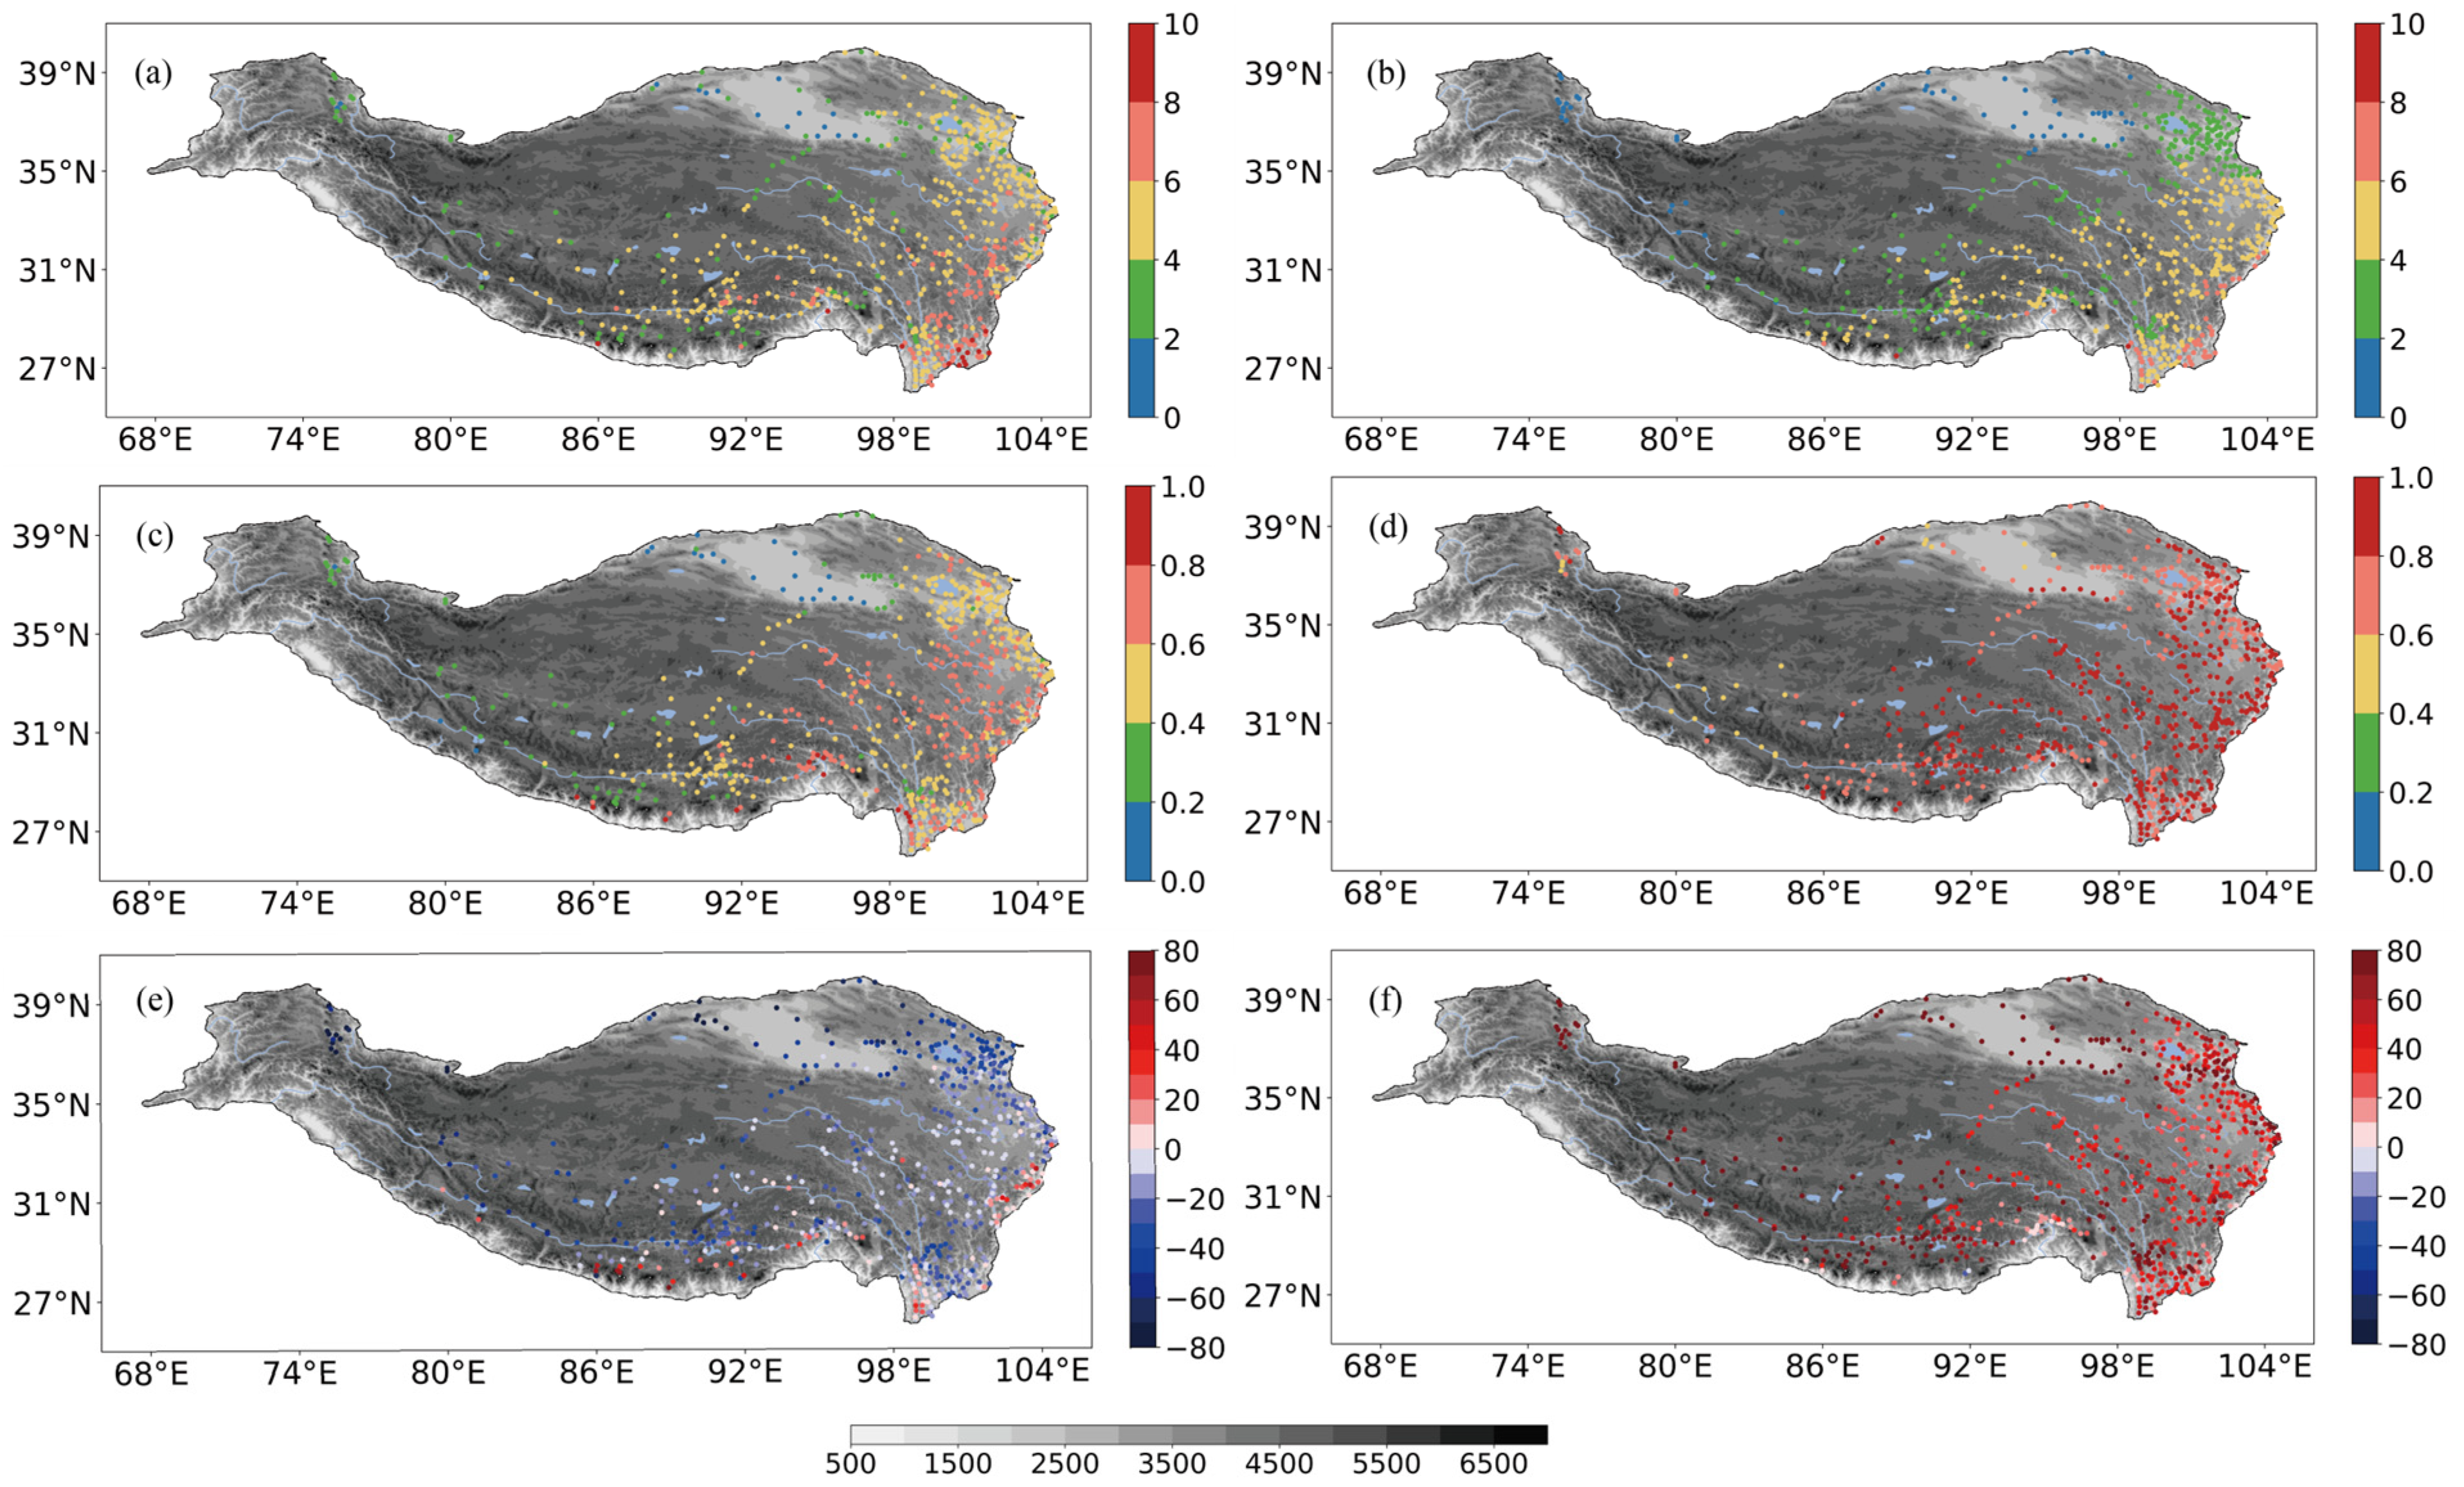
In order to better evaluate the precipitation characteristics of IMERG, PA was divided into precipitation intensity (PI) and precipitation frequency (PF). Figure 2 shows the spatial distribution of the daily PI and PF from the rain-gauge observations and the IMERG precipitation product. PI is the average daily precipitation amount of all precipitation events. Compared to the spatial distribution of PA in Figure 1a, PI is characterized by more pronounced regional discrepancies over the TP. Generally speaking, PI decreased from east to west with increasing topographic height. The observed PI shows that the stations with PI greater than 6 mm·d−1 were mainly located in the Hengduan Mountains, the regions south of the Qionglai Mountains, and around the eastern part of the Yalu Zangbo River (Figure 2a). The stations with PI between 4 mm·d−1 and 6 mm·d−1 were distributed over the northeastern part of the TP, the areas around the Yangtze River and Yellow River, and along the Yalu Zangbo River. The weakest PI occurred in the Qaidam Basin, which is consistent with the distribution characteristic of PA. From the spatial distribution of the estimated PI (Figure 2b), it is obvious that the general features of the IMERG PI were consistent with those of the observed results, but the estimated PI was weaker than the observed value at most rain-gauge stations (Figure 2a,e). This means that IMERG underestimated the PI. The strong PI values (6–8 mm·d−1) were concentrated on the eastern edge of the Hengduan Mountains (Figure 2b). The positive RB values appeared on the eastern edge of the TP, the southwestern region of the Hengduan Mountains, and the regions south of the Yalu Zangbo River. The relatively accurate estimate of the IMERG PI (with low RB) was in the Qianglai Mountains (Figure 2e). Differing from the spatial distribution characteristics of PI, in addition to the stations with high PF in the southern part of the Hengduan Mountains, high frequency (values between 0.6 and 0.8) also occurred in the Qionglai Mountains, the areas around the Lancang River and the Nu River, and the eastern part of the Yalu Zangbo River (Figure 2c). However, the estimated PF values were much higher than the observed ones, which means that IMERG overestimated the times when precipitation would occur. The higher IMERG PF occurred at most of the stations and the largest PF difference appeared in the Qaidam Basin (Figure 2d). From the spatial distribution of RB of PF, overestimation was more significant at the rain-gauge stations on the northeastern edge of the TP, the Qiadam Basin, and the western part of the TP (Figure 2f).
The above evaluation of the spatial distribution of PI and PF between the rain gauges and the estimated results show that IMERG generally underestimated PI at most stations and overestimated PF on the TP, which means that the number of precipitation days estimated by IMERG was more than the observed result. As shown in Figure 1 and Figure 2, there were obvious discrepancies in daily PA, PI, and PF in different regions of the TP. It is important to evaluate the PI and PF for each rainfall category. In order to better assess the performance of IMERG at different rainfall levels, four rainfall categories were definedbased on the daily PA of these 651 stations during the six warm seasons from 2015 to 2020. The specific four categories are derived from all the time series of daily PA at each station. The definitions of the four categories are light rainfall (0–12 mm·d−1), moderate rainfall (12–20.1 mm·d−1), torrential rainfall (20.1–32.2 mm·d−1), and extreme torrential rainfall (>32.2 mm·d−1, Table 1).
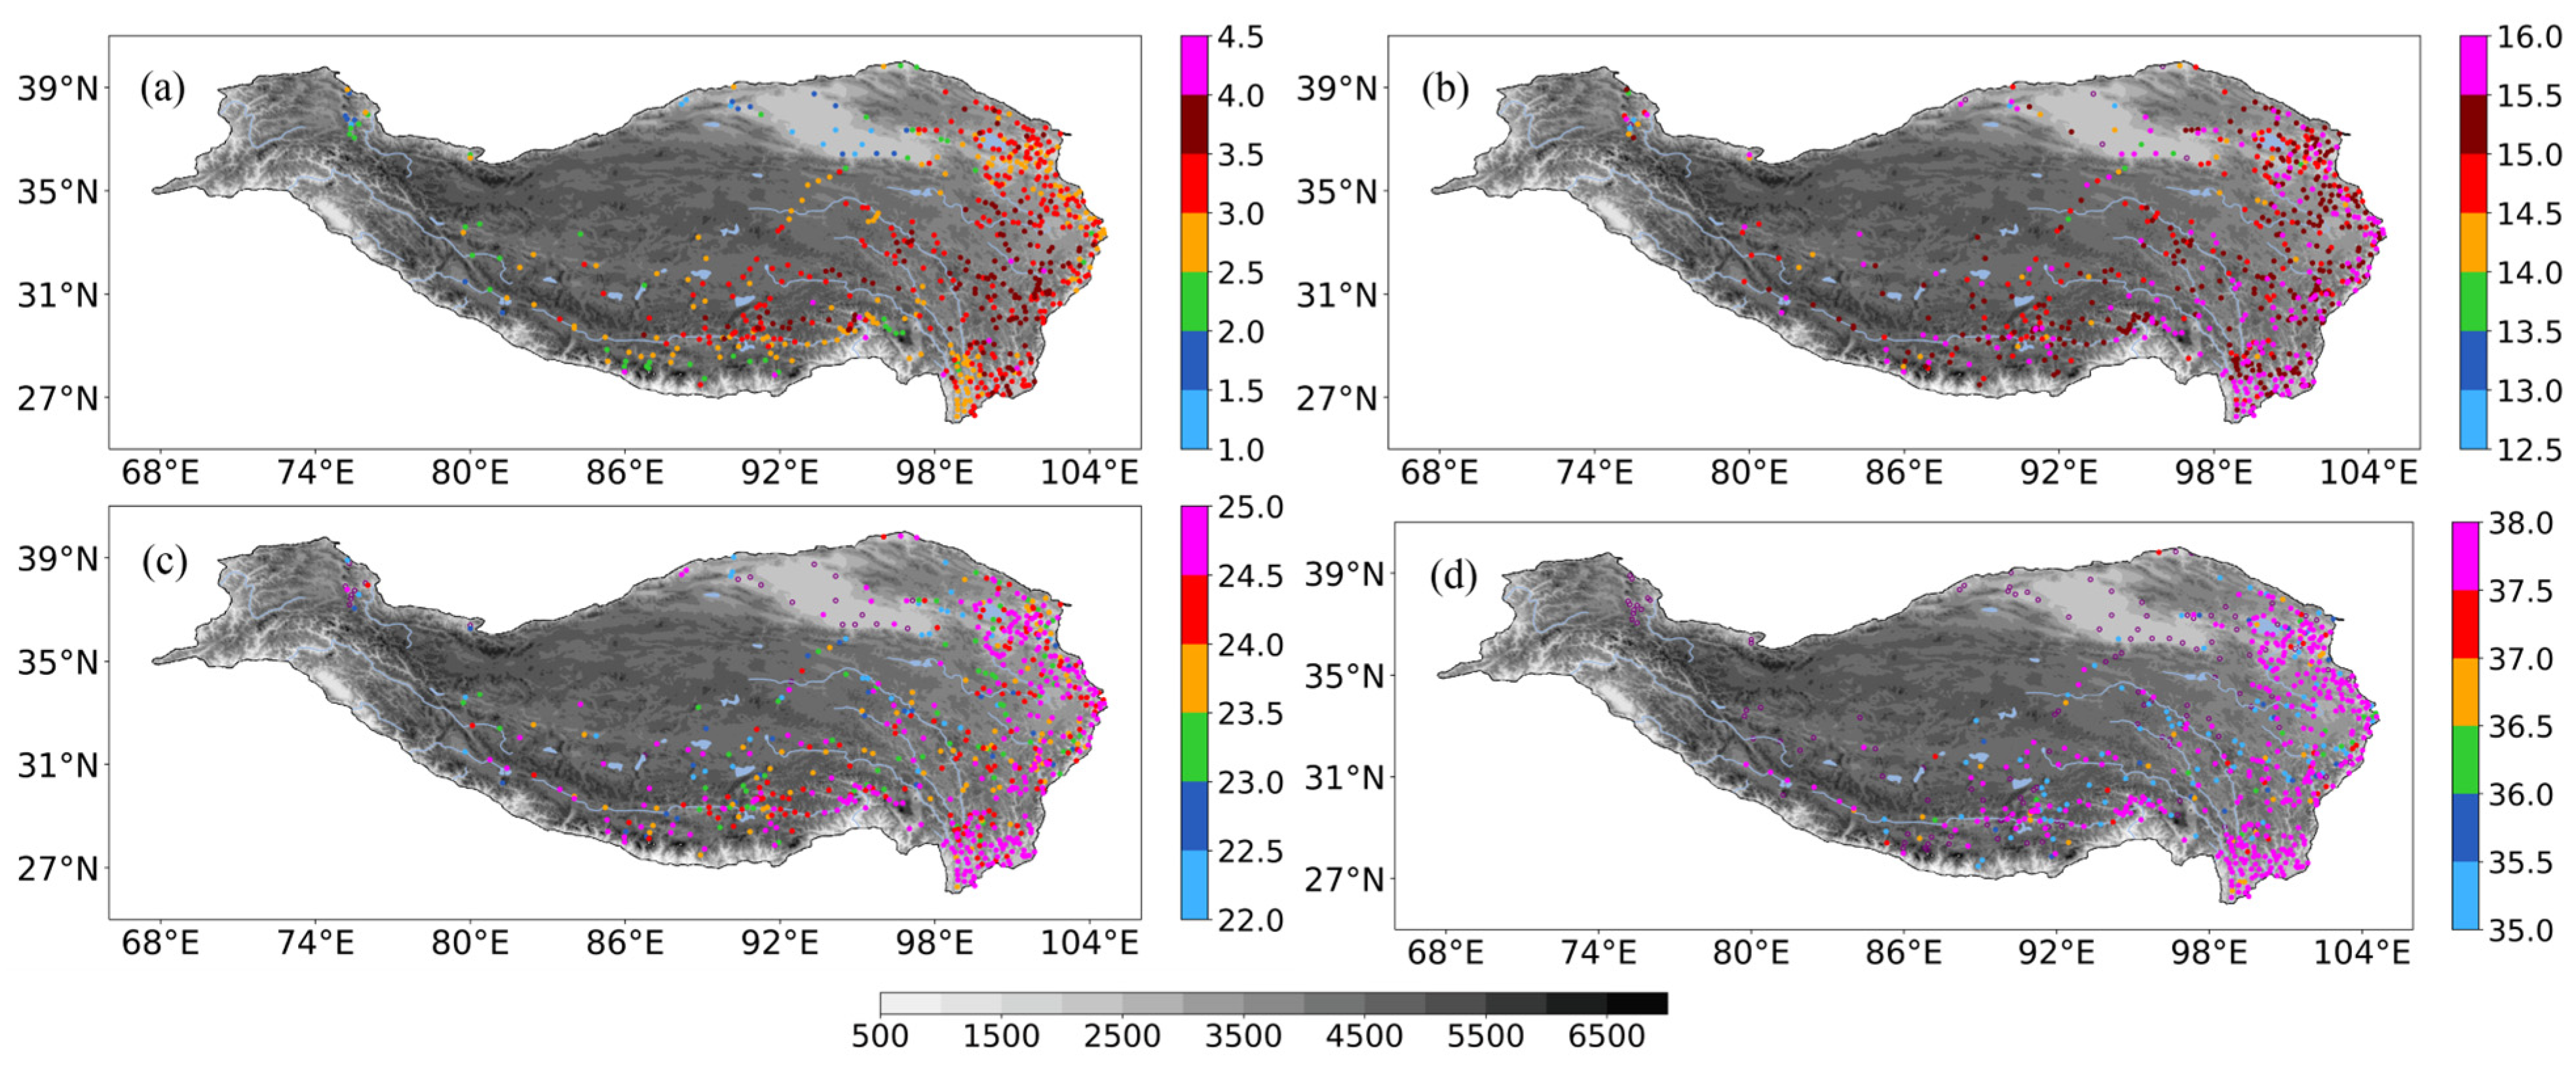
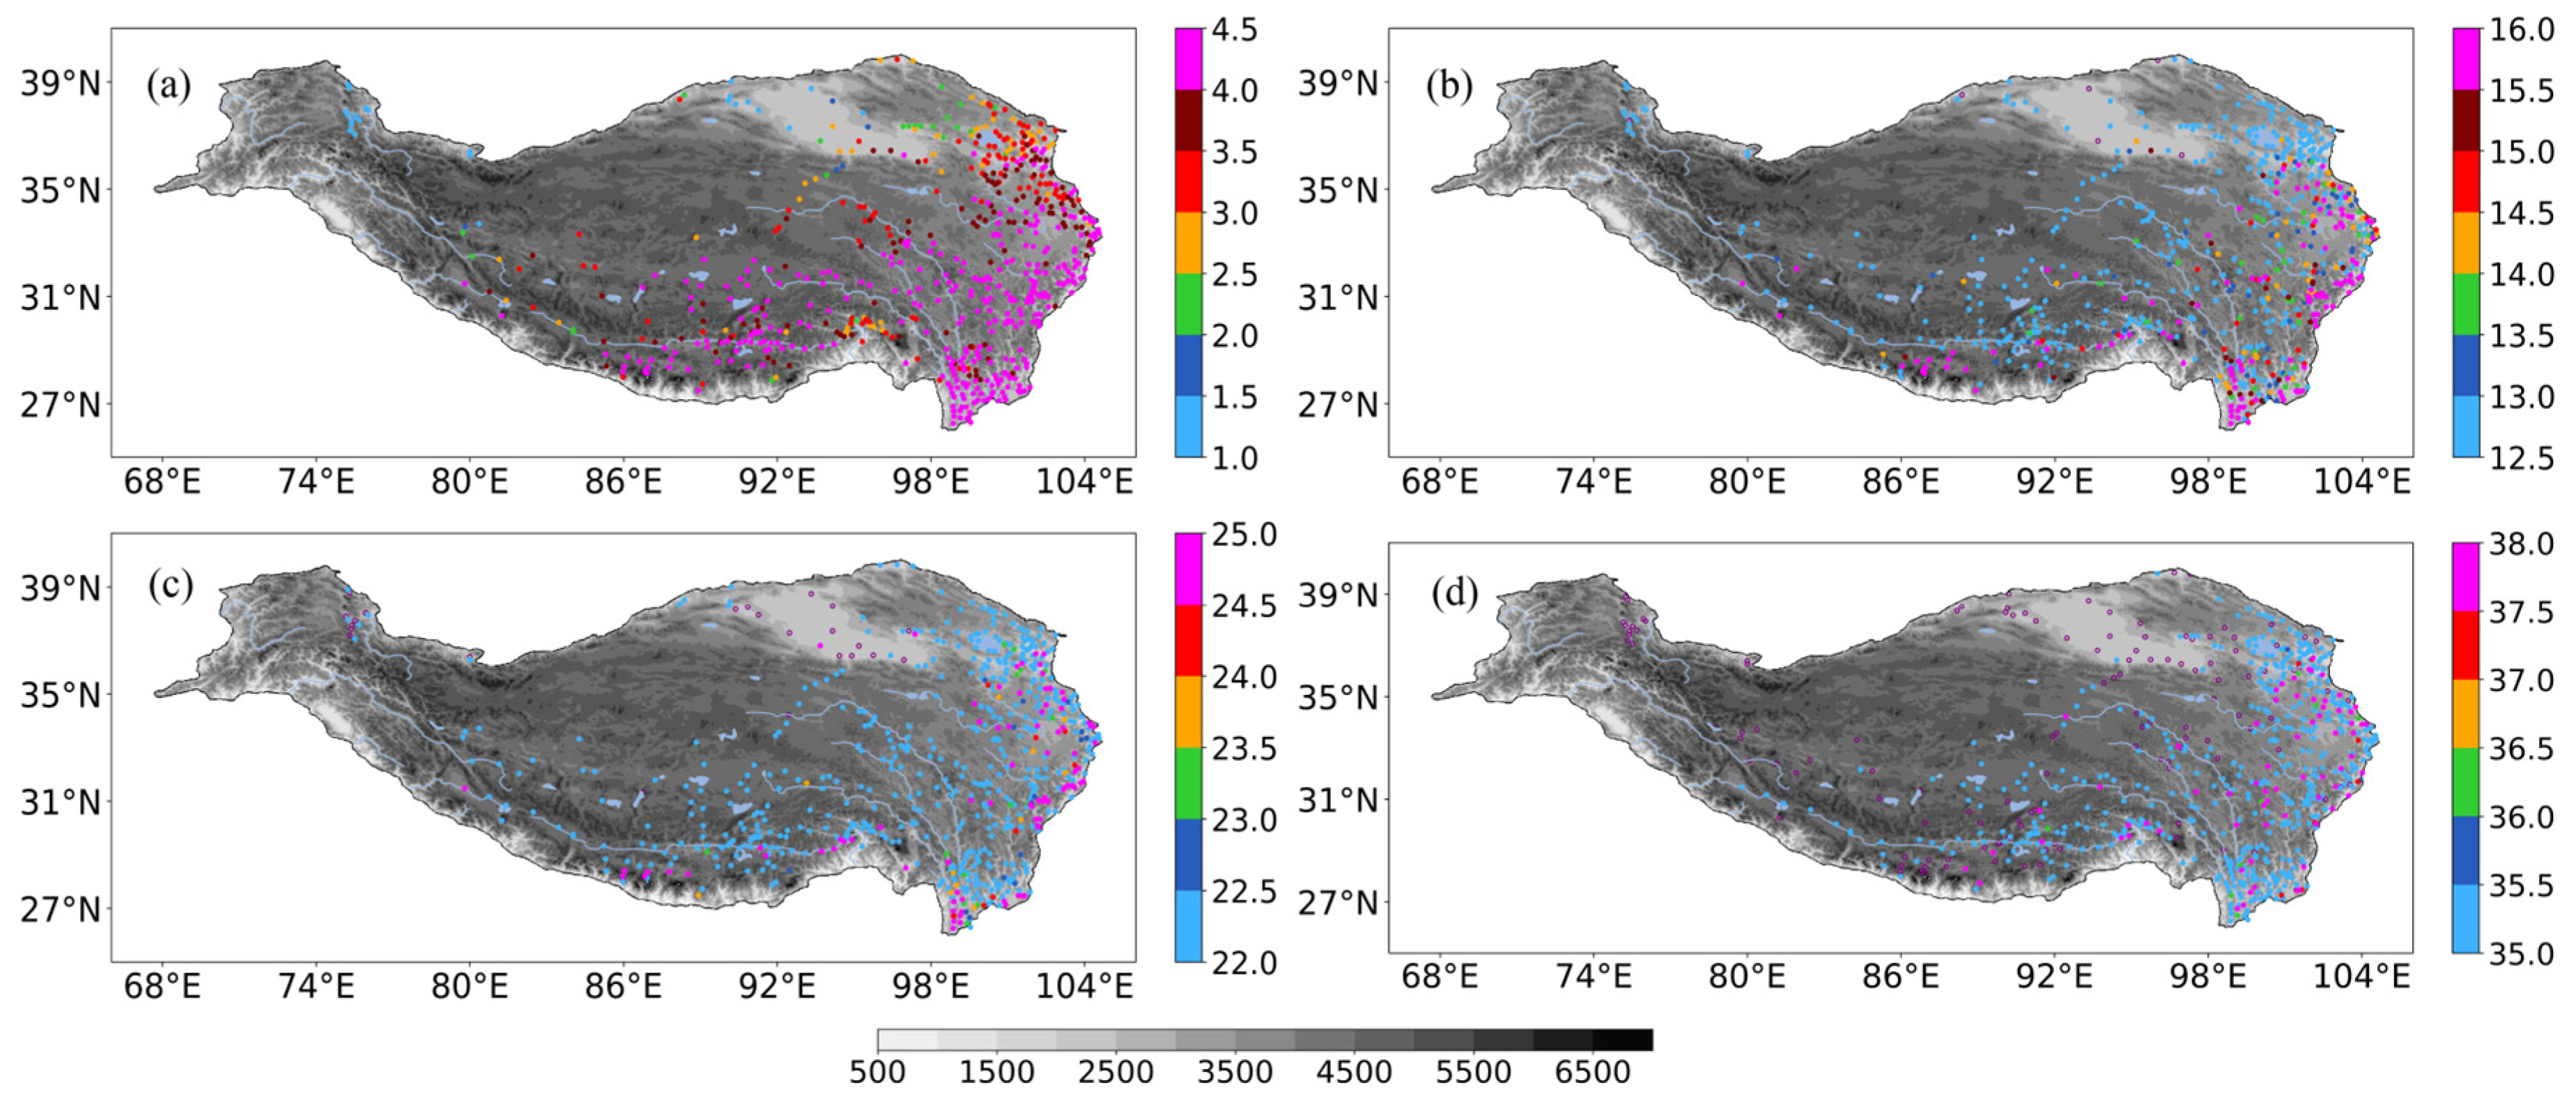
Figure 3 and Figure 4 show the spatial distribution of PI at these four PA categories for the rain gauges and IMERG. Table 1 shows the evaluation metrics of PI and PF between the observed and estimated results. For light rainfall, the strong PI (3.5–4 mm·d−1) was mainly located over the Qionglai Mountains, the Hengduan Mountains, and areas along the Yangzte River, Nu River, and Yalu Zangbo River. The weakest PI appeared in the Qaidam Basin and the stations on the Pamir Plateau (Figure 3a). Obvious distribution differences in the corresponding estimated PI are shown in Figure 4a and the spatial CC is 0.31. The estimated PI of light rainfall was stronger than that observed over the regions south of the Yellow River and several stations over the southern part of the Qaidam Basin (Figure 4a and Figure 5a). The largest RB appeared at the stations at the eastern and southern edge of the TP, the southern regions of the Hengduan Mountains and the southern part of Qaidam Basin (Figure 5a). For moderate rainfall (Figure 3b), the spatial distribution pattern of the rain gauges was almost similar to that of the light rainfall (Figure 3a). However, IMERG underestimated the PI for most of the rain gauge stations with a CC of 0.18 and RMSE of 4.86, except for some stations on the eastern edge of the TP, the southern part of the Hengduan Mountains, and some stations south of the Yalu Zangbo River (Figure 4b and Figure 5b). The stations on the Pamir Plateau and the northeastern edge of the TP had the largest underestimation (Figure 5b). Figure 3c and Figure 4c show the spatial distribution of PI for the rain gauges and the IMERG product at the torrential rainfall level. The strongest PI was concentrated on the northeastern and southeastern edges of the TP. Furthermore, the daily PA at stations in the Qaidam Basin was weaker than moderate rainfall. Compared to moderate rainfall, IMERG underestimated the PI of torrential rainfall at more rain-gauge stations with a CC of 0.18 and a RMSE of 8.66 (Figure 4c and Figure 5c). The spatial distribution of PI for the extreme torrential rainfall shows that IMERG also underestimated at most stations with the smallest CC (−0.03) and the largest RMSE (22.22, Figure 3d and Figure 4d). RB for extreme torrential rainfall was larger than that for moderate and torrential rainfall and positive RB was distributed more evenly, which means that the estimated PI cannot capture the main features of the observed result (Figure 3d and Figure 4d). The conclusions for extreme torrential rainfall are consistent with previous findings that the satellite products can capture the spatial pattern of extreme precipitation well but underestimate the extreme rainfall rate [9,52,53,54].
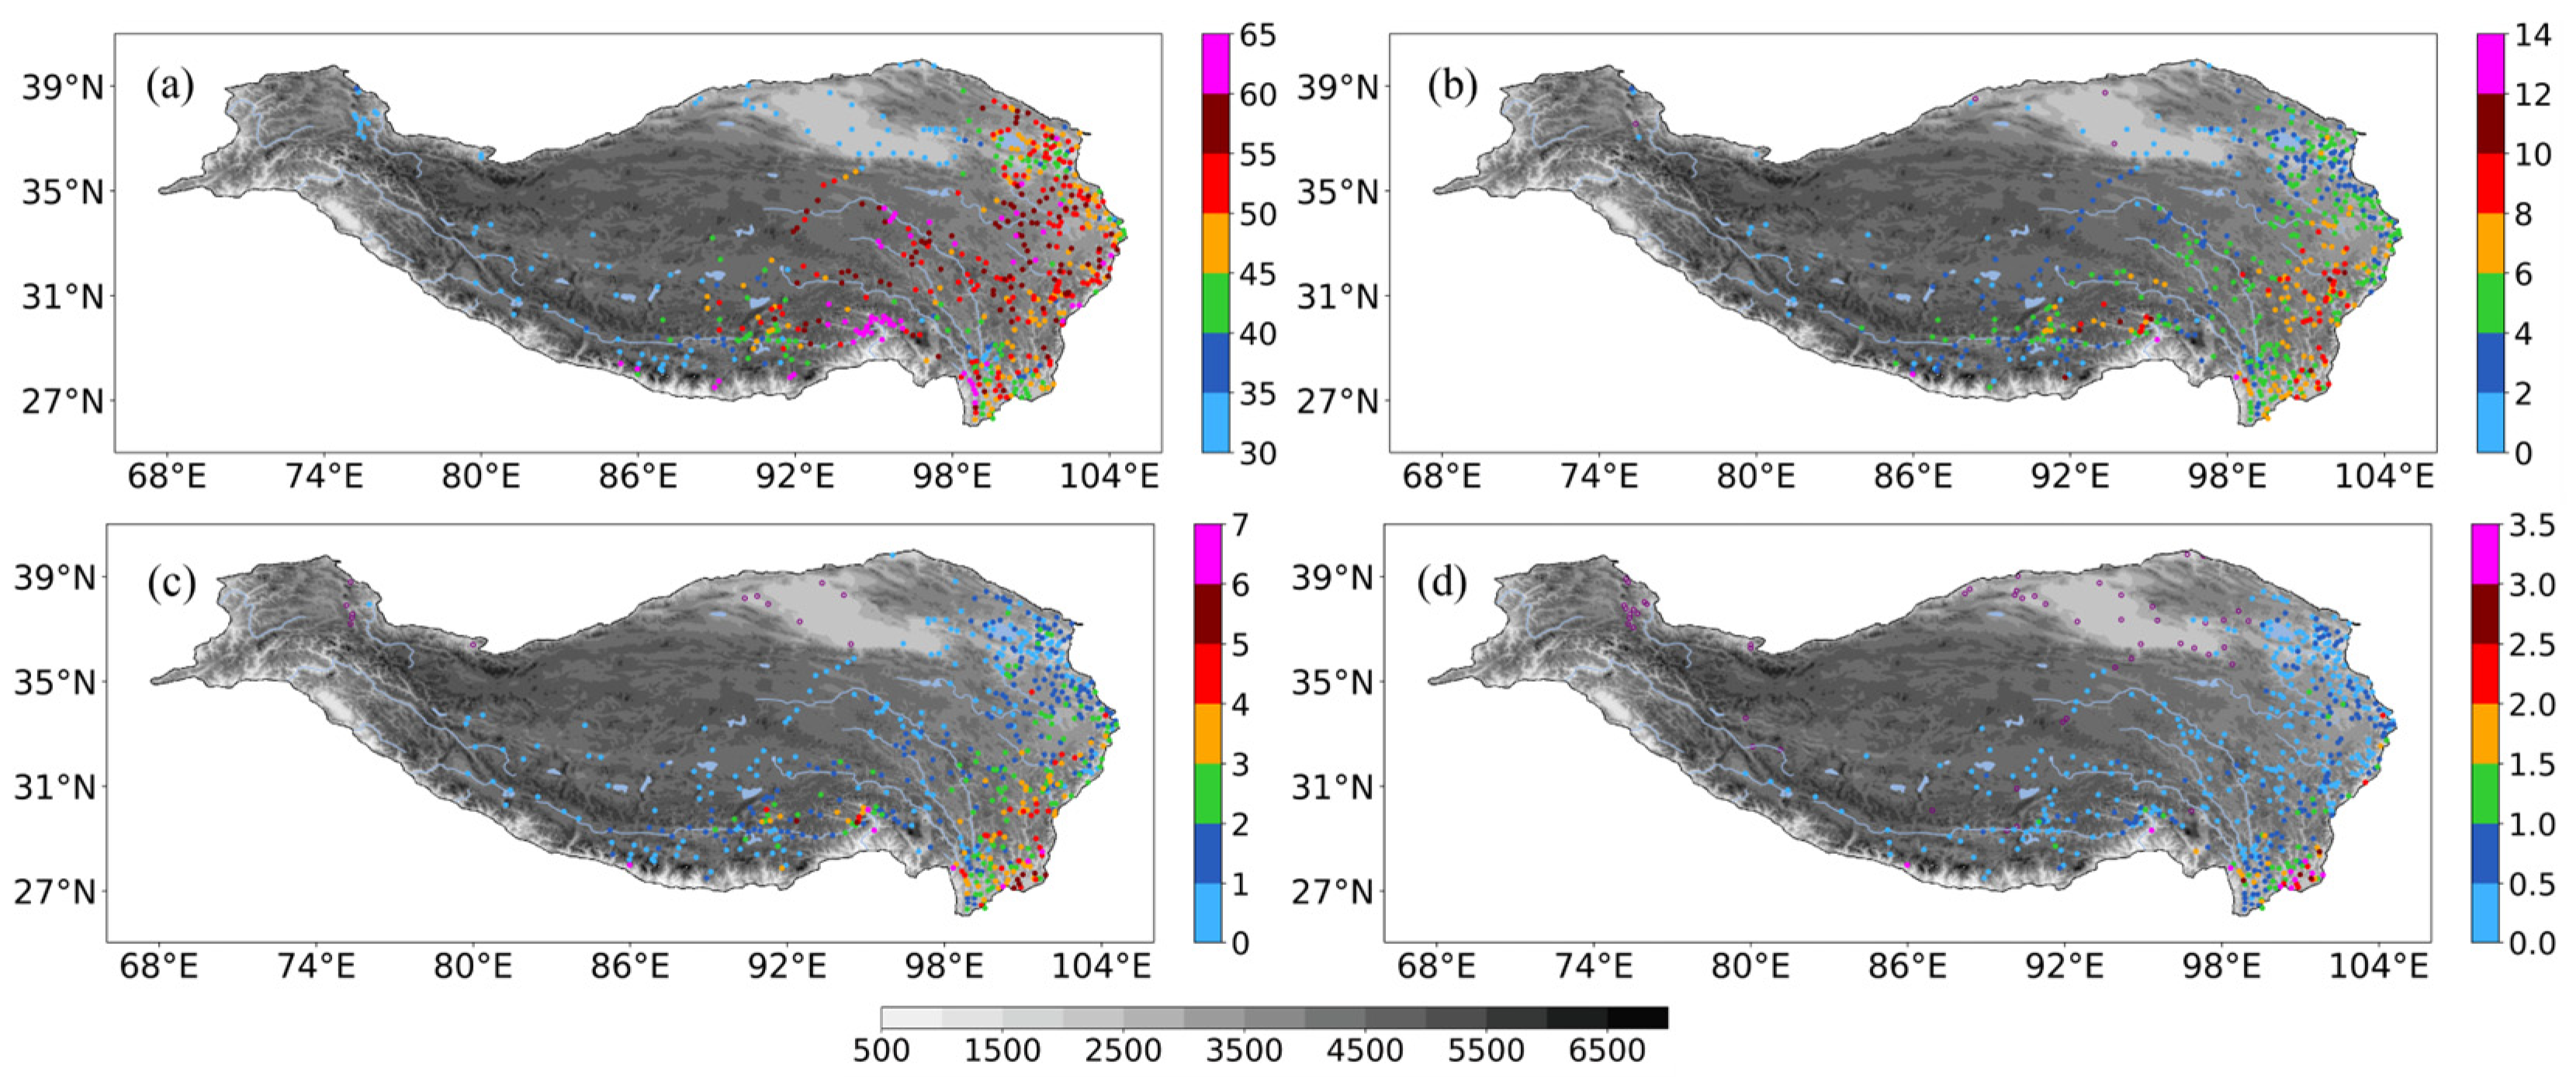
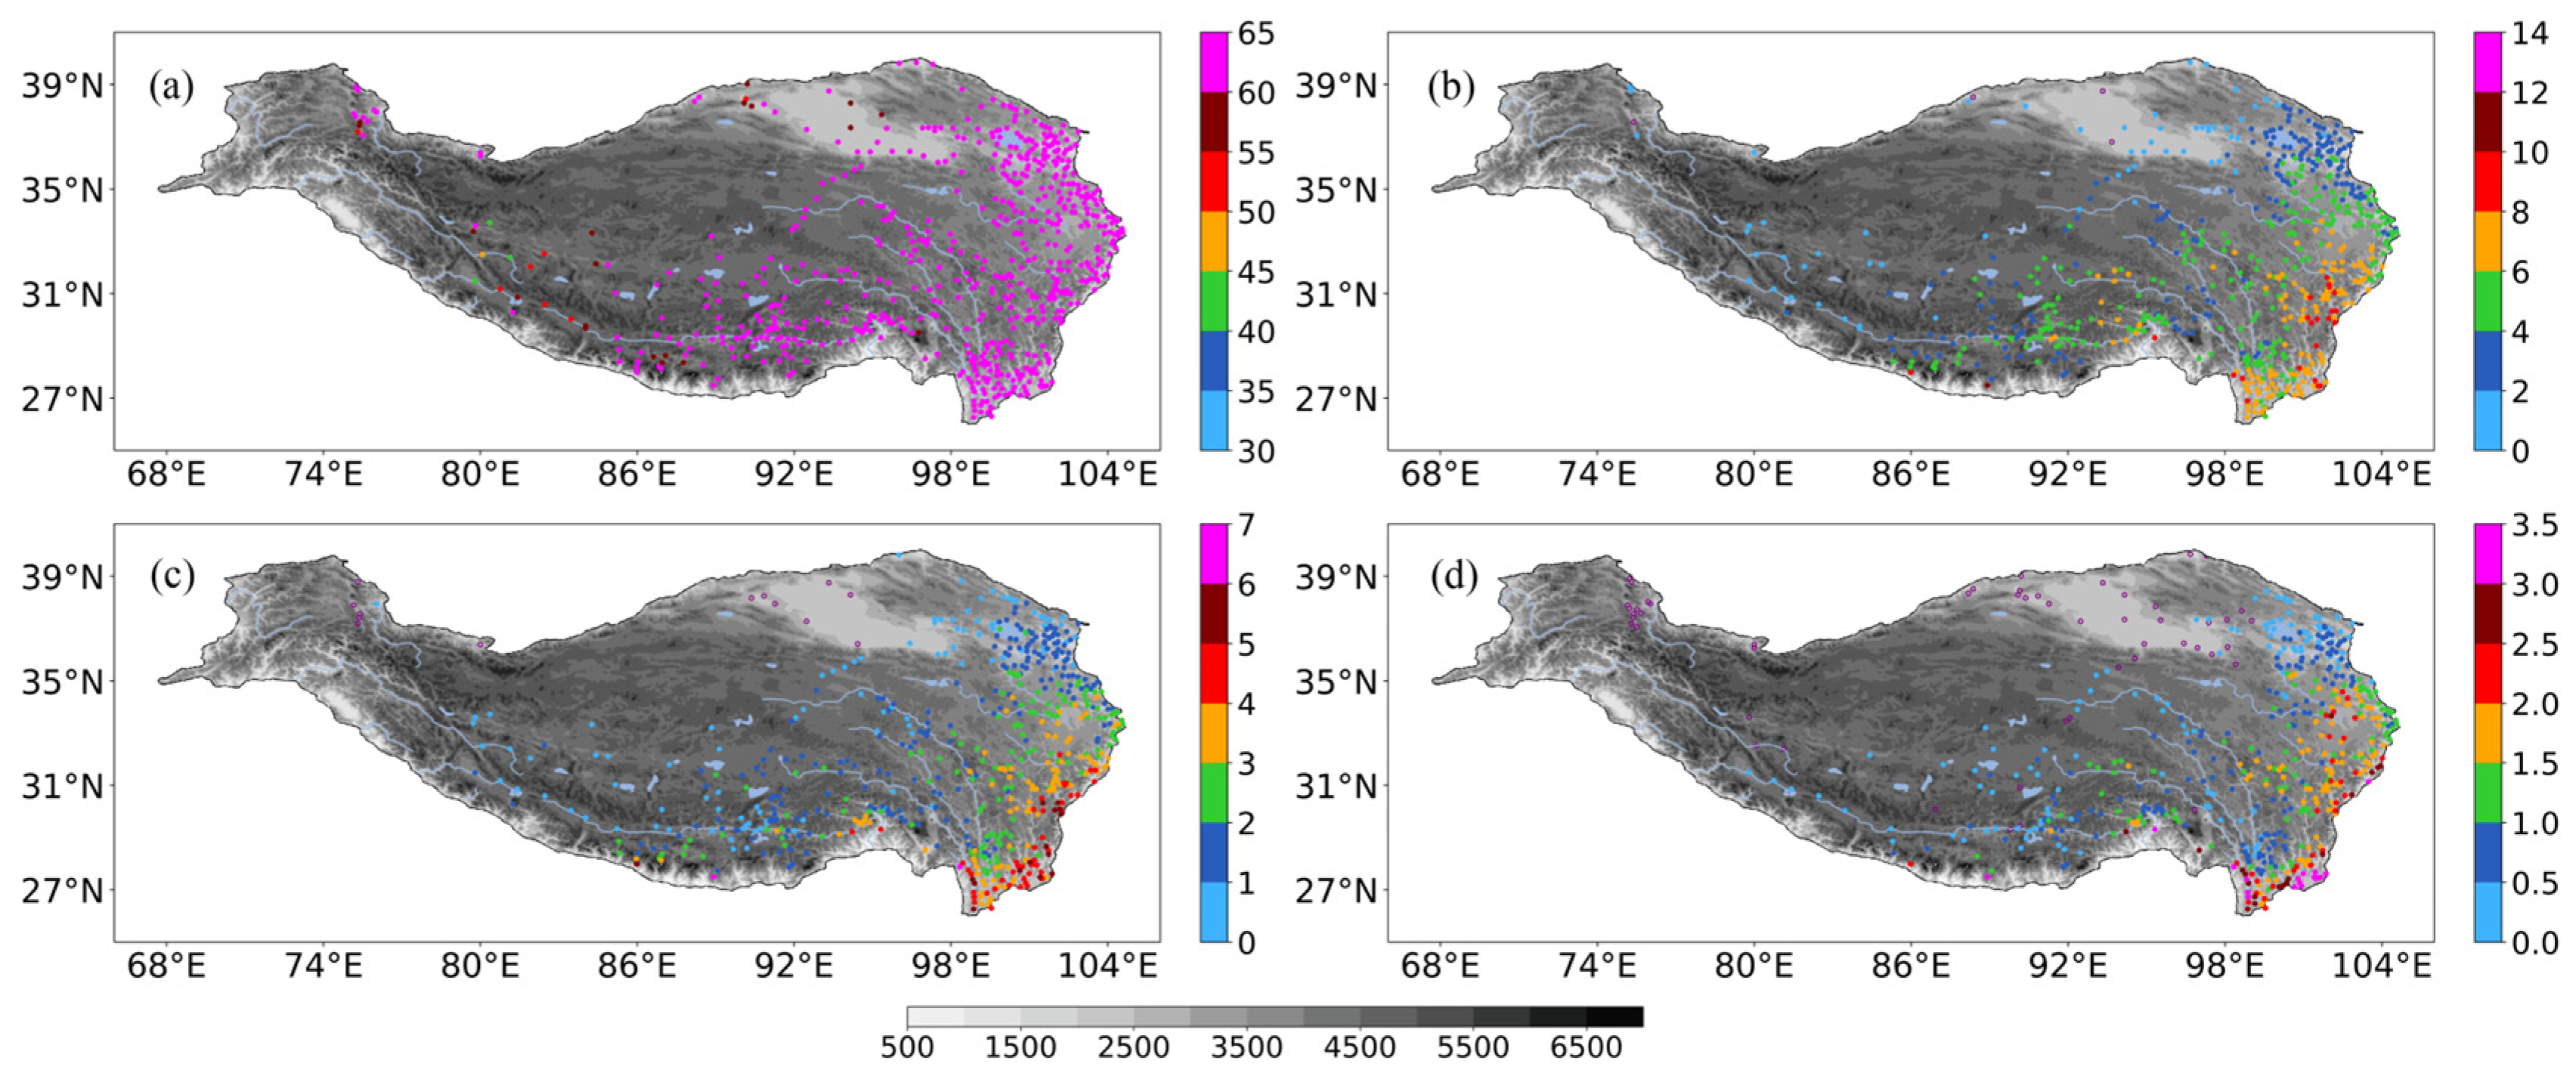
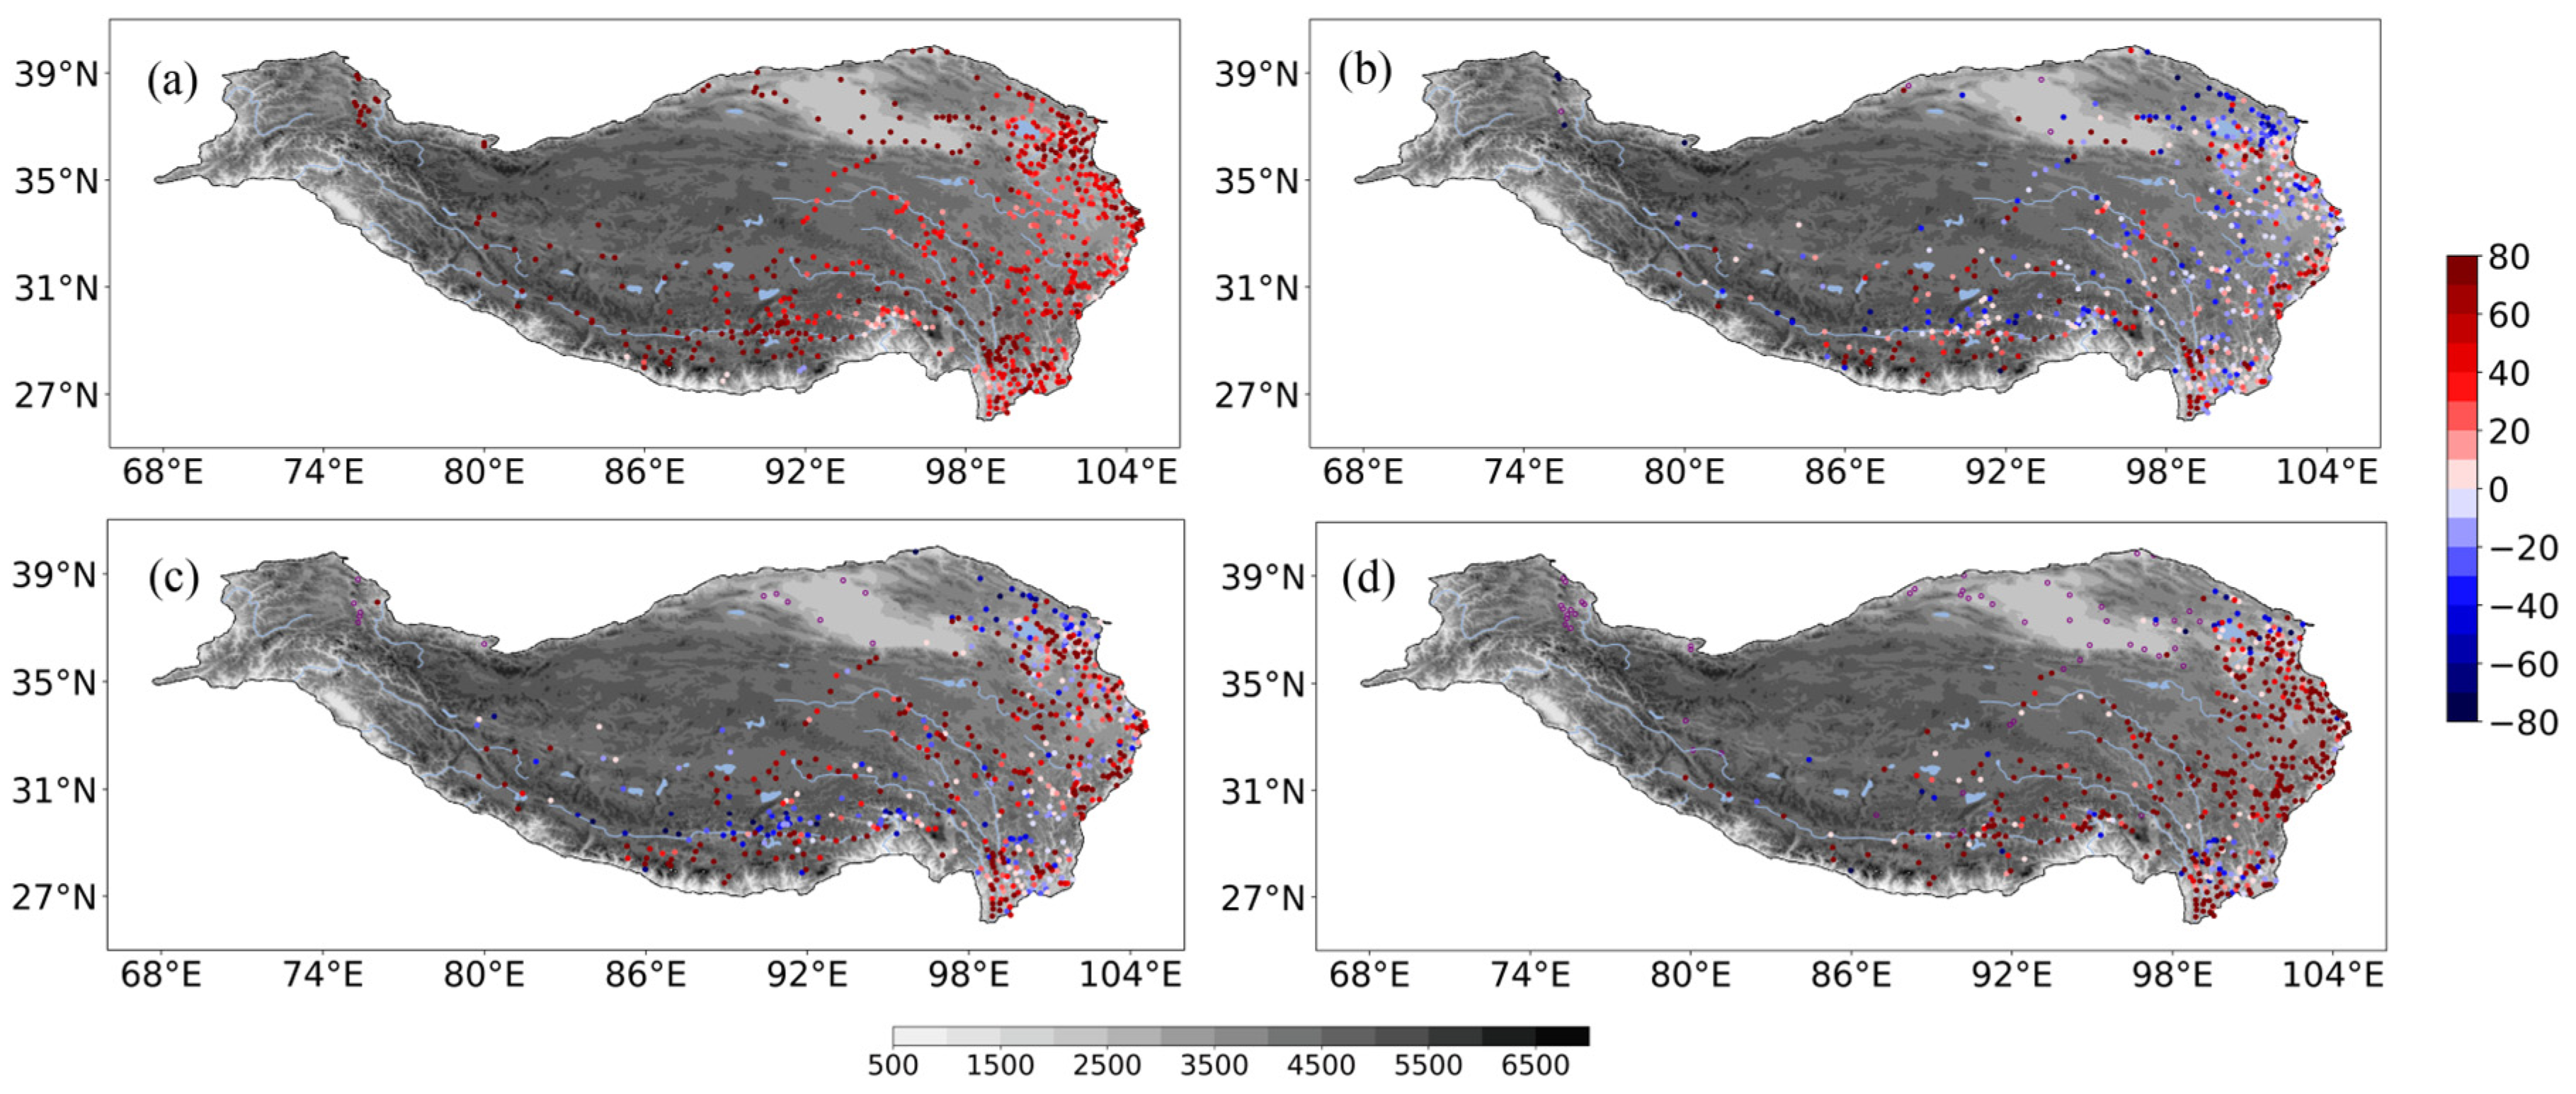
The above analysis illustrates that IMERG overestimated PI for light rainfall and underestimated PI for the rainfall levels greater than moderate rainfall. As daily PA increased, the differences in PI between the observed and estimated results were greater. Figure 6 and Figure 7 show the spatial distribution of PF at these four rainfall levels. The rain gauges’ largest PF at light rainfall occurred along the Yangtze River and the Yalu Zangbo River, and the lowest PF occurred in the western region of the TP and the Qaidam Basin (Figure 6a). However, the corresponding PF values for IMERG at all the stations were almost similar, between 60% and 65%, meaning that IMERG overestimated the PF for light rainfall (Figure 7a and Figure 8a) with a CC of 0.35 and RMSE of 28.66 (Table 1). The spatial distribution of RB between the observed and estimated PF shows that the largest RB occurred in the regions with low observed PF, such as the Pamir Plateau and the Qaidam Basin (Figure 8a). The spatial distribution of PF at the more-than-moderate rainfall level was different from that at the light rainfall level (Figure 6b–d). Moderate rainfall occurred more over the Qionglai Mountains, the southern regions of the Hengduan Mountains, and the eastern part of the Yalu Zangbo River (Figure 6b). The general features of the estimated PF at the moderate level were consistent with the observed result, but IMERG underestimated the frequency, especially in the regions with the highest observed PF (Figure 7b and Figure 8b). The apparent underestimation occurred in the northeastern part of the TP and on the northern side of Yalu Zangbo River (Figure 8b). However, IMERG overestimated the PF maxima on the southeastern edge of the TP (Figure 7c and Figure 8c). The CC (RMSE) for moderate and torrential rainfall were 0.69 and 0.60 (0.17 and 1.24), which means that IMERG estimated PF better at the moderate level with higher CC and lower RMSE (Table 1). In addition, overestimation of PF for torrential rainfall was larger than that for moderate rainfall (Figure 8b,c). The precipitation tended to occur over the southeastern regions of the TP with increasing daily PA. Extreme torrential rainfall mainly occurred over the eastern part of the TP and the maximum PF was concentrated in the southern region of the Hengduan Mountains (Figure 6d). However, for the IMERG estimate, PF was obviously larger than the observed result. In addition to the PF maxima in the southern regions of the Hengduan Mountains, PF also reached high values in the areas east of the Qionglai Mountains (Figure 7d). For most of the rain-gauge stations, IMERG overestimated PF for extreme rainfall with a CC of 0.48 and an RMSE of 1.06 (Table 1, Figure 8d).

3.3. Diurnal Variation of IMERG Precipitation Intensity and Frequency at the Hourly Scale

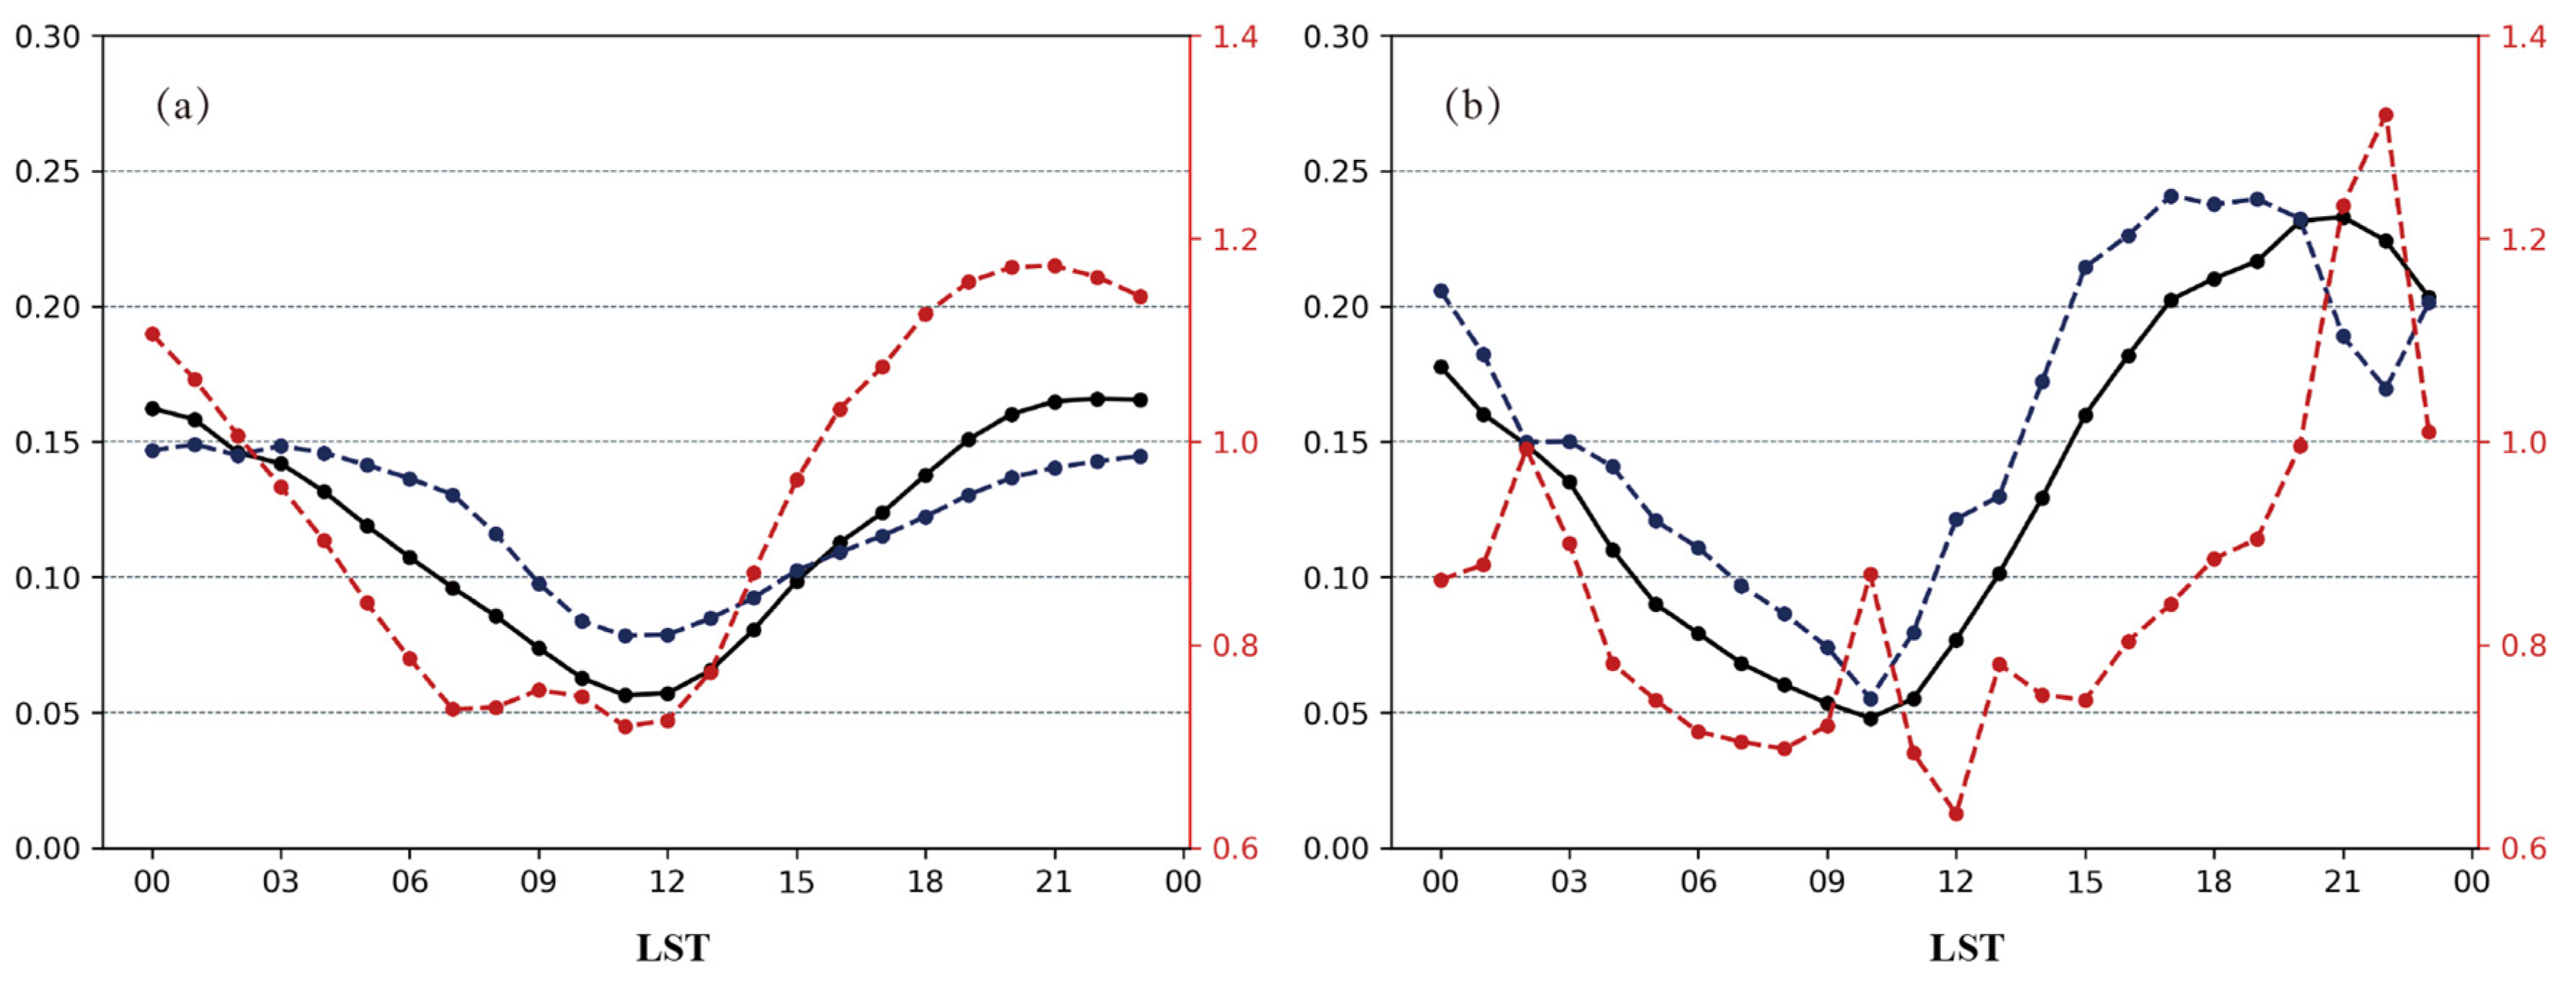
Due to the high temporal resolution of the IMERG precipitation product, the performance of the diurnal cycle of the estimated PI and PF should also be evaluated. The diurnal cycle of the rain-gauge averaged hourly PA, PI, and PF is shown in Figure 9. The observed hourly PA peaked in the late evening (22–23 LST) and reached its lowest point around midday (11–12 LST). The diurnal variation of PF was similar to that of PA, but the maximum PI occurred about two hours earlier (20–21 LST) than that of PA (Figure 9a). The lowest PF also occurred between the late morning and midday (~11 LST). The hourly PA of the IMERG hourly precipitation product reached its maximum at about 20 and 21 LST and had its minimum at 10 LST (Figure 9b). The diurnal variation of PF was broadly consistent with that of hourly PA, but the peak occurred about three hours earlier (17–19 LST). In contrast to the observed result, the strongest PI occurred at about 22 LST, which is about one hour later than the peak of the hourly PA (Figure 9b).
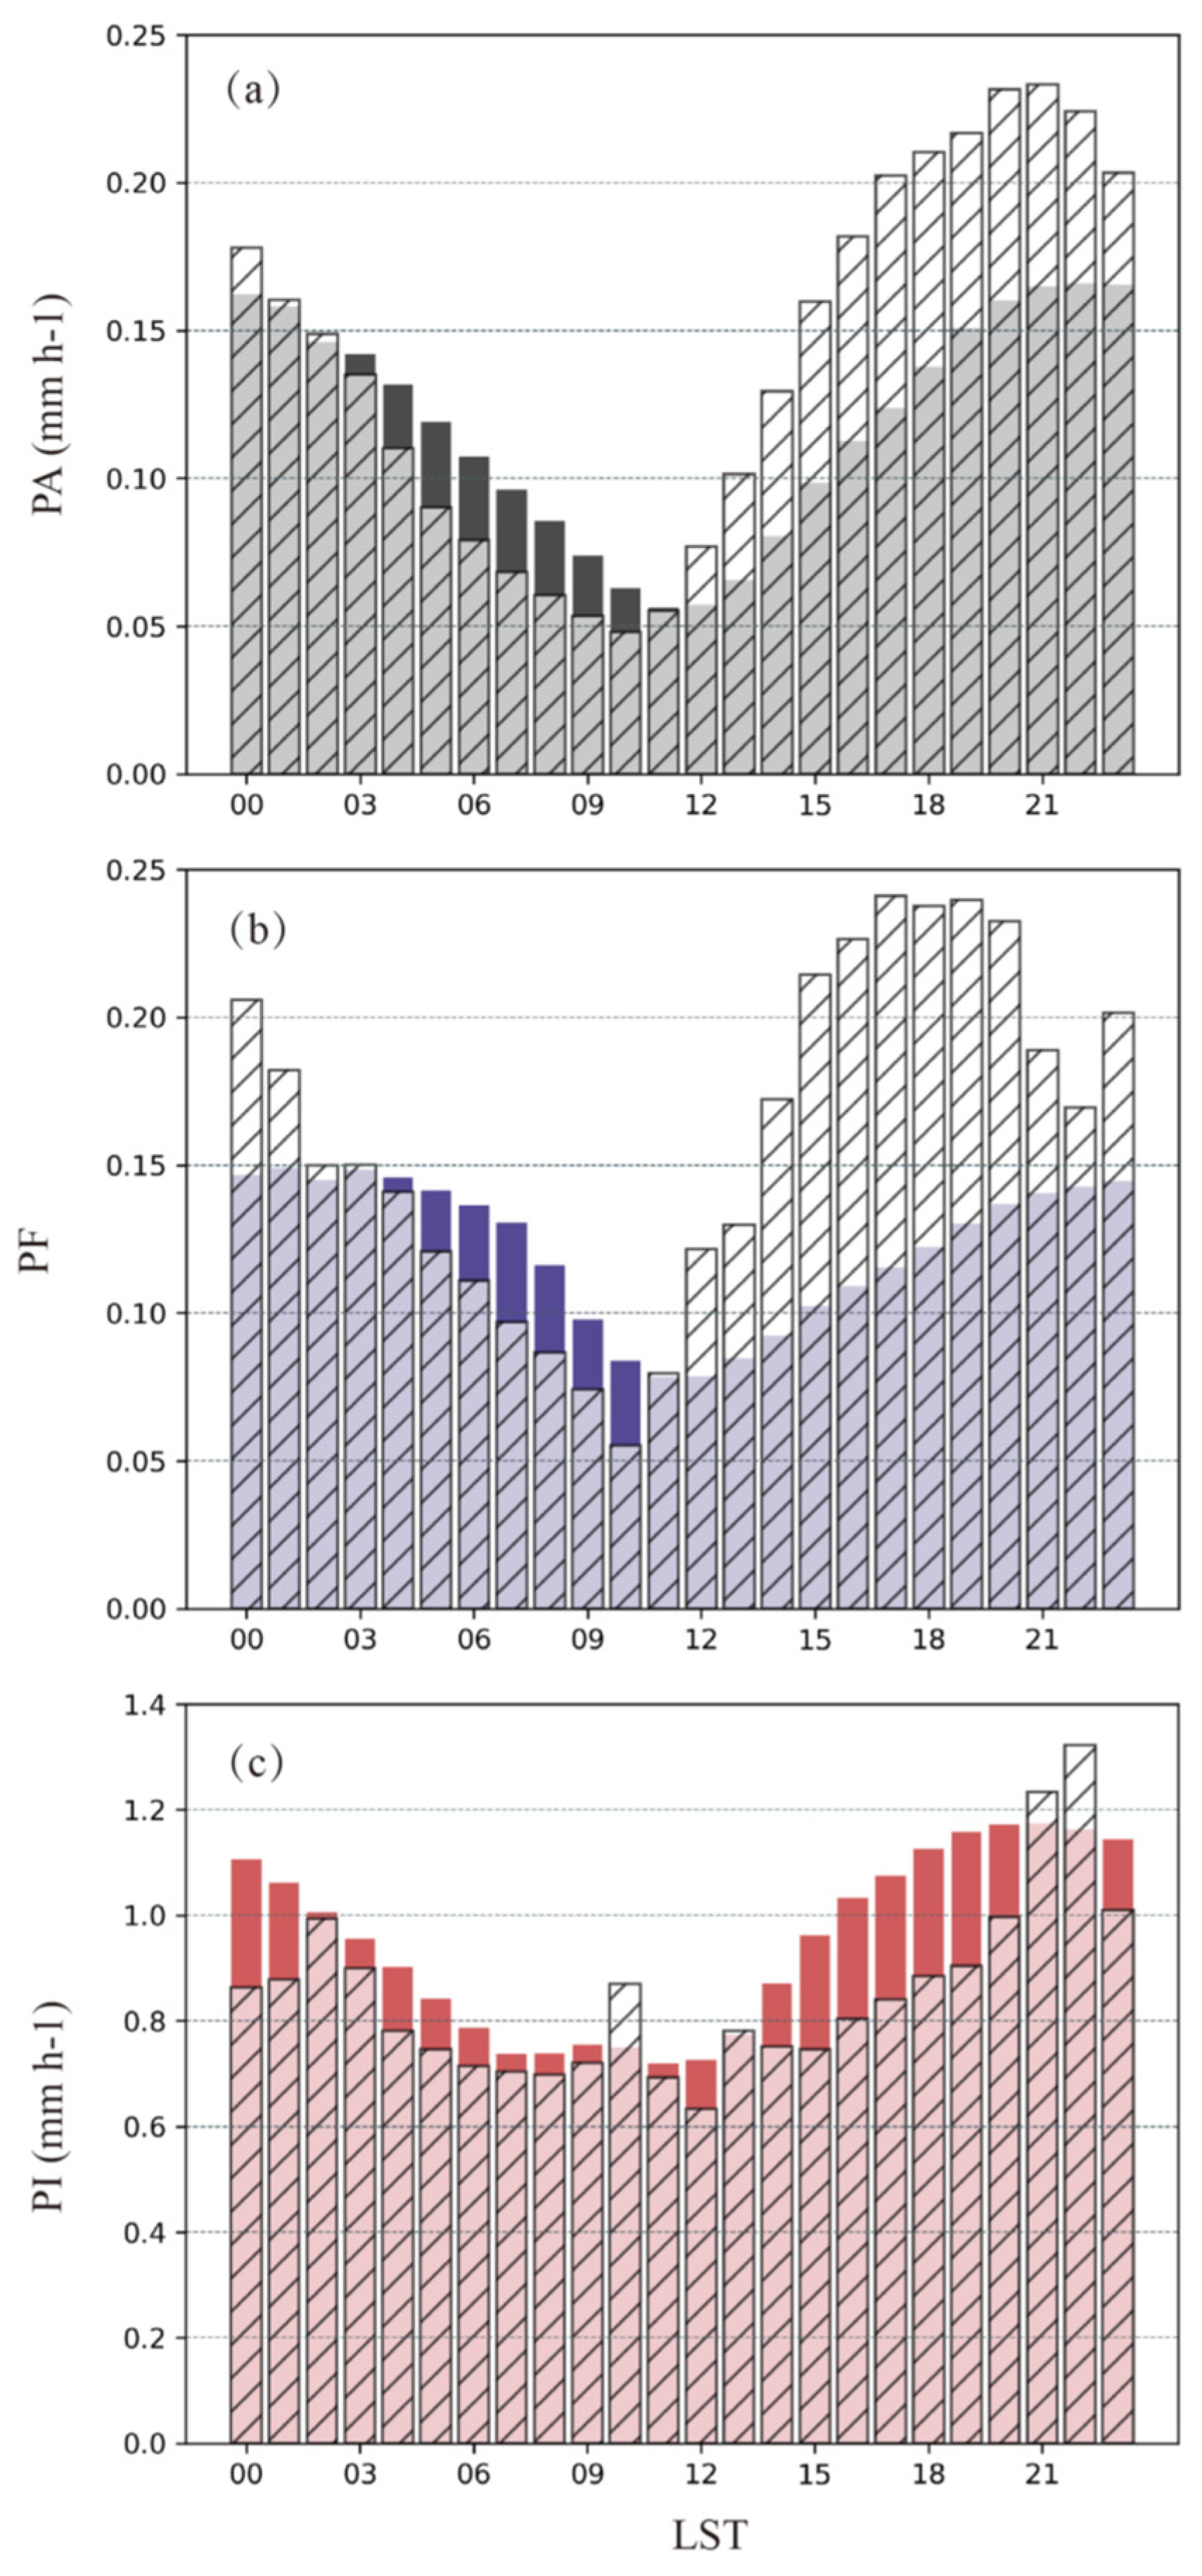
Figure 10 is intended to clarify the comparison of the diurnal variation of hourly precipitation between the observed (solid colored bars) and the estimated (bars filled with parallel lines) result. For hourly PA, IMERG underestimated the hourly PA between the early morning and midday (03–10 LST) and overestimated the hourly PA at other times. Discrepancies appeared between the afternoon and the evening (Figure 10a). The PF performance of the hourly precipitation product was similar to that of the hourly PA. IMERG also underestimated PF between the early morning and midday (04–10 LST) and overestimated PF between the afternoon and the evening. The largest overestimation occurred between the afternoon and the early evening (15–20 LST, Figure 10b). Figure 10c illustrates the diurnal variation of PI, which was different from that of PF. In general, IMERG underestimated PI at most hours of the day and overestimation occurred only at 10 LST, 21 LST, and 22 LST. In summary, it is clear that IMERG overestimated PF and underestimated PI mainly between the afternoon and the evening. The performance of the hourly PA depends on the estimation of PF. This analysis shows that IMERG estimated more precipitation hours than the observation and underestimated the PI.

4. Conclusion and Discussion

The performance of the IMERG V06 hourly rainfall product at daily and hourly scales was evaluated during the warm season (May to September) from 2015 to 2020, using 651 high-quality rain-gauge stations. In order to better assess daily and hourly precipitation, precipitation frequency (PF) intensity (PI) were calculated to further validate the accuracy and suitability of the IMERG estimated hourly precipitation product. The main findings are as follows.
At the daily scale, IMERG was able to capture the general spatial distribution characteristics of the observed precipitation with a high average spatial correlation coefficient. Based on observed daily precipitation, four categories were defined: light rainfall (0–12 mm·d−1), moderate rainfall (12–20.1 mm·d−1), torrential rainfall (20.1–32.2 mm·d−1), and extreme torrential rainfall (>32.2 mm·d−1). The assessment of PF in these four categories indicates that IMERG underestimated the occurrence of days with daily rainfall of less than moderate level, but overestimated the frequency of torrential and extreme torrential rainfall. IMERG could estimate the main properties of PF at different daily PA levels better than it could for PI, but the best estimate was at the moderate rainfall level.
In addition, at the hourly scale, IMERG underestimated the hourly PA mainly between the early morning and midday and overestimated it between the afternoon and late night. The IMERG hourly precipitation product overestimated PF and underestimated PI between the afternoon and the evening. It is shown that the performance of the hourly PA depends on the estimation of the PF. This analysis indicates that IMERG estimates more precipitation hours and less precipitation intensity than the observation.
This study focused on the evaluation of the IMERG hourly precipitation product at four daily rainfall levels. It found that IMERG can better estimate the daily precipitation at the moderate rainfall level. At both the daily and hourly scales, this estimated precipitation described more precipitation frequency and less precipitation intensity than the observed result. These new findings provide important information on the accuracy of the widely used IMERG precipitation products and the application of this data in climatic and hydrometeorological studies on rainfall over the TP. These results could also be a reference that will help further improve the IMERG retrieval algorithm, in order to better apply the corresponding precipitation product for light and extreme rainfall over regions with complicated topography. The more accurate IMERG precipitation products will be more widely used to improve climate and weather numerical initial conditions. However, the sparseness of observation stations limits more accurate evaluation of the IMERG precipitation products for the western TP. In addition, this evaluation method could also be used to investigate the accuracy and suitability of satellite precipitation products for other areas and regions of China.

Author Contributions

Conceptualization, Y.Z. and Y.H.; methodology, Y.H.; software, Y.H.; validation, H.X., T.L. and Q.Z.; investigation, T.L. and Q.Z.; formal analysis, Y.Z., Y. H. and S.W.; data curation, H.X., T.L. and Q.Z.; writing—original draft preparation, Y.Z.; writing—review and editing, Y.H., H.X. and S.W.; visualization, Y.H. All authors have read and agreed to the published version of the manuscript.

Funding

This work was supported by Open Fund of State Key Laboratory of Operation and Control of Renewable Energy & Storage Systems (China Electric Power Research Institute) (No. NYB51202201694).

Institutional Review Board Statement

Not applicable.

Informed Consent Statement

Not applicable.

Data Availability Statement

The GPM IMERG Final Run V06 half-hourly precipitation product is available at the website https://disc.gsfc.nasa.gov/datasets/GPM_3IMERGHH_06/summary?keywords=%22IMERG%20final%22 (accessed on 1 September 2022). Ground-based rain-gauge precipitation can be accessed at the website http://data.cma.cn/ (accessed on 30 May 2023) with approval from the China Meteorological Administration.

Conflicts of Interest

Hongyuan Xu, Taicong Long and Qidao Zhao are employees of Huadian Jinsha River Upstream Hydropower Development Co., Ltd. The paper reflects the views of the scientists, and not the company.

References

  1. Hsu, K.L.; Gao, X.; Sorooshian, S.; Gupta, H.V. Precipitation estimation from remotely sensed information using artificial neural networks. J. Appl. Meteor. 1997, 36, 1176–1190. [Google Scholar] [CrossRef]
  2. Joyce, R.J.; Janowiak, J.E.; Arkin, P.A.; Xie, P. CMORPH: A method that produces global precipitation estimates from passive microwave and infrared data at high spatial and temporal resolution. J. Hydrometeorol. 2004, 5, 487–503. [Google Scholar] [CrossRef]
  3. Huffman, G.J.; Bolvin, D.T.; Nelkin, E.J.; Wolff, D.B.; Adler, R.F.; Gu, G.; Hong, Y.; Bowman, K.P.; Stocker, E.F. The TRMM Multisatellite Precipitation Analysis (TMPA): Guasiglobal, multiyear, combined-sensor precipitation estimates at fine scales. J. Hydrometeorol. 2007, 8, 38–55. [Google Scholar] [CrossRef]
  4. Hou, A.Y.; Skofronick-Jackson, G.; Kummerow, C.D.; Shepherd, J.M. Global Precipitation Measurement. Part II: Precipitation: Advances in Measurement. In Estimation and Prediction; Springer: Berlin/Heidelberg, Germany, 2008; pp. 131–169. [Google Scholar] [CrossRef]
  5. Hou, A.Y.; Kakar, R.K.; Neeck, S.; Azarbarzin, A.A.; Kummerow, C.D.; Kojima, M.; Oki, R.; Nakamura, K.; Iguchi, T. The global precipitation measurement mission. Bull. Am. Meteor. Soc. 2014, 95, 701–722. [Google Scholar] [CrossRef]
  6. Abera, W.; Brocca, L.; Rigon, R. Comparative evaluation of different satellite rainfall estimation products and bias correction in the Upper Blue Nile (UBN) basin. Atmos. Res. 2016, 178–179, 471–483. [Google Scholar] [CrossRef]
  7. Chappell, A.; Renzullo, L.H.; Raupach, T.J.; Haylock, M. Evaluating geostatistical methods of blending satellite and gauge data to estimate near real-time daily rainfall for Australia. J. Hydrol. 2013, 493, 105–114. [Google Scholar] [CrossRef]
  8. Chen, F.; Li, X. Evaluation of IMERG and TRMM 3B43 monthly precipitation products over mainland China. Remote Sens. 2016, 8, 472. [Google Scholar] [CrossRef]
  9. Fang, J.; Yang, W.; Luan, Y.; Du, J.; Lin, A.; Zhao, L. Evaluation of the TRMM 3B42 and GPM IMERG products for extreme precipitation analysis over China. Atmos. Res. 2019, 223, 24–38. [Google Scholar] [CrossRef]
  10. Guo, H.; Chen, S.; Bao, A.M.; Behrangi, A.; Hong, Y.; Ndayisaba, F.; Hu, J.J.; Stepanian, P. Early assessment of integrated multi-satellite retrievals for global precipitation measurement over China. Atmos. Res. 2016, 176–177, 121–133. [Google Scholar] [CrossRef]
  11. He, Z.; Yang, L.; Tian, F.; Ni, G.; Hou, A.; Lu, H. Intercomparison of rainfall estimates from the TRMM and GPM multi-satellite products over the Upper-Mekong River Basin. J. Hydrometeorol. 2016, 18, 413–430. [Google Scholar] [CrossRef]
  12. Li, X.; O, S.; Wang, N.; Liu, L.; Huang, Y. Evaluation of the GPM IMERG V06 products for light rain over Mainland China. Atmos. Res. 2021, 253, 105510. [Google Scholar] [CrossRef]
  13. Liu, Z. Comparison of Integrated Multisatellite Retrievals for GPM (IMERG) and TRMM Multisatellite Precipitation Analysis (TMPA) monthly precipitation products: Initial results. J. Hydrometeorol. 2016, 17, 777–790. [Google Scholar] [CrossRef]
  14. Tang, G.; Ma, Y.; Long, D.; Zhong, L.; Hong, Y. Evaluation of GPM Day-1 IMERG and TMPA version-7 legacy products over mainland China at multiple spatiotemporal scales. J. Hydrol. 2016, 533, 152–167. [Google Scholar] [CrossRef]
  15. Wen, Y.; Behrangi, A.; Lambrigtsen, B.; Kirstetter, P.-E. Evaluation and uncertainty estimation of the latest radar and satellite snowfall products using SNOTEL measurements over mountainous regions in western United States. Remote Sens. 2016, 8, 904. [Google Scholar] [CrossRef]
  16. Aksu, H.; Taflan, G.Y.; Yaldiz, S.G.; Akgl, M.A. Evaluation of IMERG for GPM satellite-based precipitation products for extreme precipitation indices over Turkiye. Atmos. Res. 2023, 291, 106826. [Google Scholar] [CrossRef]
  17. Anjum, M.N.; Ding, Y.; Shangguan, D.; Ahmad, I.; Ijaz, M.W.; Farid, H.U.; Adnan, M. Performance evaluation of latest integrated multi-satellite retrievals for Global Precipitation Measurement (IMERG) over the northern highlands of Pakistan. Atmos. Res. 2018, 205, 134–146. [Google Scholar] [CrossRef]
  18. Kim, K.; Park, J.; Baik, J.; Choi, M. Evaluation of topographical and seasonal feature using GPM IMERG and TRMM 3B42 over Far-East Asia. Atmos. Res. 2017, 187, 95–105. [Google Scholar] [CrossRef]
  19. Pattnayak, K.C.; Awasthi, A.; Sharma, K.; Pattnayak, B.B. Fate of rainfall over the North Indian states in the 1.5 and 2 °C warming scenarios. Earth Space Sci. 2023, 10, e2022EA002671. [Google Scholar] [CrossRef]
  20. Prakash, S.; Mitra, A.K.; AghaKouchak, A.; Liu, Z.; Norouzi, H.; Pai, D.S. A preliminary assessment of GPM-based multi-satellite precipitation estimates over a monsoon dominated region. J. Hydrol. 2016, 556, 865–876. [Google Scholar] [CrossRef]
  21. Sharma, S.; Chen, Y.Y.; Zhou, X.; Yang, K.; Li, X.; Niu, X.; Hu, X.; Khadka, N. Evaluation of GPM-Era Satellite Precipitation Products on the Southern Slopes of the Central Himalayas Against Rain Gauge Data. Remote Sens. 2020, 12, 1836. [Google Scholar] [CrossRef]
  22. Lu, X.; Wei, M.; Tang, G.; Zhang, Y. Evaluation and correction of the TRMM 3B43V7 and GPM 3IMERGM satellite precipitation products by use of ground-based data over Xinjiang, China. Environ. Earth Sci. 2018, 77, 209. [Google Scholar] [CrossRef]
  23. Ning, S.; Wang, J.; Jin, J.; Ishidaira, H. Assessment of the latest GPM-Era High-Resolution Satellite Precipitation Products by Comparison with Observation Gauge Data over the Chinese mainland. Water 2016, 8, 481. [Google Scholar] [CrossRef]
  24. Tan, M.L.; Santo, H. Comparison of GPM IMERG, TMPA 3B42 and PERSIANN-CDR satellite precipitation products over Malaysia. Atmos. Res. 2018, 202, 63–76. [Google Scholar] [CrossRef]
  25. Yuan, F.; Wang, B.; Shi, C.; Cui, W.; Zhao, C.; Liu, Y.; Ren, L.; Zhang, L.; Zhu, Y.; Chen, T.; et al. Evaluation of hydrological utility of IMERG Final run V05 and TMPA 3B42V7 satellite precipitation products in the Yellow River source region, China. J. Hydrol. 2018, 567, 696–711. [Google Scholar] [CrossRef]
  26. Derin, Y.; Anagnostou, E.; Berne, A.; Borga, M.; Boudevillain, B.; Buytaert, W.; Chang, C.-H.; Delrieu, G.; Hong, Y.; Hsu, Y.C.; et al. Multiregional satellite precipitation products evaluation over complex terrain. J. Hydrometeorol. 2016, 17, 1817–1836. [Google Scholar] [CrossRef]
  27. Zhang, Y. Integration Dataset of Tibet Plateau Boundary; A Big Earth Data Platform for Three Poles: Lanzhou, China, 2019. [CrossRef]
  28. Webster, P.J.; Magana, V.O.; Palmer, T.N.; Shukla, J.; Tomas, R.A.; Yanai, M.; Yasunari, T. Monsoons: Processes, predictability, and the prospects for prediction. J. Geophys. Res. Oceans. 1998, 103, 14451–14510. [Google Scholar] [CrossRef]
  29. Yanai, M.; Li, C.; Song, Z. Seasonal heating of the Tibetan Plateau and its effects on the evolution of the Asian summer monsoon. J. Meteor. Soc. Jap. 1992, 70, 319–351. [Google Scholar] [CrossRef]
  30. Ye, D.; Gao, Y. The Meteorology of the Qinghai-Xizang (Tibet); Science Press: Beijing, China, 1979; pp. 1–278. [Google Scholar]
  31. Yong, B.; Hong, Y.; Ren, L.-L.; Gourley, J.J.; Huffman, G.J.; Chen, X.; Wang, W.; Khan, S.I. Assessment of evolving TRMM-based multi satellite real-time precipitation estimation methods and their impacts on hydrologic prediction in a high latitude basin. J. Geophys. Res. 2012, 117, D09108. [Google Scholar] [CrossRef]
  32. Chen, F.; Ding, L.; Piao, S.L.; Zhou, T.J.; Xu, B.Q.; Yao, T.D.; Xin, L. The Tibetan Plateau as the engine for Asian environmental change: The Tibetan Plateau Earth system research into a new era. Sci. Bull. 2020, 66, 1264–1266. [Google Scholar] [CrossRef]
  33. Li, Z.; Yang, D.; Hong, Y. Multi-scale evaluation of high-resolution multi-sensor blended global precipitation products over the Yangtze River. J. Hydrol. 2013, 500, 157–169. [Google Scholar] [CrossRef]
  34. Gao, Y.C.; Liu, M.F. Evaluation of high-resolution satellite precipitation products using rain gauge observations over the Tibetan Plateau. Hydrol. Earth Syst. Sci. 2013, 17, 837–849. [Google Scholar] [CrossRef]
  35. Shen, Y.; Xiong, A.; Hong, Y.; Yu, J.; Pan, Y.; Chen, Z.; Saharia, M. Uncertainty analysis of five satellite-based precipitation products and evaluation of three optimally merged multi-algorithm products over the Tibetan Plateau. Int. J. Remote Sens. 2014, 35, 6843–6858. [Google Scholar] [CrossRef]
  36. Haile, A.T.; Yan, F.; Habib, E. Accuracy of the CMORPH satellite-rainfall product over Lake Tana Basin in Eastern Africa. Atmos. Res. 2015, 163, 177–187. [Google Scholar] [CrossRef]
  37. Gao, Z.; Long, D.; Tang, G.; Zeng, C.; Huang, J.; Hong, Y. Assessing the potential of satellite-based precipitation estimates for flood frequency analysis in ungauged or poorly gauged tributaries of China’s Yangtze River basin. J. Hydrol. 2017, 550, 478–496. [Google Scholar] [CrossRef]
  38. Huang, X.; Wang, D.; Liu, Y.; Feng, Z.; Wang, D. Evaluation of extreme precipitation based on satellite retrievals over China. Front. Earth Sci. 2018, 12, 846–861. [Google Scholar] [CrossRef]
  39. Zhan, C.; Chen, Y.; Yang, K.; Lazhu; Jiang, Y.; Ling, X.; Tian, J.; Wang, Y.; Yang, H. First evaluation of GPM-Era satellite precipitation products with new observations on the western Tibetan Plateau. Atmos. Res. 2023, 283, 106559. [Google Scholar] [CrossRef]
  40. Yu, C.; Hu, D.; Liu, M.; Wang, S.; Di, Y. Spatio-temporal accuracy evaluation of three high-resolution satellite precipitation products in China area. Atmos. Res. 2020, 241, 104952. [Google Scholar] [CrossRef]
  41. Zhang, S.; Wang, D.; Qin, Z.; Zheng, Y.; Guo, J. Assessment of the GPM and TRMM Precipitation Products Using the Rain Gauge Network over the Tibetan Plateau. J. Meteor. Res. 2018, 32, 324–336. [Google Scholar] [CrossRef]
  42. Wang, Y.; Miao, C.; Zhao, X.; Zhang, Q.; Su, J. Evaluation of the GPM IMERG product at the hourly timescale over China. Atmos. Res. 2023, 285, 106656. [Google Scholar] [CrossRef]
  43. Chen, H.; Yong, B. Comparison analysis of six purely satellite-derived global precipitation estimates. J. Hydrol. 2020, 581, 124376. [Google Scholar] [CrossRef]
  44. Su, J.; Lü, H.; Zhu, Y.; Wang, X.; Wei, G. Component Analysis of Errors in Four GPM-Based Precipitation Estimations over Mainland China. Remote Sens. 2018, 10, 1420. [Google Scholar] [CrossRef]
  45. Wang, D.; Wang, X.; Liu, L.; Wang, D.; Huang, H.; Pan, C. Evaluation of TMPA 3B42V7, GPM IMERG and CMPA precipitation estimates in Guangdong Province, China. Int. J. Climatol. 2019, 39, 738–755. [Google Scholar] [CrossRef]
  46. Xu, R.; Tian, F.; Yang, L.; Hu, H.; Lu, H.; Hou, A. Ground validation of GPM IMERG and TRMM 3B42V7 rainfall products over southern Tibetan Plateau based on a high-density rain gauge network. J. Geophys. Res.-Atmos. 2017, 122, 910–924. [Google Scholar] [CrossRef]
  47. Huffman, G.; Bolvin, D.; Braithwaite, D.; Hsu, K.; Joyce, R. Algorithm Theoretical Basis Document (ATBD) NASA Global Precipitation Measurement (GPM) Integrated Multi-Satellite Retrievals for GPM (IMERG); NASA: Washington, DC, USA, 2019; Volume 29.
  48. Tan, J.; Huffman, G.J.; Bolvin, D.T.; Nelkin, E.J. IMERG V06: Changes to the Morphing Algorithm. J. Atmos. Ocean. Technol. 2019, 36, 2471–2482. [Google Scholar] [CrossRef]
  49. Zhou, T.; Yu, R.; Chen, H.M.; Dai, A.G.; Pan, Y. Summer Precipitation Frequency, Intensity, and Diurnal Cycle over China: A Comparison of Satellite Data with Rain Gauge Observations. J. Clim. 2008, 21, 3997–4010. [Google Scholar] [CrossRef]
  50. Mastylo, M. Bilinear interpolation theorems and applications. J. Funct. Anal. 2013, 265, 185–207. [Google Scholar] [CrossRef]
  51. Sun, Y.; Solomon, S.; Dai, A.; Portmann, R.W. How Often Will It Rain? J. Clim. 2007, 20, 4801–4818. [Google Scholar] [CrossRef]
  52. Zhang, Y.; Li, B.; Liu, L.; Zheng, D. Redetermine the region and boundaries of Tibetan Plateau. Geogr. Res. 2021, 40, 1543–1553. [Google Scholar]
  53. Cavalcante, R.B.L.; da Silva Ferreira, D.B.; Pontes, P.R.M.; Tedeschi, R.G.; da Costa, C.P.W.; de Souza, E.B. Evaluation of extreme rainfall indices from CHIRPS precipitation estimates over the Brazilian Amazonia. Atmos. Res. 2020, 238, 104879. [Google Scholar] [CrossRef]
  54. Zhou, Z.; Guo, B.; Xing, W.; Zhou, J.; Xu, F.; Xu, Y. Comprehensive evaluation of latest GPM era IMERG and GSMaP precipitation products over mainland China. Atmos. Res. 2020, 246, 105132. [Google Scholar] [CrossRef]
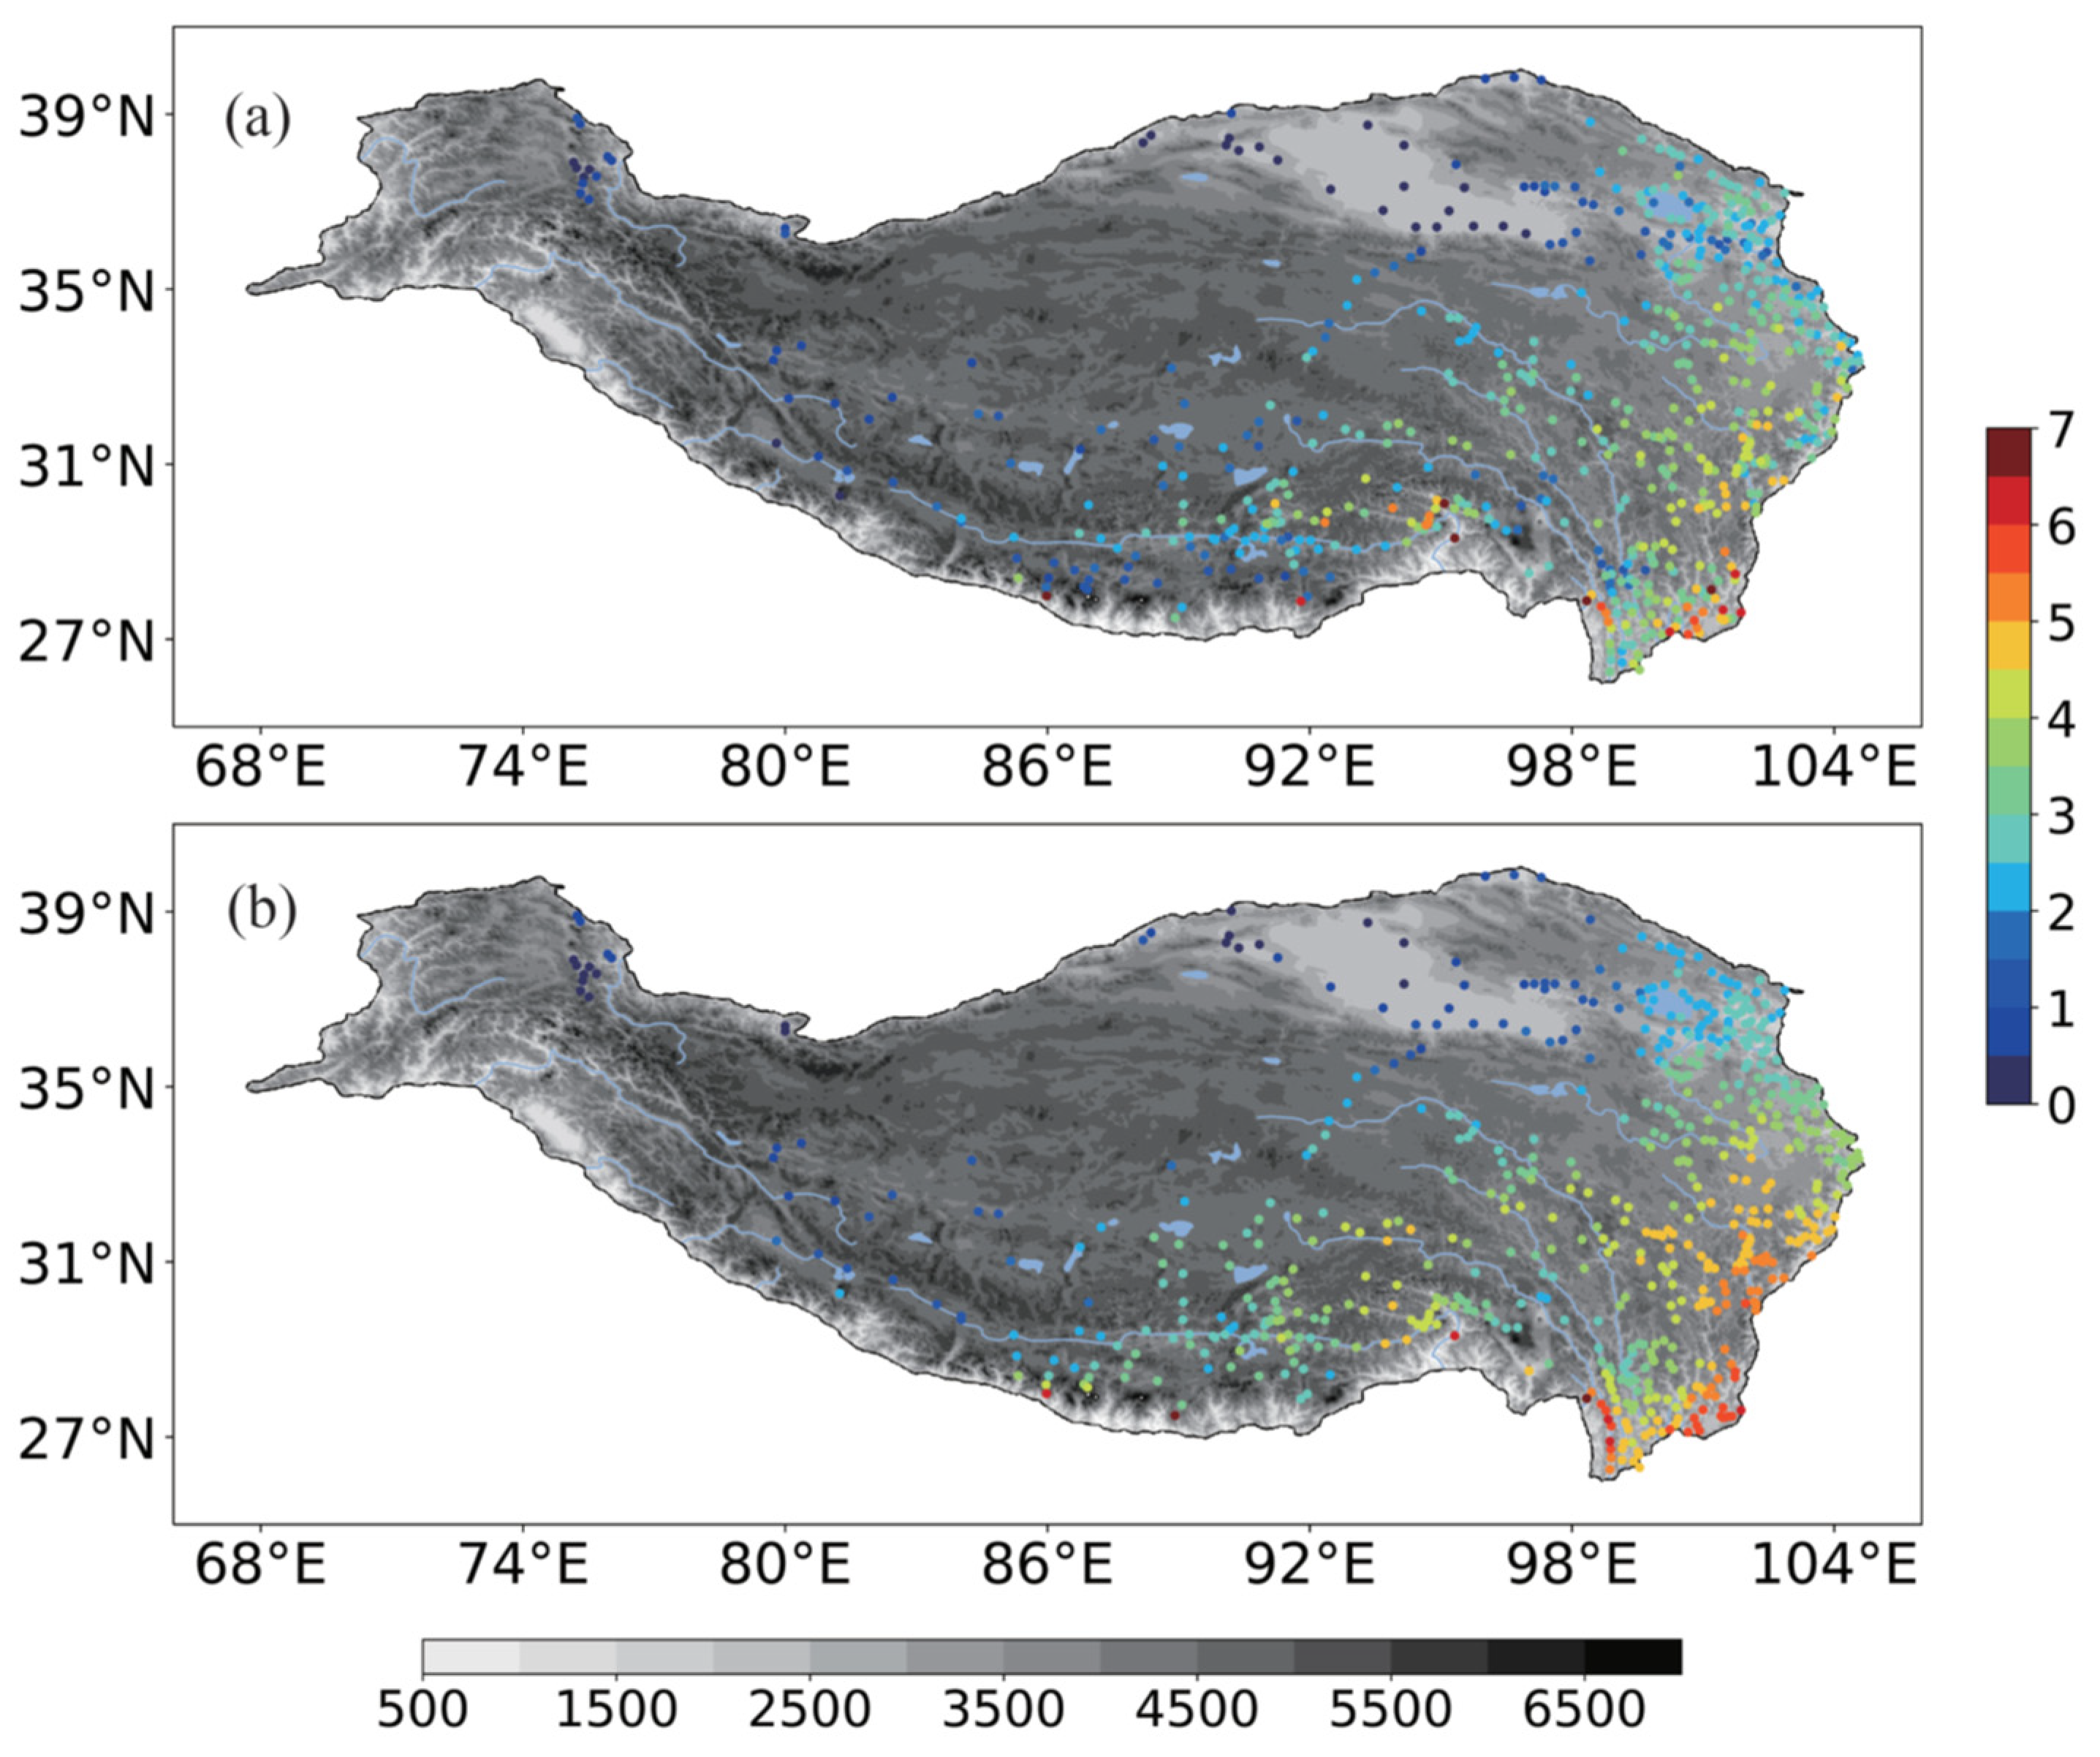
Figure 1. Spatial distribution of mean daily precipitation amount during the warm season from 2015 to 2020. (a) rain gauge observation, (b) IMERG (units: mmd−1). The grey shading symbolizes the terrain elevation (units: m).
Atmosphere 14 01653 g001
Figure 2. Spatial distribution of mean daily PI (upper row, units:mm·d−1) and PF (middle row) of rain gauges (left column, (a,c)) and IMERG (right column, (b,d)). (e) is RB of PI between the observed and IMERG and (f) is RB of PF between the observed and IMERG (units: %). The grey shading symbolizes the terrain elevation (units: m).
Atmosphere 14 01653 g002
Figure 3. The spatial distribution of rain-gauge PI at different daily rainfall levels (units: mm·d−1). (a) light rainfall, (b) moderate rainfall, (c) torrential rainfall, (d) extreme torrential rainfall. The hollow purple circles mean that the PI values of these stations are zero at the corresponding category. The gray shading symbolizes the topography elevation (units: m).
Atmosphere 14 01653 g003
Figure 4. The spatial distribution of the IMERG-estimated PI at different daily rainfall levels (units: mm·d−1). (a) light rainfall, (b) moderate rainfall, (c) torrential rainfall, (d) extreme torrential rainfall. The hollow purple circles mean that the PI values of these stations are zero at the corresponding category. The gray shading symbolizes the topography elevation (units: m).
Atmosphere 14 01653 g004
Figure 5. The spatial distribution of RB of PI between the rain gauge and IMERG at different daily rainfall levels (units: mm·d−1). (a) light rainfall, (b) moderate rainfall, (c) torrential rainfall, (d) extreme torrential rainfall. The hollow purple circles mean that the PI values of these stations are zero at the corresponding category. The gray shading symbolizes the topography elevation (units: m).
Atmosphere 14 01653 g005
Figure 6. The spatial distribution of PF of rain gauges at different daily rainfall levels (units: %). (a) light rainfall, (b) moderate rainfall, (c) heavy rainfall, (d) extreme torrential rainfall. The hollow purple circles indicate that these sites do not have precipitation at this category. The gray shading symbolizes the terrain elevation (units: m).
Atmosphere 14 01653 g006
Figure 7. The spatial distribution of PF of IMERG at different daily rainfall levels (units: %). (a) light rainfall, (b) moderate rainfall, (c) heavy rainfall, (d) extreme torrential rainfall. The hollow purple circles indicate that these sites do not have precipitation at this category. The gray shading symbolizes the terrain elevation (units: m).
Atmosphere 14 01653 g007
Figure 8. The spatial distribution of RB of PF between the rain gauge and IMERG at different daily rainfall levels (units: %). (a) light rainfall, (b) moderate rainfall, (c) torrential rainfall, (d) extreme torrential rainfall. The hollow purple circles mean that the PI values of these stations are zero at the corresponding category. The gray shading symbolizes the topography elevation (units: m).
Atmosphere 14 01653 g008
Figure 9. Diurnal variation of the rain-gauge hourly PA (black solid line), PF (blue dashed line), and PI (red dashed line). (a) rain gauges, (b) IMERG.
Atmosphere 14 01653 g009
Figure 10. Diurnal variation of IMERG (bars filled with parallel lines) and rain gauges (solid colored bars, black bars are for PA, blue bars are for PF and red bars are for PI). (a) hourly PA (units: mm·h−1), (b) PF, (c) PI (units: mm·h−1).
Atmosphere 14 01653 g010
Table 1. Evaluation metrics of PI and PF for each daily rainfall category.
Daily PA
Levels
Daily PA
(mm d−1)
PIPF
CCRMSE
(mm)
CCRMSE
(mm)
Light(0,12]0.311.430.3528.66
Moderate(12,20.1]0.184.860.690.17
Torrential(20.1,32.2]0.188.660.601.24
Extreme torrential>32.2−0.0322.220.481.06
Disclaimer/Publisher’s Note: The statements, opinions and data contained in all publications are solely those of the individual author(s) and contributor(s) and not of MDPI and/or the editor(s). MDPI and/or the editor(s) disclaim responsibility for any injury to people or property resulting from any ideas, methods, instructions or products referred to in the content.