Article

Ozone Sensitivity Analysis and Ozone Formation Regimes Division in the Beijing–Tianjin–Hebei Region Based on Satellite Remote Sensing Data

1
College of Resource Environment and Tourism, Capital Normal University, Beijing 100048, China
2
Satellite Application Center for Ecology and Environment, MEE, Beijing 100048, China
*
Authors to whom correspondence should be addressed.
Atmosphere 2023, 14(11), 1637; https://doi.org/10.3390/atmos14111637
Submission received: 17 September 2023 / Revised: 27 October 2023 / Accepted: 30 October 2023 / Published: 31 October 2023
(This article belongs to the Special Issue Study of Air Pollution Based on Remote Sensing)

Abstract

:
In recent years, the concentration of surface ozone (O3) has increased in China. The formation regime of ozone is closely related to the ratio of volatile organic compounds (VOCs) to nitrogen oxides (NOx). To explain this increase in ozone, we determined the sensitivity of ozone generation by determining the regional threshold of the ratio of formaldehyde to nitrogen dioxide (HCHO/NO2) in the satellite troposphere. The different FNR(HCHO/NO2) ratio ranges indicate three formation regimes: VOC limited, transitional, and NOx limited. Polynomial fitting models were used to determine the threshold range for the transitional regime in the BTH region (2.0, 3.1). The ozone formation regime in the BTH (Beijing–Tianjin–Hebei) region mainly exhibited a transitional and NOx-limited regime. VOC-limited regimes are mainly distributed in urban agglomeration areas, transitional regimes are mainly concentrated in urban expansion areas, and non-urban areas are mainly controlled by NOx. The concentrations of HCHO and NO2 in the BTH region showed a trend of urban agglomeration areas > urban expansion areas > non-urban areas in different land types from 2019 to 2022, whereas the FNR showed an opposite trend.

1. Introduction

In recent years, with the continuous development of the economy and society, the increasing use of energy, the constant growth of human activities, and the consumption of large amounts of fossil fuels, environmental air quality has significantly deteriorated, and there have been several air pollution incidents. Since 2013, the Chinese government has implemented several governance plans; however, under these measures, although PM2.5 has been significantly controlled, ozone concentration has increased. Various provinces and cities have also adopted strong measures, with atmospheric particulate matter and most gaseous pollutants continuously decreasing nationwide [1]; however, the ozone concentration remains high. Ozone pollution incidents are frequent, and ozone is gradually replacing PM2.5 as the primary pollutant [2].
Ozone is an important trace gas in the atmosphere, with stratospheric ozone accounting for approximately 90% and tropospheric ozone approximately 10% [3]. Ozone plays a crucial role in protecting life through the absorption of harmful ultraviolet rays from the sun. However, surface ozone may pose a threat to human health and the environment. It is formed from the reactions of its precursors such as volatile organic compounds (VOCs) and nitrogen oxides (NOx), which were mainly emitted from cars, factories, and other sources, under sunlight. Exposure to high levels of surface ozone can cause a range of health problems, including coughing, throat irritation, chest pain, and shortness of breath. It can also exacerbate asthma and other respiratory diseases, making it difficult for people to breathe [4,5,6,7].
Ozone pollution mainly occurs in urban areas with developed industrial transportation and dense populations [8]. When the precursor of ozone is sufficient, favorable meteorological conditions (e.g., strong solar radiation and high temperature) can exacerbate ozone pollution, exhibiting regional characteristics. In addition, the relationship between ozone generation and its precursors, such as VOCs and NOx, is nonlinear. Controlling the emission of a single precursor may not effectively reduce ozone concentration, and it may have the opposite effect in some regions [9,10]. The sensitivity of ozone generation to NOx and VOCs varies in different environments. According to different sensitivities, the ozone generation control zone can be divided into VOC-limited, NOx-limited, and transitional regimes. If ozone generation in a certain area is in the NOx-limited regime, this indicates that changes in the NOx concentration have the greatest impact on ozone generation. Conversely, in the VOC-limited regime, the control of ozone concentration is based mainly on VOCs. In the transitional regime, reducing any precursor can reduce the ozone concentration [11]. HCHO is a short-term oxidation product of many volatile organic compounds (VOCs), and is an intermediate product of the oxidation of almost all volatile organic compounds (VOCs). Therefore, It can therefore indicate the overall level of VOCs and can be measured by satellite. Due to the short lifespan of NOx and the high proportion of NO2/NOx in the boundary layer, NOx can be approximated by satellite observations of the NO2 column concentration [12].
Research has found that HCHO/NO2 is a more suitable indicator for assessing ozone generation sensitivity based on satellite data. The transition range of HCHO/NO2 from VOC-limited to NOx-limited regimes varies significantly across different regions of China; VOCs are the limited factor in large urban agglomerations and concentrated in developed cities, and NOx-limited regimes dominate the rest [13,14,15]. The key threshold for the ozone formation regime in China is currently unclear [16,17], and most existing studies on ozone generation sensitivity based on satellite data have used the ozone generation sensitivity indicator FNR(HCHO/NO2) threshold classification standard established by Duncan et al. in 2010. In the United States, an air quality model was used, and a photochemical box model was generated to quantify the impact of FNR on ozone generation. Thus, HCHO/NO2 is usually used as a transitional regime with the ratio range of (1.0, 2.0) [11]. The threshold for the ozone generation sensitivity index (FNR) were based on model simulations in the US environmental context. However, the actual situation is that there are differences in factors such as ozone precursor emissions, meteorological conditions, and terrain in different regions; therefore, the threshold for FNR has regional differences. This means that we need to reassess and adjust the threshold based on the characteristics of BTH region, to grasp the regime of ozone formation more accurately. Such customized strategies will help to develop more effective VOCs and NOx reduction strategies to address ozone pollution issues in the BTH region [18].
To effectively control ozone pollution, it is necessary to accurately understand the regime of ozone formation, particularly the key thresholds for the ratio of volatile organic compounds (VOCs) and nitrogen oxides (NOx), in key areas of BTH. Based on this understanding, more effective VOCs and NOx reduction strategies should be developed for different ozone formation regimes, to provide reference opinions on ozone governance in the BTH region.
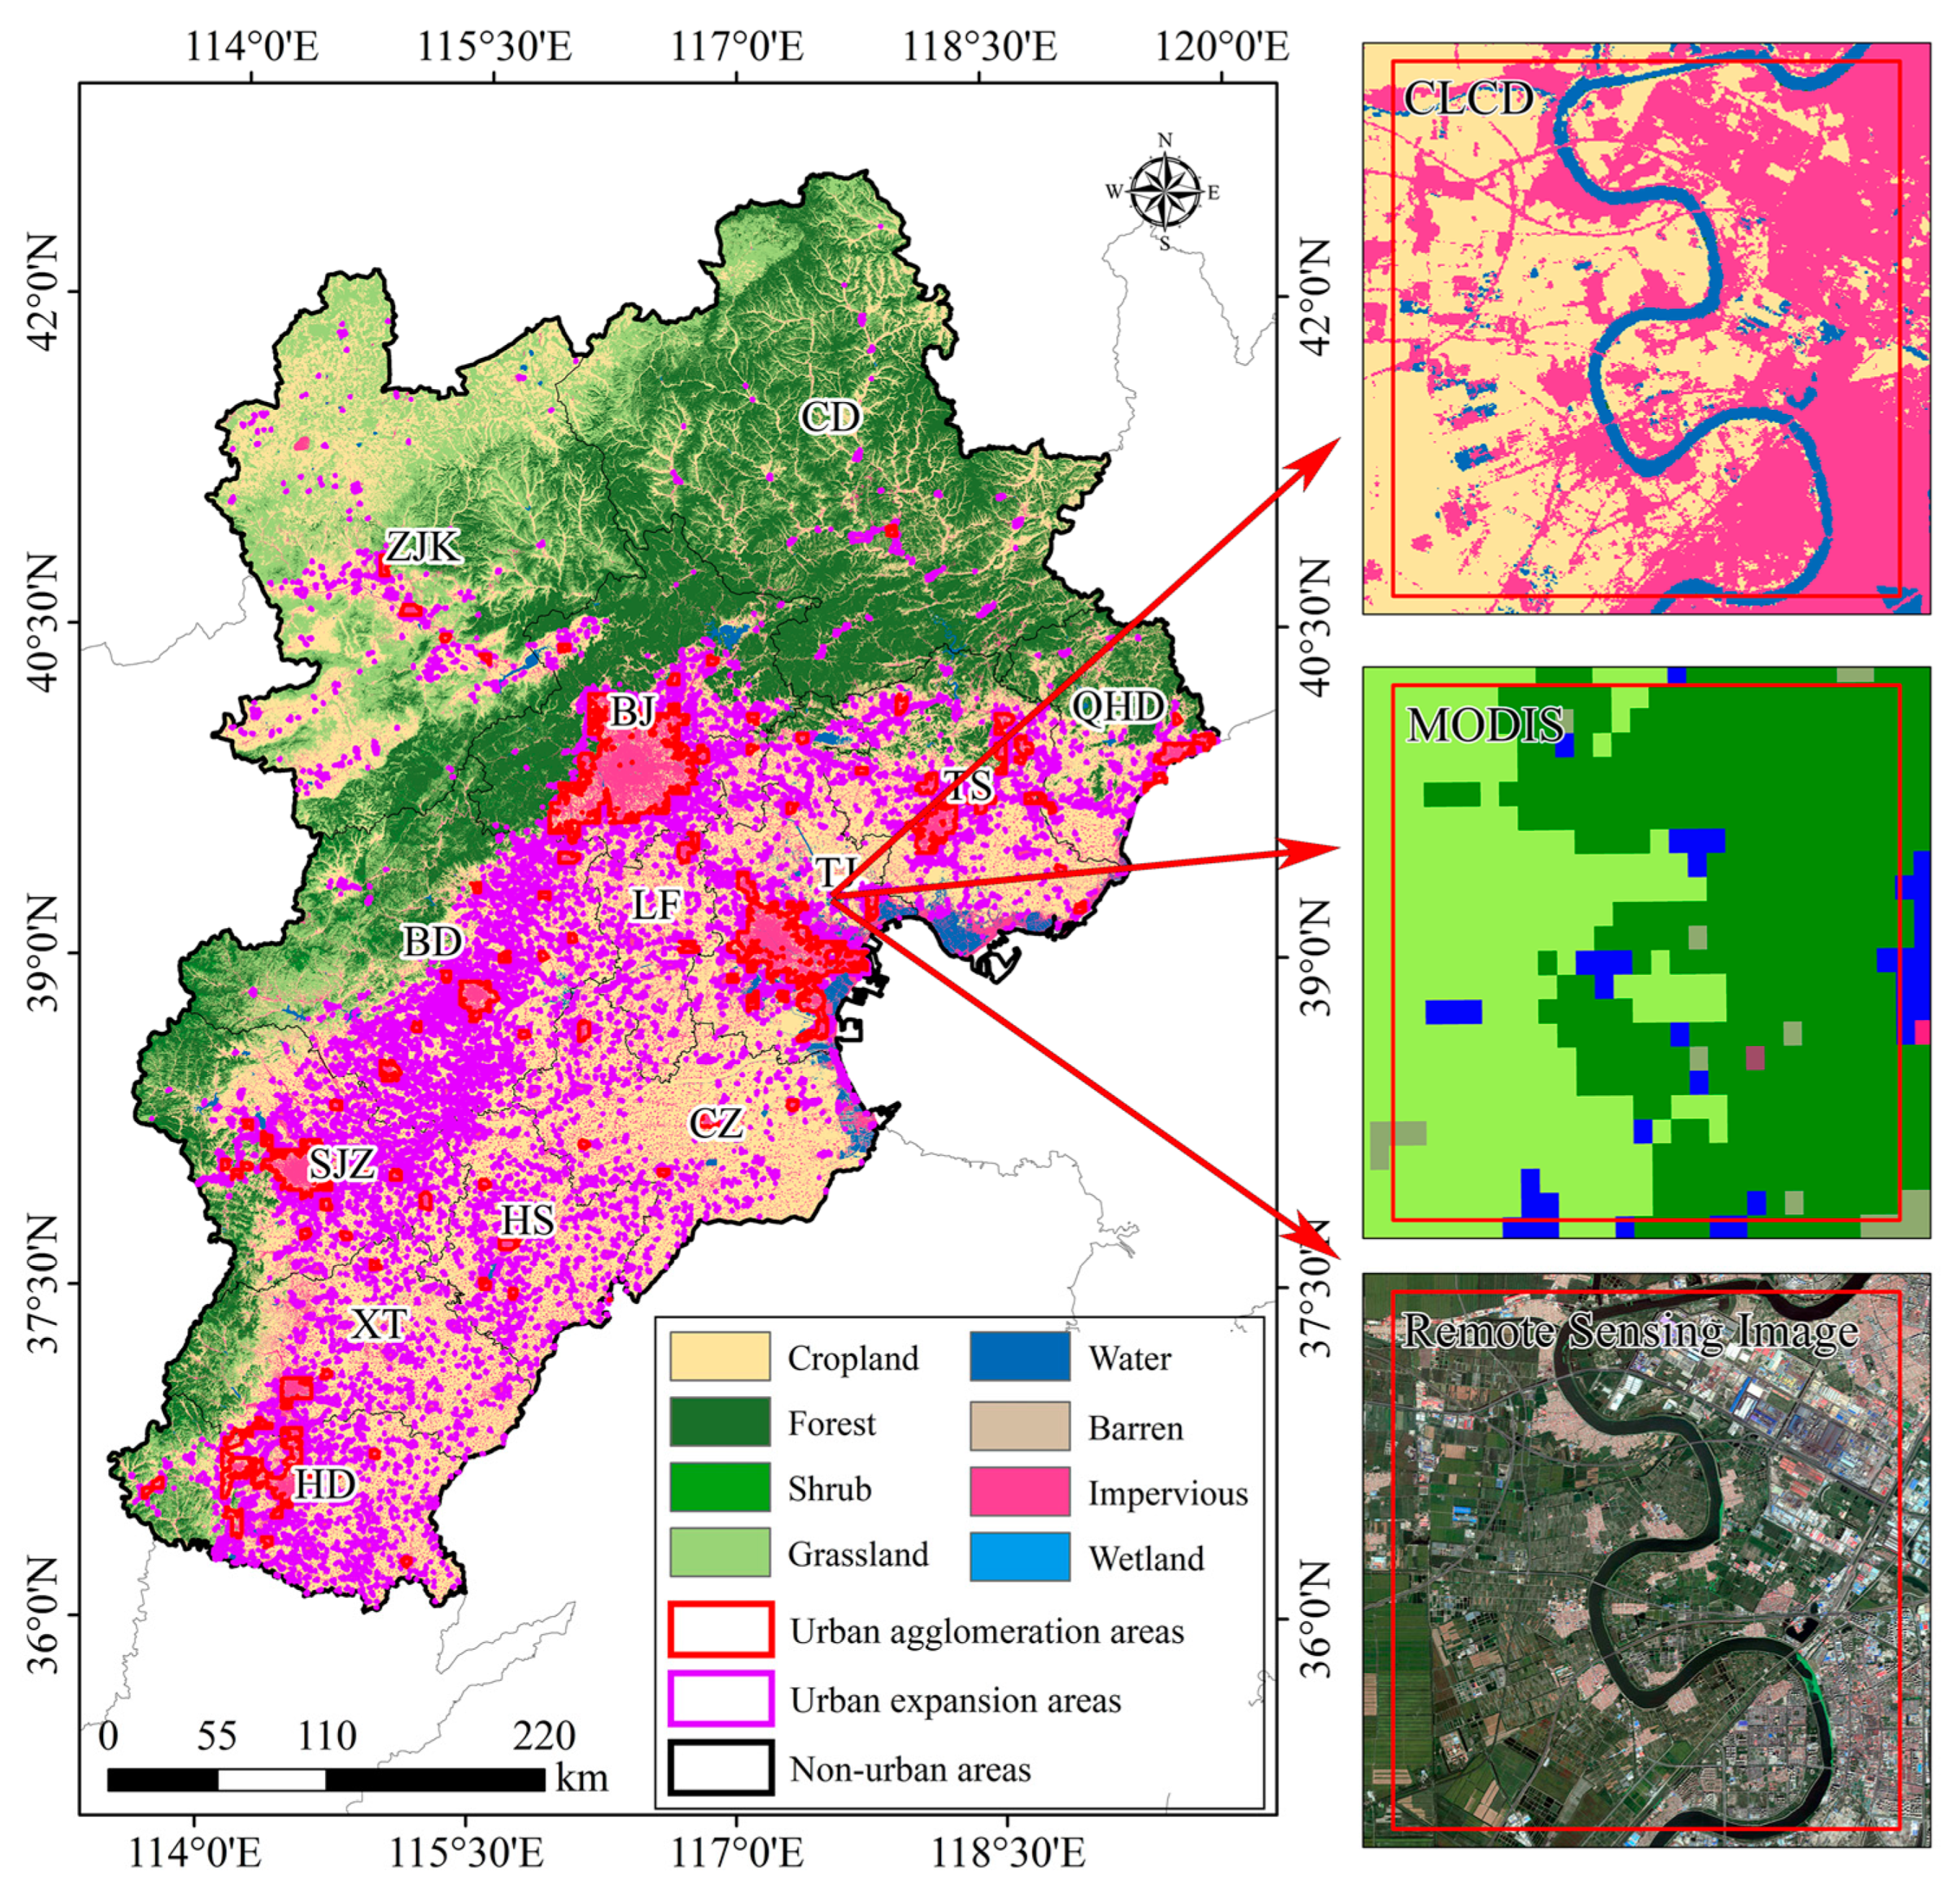
The Beijing–Tianjin–Hebei region (BTH) (113°27′–119°50′ E, 36°05′–42°40′ N) is located in the North China Plain. It is China’s “capital economic circle”, including 13 cities (Figure 1), namely Beijing (BJ), Tianjin (TJ), Baoding (BD), Tangshan (TS), Langfang (LF), Shijiazhuang (SJZ), Handan (HD), Qinhuangdao (QHD), Zhangjiakou (ZJK), Chengde (CD), Cangzhou (CZ), Xingtai(XT), and Hengshui(HS). The gross domestic product of the BTH region in 2022 is 10.0 trillion yuan [19]. Spring and summer in the BTH region are mostly humid and rainy, affected by a southeast wind, and the weather in autumn is relatively stable with a changeable wind direction. In winter, the area is usually affected by the northwest wind, and is cold, dry and prone to haze. Meteorological conditions will vary according to season and terrain. The BTH region is the largest and most dynamic economic region in northern China and is one of the areas with the densest transportation and logistics networks. The BTH region is an important economic growth pole and driving force for China, and the BTH region has a flat terrain, complex climatic conditions, hot and humid summers, and a strong atmospheric stable layer, which is conducive to the formation and accumulation of ozone [20]. Industry and transportation are developed in the region, with high emissions of ozone precursors from sectors of steel production, oil refining, chemical industry, coal combustion and motor vehicle exhaust [21]. In recent years, ozone concentration has shown an annual increasing trend with a clear seasonal variation [22,23,24]. The average concentration of all national control stations in a city is considered to be the average level of ozone in that city, and observation data can be directly used with a high degree of reliability. Monitoring stations do not need to rely on emission inventories and reduce the uncertainty they bring, but as the monitoring station is relatively few this leads to monitoring data lacking sufficient detail, which limits our comprehensive understanding of the overall distribution of ozone sensitivity in large urban agglomerations. We can use remote sensing data to fill the gap between monitoring stations and to provide continuous coverage. Although research methods based on satellite remote sensing data may be limited by satellite transit time and the uncertainty of the satellite data inversion itself, they have various advantages, such as wide coverage, continuous observation, low cost, constant optimization, and improved spatial resolution [25]. Therefore, studying the sensitivity of ozone generation based on satellite remote sensing data is considered an ideal research method that can help so solve the problem of insufficient understanding of the overall distribution of ozone sensitivity in large urban agglomerations.
We used machine and deep learning methods to obtain ozone profiles in the middle and lower tropospheres, by inputting satellite observational data. We obtained surface ozone data, comprehensively evaluated the latest trends in ozone concentrations, and compared the HCHO and NO2 column concentrations provided by the TROPOMI with those of surface ozone. By matching satellite-based HCHO/NO2 measurements with near-surface O3 measurements in various cities in Beijing, Tianjin, and Hebei, we obtained the threshold for the formation and transformation of labeled O3, and used it to identify sensitivity indicators for ozone generation and evaluate the regime of ozone formation.

2. Materials and Methods

2.1. Data Sources

2.1.1. TROPOMI HCHO/NO2

The Tropospheric Monitoring Instrument (TROPOMI) is used for atmospheric composition observations carried out on the Copernicus Sentinel-5 Precursor (S5P) satellite. This instrument can effectively observe trace gas components in the atmosphere worldwide, including indicators related to human activities, such as NO2, O3, SO2, HCHO, CH4, and CO, and strengthen the observation of aerosols and clouds. TROPOMI imaging has a width of 2600 km and covers various parts of the world daily. It has a transit time of 13:30 and the imaging resolution was 7 km × 3.5 km. It can more accurately monitor various atmospheric pollutants with significant improvements compared to previous atmospheric composition remote sensing instruments such as the Moderate-resolution Imaging Spectroradiometer (MODIS), Ozone Monitoring Instrument (OMI), Ozone Mapping and Profiler Suite (OMPS), and Atmospheric Composition Analysis Spectrometer (SCHIMACHY) [26,27,28]. This study used the TROPOMI’s HCHO and NO2 column concentration datasets and calculated HCHO/NO2 to study the spatiotemporal changes in HCHO, NO2, and HCHO/NO2 in the BTH region.
The TROOMI Level 2 data products come from three different data streams: near real-time (NRTI), non-time critical or offline (OFFL), and reprocessing (RPRO). NRTI data are available within 3 h of data collection and are suitable for users who need quick access to data and rapid operational processing. However, NRTI data may sometimes be incomplete and have slightly lower data quality than other data streams. Most data users should use offline data available within a few days of collection or the latest version of the reprocessed data. For long-term trend analysis, the latest version of the reprocessed data should be used to avoid changes caused by data version updates. This study used OFFL data with higher data quality and a larger sample size to achieve higher accuracy.
Daily NO2 and HCHO column concentration data were selected for the L2 levels in 2019 and 2022. The storage method for the TROOMI raw data is in netCF4 format, using Python to write scripts, download batches, convert to raster files, perform concatenation, cropping, resampling, and remove outliers. Finally, the daily data were combined into a monthly dataset to calculate the monthly and annual mean concentrations of the NO2 and HCHO columns. TROOMI L2 raw data unit is mol/m2.

2.1.2. Surface Ozone Data

The ozone concentration information from ground stations does not accurately reflect the overall ozone concentration. Satellite observation is an effective supplementary method for ground observations that can provide long-term and high-coverage spatial distribution and change information on ozone and its precursors in the troposphere. The China High Air Pollutants (CHAP) dataset was used for analyzing near-ground ozone concentrations from 2019 to 2020, which considers the spatiotemporal heterogeneity of air pollution and is generated from big data using artificial intelligence, such as ground measurement, remote sensing products, atmospheric reanalysis, and model simulation.
The surface ozone concentrations in 2021 and 2022 were based on a combination of machine and deep learning. Using this method, we trained the inversion model using the training samples. Based on a well-trained inversion model, near-ground ozone concentration information for the corresponding region can be obtained by inputting satellite observation data. The training sample specifically includes AOD0.55 data, ERA5 feature data, TROOMI Level 2 feature data, time feature data, and near ground ozone concentration data obtained from ground base stations.
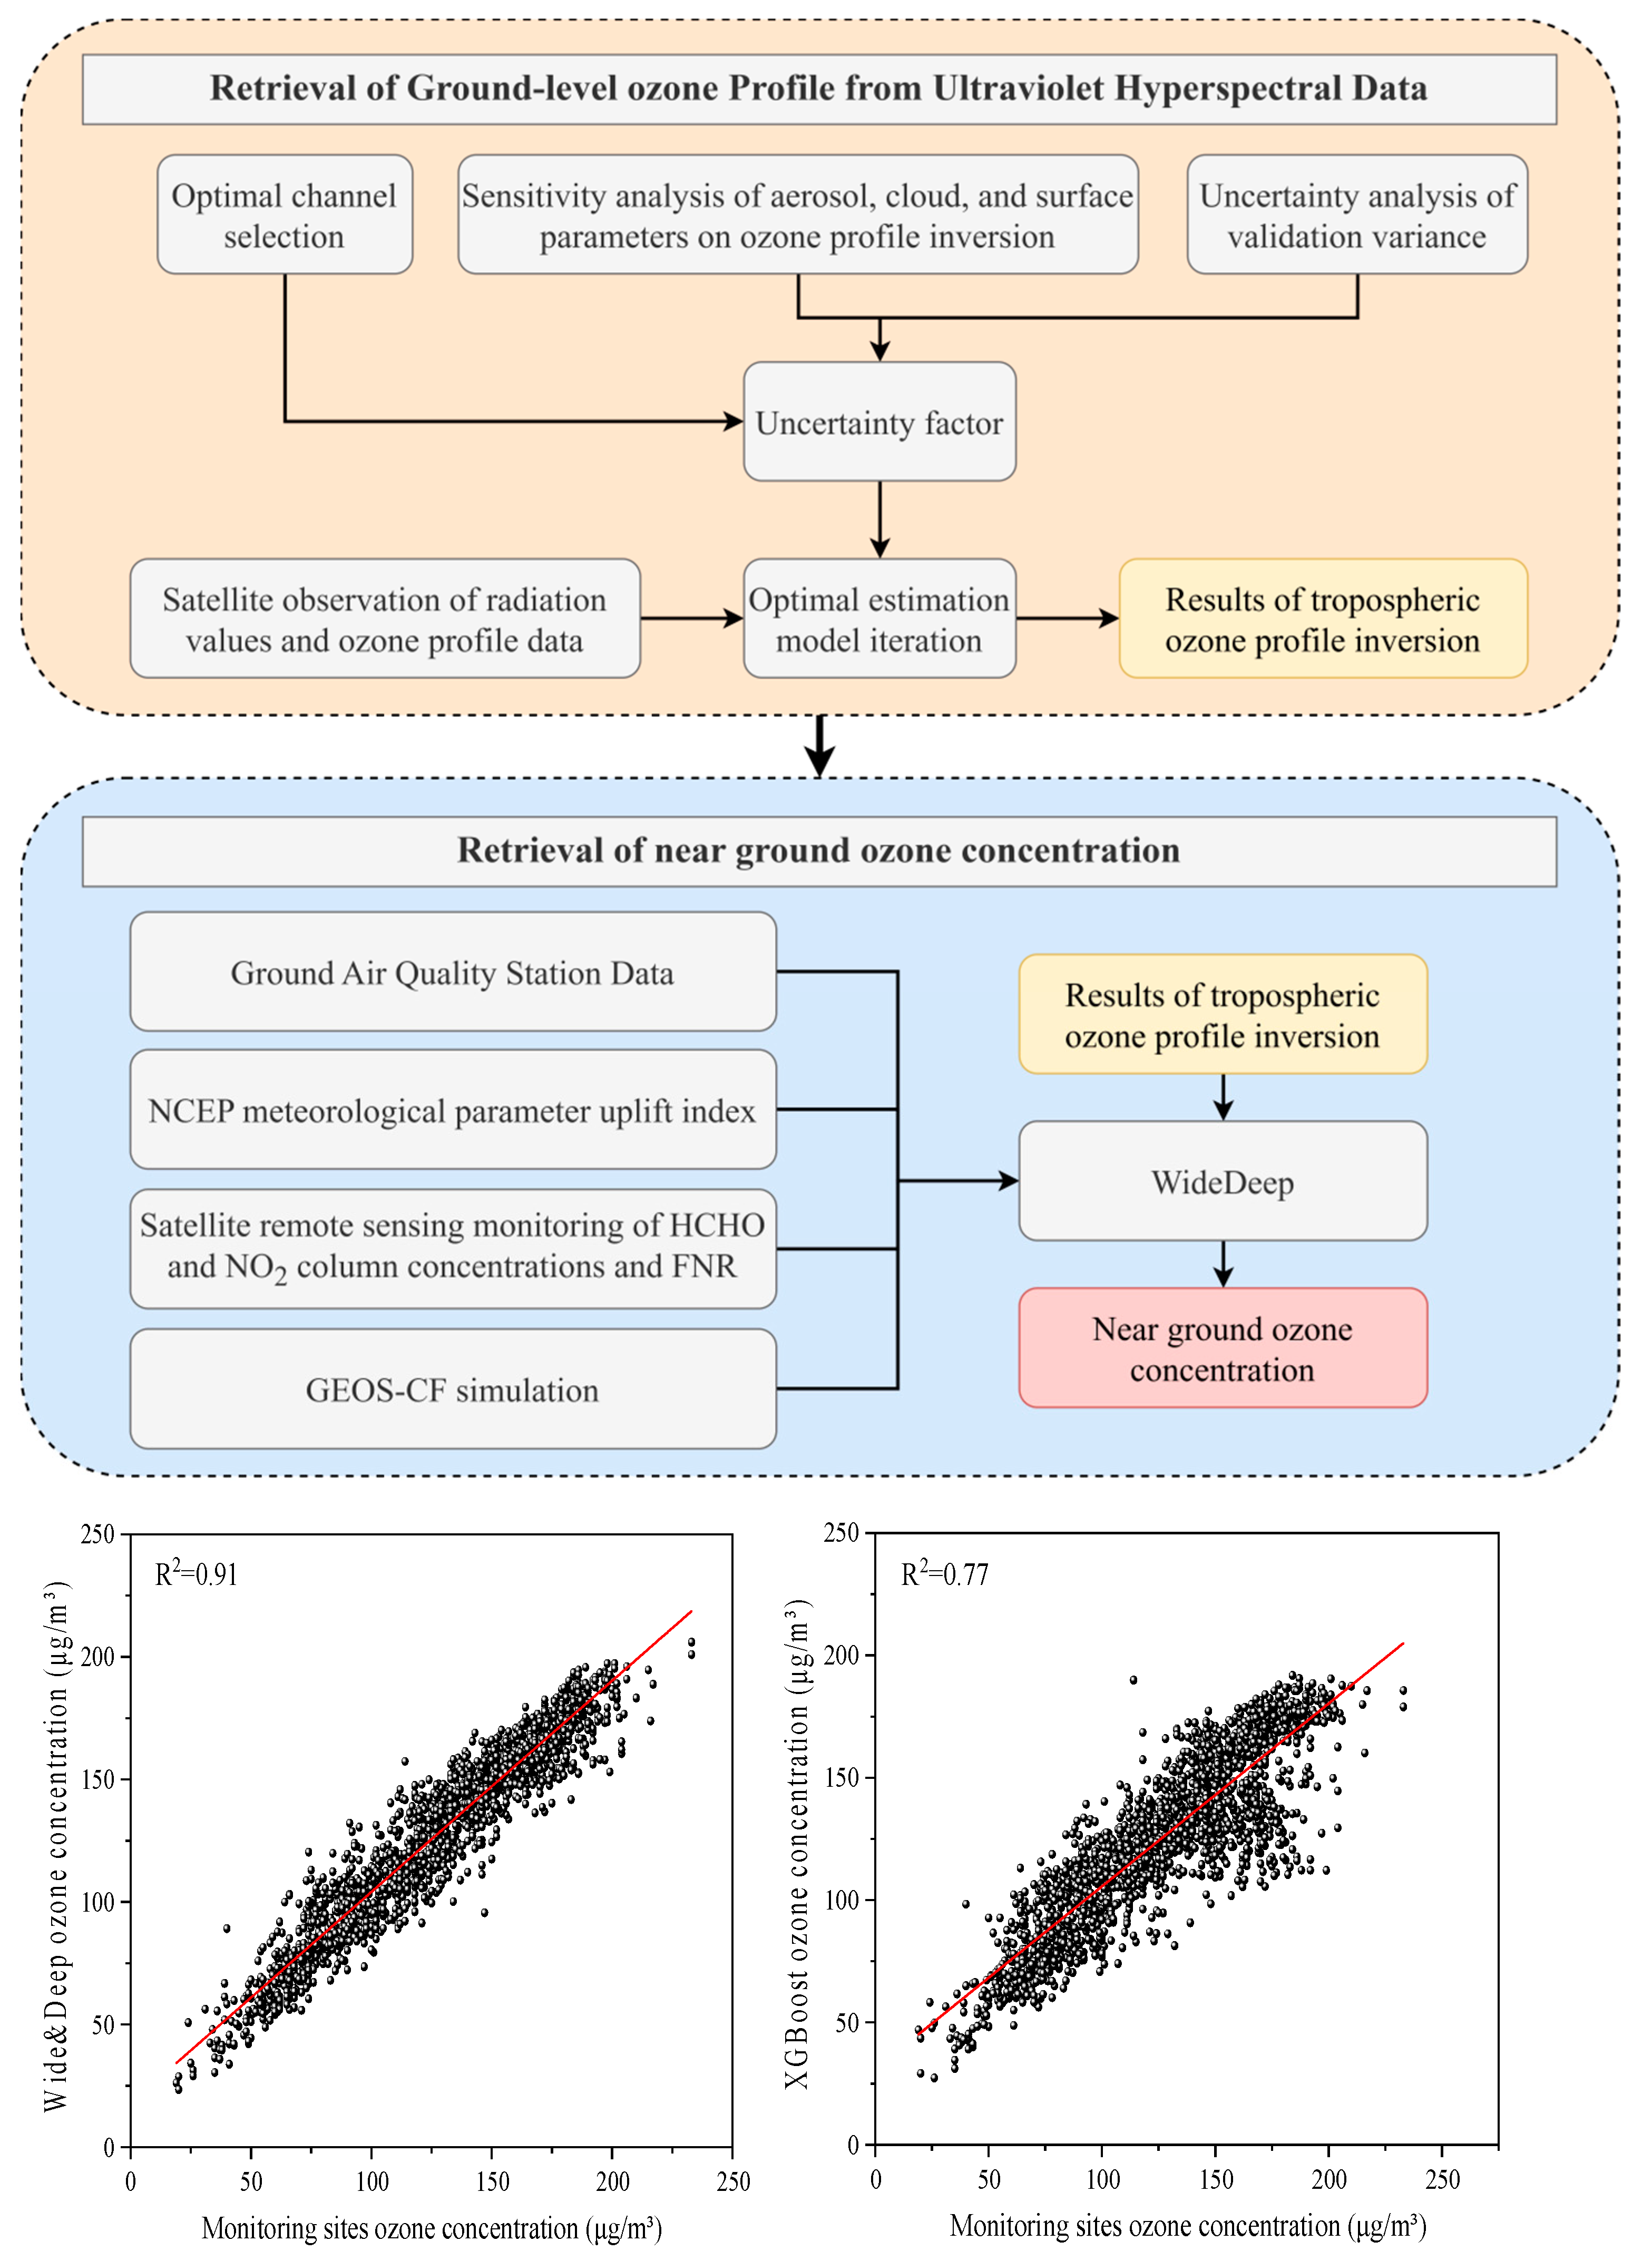
The inversion technique route, as illustrated in Figure 2, outlines the overall research approach as follows. Firstly, for ultraviolet hyperspectral data, an integrated application study of the LBLRTM and VLIDORT radiative transfer models is conducted. This involves a detailed simulation and analysis within the ultraviolet spectral range, focusing on factors such as aerosols, ring effects, cloud parameters, and ultraviolet polarized light. This study aimed to understand the sensitivity of ozone profile retrieval and error constraint methods to these uncertain factors. It also examines the uncertainty of the a priori covariance matrix, instability mechanisms, and constraint strategies of the inversion model. Within the framework of the optimal estimation method, simultaneous iterative inversion of tropospheric ozone profiles is performed. Secondly, in conjunction with tropospheric ozone profiles, a Wide&Deep combination model is utilized to analyze multiple parameters affecting near-surface ozone concentrations. This includes the development of an inversion model to obtain high-precision surface ozone concentrations.
Figure 2 displays a scatter plot where each point represents a set of ozone concentration data. The vertical axis represents the ozone concentration obtained through inversion, while the horizontal axis represents the ozone concentration observed at the observatory site. The results were obtained using machine learning and deep learning methods, yielding an R2 value of 0.91. In comparison, the R2 value obtained through the traditional method, XGBoost, was 0.77.

2.1.3. CLCD Land Cover Product

To compare the differences in ozone formation regimes between cities and rural areas in the BTH region, it was necessary to divide the research area into urban agglomeration, urban expansion, and non-urban areas based on land cover type products. The current problem is that the resolution of most land cover type products is too low, which has a significant impact on the accuracy of dividing the research area. The China Land Cover Dataset (CLCD) was created by Yang et al. on the Google Earth Engine (GEE) platform, which is the first annual land cover dataset (CLCD) derived from land satellites. A 30 m resolution land cover map of China was established [29]. Figure 3, combined with a comparison of MODIS (IGBP) products and satellite images, shows that the CLCD has high-resolution and accurate land cover edges and landscape details. As a 30 m land cover map, CLCD provides accuracy and raw data support for the division of the study area, in order to achieve higher accuracy in the division of the area.

2.2. Methods

2.2.1. Comparison of the Ozone Formation Regime between Urban and Non-Urban Areas

To compare the differences in the ozone formation regimes between cities and rural areas in the BTH region, the first and most crucial step was to extract pixels from urban buildings and roads and create a 10 km × 10 km grid (totaling 2138) to calculate the proportion of urban and road pixels in the grid area. Areas with an area ratio of more than 50% were classified as “urban aggregation areas”, whereas those with an area ratio of more than 10%, but less than 50% were classified as “urban expansion areas”. Areas with an area ratio of less than 10% were classified as “non-urban areas”. Finally, the segmentation results were randomly sampled using remote sensing images with a confidence level of 96% and confidence interval of 10%.

2.2.2. The Third-Order Polynomial Fitting Model

Pusede and Cohen proposed that the ozone exceedance probability [30] could be used as an effective indicator to study the sensitivity between ozone and its precursors. The specific definition of this indicator is defined as follows: within a certain HCHO/NO2 range, the ratio of the number of days for which ozone exceedance probability to the total number of days. The formula is as follows:
O E P = E v e n t n o n a t t a i n m e n t E v e n t s a t t a i n m e n t + E v e n t s n o n a t t a i n m e n t
where Eventsattainment and Eventsnon-attainment represent the number of days up to standard and non-standard, respectively [30,31].
In this study, a third-order polynomial fitting model was used to fit the nonlinear relationship between HCHO/NO2 and ozone concentrations exceeding the standard rate. Existing studies show that the cubic polynomial fitting model has the highest fitting accuracy and the lowest uncertainty compared to the moving average model and the quadratic polynomial fitting model, and the correlation coefficient (R) of the fitting result is higher than that of the quadratic polynomial fitting model [30]. According to statistics, 391,254 pairs of near-surface ozone concentration and HCHO/NO2 observation data were used in this study. The vertex of the polynomial fitting curve was considered as the turning point of the transition from VOCs to NOx control. The HCHO/NO2 range corresponding to the first 10% of the ozone exceedance probability was regarded as the VOCs NOx collaborative control [31].

3. Results

3.1. Time Trends of Ozone Precursors and FNR

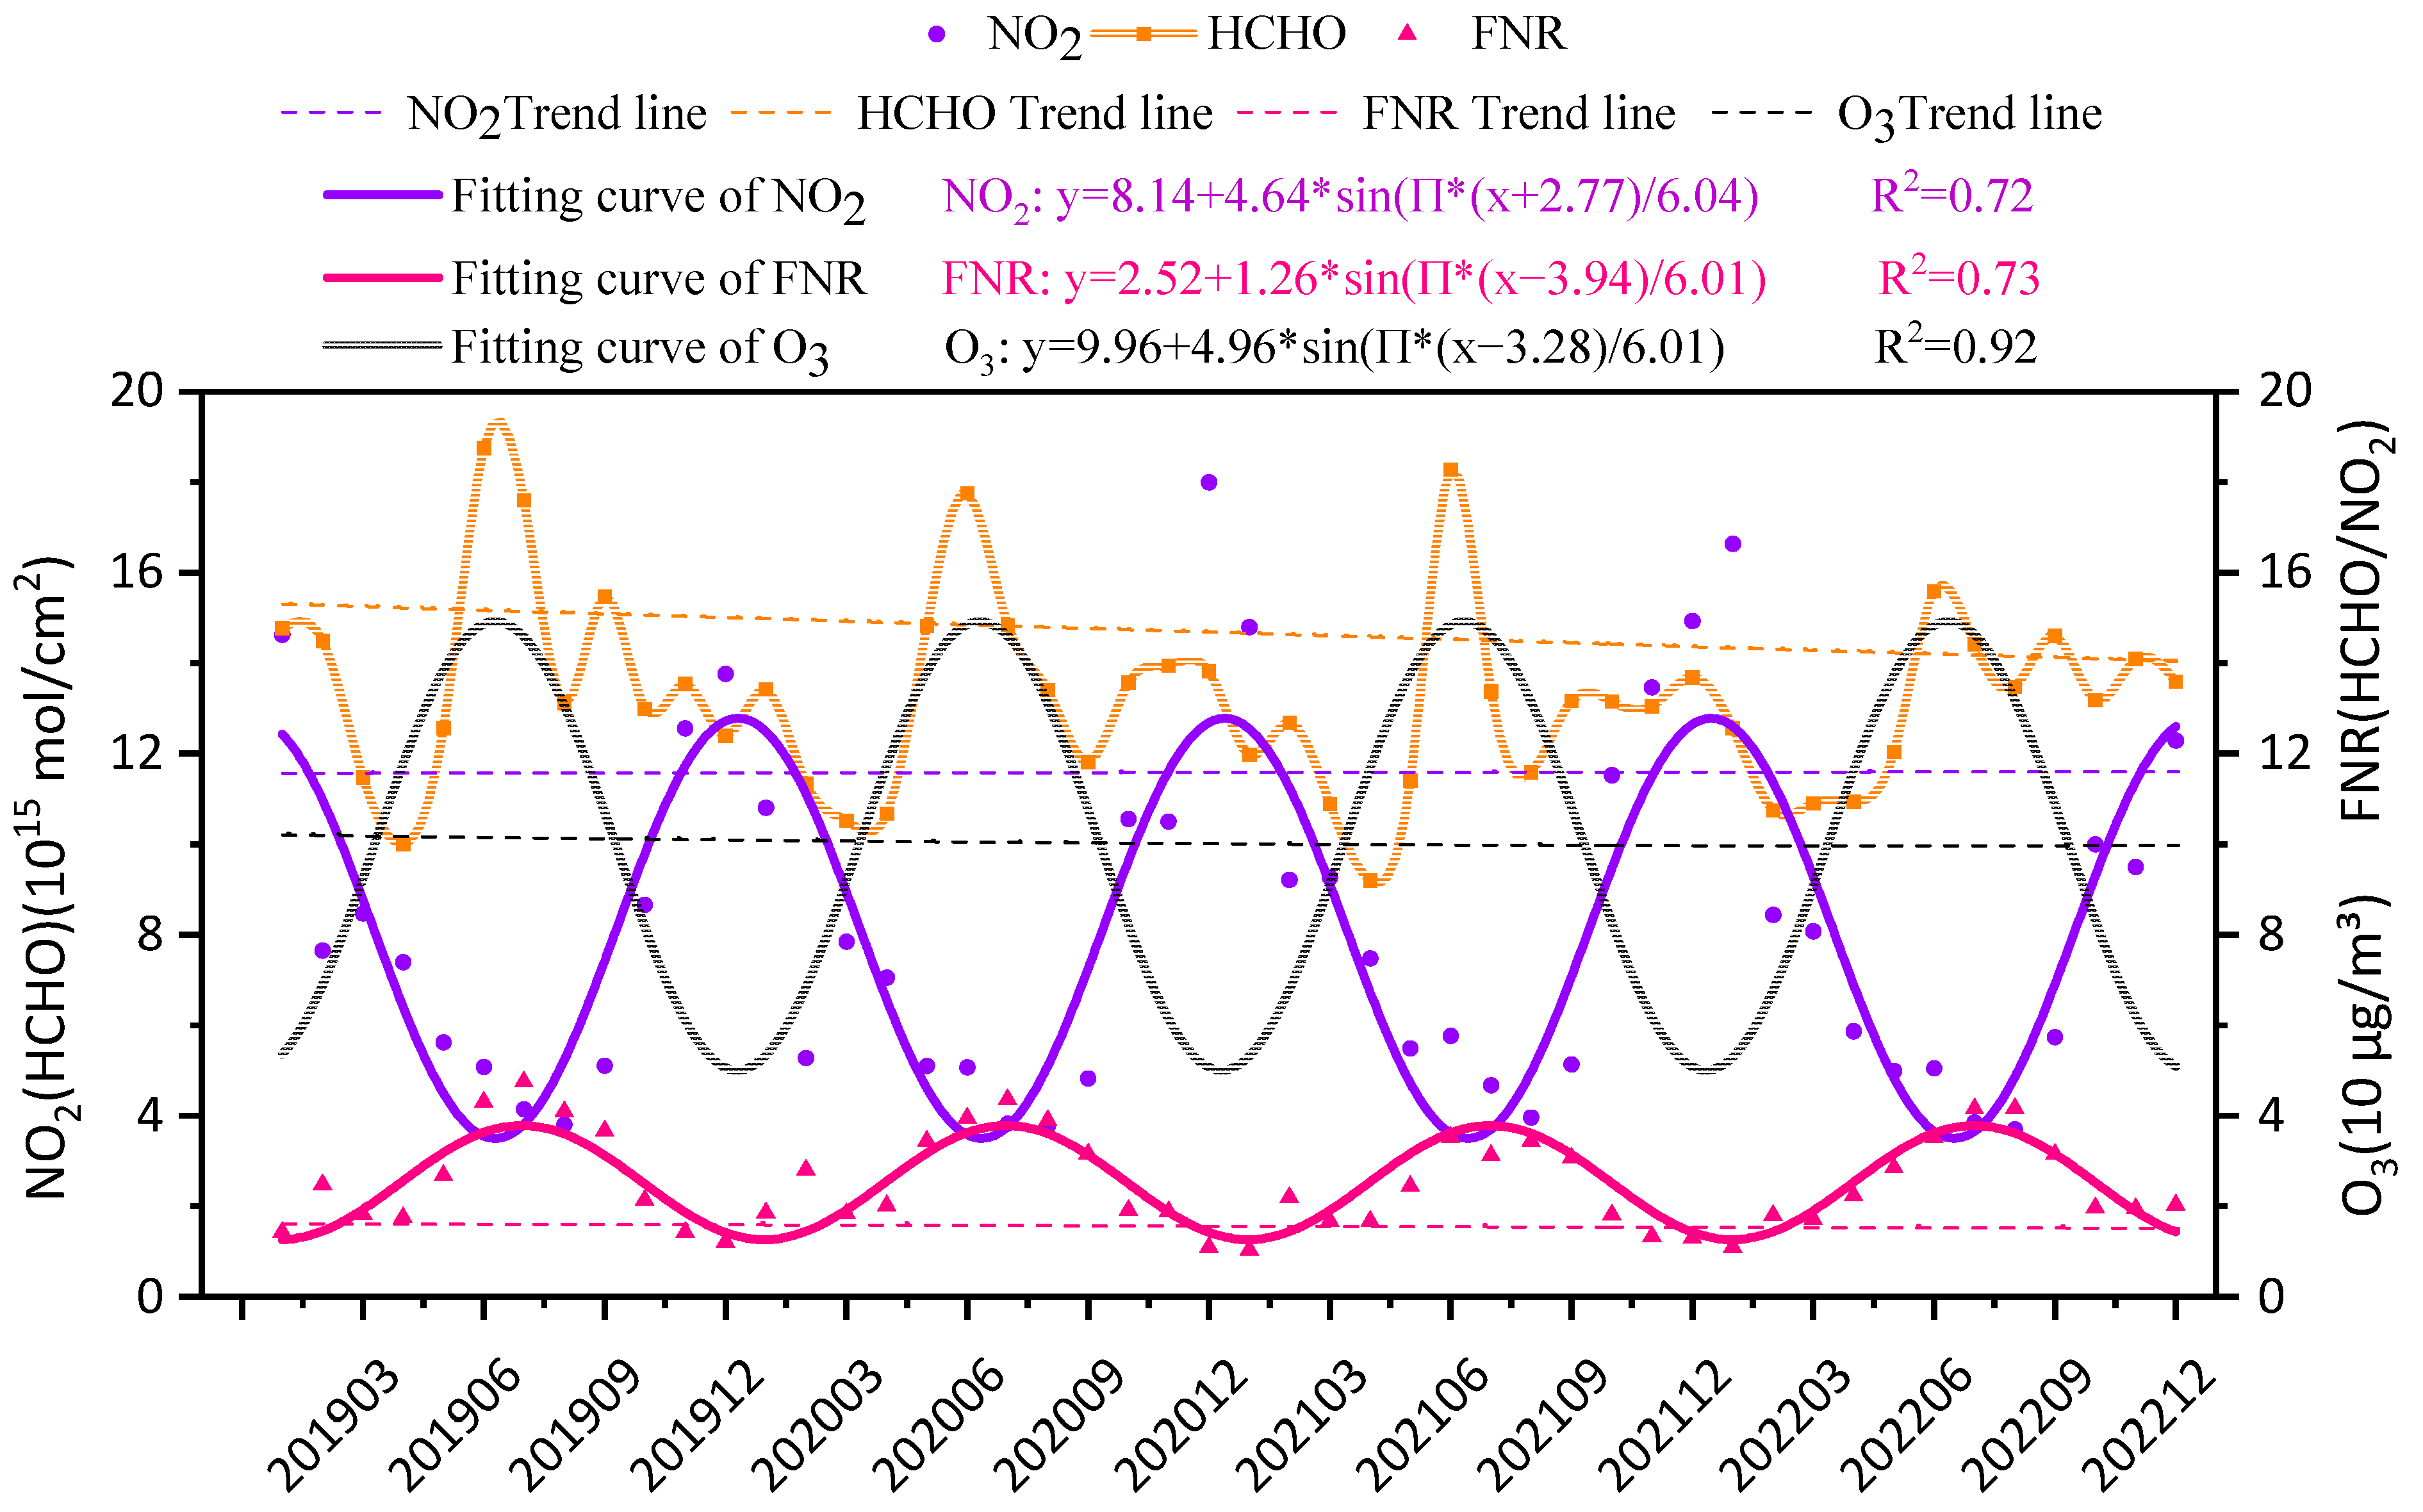
Figure 4 shows the tropospheric NO2 column concentration, HCHO column concentration, and FNR in the BTH region from 2019 to 2022. According to the fitting results of the time variation trend of the monthly average concentration, the peak value of NO2 was in winter (December 2020, concentration of 18.00 × 10¹⁵ mol/cm2), and the concentration was the lowest in summer (August 2022 concentration of 3.70 × 10¹⁵ mol/cm2). The trend in HCHO change was opposite to that of NO2, with higher concentrations in summer and lower concentrations in winter. The peak concentration occurred in June 2019, with a concentration of 18.76 × 10¹⁵ mol/cm2, and reached its lowest concentration in April 2021 at 9.20 × 10¹⁵ mol/cm2. The trend in the FNR variation was similar to that of HCHO, reaching its peak in summer and its lowest point in winter. The maximum value occurred in July 2019 and the minimum value occurred in January 2021, with values of 4.75 and 1.04, respectively. Ozone trends show a clear cyclical pattern, with high summers and low winters, and a small overall change in concentrations from 2019 to 2022.The periodicity of NO2, O3, and FNR was more significant with R2 values of 0.72, 0.73, and 0.92, respectively.

3.2. Interannual Variations in HCHO and NO2 Column Concentrations under Different Ground Features

Figure 5 shows the interannual changes in the tropospheric NO2 column concentration, HCHO column concentration, and FNR in the BTH region and their trends in various land use types. During this period, the concentration of the tropospheric NO2 column had no obvious interannual variation trend. The concentration reached a maximum of 10.19 × 10¹⁵ mol/cm2 in 2021 and a minimum of 8.81 × 10¹⁵ mol/cm2 in 2020. HCHO showed an interannual trend of first decreasing and then increasing. The highest concentration appeared in 2019, which was 14.48 × 10¹⁵ mol/cm2, and the lowest concentration was in 2021, which was 13.10 × 10¹⁵ mol/cm2. The FNR exhibited the opposite trend to the NO2 column concentration, reaching a peak of 2.40 in 2020 and a minimum of 1.97 in 2021. It is possible that changes in the containment policy of the pandemic may have affected emissions from factories and traffic sources while alterations in meteorological factors can affect the transport of pollutants, leading to fluctuating trends in HCHO and NO2 concentrations between 2019 and 2022. However, compared with 2019, ozone precursors and FNR showed different degrees of decline in 2022, with NO2 concentration decreasing by approximately 2.8%, HCHO concentration decreasing by approximately 6.6%, and FNR decreasing by approximately 3.4%.
Under different land use types, the NO2 and HCHO column concentrations in 2019–2022 showed the characteristics of urban agglomerations > urban extensions > non-urban areas., and FNR is the opposite trend urban agglomeration < urban expansion < non-urban areas, which can be seen that anthropogenic emissions account for a high proportion of emissions in the BTH region. NO2 in urban agglomerations decreased by 0.98 × 10¹⁵ mol/cm2, from 11.86 × 10¹⁵ mol/cm2 in 2019 to 10.88 × 10¹⁵ mol/cm2 in 2022; in the urban expansion area, it decreased from 9.91 × 10¹⁵ mol/cm2 to 9.60 × 10¹⁵ mol/cm2, a decrease of 0.31 × 10¹⁵ mol/cm2; in non-urban areas, it decreased from 6.40 × 10¹⁵ mol/cm2 to 6.22 × 10¹⁵ mol/cm2, a decrease of 0.18 × 10¹⁵ mol/cm2. HCHO decreased by 1.34 × 10¹⁵ mol/cm2 from 15.70 × 10¹⁵ mol/cm2 in 2019 to 14.36 × 10¹⁵ mol/cm2 in 2022 in urban agglomeration areas, by 1.24 × 10¹⁵ mol/cm2 from 14.88 × 10¹⁵ mol/cm2 to 13.64 × 10¹⁵ mol/cm2 in urban expansion areas, and by 0.55 × 10¹⁵ mol/cm2 from 12.84 × 10¹⁵ mol/cm2 to 12.29 × 10¹⁵ mol/cm2 in non-urban areas; from 2019 to 2022, FNR did not change in urban agglomeration areas, but decreased from 2.04 to 1.89 in urban expansion areas and from 3.36 to 3.31 in non-urban areas. The NO2 and HCHO column concentrations showed the most significant downward trend in urban agglomeration areas and the smallest decline in non-urban areas, indicating that emission reduction policies in cities have played a significant role.

3.3. Estimation of Transition Range of Ozone Formation Regime in the BTH Region

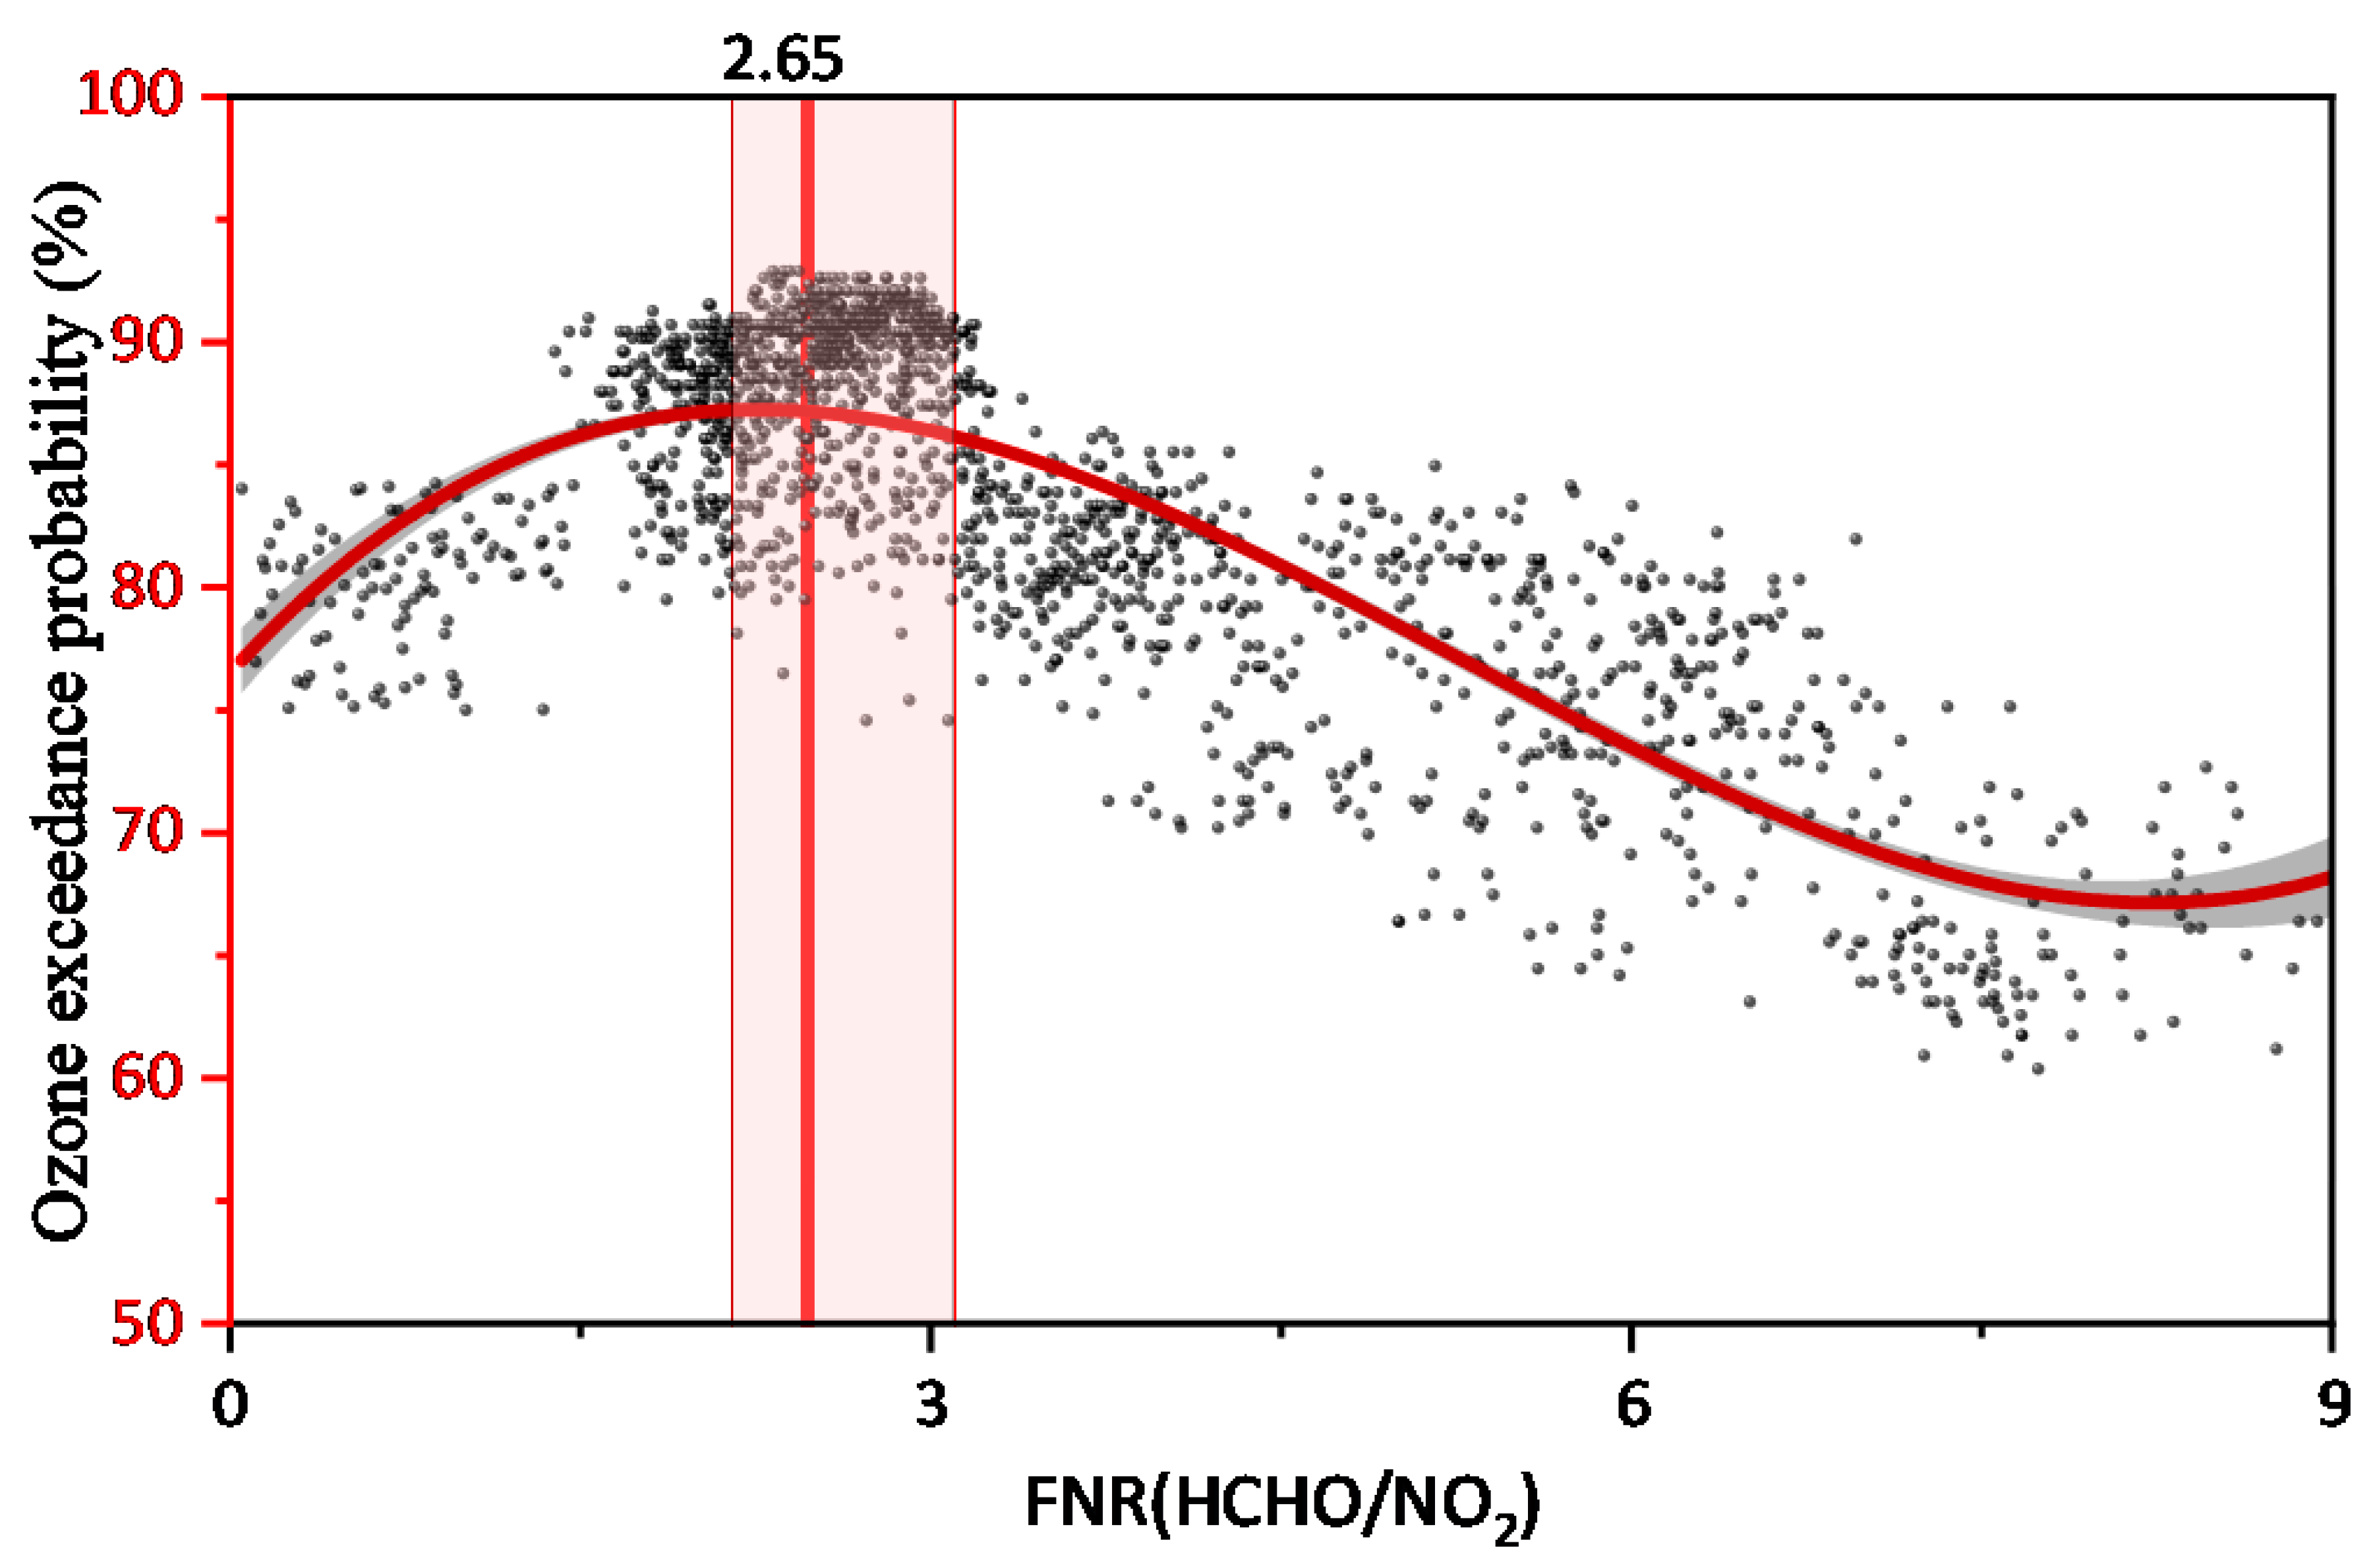
Owing to the complex nonlinear relationship between near-surface ozone concentration and its precursor concentration, effective control of ozone concentration remains a challenge in the reduction in air pollutant emissions. To determine the key threshold of the overall ozone formation regime in the BTH region, this study divided the FNR (HCHO/NO2) into 2138 equal parts, combined with the near-surface ozone, and calculated the ozone exceedance probability in each equal part in the ozone season (April-September). Firstly, a cubic polynomial model was used for nonlinear fitting of the ozone excess rate and HCHO/NO2. The fitting results for the BTH region are shown in Figure 6. The peak value of the curve is 2.65, and the shadows on both sides are collaborative control areas with a range of (2.0, 3.1). Classified based on FNR values within 2138 grids, values below 50% are less than 3.1.
Compared to previous studies, Chen et al. [32] used FNR (OMI HCHO/NO2) and ground monitoring ΔO3/ΔNO2, and found that the statistical relationship between NO2 and O3(the ratio of ozone change rate and NO2 change rate between consecutive months) shows that the collaborative control range of the BTH region from 2014 to 2016 is (0.65, 1.21), Li et al. [33] used the CCM model and polynomial fitting model to obtain (1.2, 2.1), and Ren et al. [34] used EKMA curve and the nonlinear relationship between ozone and FNR (OMI HCHO/NO2) to determine that the collaborative control range of BTH region is (2.2, 3.2), There are large differences in the range of transitional regimes in local space [35,36]. This situation may be affected by many factors, including the selection of the research period, dataset used, and spatial resolution of the dataset. In some local areas and megalopolises, serious pollution problems may lead to expansion of the transitional regime range [36]. In addition, the uncertainty in the satellite-observed HCHO and NO2 data should be considered, which may negatively affect the estimation results.

3.4. Spatial Distribution of O3 Formation Regimes

Based on the nonlinear relationship of O3-NOx-VOC, the change in ozone precursors is an important factor affecting ozone levels. Based on the long-time series TROPOMI satellite remote sensing data, this study explored the spatial variation characteristics of HCHO and NO2 column concentrations and surface ozone concentration and FNR in the high incidence season of ozone pollution (April–September) in the BTH region from 2019 to 2022, and calculated the spatial distribution map from April to September. It can be seen from Figure 7 that there are significant differences in NO2 column concentrations between cities in the BTH region and surrounding areas. The high values of NO2 column concentrations were mainly concentrated in the central regions of BJ, TJ, TS, and the western regions of SJZ, XT, and HD. This area has a large population, developed industry and transportation, and a large number of motor vehicles, especially in large cities such as BJ and TJ [37,38]. Automobile fuel combustion produces nitrogen oxides (NOx), of which nitrogen dioxide (NO2) is an important component. The pollution of NO2 is not only related to human activities but also has the effect of urban agglomeration, and cities will affect each other [39,40].
The spatial variation in the HCHO column concentration in the BTH region was not as significant as that of the NO2, and the difference in the concentration gradient was minor. High concentrations in the HCHO column were mainly concentrated in the central and southern areas of the BTH region. The concentrations in CD and ZJK in the north were relatively low. Formaldehyde is mainly formed by the oxidation of volatile organic compounds (VOCs), and its concentration in the atmosphere is affected by VOC emission sources and Primary emissions [41]. In contrast, NO2 is mainly related to vehicle exhaust and industrial emissions, and their concentration distribution may be more affected by these sources. The source distribution of formaldehyde may have been more dispersed, leading to a difference in its spatial variation.
The spatial distribution characteristics of the ozone generation sensitivity in the BTH region were shown in Figure 7. CD, ZJK, northern and western BJ, Western BD, and Western SJZ were mainly NOx limited. Central BJ, TJ, TS, and HD were mainly VOC limited. LF, HS, CZ, HD, XT, Eastern SJZ, and Eastern BD were under transitional regime control. Except for 2021, the VOC-limited regimes showed an overall downward trend, and the transitional and NOx-limited regimes gradually expanded in the BTH region [33].
The ozone concentration in the BTH region is high in the southeast and low in the northwest. As indicated in Figure 3, southeastern BTH is a region where urbanization and industrialization are relatively concentrated. A large volume of VOCs and NOx emissions in these regions may contribute to the formation of ozone. However, the northwestern region is usually more rural, with less human activity and lower VOCs and NOx emissions, resulting in lower ozone concentrations. The wind direction and meteorological conditions also affected the distribution of ozone. The southeastern region is usually affected by a marine airmass, and wind from the ocean may lead to the transport and accumulation of ozone, thus increasing its concentration [42]. However, the western region of Beijing–Tianjin–Hebei has high vegetation coverage and relatively few human activities, which may not be conducive to the transmission and accumulation of ozone; therefore, its concentration is low.

3.5. Change in the Ozone Generation Sensitivity Regime in the BTH Region

Figure 8 shows the change in the ozone generation-sensitive areas of different land cover types in the BTH region during the period of high ozone incidence (April–September) from 2019 to 2022. From the overall change trend of the BTH region, the VOC-limited regimes decreased from 8% in 2019 to 3.7% in 2022, the collaborative control area increased from 30.5% to 42.6%, and the NOx-limited regimes decreased from 54.3% to 46.3%, indicating that the ozone formation regime in the BTH region was mainly transitional and NOx limited. The change in ozone sensitivity in the BTH area is the most significant in 2021 (Figure 5), showing that the proportion of VOC-limited regimes has increased, which is significantly higher than that in other years; the proportion in urban agglomeration areas has reached 71.5%, which is directly related to the increase in NO2 concentration and the decrease in HCHO concentration in the BTH region in 2021.
From 2019 to 2022, urban agglomeration, urban expansion, and non-urban areas showed an overall trend of decreasing VOC-limited regimes and increasing transitional regimes. The VOC-limited regimes decreased by 10.3%, 9.8%, and 3.8%, respectively, while the transitional regimes increased by 4.6%, 17.2%, and 12.7%, respectively. The urban agglomeration area increased by 5.7% in the NOx-limited regimes, and the urban expansion area and non-urban area decreased by 7.5%. These results indicate that VOC-limited regimes are mainly distributed in urban agglomeration areas, transitional regimes are mainly concentrated in urban expansion areas, and non-urban areas are mainly controlled by NOx. This is because there are huge differences in vehicle exhaust emissions, industrial production emissions, domestic emissions, and other aspects between urban and non-urban areas [43]; therefore, the NOx concentration in urban areas is significantly higher than that in non-urban areas, and HCHO/NO2 in the non-urban areas of the BTH region is higher than that in urban areas. NOx emissions reduction in non-urban areas reduces the concentration of ozone more effectively than that in urban areas.

4. Discussion

This study combined TROPOMI HCHO and NO2 satellite observation data with surface ozone concentrations and applied a polynomial fitting model to explore the nonlinear relationship between ozone and its precursors. The VOC-limited regimes decreased in the BTH region, whereas the NOx-limited and transitional regimes showed an expanding trend. The BTH region shows transitional and NOx-limited regimes. However, this study still has some limitations. First, there were some errors in the retrieval process of HCHO and NO2 satellite observation data, which may have impacted the accuracy of the research results [10]. In addition, although the TROPOMI satellite provides high-resolution pollutant data, there is still a lack of long-term series data, which limits in-depth study of long-term trends. Future research should focus on the accuracy and availability of data to improve the comprehensive understanding of air pollution in the BTH region, and propose pollutant emission reduction strategies better suited for this region. Secondly, only one polynomial fitting model was used to estimate the threshold of the ozone formation regime, which might reduce the accuracy and reliability of the research conclusion to a certain degree. Finally, we found a clear cyclical pattern of maximum ozone, HCHO concentrations, and FNR values during the summer months and maximum NO2 concentrations during the winter months, suggesting that ozone production sensitivity have different major controlling elements in different seasons. We will explore some of the links that exist between changes in more meteorological factors and concentrations of ozone and its precursors in future studies.

5. Conclusions

Based on TROPOMI HCHO and NO2 data and near-surface ozone data, this study explored the temporal and spatial variation characteristics of HCHO, NO2, FNR, and ozone concentrations under different ground features in the BTH region, and preliminarily studied the sensitivity threshold of ozone formation. The main conclusions are as follows.
(1) The column concentration of HCHO and NO2 in the BTH region fluctuated from 2019 to 2022 and it is influenced by a variety of factors. Anthropogenic activities such as industrial emissions, transportation emissions and indoor emissions are the main sources. COVID-19 led to the restriction of people’s productive life and environmental inspector activities, which may be one of the reasons for the fluctuation of concentrations. Secondly, the combination of atmospheric chemical reactions, where photochemical reactions of VOCs and NOx lead to the production of HCHO and NO2, as well as atmospheric diffusion and mixing, lead to variations in HCHO and NO2 concentrations in different regions and periods. This in turn may have an impact on the changes in ozone and FNR. However, compared with 2019, ozone precursors and FNR decreased by different degrees in 2022, with NO2 concentration decreasing by approximately 2.8%, HCHO concentration decreasing by approximately 6.6%, and FNR decreasing by approximately 3.4%. The concentration of NO2 is high in winter and low in summer. The change trends of HCHO and FNR were opposite to those of NO2, being high in summer and low in winter, indicating that different pollution control measures should be taken according to different time periods.
(2) The concentrations of HCHO and NO2 in the BTH region from 2019 to 2022 showed the following trend: urban agglomeration > urban expansion > non-urban areas. FNR showed the opposite trend: urban agglomeration < urban expansion < non-urban areas. The difference in NOx concentrations between different ground types was the main explanation for this phenomenon. The FNR (HCHO/NO2) in non-urban areas was higher, and NOx emission reduction in this region would more effectively reduce the near-surface ozone concentration. In urban areas, there is a trend from VOC control type to VOCs NOx collaborative control type. Controlling the concentrations of VOCs and NOx simultaneously in this area will have a better effect on the mitigation of ozone pollution than reducing NOx alone.
(3) The spatial distributions of HCHO, NO2 column concentrations, and near-ground ozone concentrations in the BTH region showed a trend toward high concentrations in the southeast and low concentrations in the northwest. This is because the southeast region has concentrated areas of urbanization and industrialization, a large population, developed transportation, and a large number of motor vehicles.
(4) This study was based on the satellite inversion of near-ground ozone concentration data and ozone precursor concentration data. A cubic polynomial fitting model was used to localize the ozone generation threshold in the BTH region. Preliminary research results show that the range of transitional regimes is (2.0, 3.1), and the ozone formation regime in the BTH region mainly follows transitional and NOx-limited regimes. From the perspective of land cover types, VOC-limited regimes are mainly distributed in urban agglomeration areas, transitional regimes are mainly concentrated in urban expansion areas, and non-urban areas are mainly controlled by NOx.

Author Contributions

Conceptualization, H.S.; methodology, P.M.; software, W.H.; validation, W.Z.; formal analysis, H.S.; resources, P.M.; data curation, X.Y.; Visualization, L.C. All authors have read and agreed to the published version of the manuscript.

Funding

This research was supported by the National Natural Science Foundation of China (Grants 42071422, 42305198) and the Beijing Postdoctoral Research Foundation (Grants 2023-ZZ-149) and National Key Research and Development Program of China (Grants 2022YFC3700104).

Institutional Review Board Statement

Not applicable.

Informed Consent Statement

Not applicable.

Data Availability Statement

The ChinaHighO3 dataset is freely available at https://doi.org/10.5281/zenodo.4400042. The CLCD dataset introduced in this article is freely available at https://doi.org/10.5281/zenodo.4417810. Surface ozone data from this study 2021-2022 are available upon request from the corresponding author. The data cannot be made public because the associated paper is in preparation.The data are not publicly available as the relevant papers are in the process of being written. The TROPOMI dataset is freely available at https://s5phub.copernicus.eu/dhus/#/home, accessed on 26 October 2023.

Acknowledgments

We thank Wenxing Hou for contributing to the design of the data analysis framework.

Conflicts of Interest

The authors declare no conflict of interest.

References

  1. Lu, X.; Zhang, L.; Wang, X.L.; Gao, M.; Li, K.; Zhang, Y.Z.; Yue, X.; Zhang, Y.H. Rapid Increases in warmseason surface ozone and resulting health impact in China Since 2013. J. Environ. Sci. Technol. Lett. 2020, 7, 240–247. [Google Scholar] [CrossRef]
  2. Zhang, Q.; Zhao, Y.X.; Tong, D.; Shao, M.; Wang, S.X.; Zhang, Y.H.; Xu, X.D.; Wang, J.N.; He, H.; Liu, W.Q.; et al. Drivers of improved PM2.5 air quality in China from 2013 to 2017. Proc. Natl. Acad. Sci. USA 2019, 116, 24463–24469. [Google Scholar] [CrossRef] [PubMed]
  3. Chen, L.J. A Study on the Evolution of Ozone Pollution in China and Regional Management Methods; China University of Geosciences: Beijing, China, 2018. [Google Scholar]
  4. Aneja, V.P.; Li, Z. Characterization of ozone at high elevation in the eastern United States: Trends, seasonal variations, and exposure. J. Geophys. Res. 1992, 97, 9873–9888. [Google Scholar] [CrossRef]
  5. Linn, W.S.; Shamoo, D.A.; Anderson, K.R.; Peng, R.C.; Avol, E.L.; Hackney, J.D. Effects of prolonged, repeated exposure to ozone, sulfuric acid, and their combination in healthy and asthmatic volunteers. Am. J. Respir. Crit. Care Med. 1994, 150, 431–440. [Google Scholar] [CrossRef] [PubMed]
  6. Xie, Y.; Dai, H.; Zhang, Y.; Wu, Y.; Hanaoka, T.; Masui, T. Comparison of health and economic impacts of PM2.5 and ozone pollution in China. Environ. Int. 2019, 130, 104881. [Google Scholar] [CrossRef] [PubMed]
  7. Liu, H.; Liu, S.; Xue, B.; Lv, Z.; Meng, Z.; Yang, X.; Xue, T.; Yu, Q.; He, K. Ground-level ozone pollution and its health impacts in China. Atmos. Environ. 2018, 173, 223–230. [Google Scholar] [CrossRef]
  8. Wang, X.S.; Li, J.L.; Zhang, Y.H.; Xie, S.D.; Tang, X.Y. Ozone source attribution during a severe photochemical smog episode in Beijing, China. Sci. Sin. 2009, 39, 548–559. [Google Scholar] [CrossRef]
  9. Zhang, Y.H.; Su, H.; Zhong, L.J.; Cheng, Y.F.; Zeng, L.M.; Wang, X.S.; Xiang, Y.R.; Wang, J.L.; Gao, D.F.; Shao, M. Regional ozone pollution and observation-based approach for analyzing ozone-precursor relationship during the PRIDE-PRD2004 campaign. Atmos. Environ. 2008, 42, 6203–6218. [Google Scholar] [CrossRef]
  10. Huang, C.; Chen, C.H.; Li, L.; Cheng, Z.; Wang, H.L.; Huang, H.Y.; Streets, D.G.; Wang, Y.J.; Zhang, G.F.; Chen, Y.R. Emission inventory of anthropogenic air pollutants and VOC species in the Yangtze River Delta region, China. Atmos. Chem. Phys. 2011, 11, 4105–4120. [Google Scholar] [CrossRef]
  11. Duncan, B.N.; Yoshida, Y.; Olson, J.R.; Sillman, S.; Martin, R.V.; Lamsal, L.; Hu, Y.; Pickering, K.E.; Retscher, C.; Allen, D.J.; et al. Application of OMI observations to a space-based indicator of NOx and VOC controls on surface ozone formation. Atmos. Environ. 2010, 44, 2213–2223. [Google Scholar] [CrossRef]
  12. Chan, K.L.; Wang, Z.R.; Ding, A.J.; Heue, K.P.; Shen, Y.C.; Wang, J.; Zhang, F.; Shi, Y.N.; Hao, N.; Wenig, M. MAX-DOAS measurements of tropospheric NO2 and HCHO in Nanjing and a comparison to ozone monitoring instrument observations. Atmos. Chem. Phys. 2019, 19, 10051–10071. [Google Scholar] [CrossRef]
  13. Lu, K.D.; Zhang, Y.H.; Su, H.; Zhao, S.M.; Zeng, L.M.; Zhong, L.J.; Xiang, Y.R.; Chang, C.C.; Chou, C.K.; Andreas, W. Regional ozone pollution and key controlling factors of photochemical ozone production in Pearl River Delta during summer time. Sci. Sin. Chim. 2010, 40, 407–420. [Google Scholar] [CrossRef]
  14. Zhuang, L.Y.; Chen, Y.P.; Fan, L.Y.; Ye, D.Q. Study on the ozone formation sensitivity in the Pearl River Delta based on OMI satellite data and MODIS land cover type products. Acta Sci. Circum. 2019, 39, 3581–3592. [Google Scholar]
  15. Zhuang, L.Y. Ground Level Ozone Concentration Characteristics and Formation Sensitivity in China’s Three Agglomerations; South China University of Technology: Guangzhou, China, 2019. [Google Scholar]
  16. Wei, W.; Li, Y.; Ren, Y.; Cheng, S.; Han, L. Sensitivity of summer ozone to precursor emission change over Beijing during 2010–2015: A WRF-Chem modeling study. Atmos. Environ. 2019, 218, 116984. [Google Scholar] [CrossRef]
  17. Wang, P.; Chen, Y.; Hu, J.; Zhang, H.; Ying, Q. Attribution of tropospheric ozone to NOx and VOC emissions: Considering ozone formation in the transition regime. Environ. Sci. Technol. 2019, 53, 1404–1412. [Google Scholar] [CrossRef]
  18. Cheng, L.J.; Wang, S.A.; Gong, Z.Y.; Li, H.; Yang, Q. Spatial and seasonal variation and regionalization of ozone concentrations in China. China Environ. Sci. 2017, 37, 4003–4012. [Google Scholar]
  19. Available online: https://data.stats.gov.cn/easyquery.htm?cn=E0103&zb=A0202&reg=110000&sj=2022 (accessed on 15 August 2023).
  20. Hu, L.M.; Li, Y.X.; Shi, N.F. Spatiotemporal change characteristics of ozone concentration in Beijing-Tianjin-Hebei region. Environ. Sci. Technol. 2019, 42, 1–7. [Google Scholar]
  21. Yan, H.; Zhang, W.; Hou, M.; Li, Y.S.; Gao, P.; Xia, Q.; Meng, X.Y.; Fan, L.Y.; Ye, D.Q. Sources and control area division of ozone pollution in cities at prefacture level and above in China. Environ. Sci. 2020, 41, 5215–5224. [Google Scholar]
  22. Wang, M.; Zheng, Y.F.; Liu, Y.J.; Li, Q.P.; Ding, Y.H. Characteristics of ozone and its relationship with meteorological factors in Beijing-Tianjin-Hebei Region. China Environ. Sci. 2019, 39, 2689–2698. [Google Scholar]
  23. Yu, Y.J.; Meng, X.Y.; Wang, Z.; Zhou, W.; Yu, H.X. Driving factors of the significant increase in surface ozone in the Beijing-Tianjin-Hebei region, China, during 2013~2018. Environ. Sci 2020, 41, 106–114. [Google Scholar] [CrossRef]
  24. Yao, Q.; Ma, Z.Q.; Hao, T.Y.; Fan, W.Y.; Yang, X.; Tang, Y.X.; Cai, Z.Y.; Han, S.Q. Temporal and spatial distribution characteristics and background concentration estimation of ozone in Beijing-Tianjin-Hebei region. China Environ. Sci. 2021, 41, 4999–5008. [Google Scholar]
  25. Li, Y.; Shi, G.; Chen, Z. Spatial and temporal distribution characteristics of ground-level nitrogen dioxide and ozone across China during 2015–2020. Environ. Res. Lett. 2021, 16, 124031. [Google Scholar] [CrossRef]
  26. Zhu, L. Satellite Data to Freshman. Total Ozone Column Daily Product. 2022. Available online: http://www.satdatafresh.com (accessed on 18 August 2023).
  27. Available online: https://sentinel.esa.int/web/sentinel/missions/sentinel-5p (accessed on 18 August 2023).
  28. Available online: https://sentinel.esa.int/web/sentinel/user-guides/sentinel-5p-tropomi (accessed on 18 August 2023).
  29. Yang, J.; Huang, X. The 30 m annual land cover dataset and its dynamics in China from 1990 to 2019. Earth Syst. Sci. Data 2021, 13, 3907–3925. [Google Scholar] [CrossRef]
  30. Pusede, S.E.; Cohen, R.C. On the observed response of ozone to NOx and VOC reactivity reductions in San Joaquin valley California 1995-present. Atmos. Chem. Phys. 2012, 12, 8323–8339. [Google Scholar] [CrossRef]
  31. Jin, X.; Fiore, A.; Boersma, K.F.; Smedt, I.; Valin, L. Inferring changes in summertime surface ozone-NOx-VOC chemistry over U.S. urban areas from two decades of satellite and ground-based observations. Environ. Sci. Technol. 2020, 54, 6518–6529. [Google Scholar] [CrossRef]
  32. Chen, Y.P.; Yan, H.; Yao, Y.J.; Zeng, C.L.; Gao, P.; Zhuang, L.Y.; Fan, L.Y.; Ye, D.Q. Relationships of ozone formation sensitivity with precursors emissions, meteorology and land use types, in Guangdong-Hong Kong-Macao Greater Bay Area, China. J. Environ. Sci. 2020, 94, 1–13. [Google Scholar] [CrossRef]
  33. Li, R.; Xu, M.; Li, M.; Chen, Z.; Gao, B.; Zhao, N.; Yao, Q. Identifying the spatiotemporal variations of ozone formation regimes across China from 2005 to 2019 based on polynomial simulation and causality analysis. Atmos. Chem. Phys. Discuss. 2021, 21, 15631–15646. [Google Scholar] [CrossRef]
  34. Ren, J.; Guo, F.; Xie, S. Diagnosing ozone–NOx–VOC sensitivity and revealing causes of ozone increases in China based on 2013–2021 satellite retrievals. Atmos. Chem. Phys. 2022, 22, 15035–15047. [Google Scholar] [CrossRef]
  35. Schroeder, J.R.; Crawford, J.H.; Fried, A.; Walega, J.; Weinheimer, A.; Wisthaler, A.; Müller, M.; Mikoviny, T.; Chen, G.; Shook, M.; et al. New insights into the column CH2O/NO2 ratio as an indicator of near-surface ozone sensitivity. J. Geophys. Res. Atmos. 2017, 122, 8885–8907. [Google Scholar] [CrossRef]
  36. Jin, X.; Fiore, A.M.; Murray, L.T.; Valin, L.C.; Lamsal, L.N.; Duncan, B.; Boersma, K.F.; De Smedt, I.; Abad, G.G.; Chance, K.; et al. Evaluating a space-based indicator of surface ozone-NOxVOC sensitivity over midlatitude source regions and application to decadal trends. J. Geophys. Res. Atmos. 2017, 122, 10–461. [Google Scholar] [CrossRef]
  37. Wei, J.; Li, Z.; Li, K.; Dickerson, R.R.; Pinker, R.T.; Wang, J.; Liu, X.; Sun, L.; Xue, W.; Cribb, M. Full-coverage mapping and spatiotemporal variations of ground-level ozone (O3) pollution from 2013 to 2020 across China. Remote Sens. Environ. 2022, 270, 112775. [Google Scholar] [CrossRef]
  38. Zheng, X.X.; Li, L.J.; Zhao, W.J.; Zhao, W.H. Spatial and temporal characteristics of atmospheric NO2 in the Beijing Tianjin-Hebei region. Ecol. Environ. Sci. 2014, 23, 1938–1945. [Google Scholar]
  39. Crutzen, P.J. The role of NO and NO2 in the chemistry of the troposphere and stratosphere. Annu. Rev. Earth Planet. Sci. 1979, 7, 443–472. [Google Scholar] [CrossRef]
  40. Liu, X.T.; Zheng, T.F.; Wan, Q.L.; Tan, H.B.; Deng, X.J.; Fei, L.I.; Deng, T. Spatiotemporal characteristics of NO2 in concentrated PRD urban districts and analysis of anthropogenic influences based on OMI remote sensing data. J. Trop. Meteorol. 2015, 31, 193–201. [Google Scholar]
  41. Zhu, S.; Li, X.; Yu, C.; Wang, H.; Wang, Y.; Miao, J. Spatiotemporal variations in satellite based formaldehyde (HCHO) in the Beijing-Tianjin-Hebei region in China from 2005 to 2015. Atmosphere 2018, 9, 5. [Google Scholar] [CrossRef]
  42. Bei, N.F.; Zhao, L.N.; Wu, J.R.; Li, X.; Feng, T.; Li, G.H. Impacts of sea-land and mountain-valley circulations on the air pollution in Beijing-Tianjin-Hebei (BTH): A case study. J. Environ. Pollut. 2018, 234, 429–438. [Google Scholar] [CrossRef]
  43. Cheng, N.; Li, R.; Xu, C.; Chen, Z.; Chen, D.; Meng, F.; Cheng, B.; Ma, Z.; Zhuang, Y.; He, B.; et al. Ground ozone variations at an urban and a rural station in Beijing from 2006 to 2017: Trend, meteorological influences and formation regimes. J. Clean Prod. 2019, 235, 11–20. [Google Scholar] [CrossRef]
Figure 1. Location of the study area with topographical information.
Atmosphere 14 01637 g001
Figure 2. Surface ozone inversion process and accuracy validation.
Atmosphere 14 01637 g002
Figure 3. Comparison of land cover datasets and classification results, MODIS land cover types and high-resolution remote sensing images in China.
Atmosphere 14 01637 g003
Figure 4. The temporal variation trend of NO2 column concentration, HCHO column concentration, Surface ozone concentration, and FNR time variation trend in the BTH region from 2019 to 2022. (The purple, yellow and pink dots in the graph represent the monthly average values of NO2, HCHO and FNR, respectively, HCHO fits the curve poorly, so the data trend is reacted by using a dot line graph.)
Atmosphere 14 01637 g004
Figure 5. The interannual variation trend of various land use types of NO2 column concentration, HCHO column concentration, and FNR in the BTH region from 2019 to 2022.
Atmosphere 14 01637 g005
Figure 6. Fitting ozone exceedance probability to HCHO/NO2 through the third-order polynomial model. (The red curve represents the fit of a third-order polynomial. The vertical line represents the maximum value of the curve and the red shaded area represents the top 10% of the ozone exceedance probability.)
Atmosphere 14 01637 g006
Figure 7. Spatial distribution map of NO2, HCHO, FNR, and O3 mean values in the BTH region from April to September 2019–2022.
Atmosphere 14 01637 g007
Figure 8. Changes in sensitive types of ozone generation under different land cover types in the BTH region from 2019 to 2022.
Atmosphere 14 01637 g008
Disclaimer/Publisher’s Note: The statements, opinions and data contained in all publications are solely those of the individual author(s) and contributor(s) and not of MDPI and/or the editor(s). MDPI and/or the editor(s) disclaim responsibility for any injury to people or property resulting from any ideas, methods, instructions or products referred to in the content.