Article

Seasonal and Day–Night Variations in Carbonaceous Aerosols and Their Light-Absorbing Properties in Guangzhou, China

1
State Key Laboratory of Organic Geochemistry, Guangzhou Institute of Geochemistry, Chinese Academy of Sciences, Guangzhou 510640, China
2
College of Resources and Environment, University of Chinese Academy of Sciences, Beijing 100049, China
3
Xinjiang Key Laboratory of Coal Clean Conversion & Chemical Engineering, College of Chemical Engineering, Xinjiang University, Urumqi 830017, China
*
Author to whom correspondence should be addressed.
Atmosphere 2023, 14(10), 1545; https://doi.org/10.3390/atmos14101545
Submission received: 3 September 2023 / Revised: 30 September 2023 / Accepted: 6 October 2023 / Published: 10 October 2023
(This article belongs to the Section Aerosols)

Abstract

:
Carbonaceous aerosols (CAs), including elemental carbon (EC) and organic carbon (OC), have become the dominant component in PM2.5 in many Chinese cities, and it is imperative to address their spatiotemporal variations and sources in order to continually improve air quality. In this study, the mass concentrations and light absorption properties of EC and OC in PM2.5 were investigated at diverse sites in Guangzhou, in the winter of 2020 and the autumn of 2021, using the DRI Model 2015 thermal–optical carbon analyzer. The results showed that total EC and organic matter (OM = OC × 1.8) could account for nearly 30% of the PM2.5 mass concentrations. Secondary production was the most important source for OC, with secondary OC (SOC) percentages in the OC as high as 72.8 ± 7.0% in autumn and 68.4 ± 13.1% in winter. Compared to those in 2015, OC and EC concentrations were reduced by 25.4% and 73.4% in 2021, highlighting the effectiveness of control measures in recent years. The absorption coefficient of brown carbon at 405 nm (babs,BrC,405) decreased by over 40%, and the mass absorption coefficient (MAC) at 405 nm of total carbon (TC) decreased by over 30%. EC and OC concentrations and the light absorption of black carbon (babs,BC,405) showed no significant diurnal differences in both autumn and winter mainly because the reduction in anthropogenic emissions at night was compensated by the lowering of the boundary layer. Differentially, babs,BrC,405 was significantly lower during daytime than at night in autumn, probably due to the daytime photobleaching effect. The sources of EC, OC, BC, and BrC were preliminarily diagnosed by their correlation with typical source markers. In autumn, babs,BrC,405 might be related to biomass burning and coal combustion, while babs,BC,405 were largely related to vehicle emissions and coal combustion. In winter, babs,BrC,405 was closely related to coal combustion.

1. Introduction

Air pollution increases morbidity and mortality in humans. Fine particulate matter (PM2.5) was among the top global risk factors for death burden in 2015, causing 4.2 million deaths, up from 3.5 million in 1990 [1]. Carbonaceous aerosols (CAs), including elemental carbon (EC) and organic carbon (OC), are important components of PM2.5, accounting for 20–70% of PM2.5 mass concentrations, and have significant impacts on human health and global climate change [2,3,4,5,6,7,8]. EC, with a large specific surface area, is easy to adsorb harmful substances (such as transition metals), and exposure to it brings about various respiratory and cardiovascular diseases [9,10]. Some chemical components in OC, such as polycyclic aromatic hydrocarbons (PAHs) and dioxins, are well-known carcinogens that pose high health risks [11,12,13,14]. Meanwhile, if optically measured, CAs can be divided into black carbon (BC) and brown carbon (BrC). BC is an EC-containing component that is strongly light-absorbing throughout the solar spectrum and is a major absorption aerosol that warms the atmosphere and presents a positive radiative forcing [15]. BrC is a part of OC that can also absorb light effectively in the near-UV–Vis region (300–500 nm) [16]. BrC is complex in molecular composition, with PAHs and nitrogen-containing organic compounds (such as nitrogen heterocycles and nitroaromatic hydrocarbons) as important components [17,18]. The light absorption capacity of BrC can be comparable to that of BC in the UV band. It is estimated that the global radiative forcing of BrC ranges from 0.1 to 0.25 W m−2, which is approximately 1/4 of that of black carbon [19] and even exceeds 0.25 W m−2 in regions with high-intensity biomass burning activities, such as East Asia, South Asia, South America, and Africa [19]. The light absorption properties of BC and BrC, including light absorption coefficient (babs), mass absorption coefficient (MAC), and Ångström absorption exponent (AAE) [16], are key elements in assessing the radiative effects of CAs [20]. Nevertheless, the lack of knowledge of the spatial and temporal variations in BC/BrC and their light-absorbing properties limits the accuracy of climate model predictions [21].
Many studies have revealed significant spatial and temporal variations in the distribution of OC and EC concentrations [7], especially in megacities, such as the Beijing–Tianjin–Hebei region [22], the Yangtze River Delta region [23], and the Pearl River Delta region [24] in China. However, most studies involve seasonal or monthly changes in OC and EC [25,26,27], and fewer studies focus on diurnal changes, especially in light absorption properties. Since emissions and environmental conditions differ between daytime and nighttime, mass concentrations and optical properties of OC and EC would change accordingly. For example, one study showed that the MAC of water-insoluble OC at 365 nm was twice as high during the day as at night [28].
EC or BC is mainly derived from the incomplete combustion of fossil fuel and biomass [29,30]. Studies have noted that fossil fuel combustion was the main source of BC in urban areas, while biomass burning could substantially contribute to BC in rural areas [31]. OC includes the directly emitted primary organic carbon (POC) and secondary organic carbon (SOC), which is secondarily formed through the oxidation of volatile organic compounds (VOCs). POC is mainly derived from fossil fuel or biomass combustion and biological emissions (e.g., plant debris) [32], while precursors of SOC include biogenic and anthropogenic VOCs [33,34]. Many studies have revealed biomass burning as a major source of BrC [35,36]. It is worth noting that sources of CA may change significantly with the implementation of control measures. For example, Zhang et al. (2015) reported that biomass burning was the main source of OC in Guangzhou [37], while coal combustion and traffic emissions became the main sources of OC in 2020 [38]. Therefore, the timely reanalysis of the sources of CA and their compositional and light-absorbing properties is also necessary.
In the past decade, China has made great efforts to combat PM2.5 air pollution. PM2.5 concentrations have dropped drastically in many cities, such as Guangzhou, where annual mean PM2.5 concentrations have decreased to below 25 μg/m3 after 2019 [39]. However, in consideration of the newly established WHO air quality guidelines (annual mean PM2.5 concentration < 5 μg/m3) [40], even in Guangzhou, there is a need to continually improve air quality in the long run. Since CA has become the dominant component in PM2.5 in many cities, including Guangzhou, it is imperative to address their spatiotemporal variations and the sources in order to formulate more precise and effective control measures for further alleviating PM pollution. In this study, we observed daytime and nighttime OC and EC mass concentrations, as well as their absorption properties, at different stations in Guangzhou city during autumn and winter, when PM2.5 levels were comparatively higher, and diagnosed the sources of EC, OC, BC, and BrC based on their correlation with typical tracers. Our objectives were to investigate the spatial and temporal distributions of EC and OC and their absorption properties in Guangzhou, particularly their diurnal variations, and to explore their differences in primary emissions and secondary formation.

2. Materials and Methods

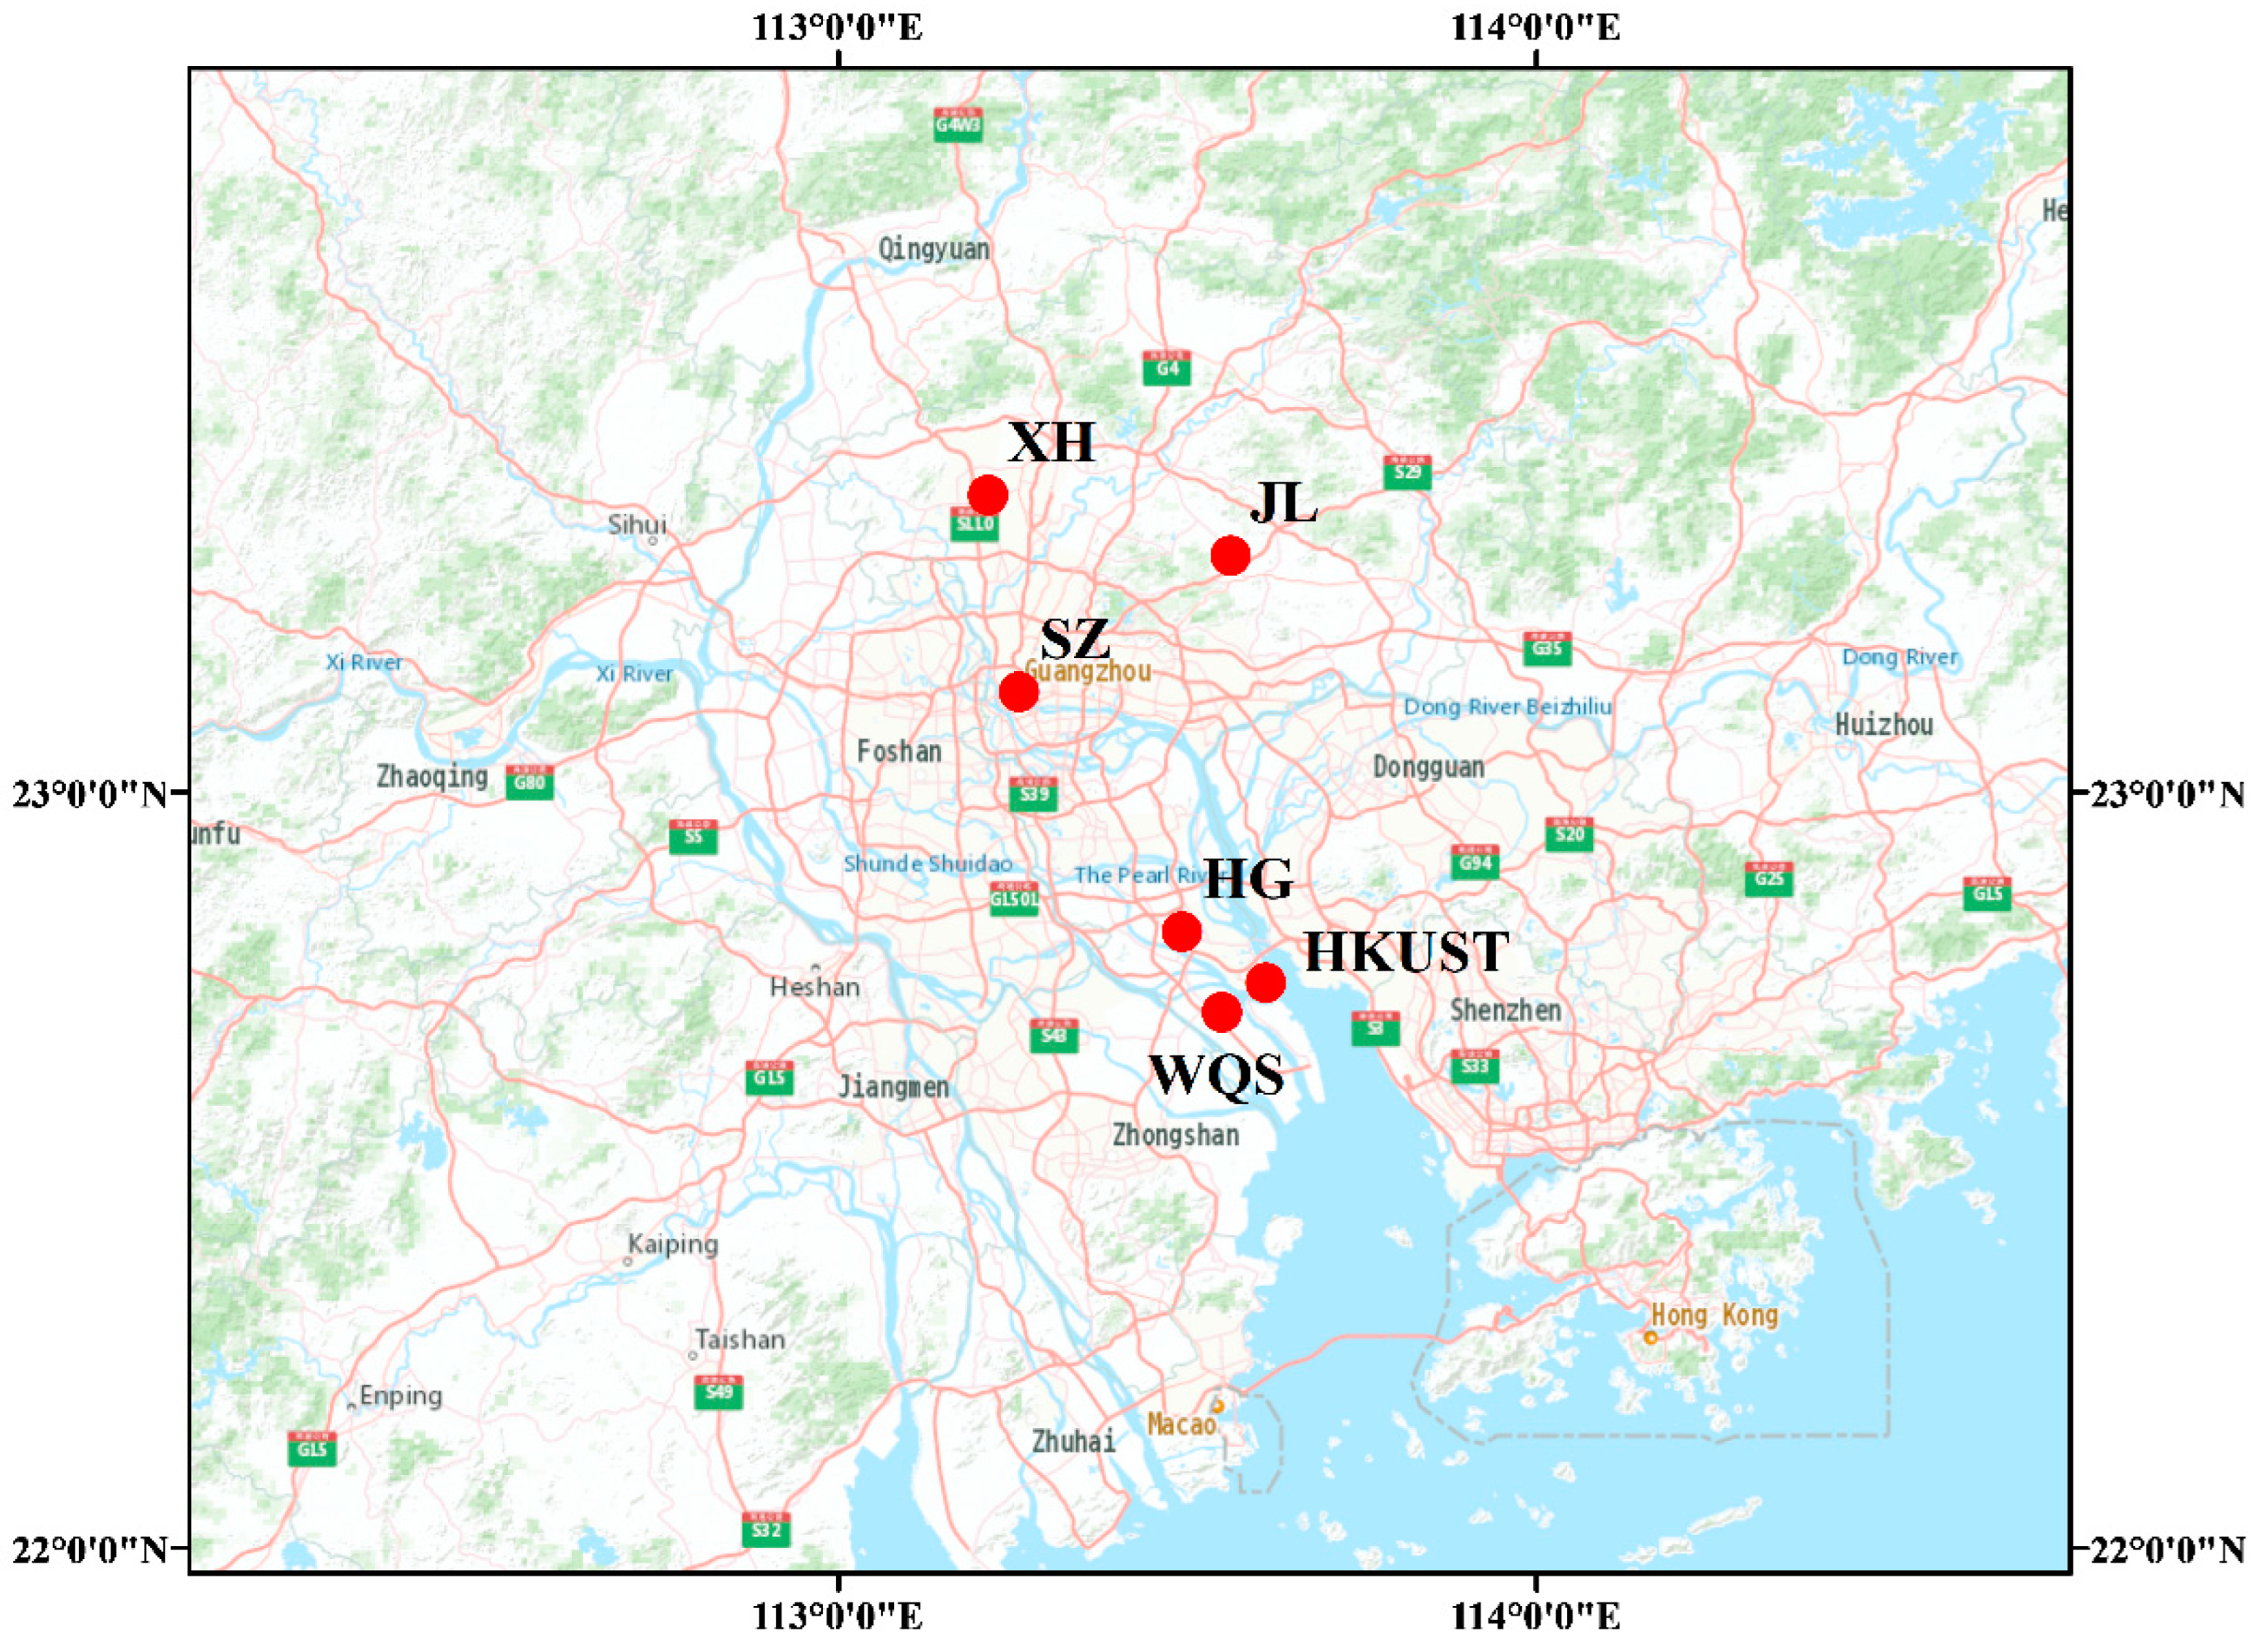
2.1. Sample Collection

The Pearl River Delta (PRD) region is a cluster of coastal cities in southern China’s Guangdong Province in the subtropical/tropical region, with an average air temperature of 24.2 °C, annual sunshine of over 2500 h, annual precipitation of 1544 mm in 2021 [41]. In this study, five typical stations in Guangzhou, the largest city in the PRD region, were selected (Figure 1), comprising one urban station (SZ) and four suburban stations (XH, JL, HG, and HKUST). They are all among the local governmental environmental monitoring stations. In addition, HG and HKUST were regional background sites [42].
SZ (23.13° N, 113.26° E) is located in the center of Guangzhou, surrounded by business and residential neighborhoods. JL (23.31° N, 113.56° E) is a residential area surrounded by woodlands and farms [42]. XH (23.39° N, 113.21° E) is situated by residential neighborhoods and wood. HG (22.82° N, 113.49° E) and HKUST (22.75° N, 113.61° E) are close to each other (13 km apart) and are located in the southernmost part of Guangzhou, encircled by Shenzhen, Foshan, Zhongshan, and Dongguan, and facing the Lingding Ocean to the south. HG, HKUST, and WQS are all regional background monitoring stations in the local governmental air quality monitoring network. There are few industrial activities, vehicle emissions, and residential housing in the surrounding areas. These three sites in the Nansha district of Guangzhou are geographically near each other, with quite similar meteorological conditions and atmospheric compositions; thus, we considered them to be equivalent in this study.
PM2.5 sampling was conducted in both winter (19–30 December 2020) and autumn (25–30 September 2021). Sampling was conducted at three sites (SZ, XH, and HKUST) in winter 2020 and at three locations (SZ, XH, and HG) in autumn 2021. The daily sampling time was divided into two periods, i.e., daytime (8:00–19:30) and nighttime (20:00–7:30 the next day), each period of continuous sampling lasting 11.5 h. Samples were collected using a high-volume sampler (Tisch Environmental Inc., Cleves, OH, USA) with a constant flow rate of 1.13 m3/min [43]. Quartz fiber filters (20.32 cm × 25.40 cm, Whatman, Mainstone, UK) were prebaked for 6 h at 450 °C before being used to collect PM2.5. The filters were weighted before and after sampling using a microbalance (±0.1 μg; Sartorius, Goettingen, Germany) and placed in a constant temperature and humidity chamber at 20 °C and 30% relative humidity for 24 h to gravimetrically retrieve PM2.5 concentrations. There were 101 valid samples in the study.

2.2. Determination of Carbonaceous Fractions

OC and EC in PM2.5 were quantified using a DRI Model 2015 multi-wavelength thermal/optical carbon analyzer (Desert Research Institute, Reno, NV, USA) with the IMPROVE_A protocol [44,45]. More details on the analysis process can be found elsewhere [43].
The concentration of SOC and its contribution to OC was estimated using the EC tracer method proposed by Turpin and Huntzicker (1995) [46,47,48], with the following equation:
SOC = OC − (OC/EC)min × EC
The (OC/EC)min ratio chosen for this paper is the value observed by Wu et al. (2019) in this study region in 2012 and fitted using the MRS method, which is 1.83 in September and 1.86 in December [49].

2.3. Examination of Organic Components, Water-Soluble Ions, and Gaseous Pollutants

Organic components were extracted using organic solvents such as hexane and detected via gas chromatography–mass spectrometry (GC-MS, Agilent 7890 GC/7000 MS, Agilent Technologies, Santa Clara, CA, USA). Water-soluble inorganic ions were extracted using ultrapure water (resistivity of 18.2 MΩ·cm) and detected via ion chromatography (883 Basic IC plus Metrohm, Switzerland). Details of the analysis have been described previously [50,51]. Gaseous pollutant concentrations were determined from the China General Environmental Monitoring Station (https://air.cnemc.cn:18007/, accessed on 1 June 2022).
In this study, we used characteristic markers to identify emission sources. Previous studies have shown that coal combustion emits large amounts of higher-molecular-weight PAHs (HMW-PAHs, five-ringed PAHs and above) [52]; thus, HMW-PAHs are used as tracers of coal combustion sources [50]. Ca2+ is the third most abundant metal element in the soil and is used as the tracer of dust [53]. Motor vehicles emit large amounts of hopanes and steranes, and hopanes and steranes are used to trace motor vehicle emissions [54]. Notably, 2,3-dihydroxy-4-oxopentanoic acid (DHOPA) is widely derived from the oxidation of toluene and is the tracer of anthropogenic secondary organic aerosols (ASOAs) [55]. Isoprene, monoterpene, and sesquiterpene are major VOCs of plant emissions [56]. The biogenic secondary organic aerosols (BSOAs) in this article included 11 kinds of compounds from the oxidation of isoprene, monoterpene, and sesquiterpene. Thus, the BSOA is the tracer referring to SOAs formed through the oxidation of biogenic VOCs (BVOCs). Sterols and fatty acids are the tracers of cooking [57]. Levoglucosan (LG) is produced as a result of the thermal degradation of plant cellulose and is high in aerosols emitted from biomass burning, and therefore used to indicate the source of biomass burning [58,59]. Table S1 lists the species included in the markers for each source.

2.4. Meteorological Parameters and Boundary Layer Height

Meteorological data, including pressure, relative humidity (RH), ambient temperature, wind speed, and wind direction, were obtained from the China National Meteorological Science Data Center (https://data.cma.cn/, accessed on 5 June 2022), and the temporal resolution was 1 h. Boundary layer height (BLH) data were obtained from the European Centre for Medium-Range Weather Forecasts (ECMWF, https://cds.climate.copernicus.eu/, accessed on 10 June 2022). The spatial resolution of BLH data was 0.25° × 0.25°, and the temporal resolution was 1 h. We chose the nearest observation point as the BLH for each station. Detailed information about the nearest points for each station can be found in Table S2.

2.5. Separation of Light Absorption of BC and BrC

CAs are the most important light-absorbing substances in atmospheric aerosols [60]. BC has strong absorption in the whole visible spectrum, and its absorption capacity is inversely proportional to the wavelength, i.e., AAE = 1, while BrC has stronger absorption of sunlight at wavelengths of 200–550 nm, with stronger wavelength dependence and AAE is greater than 1 [61]. In this study, the light attenuation of filter samples before and after analysis was measured with the 7-wavelength laser of DRI Model 2015. The respective absorption contributions of BC and BrC were quantified based on the different AAE values of BC and BrC.
Previous studies have shown that the absorption optical depth (τa,λ) of BC or BrC has the following relationship with the wavelength (λ) of light [62]:
τ a , λ , B C = K B C × λ A A E B r C
τ a , λ , B r C = K B C × λ A A E B C
where KBC and KBrC are the fitting coefficients of BC and BrC, respectively. AAEBC and AAEBrC are the AAE of BC and BrC, respectively.
Optical attenuation (ATN) is calculated using the following formula:
A T N λ = l n ( F T λ , I F T λ , f )
where FTλ,i indicates the light transmittance value of the filter sample before the thermochemical analysis; FTλ,f indicates the light transmittance value of the filter after the analysis (i.e., the light transmittance value of the blank filter).
Chen et al. (2015) [62] investigated the samples from diesel vehicle exhaust, biomass burning, and ambient air, concluding that the τa,λ of particle samples at specific wavelengths is related to ATN as follows:
τa,λ = Aλ × ATNλ2 + Bλ × ATNλ
where Aλ and Bλ are fitted coefficients with different values at different wavelengths.
Since the contribution of dust to PM2.5 is small [63], it is assumed that only BC and BrC absorb light from PM2.5. Therefore, the τa,λ of PM2.5 can be described as follows:
τ a , λ = K B C × λ A A E B C + K B r C × λ A A E B r C
The total τa,λ of particles at each of the seven wavelengths (405, 445, 532, 635, 780, 808, and 980 nm) was calculated using ATN. AAEBC is equal to 1 [30], and AAEBrC is greater than 1 [64]; thus, the most suitable value of AAEBrC was chosen between 2 and 8, obtained using the best fit of Equation (6) through the least squares method.
The absorption coefficient of BC or BrC is calculated as follows:
b a b s M m 1 = τ a , λ × A V × 100
where A is the effective area of the filter samples (cm2), and V is the sampling volume (m3).
The MAC for BC is determined by dividing the absorption coefficient for BC by the mass concentration of EC. Likewise, the MAC for BrC is determined by dividing the absorption coefficient for BrC by the mass concentration of OC, while the MAC for total carbon (TC) is determined by dividing the absorption coefficient for CA by the mass concentration of TC.
It should be noted that the filter-based method for the characterization of the light absorption of BC and BrC in this study has its artifacts due to biased light attenuation and loading effects of the filter [65]. Additionally, due to being affected by particle size and type of mixture, the AAE of BC is not precisely equal to 1.0 [66].

3. Results and Discussion

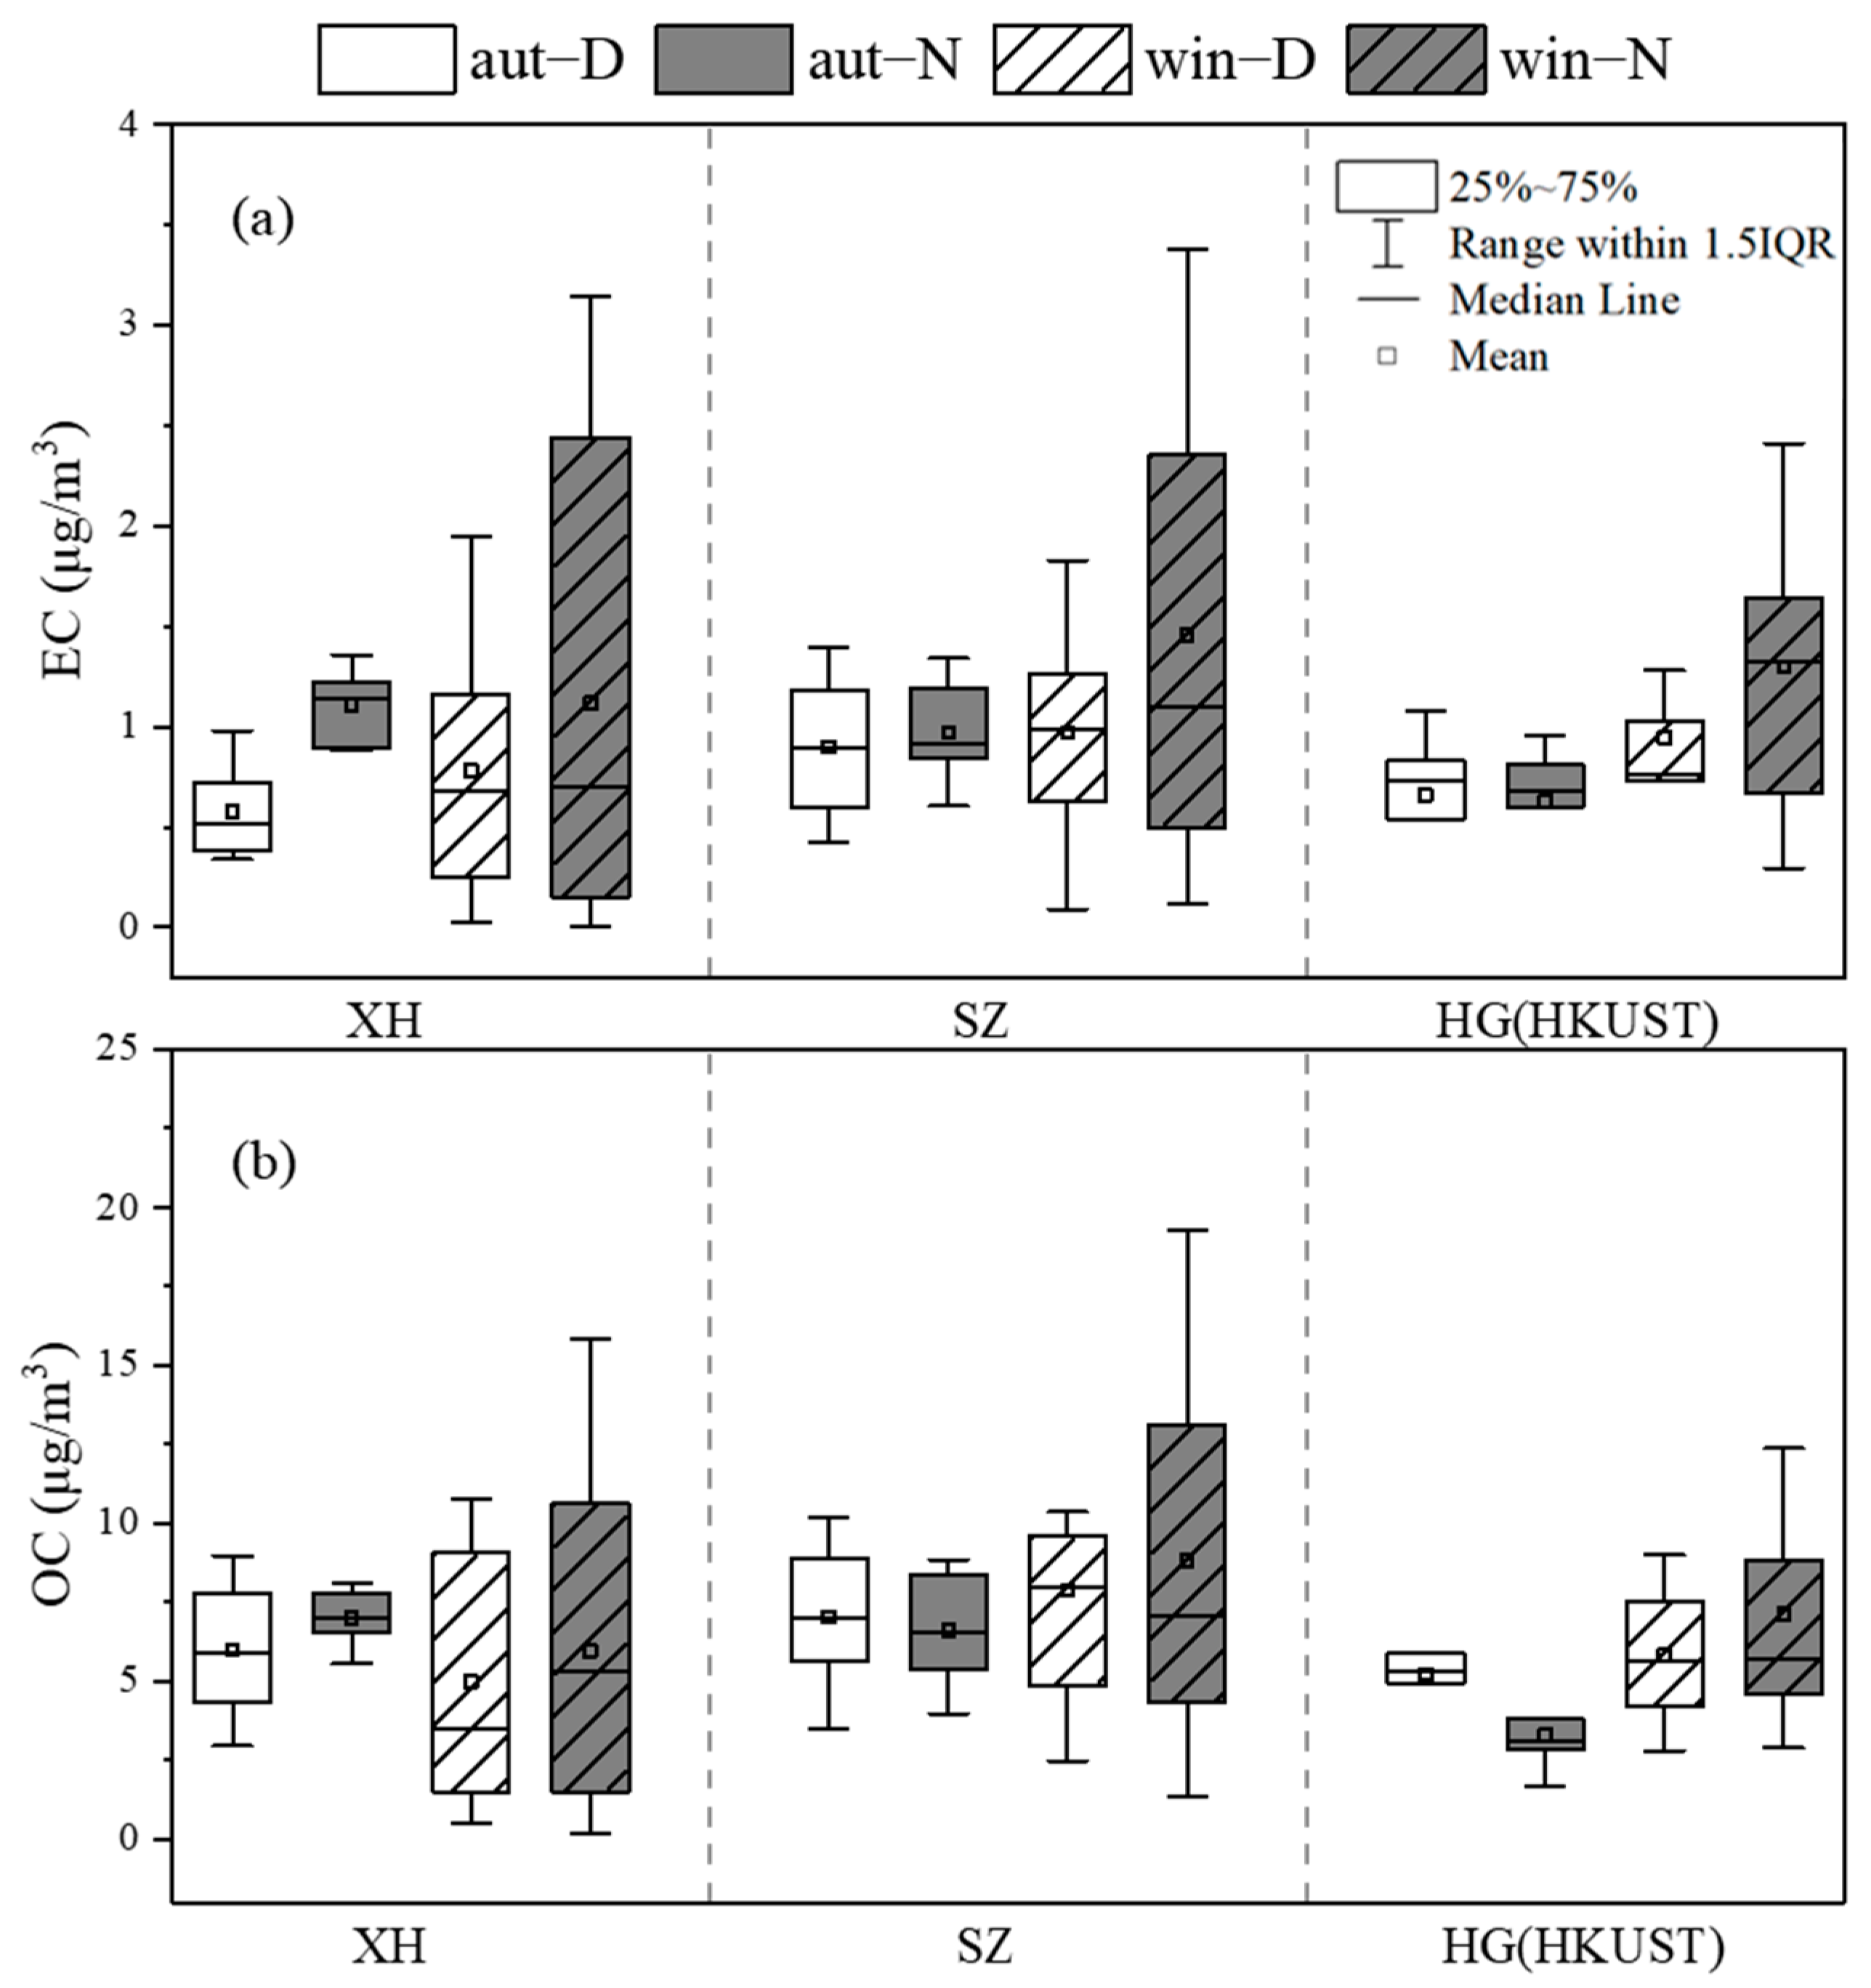
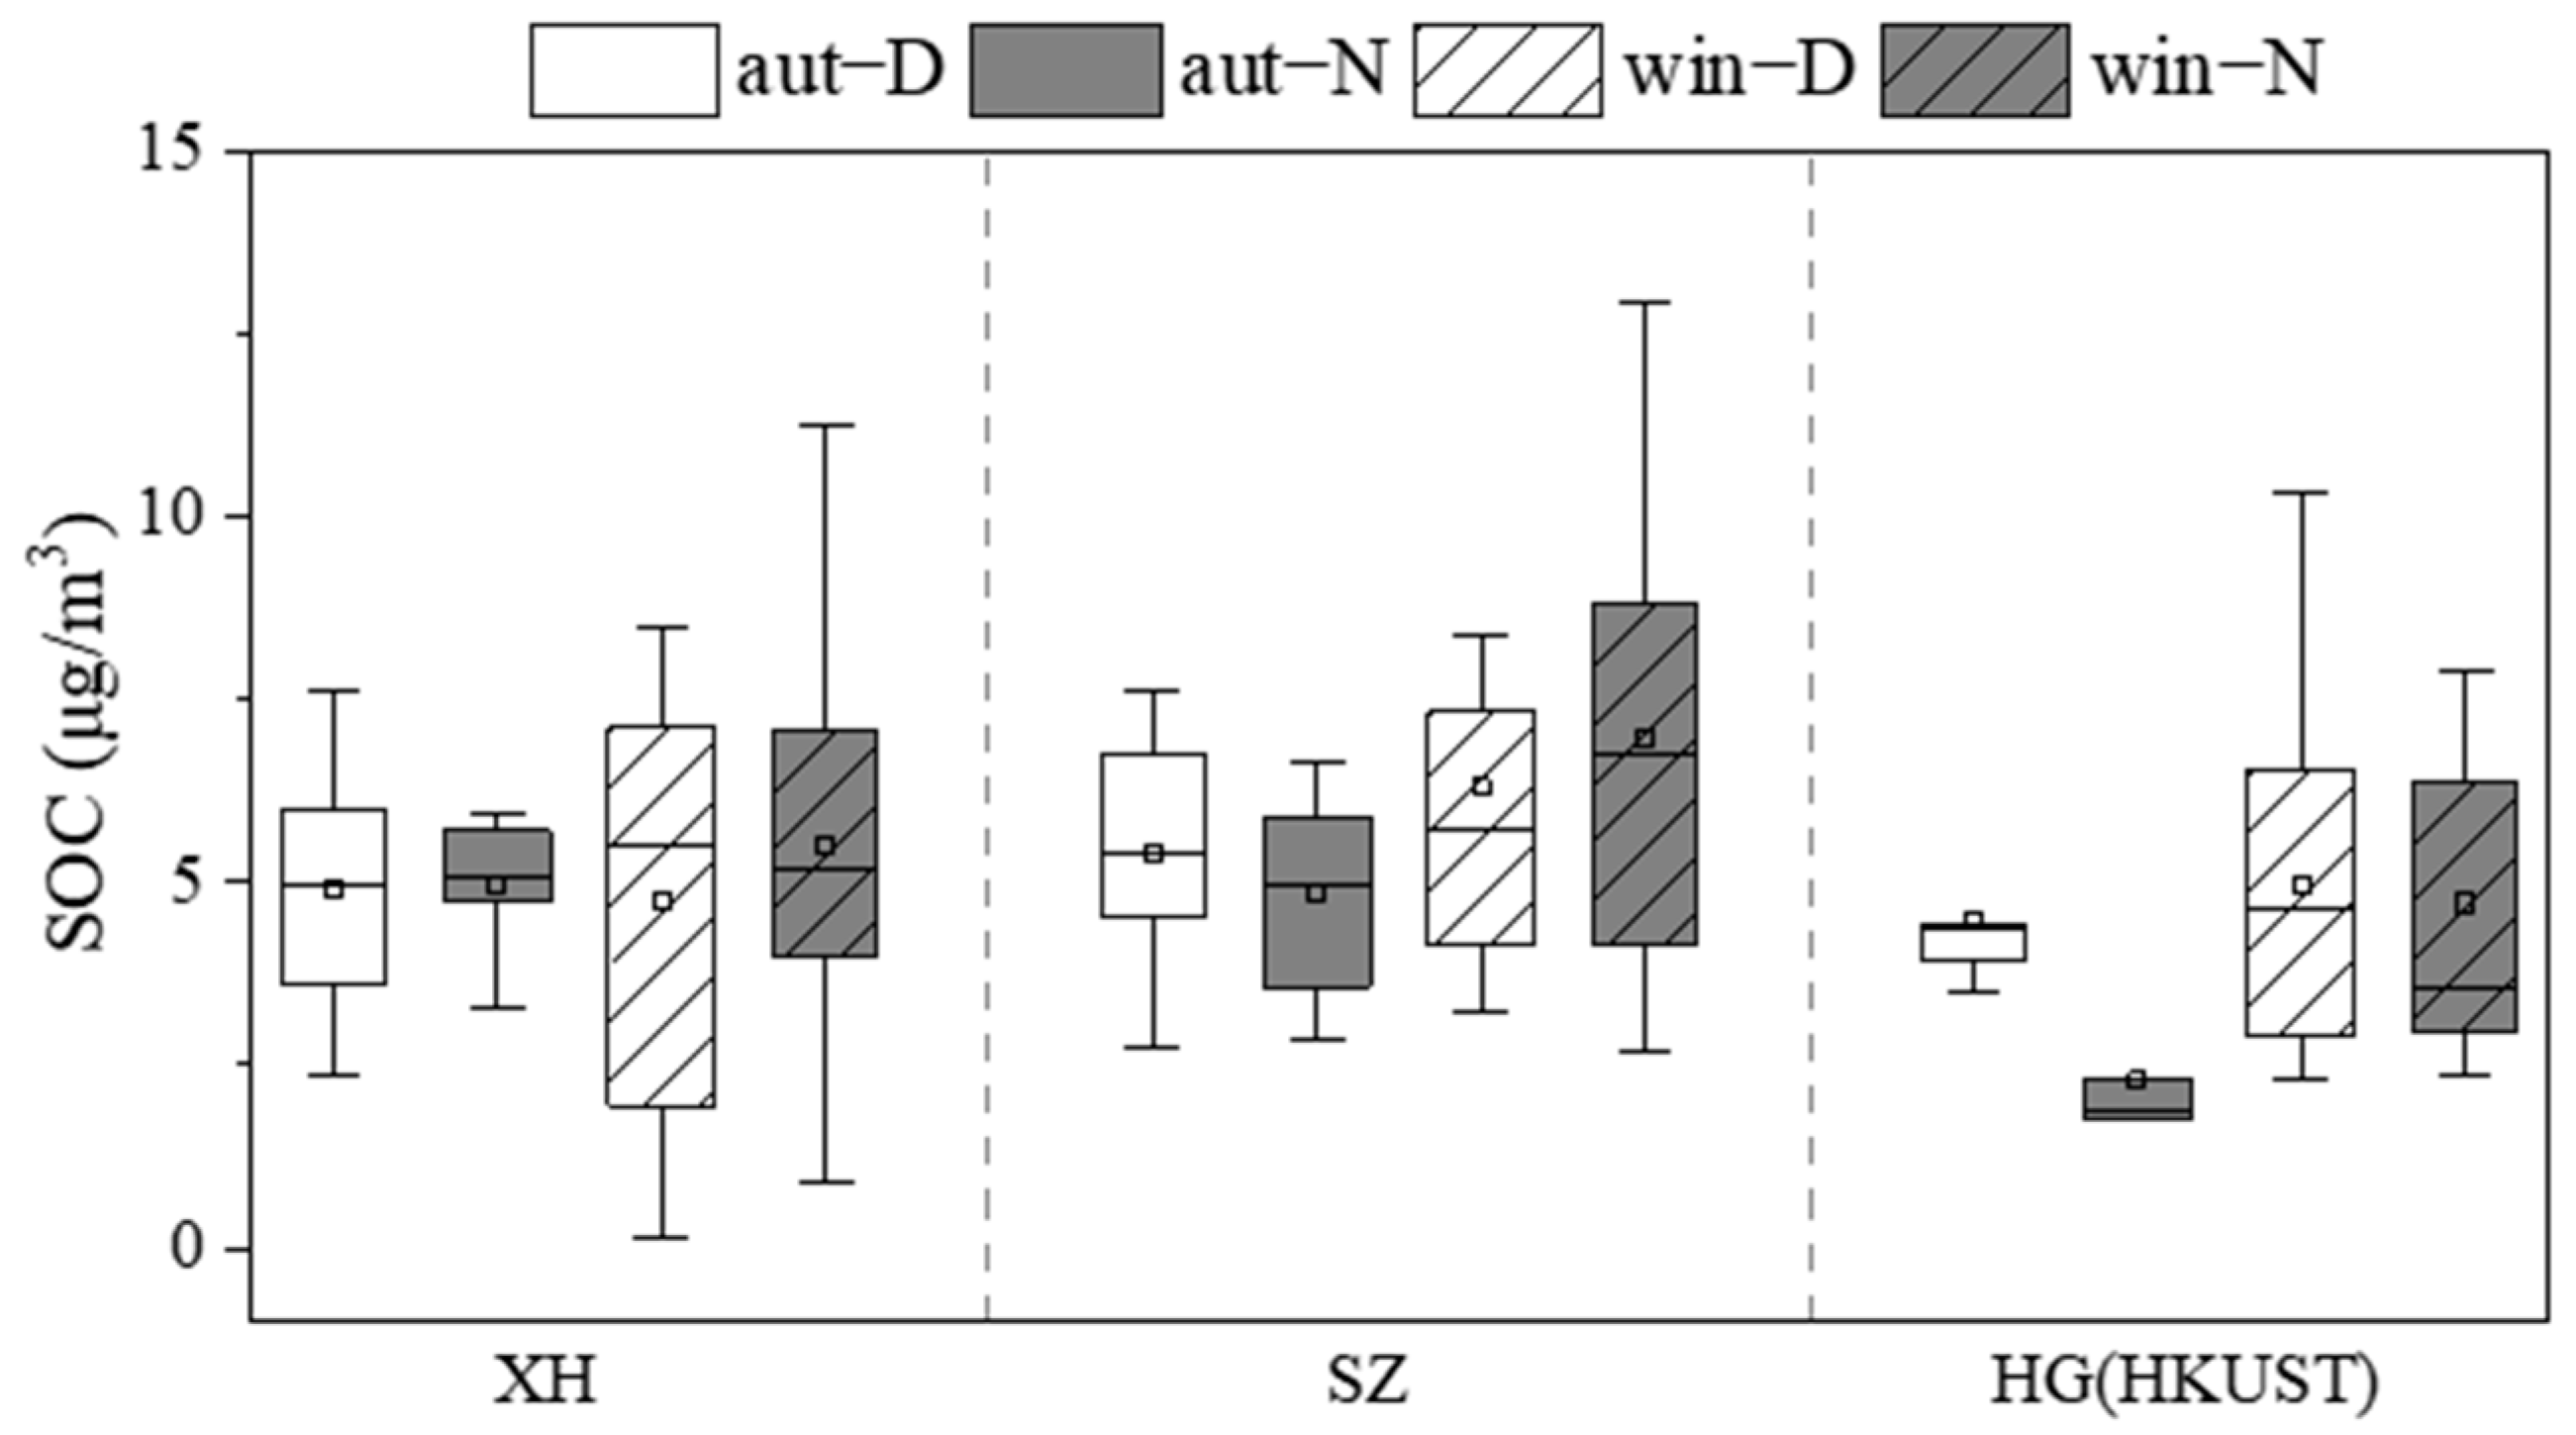
3.1. Spatial and Temporal Distribution of OC and EC Mass Concentrations

Table 1 shows the percentage of TC and CA in PM2.5 and the radio of OC/EC and SOC/OC in autumn and winter. The mass concentration percentage (mean ± standard deviation) of total carbon (TC) to PM2.5 (TC/PM2.5) in our study area was 15.1 ± 3.7% and 17.5 ± 7.2% in autumn and winter, respectively. Studies in the literature have revealed that organic matter to organic carbon (OM/OC) in the PRD region ranges from 1.6 to 2.0 [67,68], and the compromise of 1.8 in this paper, resulting in CA/PM2.5 of 25.8 ± 6.5% and 29.5 ± 11.9% in autumn and winter, respectively, indicates that CA is an important component of PM2.5. There was a small gap in CA/PM2.5 between autumn and winter, which indicated that CA had a comparatively stable proportion in autumn and winter. The mean concentrations of OC and EC in autumn were 5.9 ± 2.2 and 0.8 ± 0.3 μg/m3, respectively, and the ratio of OC to EC (OC/EC) was 7.5 ± 2.1. The mean concentrations of OC and EC in winter were 6.9 ± 4.4 and 1.1 ± 0.8 μg/m3, respectively, and the ratio of OC/EC was 6.6 ± 2.0. Previous studies have pointed out that OC and EC are used as a characteristic ratio to assess the source contribution of OC in the atmosphere, and a larger ratio of OC/EC represents a higher proportion of secondary production contribution [69]. In our study, the greater OC/EC ratios in both autumn and winter indicated substantial contributions of OC from secondary production. Based on the least-ratio method of Equation (1), the percentage of SOC in OC was as high as 73.7 ± 7.3% in autumn and 68.4 ± 13.1% in winter. These values were much higher than the SOC/OC of 25–56% in Nanjing in 2013 [70] or 26 ± 19% in Beijing in 2017 [71], largely due to enhanced SOA formation in this tropical/subtropical region, with less coal burning but more abundant industrial and biogenic VOC emissions [72].
Figure 2 shows the variations in daytime and nighttime OC and EC in autumn and winter. As shown in Figure 2a, only XH showed significant differences in EC concentration during day and night (p < 0.05, Figure S1), i.e., EC concentration was significantly higher at night than during the day. Like EC as a primary combustion emission marker, other primary source markers, namely LG (biomass burning), HMW-PAHs (coal combustion), and hopanes (vehicle emissions), as well as BLH, showed larger day–night differences (Table 2) at the XH site. The Pearson correlation analysis of BLH with EC, CO, LG, HMW PAHs, and hopanes (Figure S6a) revealed highly significant negative correlations (p < 0.01), indicating that diurnal differences in EC and other primary source markers might be mainly influenced by the cumulative effect of lower BLH at nighttime. The distribution that day–night variations in EC concentrations due to changing BLH were also observed in the PRD region and the Beijing–Tianjin–Hebei region [22,24,49]. The insignificant diurnal variation in EC concentrations at other sites was probably because of the decrease in anthropogenic emissions at night coinciding with the enrichment of pollutants due to the decrease in BLH at night.
Regarding OC, as shown in Figure 2b, only HG showed significantly (p < 0.05, Figures S1 and S5) higher daytime than nighttime OC concentrations in autumn. As shown in Figure S6, OC showed a weak correlation with BLH, but highly positive correlations with DHOPA, BSOA, hopanes, and LG, and all of these compounds decreased at night (Table 2), probably due to a significant decrease in photochemical SOA formation and vehicle emissions and biomass burning at night around the regional site HG. It is worth noting that concentrations of PM2.5, OC, EC, and tracers at HG were the lowest among the sites (Table S3 and Table 2), and thus secondary or transported OC might have a greater contribution.
Figure 3 shows the variations in SOC concentrations. In autumn, a significant diurnal variation (p < 0.05, Figure S1) in SOC concentration was only observed at HG. Temperature can reflect the intensity of daytime solar radiation to some extent [73], and Table S3 shows that the average daytime temperatures at the three sites in autumn were all around 32 °C with negligible differences in the intensity of solar radiation within the region. As revealed in Table 2, except for HMW-PAHs, other source tracers at the HG site decreased during nighttime, which was different from that at other sites in the autumn. Additionally, SOC was weakly correlated with BLH and strongly correlated with DHOPA (R = 0.84) and BSOA (R = 0.73). Studies have shown that there are large amounts of anthropogenic VOCs and isoprene emitted as SOC precursors in the PRD region [24,74,75]. Therefore, the significant decrease in anthropogenic and biogenic precursor VOCs and the absence of photochemical reactions resulted in a significant decrease in SOC generated at the HG site during the night.
In winter, diurnal variations in EC, OC, and SOC concentrations between daytime and nighttime were not significant (p > 0.1, Figure S2). The weaker solar radiation and the smaller diurnal differences in BLH in winter than in autumn might be among the main reasons.
To explore the changes in CA concentration in Guangzhou in recent years, we used data from 2015 for comparison [43]. Table 3 shows the average values of CA concentration and their difference for the three sites JL, SZ, and HG (or WQS) in the autumn of 2015 and 2021 when PM2.5 pollution levels were close. Both HG and WQS are regional background sites located ~13 km away from each other on the southern coast of Guangzhou (Figure 1); thus, we considered these two sites equivalently. The average PM2.5 concentration during the field campaign in 2015 was almost identical to that in 2021 (Table 3), while the average concentrations of TC, OC (or OA), and EC decreased by 39.5%, 25.4%, and 73.4%, respectively, indicating that EC concentration was reduced more rapidly than TC or OC, or that primarily emitted CA was reduced much more than the secondarily produced CA, with the average OC/EC ratio increasing by ~180%. The concentration of SOC, however, was almost unchanged, and thereby the SOC/OC ratio increased from 48.1% to 72.9%. TC/PM2.5 decreased from 25.9% in 2015 to 15.4% in 2021, and CA/PM2.5 decreased from 40.3% to 29.6%, possibly due to the control of emission sources such as biomass burning and vehicle emissions [76,77]. The strict mobility control of transportation and industrial activities in Guangzhou during the COVID-19 pandemic might also contribute substantially to the reduced EC emissions [78,79].

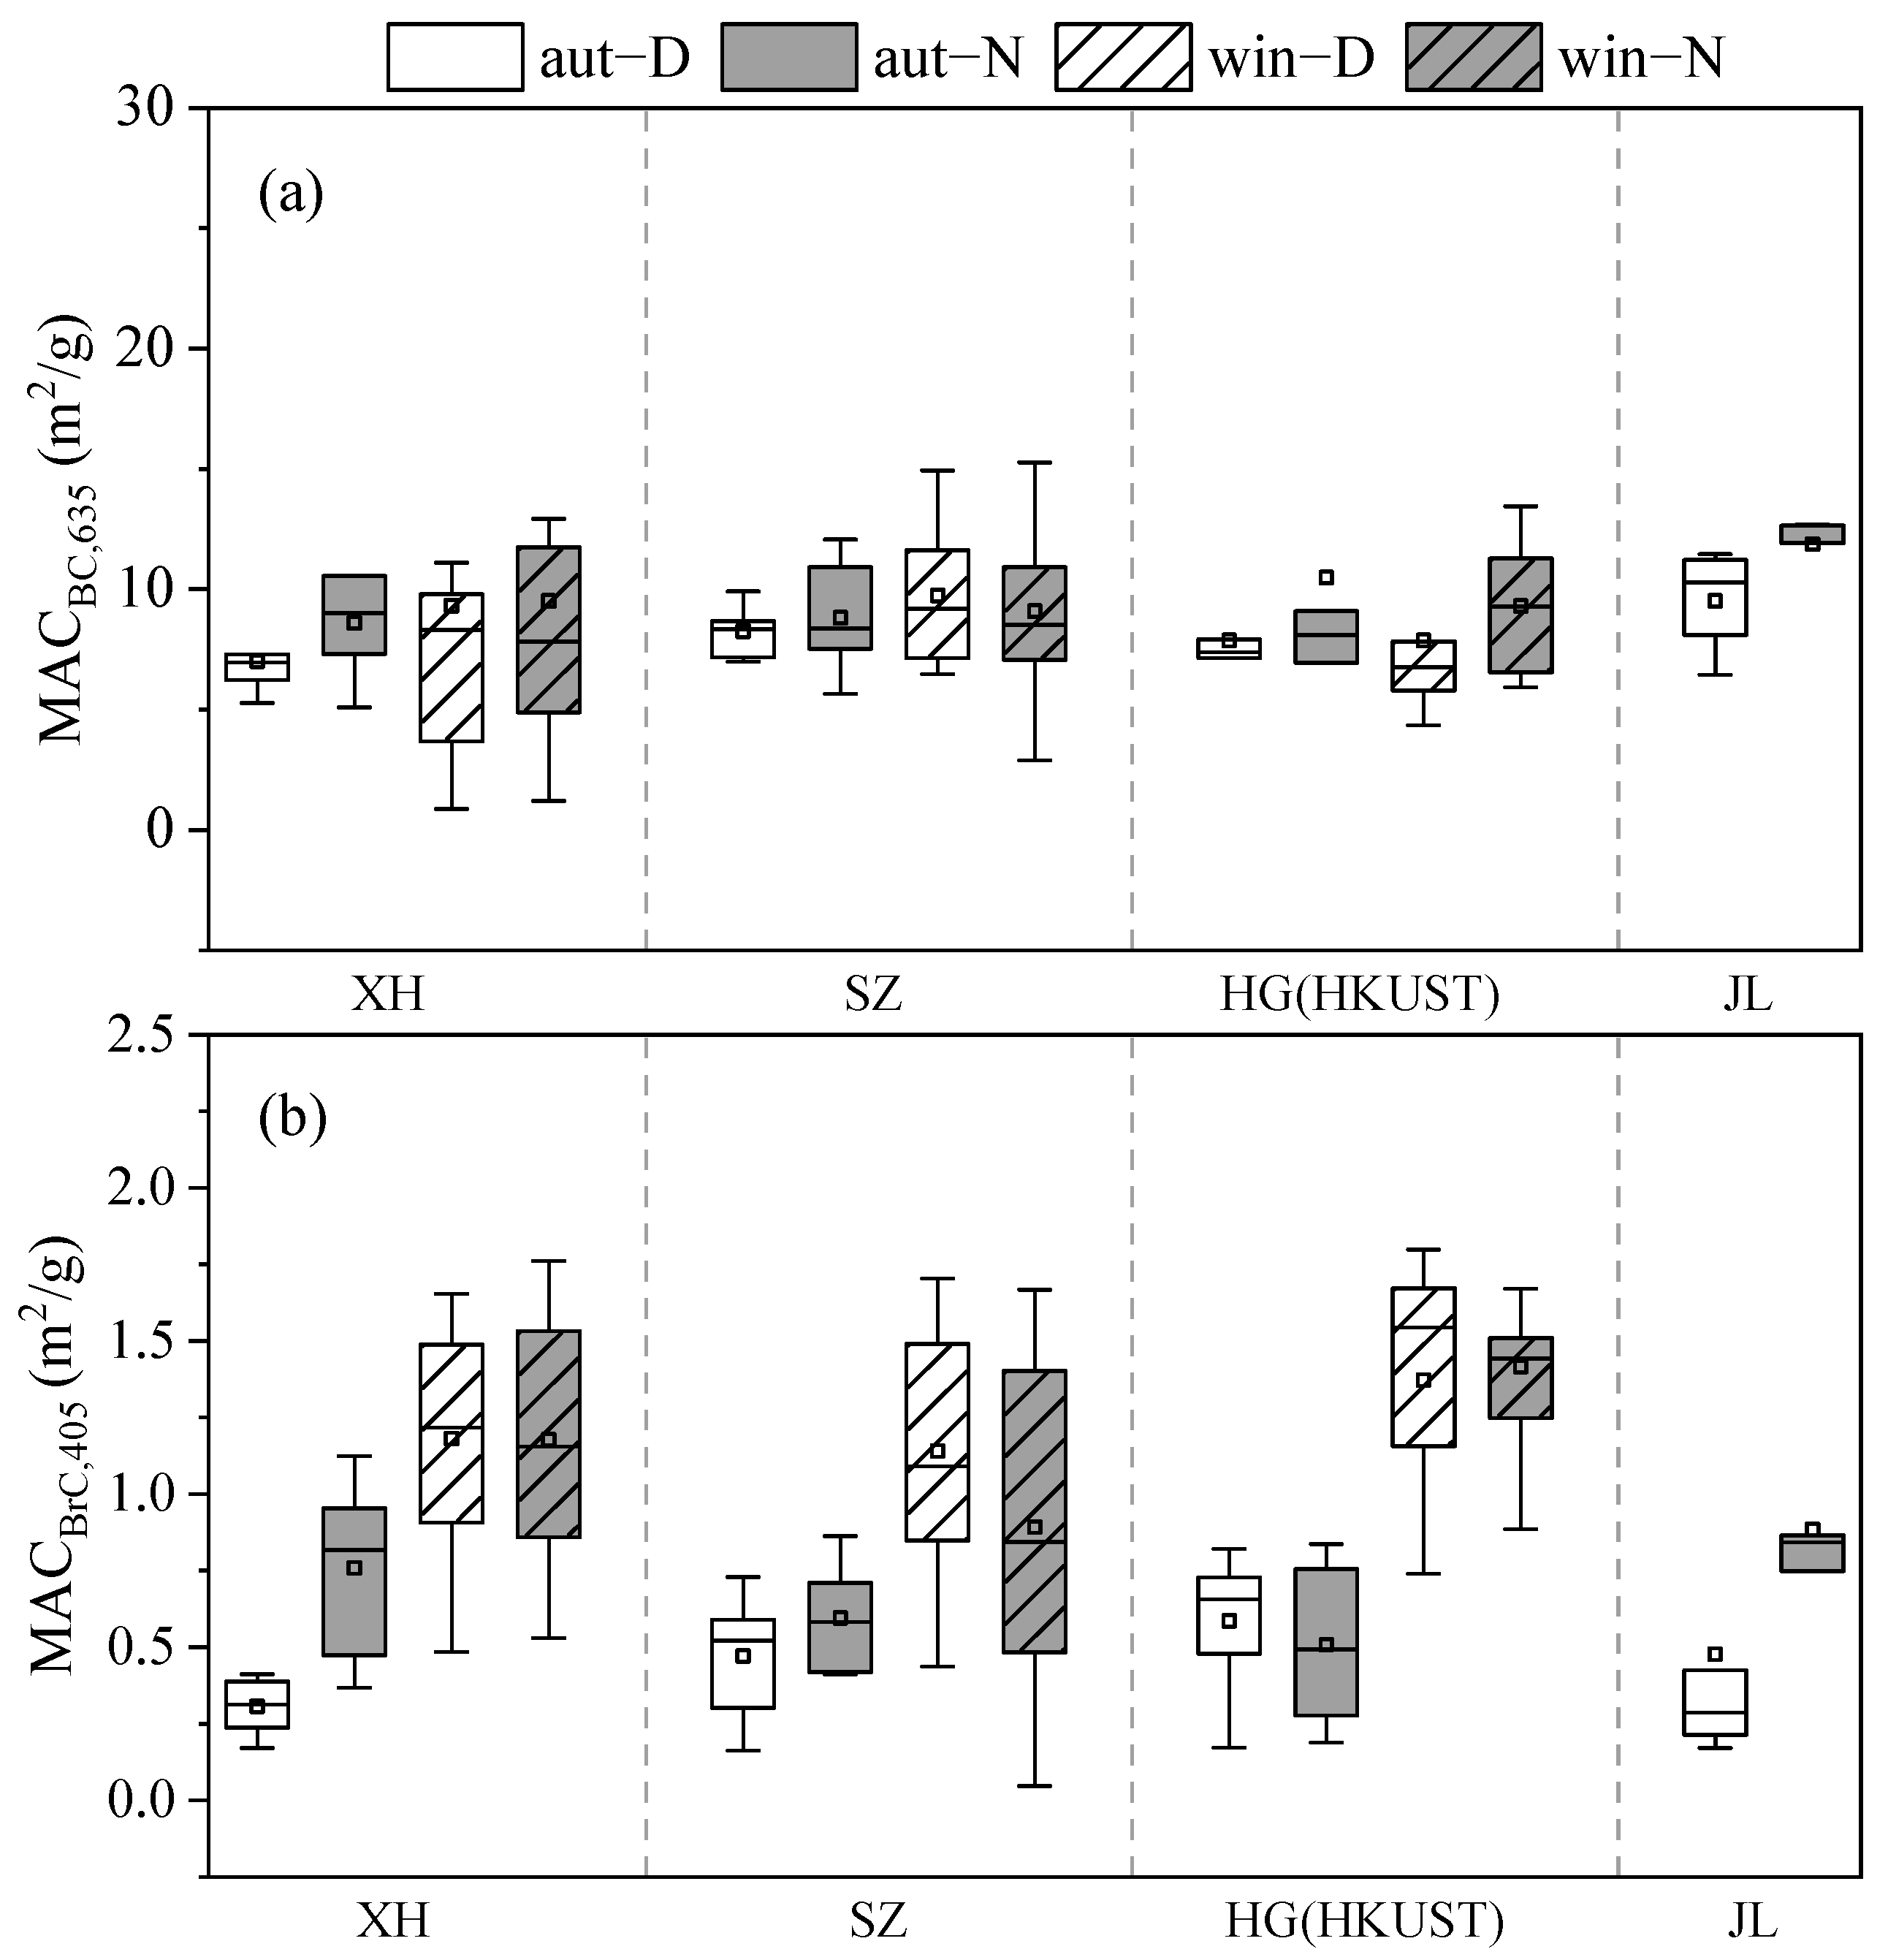
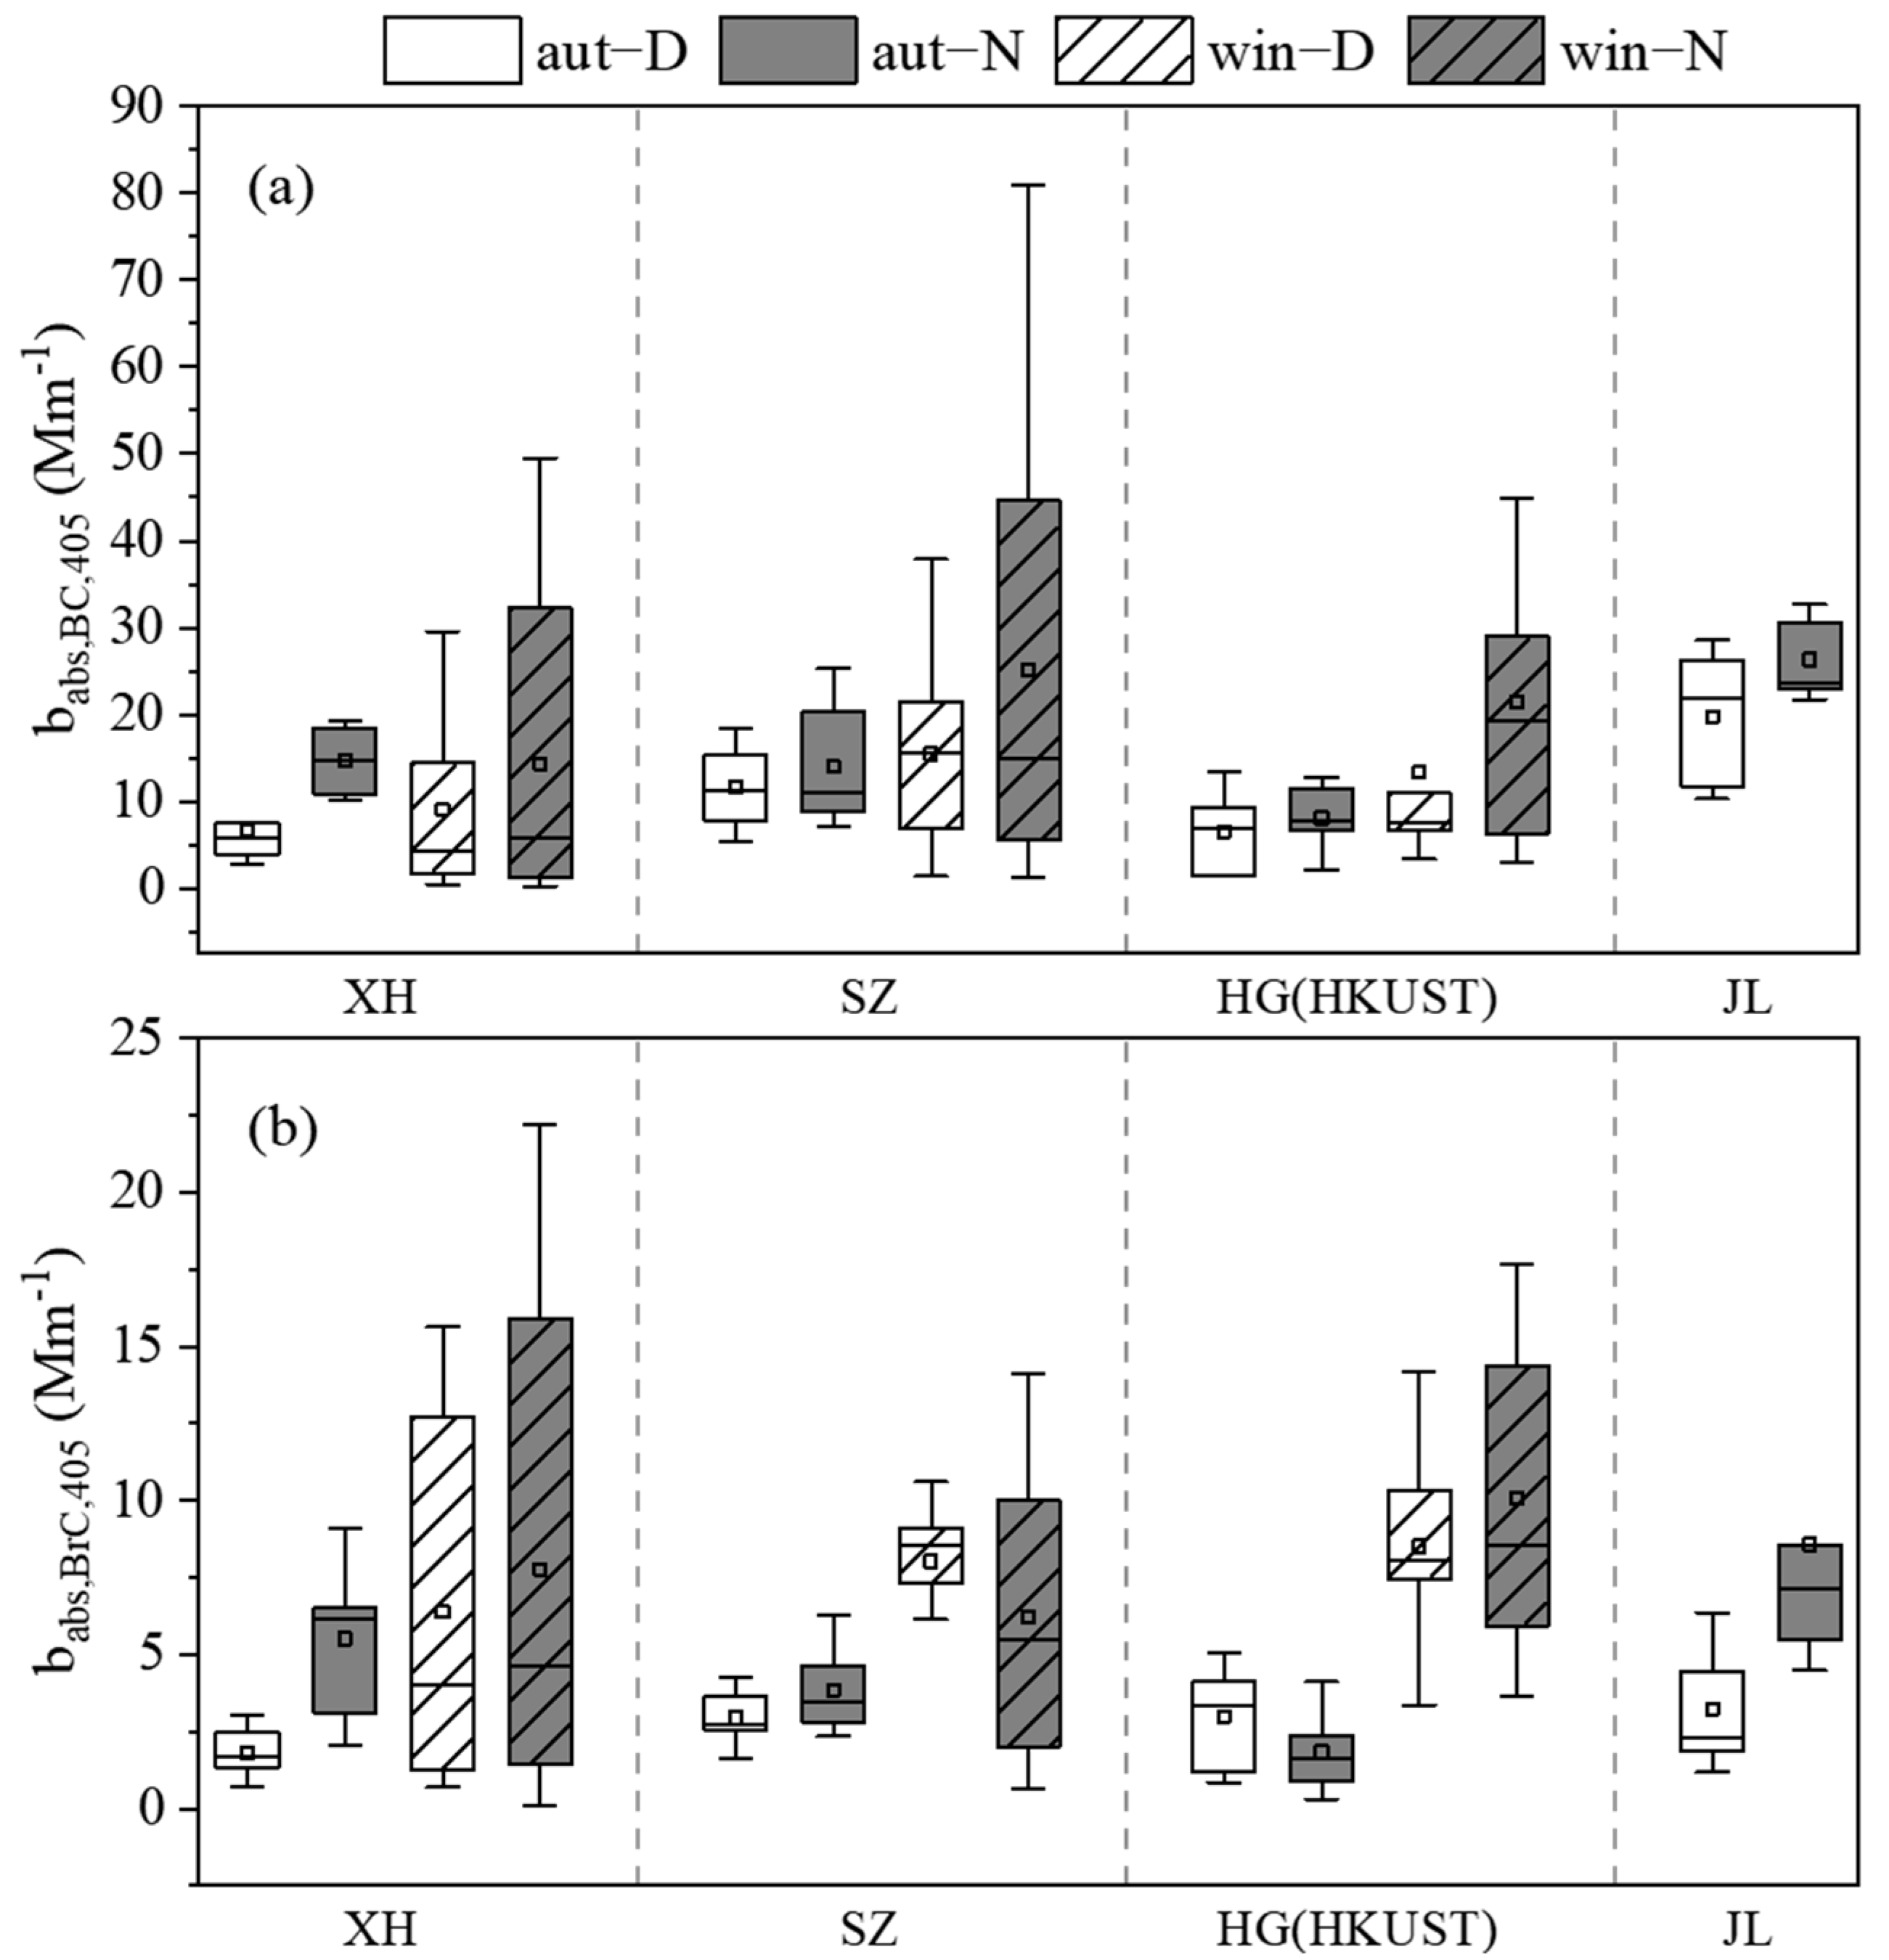
3.2. Light Absorption Properties of OC and EC

BrC is the light absorption component of OC, while EC can alternatively be expressed as BC. We used the absorption coefficients at 405 nm to characterize the absorption properties of BrC (babs,BrC,405) and BC (babs,BC,405) in this study. The mean values of babs,BrC,405 and babs,BC,405 in the study area were 3.1 ± 1.9 and 10.2 ± 5.6 Mm−1 in autumn, and 7.7 ± 5.1 and 16.4 ± 16.5 Mm−1 in winter, respectively. This is similar to the seasonal distribution in Chinese cities such as Tianjin and Xi’an, where babs,BrC,365 was reported to be 4–8 times higher in winter than in summer [28,80]. The AAE values of CA were 1.3 ± 0.1 and 1.6 ± 0.3 in autumn and winter, respectively. The contribution of BrC at 405 nm to CA light absorption in this study was 22.1 ± 7.7% in autumn and reached 37.0 ± 13.0% in winter, which was higher than that of 19.0 ± 5.0% and 17.8 ± 3.7% reported in the southwestern Chinese cities of Chongqing and Chengdu in winter, respectively [81]. The mean mass absorption coefficient at 405 nm of BrC (MACBrC,405) in this study was 0.54 ± 0.24 in autumn, much lower than that in winter (1.18 ± 0.43 m2/g). Lower values have been reported in winter in China’s Three Gorges Reservoir region (0.8 ± 0.4 m2/g) [82], and much higher values were previously reported in autumn in the Indo-Gangetic Plain (2.9 ± 0.5 m2/g) [83].
Figure 4 shows the variations in babs,BrC,405 and babs,BC,405. In winter, there were no significant diurnal variations (p > 0.1, Figure S2) for both babs,BrC,405 and babs,BC,405, and the same was true for MACBrC,405 and the mass absorption coefficient of BC at 635 nm (MACBC,635). In autumn, as shown in Figure 4a, only babs,BC,405 at the XH site showed significant diurnal differences among the sites (p < 0.05, Figure S1). The good negative correlation between babs,BC,405 or primary source markers (such as EC and LG) with BLH (Figure S6a) suggested that the diurnal differences in babs,BC,405 were mainly controlled by the BLH. In addition, both babs,BC,405 and MACBC,635 at the JL site exhibited a daytime low-nighttime high distribution, but only MACBC,635 showed a significant diurnal difference (p < 0.05, Figure S5). The highest LG concentrations occurred at the JL site, especially at night (Table 2), indicating changes in biomass burning emissions might be a reason for the diurnal variation of babs,BC,405 and MACBC,635.
In autumn, the babs,BrC,405 values at XH and JL were lower during the daytime and higher at night. This diurnal variation was consistent with that in previous studies. For example, light absorption coefficients of methanol-extracted BrC at 365 nm (babs,BrC,365) during nighttime in winter Beijing were twice as high as that during daytime, while MACBrC,365 was slightly higher at night than during daytime [84]. The babs,BrC,365 and MACBrC,365 in Xi’an in summer were also higher at night than during daytime for the methanol-extracted BrC but were similar for the water-soluble BrC [28]. In the diurnal variability of the spectral characteristics of water-soluble BrC in winter in Delhi, India, the babs,BrC was higher from 8:00 p.m. to 5:00 a.m. and became the lowest in the afternoon; the MACBrC,365 was also slightly higher at night than during daytime [85]. However, water-soluble BrC in Tianjin showed no significant daytime/nighttime differences in babs,BrC or MACBrC at 365 nm in both summer and winter [80]. As shown in Figure 5b, at XH and JL sites, MACBrC,405 values were also significantly lower during daytime than during nighttime (p < 0.05, Figure S1), indicating that a significant enhancement of BrC light absorption capacity occurred at night. Previous studies have demonstrated that more contribution of weakly light-absorbing SOAs during the day, photobleaching effects, and NO3 chemistry at night all resulted in the greater light absorption of BrC at night [80,86,87]. In autumn, babs,BrC,405 was strongly correlated with LG, hopanes, and HMW-PAHs at the sites (Figure S6a), indicating that BrC is probably related to biomass burning, vehicle emissions, and coal combustion. If the effect of the boundary layer was excluded, no significant day–night differences were observed for LG, hopanes, and HMW-PAHs, except for LG and HMW-PAHs at the JL site (Table 2). BrC emitted from primary sources such as biomass burning could undergo photobleaching during daytime [88], causing babs,BrC,405 and MACBrC,405 to be lower during daytime than during nighttime at XH and JL in autumn. Although both babs,BrC,405 and MACBrC,405 were also slightly higher at night than during daytime at SZ in autumn, the differences were not significant, indicating that the chemical composition of BrC was similar during daytime and nighttime. Differentially, babs,BrC,405 in HG was higher during daytime than during nighttime, and the MACBrC,405 during daytime was almost the same as that at night, indicating that the light absorption capacity of BrC did not change significantly, while the intensity of BrC emission was stronger during the day. As shown in Figure S6, the babs,BrC,405 value at the HG site was strongly correlated with DHOPA and LG, and all other emission source markers were reduced at night. This suggested that the higher daytime babs,BrC,405 at HG was mainly influenced by the significant decrease in biomass burning emissions and SOA formation from anthropogenic precursors at night.
In the autumn of 2015, the average values of babs,BrC,405 were 9.9, 8.8, and 8.8 Mm−1 at JL, SZ, and WQS (replaced by HG in 2021) in autumn 2015 [43], respectively; and they were 5.9, 3.4 and 2.4 Mm−1 in the autumn of 2021 at JL, SZ, and HG, with a decrease of 40.4%, 61.5%, and 72.7%, respectively. The light absorption contribution percentages of BrC in CA were 18.1%, 20.8%, and 19.0% at JL, SZ, and HG in autumn 2021, respectively, and were approximately 19.0%, 15.0%, and 19.0%, respectively, in autumn 2015 [43]. The mean MACBrC,405 and MACBC,405 values were 0.58 m2/g and 14.7 m2/g in autumn 2021, respectively, with a 55.3% decrease in MACBrC,405 and comparable in MACBC,405 when compared to those of 1.3 m2/g and 13.4 m2/g, respectively, in autumn 2015. babs,BrC,405 was highly correlated with LG in the autumn of both years, suggesting the substantial contribution of BrC from biomass burning in autumn. It is possible that photobleaching was stronger in September than in November, making MACBrC,405 lower in 2021. The slope of babs,405 versus TC was 3.40 m2/g in autumn 2021, which was 31.3% lower than that of 4.95 m2/g in autumn 2015. As the proportion of EC in TC decreased, the MAC of CA also decreased.

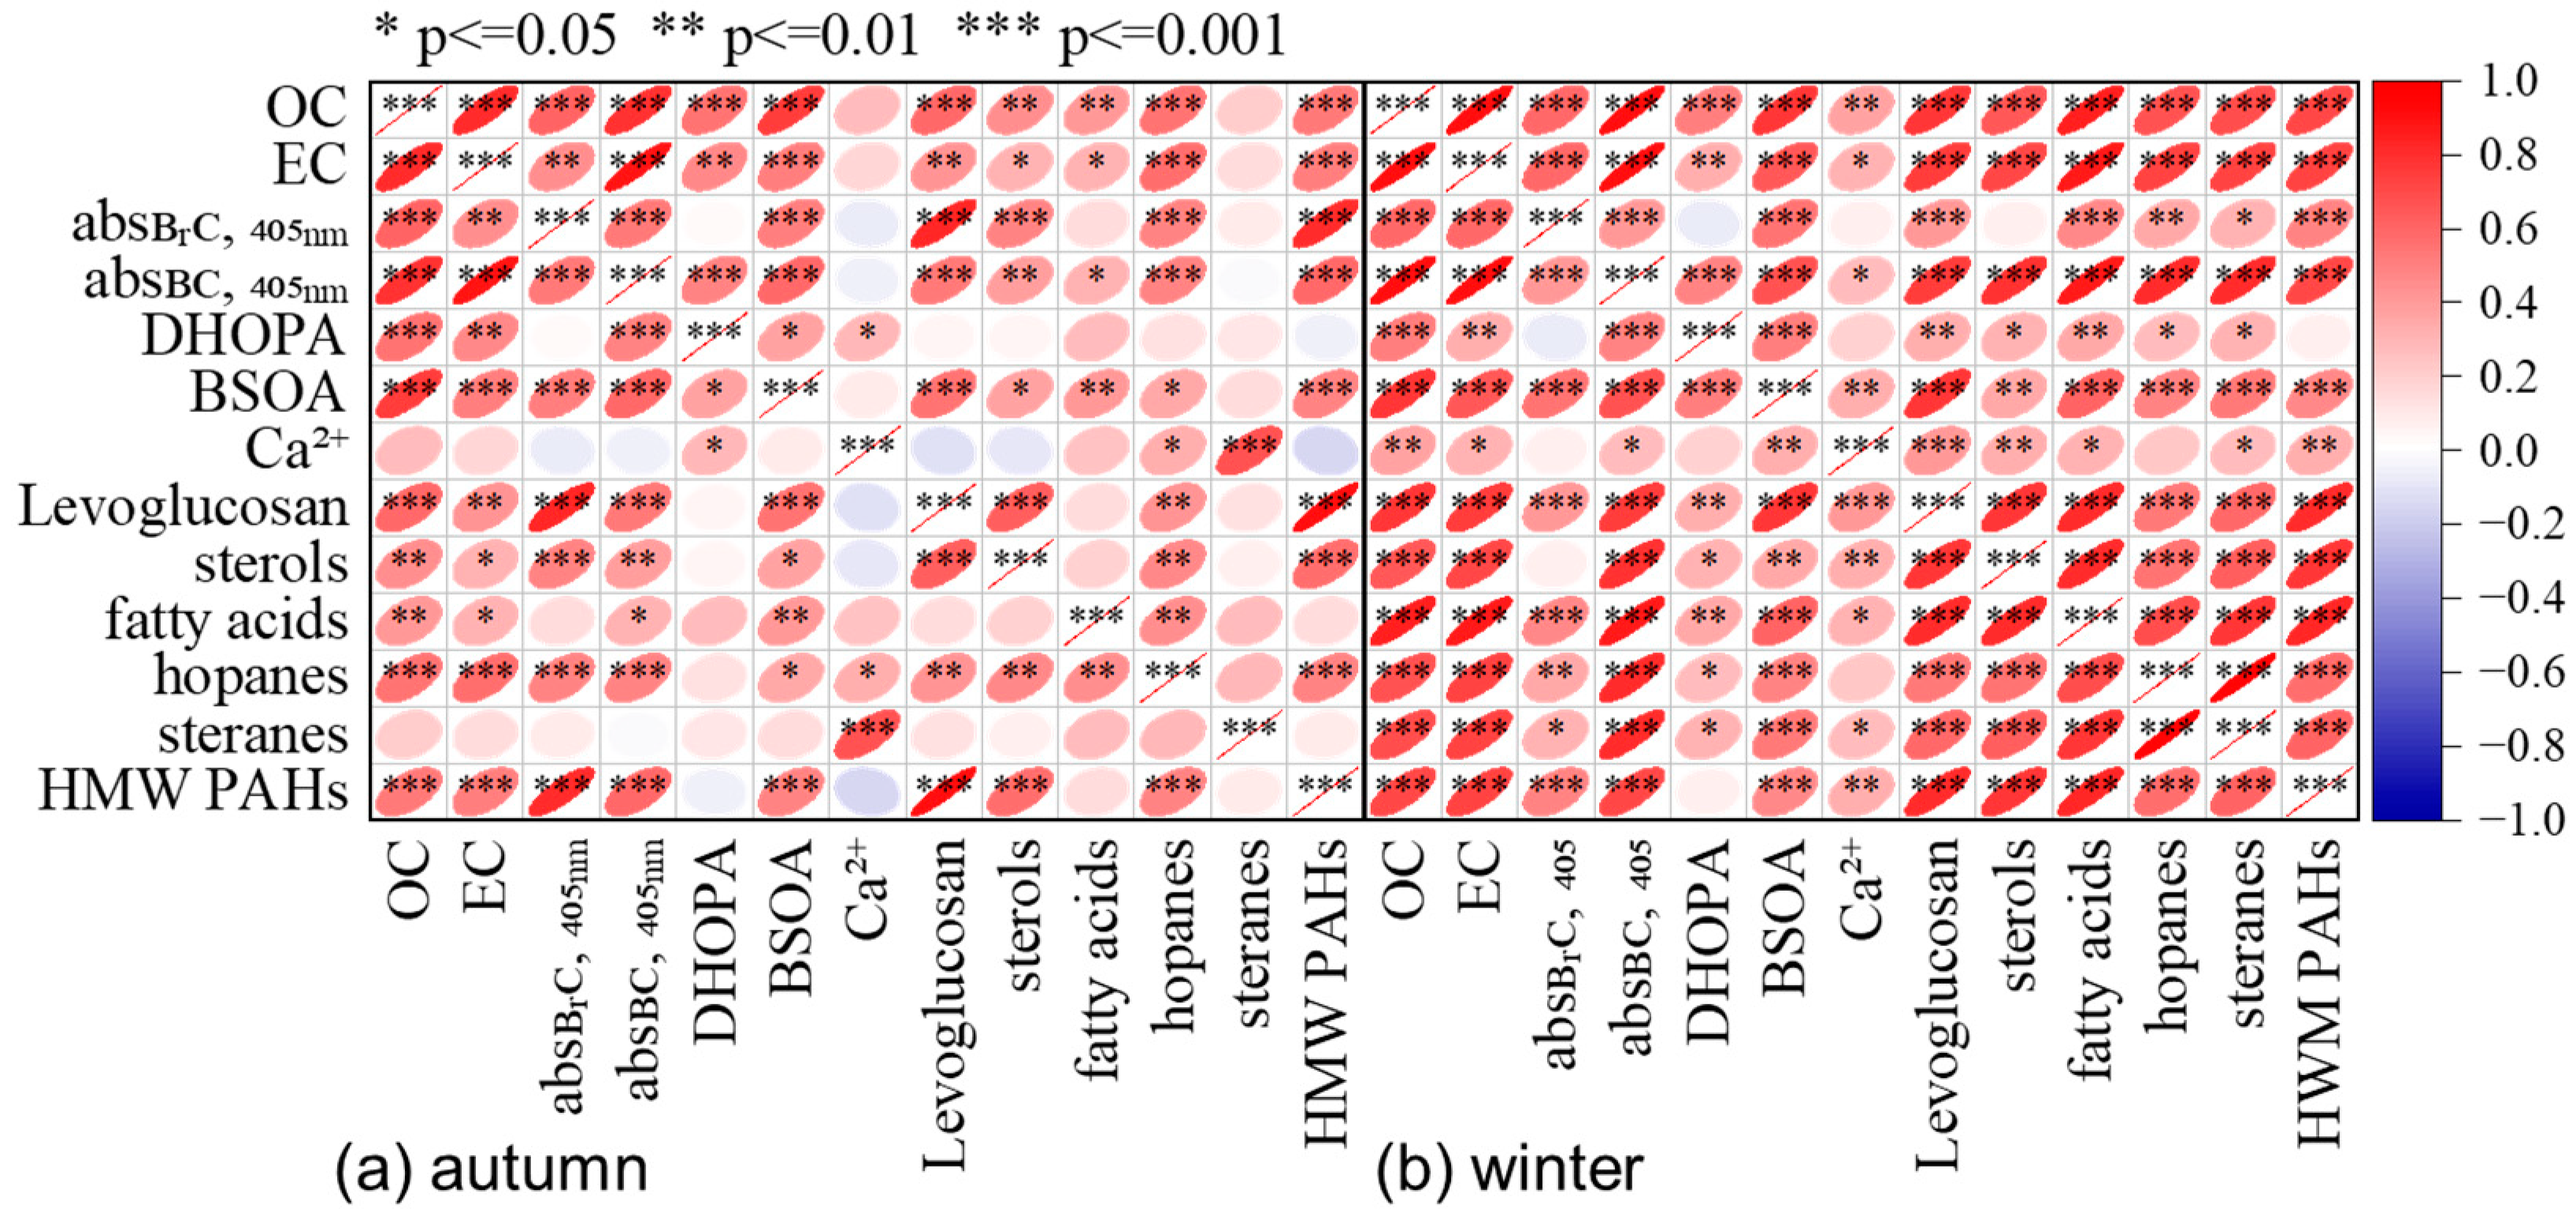
3.3. Sources of OC/EC and Light-Absorbing BC/BrC

Figure 6 demonstrates the correlation of OC, EC, babs,BrC,405, and babs,BC,405 with the typical source markers, with obviously different correlation patterns in autumn (Figure 6a) and winter (Figure 6b). Both in autumn and winter, Ca2+ had weak correlations with OC, EC, babs,BrC,405, and babs,BC,405, suggesting that their contributions by dust were insignificant since dust contributes more to coarse particles [89]. As shown in Figure 6a, EC correlated well with hopanes and HMW-PAHs in autumn, suggesting that EC may mainly originate from vehicle emissions and coal combustion. This was similar to the findings of Huang et al. (2022) in Guangzhou, where traffic emission was the largest source of EC, and coal combustion was the second [38]. Similarly, babs,BC,405 correlated well with HMW-PAHs and hopanes. OC correlated well with BSOA and DHOPA, indicating that OC was mainly contributed by SOAs generated from the oxidation of VOCs from biogenic and anthropogenic sources. This was consistent with higher percentages of estimated SOC in OC. Among the emission source markers, OC more strongly correlated with LG, hopanes, and HMW-PAHs than others, indicating a preference for biomass burning, vehicle emissions, and coal combustion emissions among all primary sources. Unlike OC, babs,BrC,405 correlated poorly with BSOA and DHOPA but had stronger correlations with LG and HMW-PAHs, with R of 0.83 and 0.81, respectively, suggesting that BrC was likely to be mainly from biomass burning and coal combustion. This implied that, although SOC highly contributed to OC, SOA contributed less to BrC in autumn due to their weak light-absorbing properties [20].
As shown in Figure 6b, EC was strongly correlated with fatty acids (R = 0.88), LG (R = 0.75), steranes (R = 0.74), hopanes (R = 0.72), and HMW-PAHs, indicating that EC might have contributions from cooking emissions, vehicle emissions, biomass burning, and coal combustion. Similarly, babs,BC,405 correlated very well with fatty acids (R = 0.88), hopanes (R = 0.81), steranes (R = 0.81), LG (R = 0.77), and HMW-PAHs (R = 0.73). OC correlated well with EC (R = 0.91) and BSOA (R = 0.78), indicating that OC mainly resulted from primary combustion emissions and BSOA. Among the emission source markers, OC was strongly correlated with fatty acids (R = 0.85), LG (R = 0.77), hopanes, steranes, and HMW-PAHs, indicating that OC may mainly originate from cooking, biomass burning, vehicle emissions, and coal combustion. To exclude the influence of the boundary layer, two correlation thermograms were drawn using daytime and nighttime data in winter (Figure S7), respectively. As shown in Figure S7b, babs,BrC,405 correlated weakly with all markers at night, indicating that there were fewer BrC emissions at night. Instead, babs,BrC,405 showed a high correlation with HMW-PAHs, fatty acids, BSOA, and LG during the daytime, indicating that light-absorbing BrC might be related to coal combustion, cooking, BSOA, and biomass burning in winter. BSOA might be light-absorbing since studies revealed that the SOA generated through the oxidation of α-pinene under high NOx conditions could absorb light [90]. As shown in Table S3, the average NOx concentration was twice as high in winter, while emissions of biogenic VOCs were reduced in winter [72]. Therefore, the BVOC/NOx ratio was lower in winter and the generated BSOA might have a higher light absorption capacity.

4. Conclusions

In this study, the mass concentrations and light-absorbing properties of EC and OC were investigated at various sampling sites in Guangzhou in winter 2020 and autumn 2021 using a DRI Model 2015 thermo-optical carbon analyzer. The results revealed that carbonaceous aerosols were important components of PM2.5, with mass percentage shares of ~30%, and SOC dominated in OC, with shares of ~70%. When compared to those observed in 2015, OC and EC concentrations were reduced by 25.4% and 73.4%, respectively, while the CA/PM2.5 ratio decreased by 10.7%, and the SOC/OC ratio increased by 24.8%. These results suggest that modulating SOAs is of great importance in further lowering the CA as well as PM2.5 in the region.
When compared to those in 2015, the MAC of TC at 405 nm decreased by ~31%, largely due to the significant decrease in the percentage of BC in CA and the deceased absorption of BrC. The weakened light absorption and light absorption capacity of CA are indicative of the co-benefits of air pollution in reducing climatic pollutants in recent years.
Except for the significantly higher daytime OC and SOC at the regional background site (HG) in autumn, daytime and nighttime EC and OC concentrations varied insignificantly in both autumn and winter due to the counter effects of stronger primary emission/secondary production during daytime and the lower boundary layer height during the nighttime. The babs,BC,405 showed no significant diurnal variations except for the XH site, while babs,BrC,405, and MACBrC,405 were significantly lower during daytime in autumn probably due to the photobleaching during daytime.
In autumn, EC and babs,BC,405 correlated well with hopanes and HMW-PAHs, indicating that EC and BC mainly originated from vehicle emissions and coal combustion. OC correlated well with BSOA, DHOPA, and LG, indicating that OC mainly resulted from biomass combustion and SOAs generated through the oxidation of anthropogenic or biogenic VOCs. The strong correlation of babs,BrC,405 with LG and HMW-PAHs suggested that BrC might be mainly from biomass burning and coal combustion. In winter, EC, OC, and babs,BC,405 were strongly correlated with fatty acids, LG, hopanes, and HMW PAHs, suggesting that EC and OC had complex mixing sources from vehicle emissions, biomass burning, coal combustion, and cooking emissions. babs,BrC,405 correlated well with HMW-PAHs, fatty acids, BSOA, and LG during the daytime, indicating that babs,BrC,405 were related to coal combustion, cooking, BSOA, and biomass burning. These results also suggest that controlling SOA precursors will be beneficial in reducing OC and the control of biomass burning and coal combustion emissions is more important for reducing BrC.

Supplementary Materials

The following supporting information can be downloaded at: https://www.mdpi.com/article/10.3390/atmos14101545/s1. Table S1 The species included in the markers for each source; Table S2 The nearest observation points for BLH of each station; Table S3 Summary of meteorological parameters including temperature (T), relatively humidity (RH), wind speed (WS) and boundary layer height (BLH) and atmospheric pressure (P), and PM2.5 and gaseous pollutants including SO2, NO2, O3, NO and NOx (NO + NO2); Figure S1 Results of independent samples t-test for day/night average value comparisons of OC, EC and SOC con-centrations, babs,BrC,405, babs,BC,405, MACBrC,405 and MACBC,635 at the four sites in autumn; Figure S2 Results of independent samples t-test for day/night average value comparisons of OC, EC and SOC con-centrations and babs,BrC,405, babs,BC,405, MACBrC,405 and MACBC,635 at the three sites in winter; Figure S3 Results of the independent samples Mann-Whitney U test for diurnal data of the corresponding variables for (a) HG and (b) JL in autumn; Figure S4 Results of the independent samples Mann-Whitney U test for the diurnal data of the corresponding vari-ables for XH, SZ and HKUST in winter; Figure S5 Results of the one-sided independent samples t-test or Mann-Whitney U test for the corresponding varia-bles of JL and HG in autumn; Figure S6 Pearson correlation coefficients of OC, EC, SOC concentrations, babs,BrC,405, and babs,BC,405 with source tracers including BSOA, Ca2+, levoglucosan, fatty acids (FA), hopanes, steranes, HMW-PAHs, sterols and DHOPA, and gaseous pollutants including SO2, NO2, O3, NO and NOx and meteorological parameters including temperature (T), relatively humidity (RH), wind speed (WS), atmospheric pressure (P) and boundary layer height (BLH); Figure S7 Pearson correlation coefficients between OC, EC, babs,BrC,405, babs,BC,405 and source marker using (a) daytime data and (b) nighttime data in winter, respectively; Figure S8. Day-to-day variation of PM2.5 carbonaceous aerosols concentration (μg/m3) and their light-absorbing properties (Mm−1), as well as meteorological factors during the observing period in autumn. Vector arrows indicate wind velocity and direction; Figure S9. Day-to-day variation of PM2.5 carbonaceous aerosols concentration (μg/m3) and their light-absorbing properties (Mm−1), as well as meteorological factors during the observing period in winter.

Author Contributions

Methodology, J.S. and R.Z.; validation, R.Z. and J.S.; formal analysis, J.S., R.Z., and B.L.; investigation, R.Z., J.S., B.L., M.T., S.X., X.W. (Xiaoyang Wang), and Q.Z.; data curation, J.S., R.Z. and W.S.; writing—original draft preparation, J.S.; writing—review and editing, X.W. (Xinming Wang), D.T. and R.Z.; visualization, J.S.; supervision, X.W. (Xinming Wang). All authors have read and agreed to the published version of the manuscript.

Funding

This study was funded by the Guangdong Foundation for the Program of Science and Technology Research (Grant No. 2020B1212060053/2023B1212060049) and the Guangzhou Municipal Science and Technology Bureau (Grant No. 202206010057).

Institutional Review Board Statement

Not applicable.

Informed Consent Statement

Not applicable.

Data Availability Statement

Data are available upon request from the corresponding author ([email protected]).

Conflicts of Interest

The authors declare no conflict of interest. The funders had no role in the design of the study; in the collection, analyses, or interpretation of data; in the writing of the manuscript; or in the decision to publish the results.

References

  1. Cohen, A.J.; Brauer, M.; Burnett, R.; Anderson, H.R.; Frostad, J.; Estep, K.; Balakrishnan, K.; Brunekreef, B.; Dandona, L.; Dandona, R.; et al. Estimates and 25-Year Trends of the Global Burden of Disease Attributable to Ambient Air Pollution: An Analysis of Data from the Global Burden of Diseases Study 2015. Lancet 2017, 389, 1907–1918. [Google Scholar] [CrossRef] [PubMed]
  2. Lim, H.J.; Turpin, B.J. Origins of Primary and Secondary Organic Aerosol in Atlanta: Results’ of Time-Resolved Measurements during the Atlanta Supersite Experiment. Environ. Sci. Technol. 2002, 36, 4489–4496. [Google Scholar] [CrossRef] [PubMed]
  3. Cao, J.J.; Lee, S.C.; Ho, K.F.; Zhang, X.Y.; Zou, S.C.; Fung, K.; Chow, J.C.; Watson, J.G. Characteristics of Carbonaceous Aerosol in Pearl River Delta Region, China during 2001 Winter Period. Atmos. Environ. 2003, 37, 1451–1460. [Google Scholar] [CrossRef]
  4. Cao, J.J.; Lee, S.C.; Ho, K.F.; Zou, S.C.; Fung, K.; Li, Y.; Watson, J.G.; Chow, J.C. Spatial and Seasonal Variations of Atmospheric Organic Carbon and Elemental Carbon in Pearl River Delta Region, China. Atmos. Environ. 2004, 38, 4447–4456. [Google Scholar] [CrossRef]
  5. Venkataraman, C.; Habib, G.; Eiguren-Fernandez, A.; Miguel, A.H.; Friedlander, S.K. Residential Biofuels in South Asia: Carbonaceous Aerosol Emissions and Climate Impacts. Science 2005, 307, 1454–1456. [Google Scholar] [CrossRef]
  6. Zheng, M.; Salmon, L.G.; Schauer, J.J.; Zeng, L.M.; Kiang, C.S.; Zhang, Y.H.; Cass, G.R. Seasonal Trends in PM2.5 Source Contributions in Beijing, China. Atmos. Environ. 2005, 39, 3967–3976. [Google Scholar] [CrossRef]
  7. Cao, J.J.; Lee, S.C.; Chow, J.C.; Watson, J.G.; Ho, K.F.; Zhang, R.J.; Jin, Z.D.; Shen, Z.X.; Chen, G.C.; Kang, Y.M.; et al. Spatial and Seasonal Distributions of Carbonaceous Aerosols over China. J. Geophys. Res. Atmos. 2007, 112, 1–9. [Google Scholar] [CrossRef]
  8. Wang, X.; Ding, X.; Fu, X.; He, Q.; Wang, S.; Bernard, F.; Zhao, X.; Wu, D. Aerosol Scattering Coefficients and Major Chemical Compositions of Fine Particles Observed at a Rural Site in the Central Pearl River Delta, South China. J. Environ. Sci. 2012, 24, 72–77. [Google Scholar] [CrossRef]
  9. Mordukhovich, I.; Wilker, E.; Suh, H.; Wright, R.; Sparrow, D.; Vokonas, P.S.; Schwartz, J. Black Carbon Exposure, Oxidative Stress Genes, and Blood Pressure in a Repeated-Measures Study. Environ. Health Perspect. 2009, 117, 1767–1772. [Google Scholar] [CrossRef]
  10. Hoek, G.; Krishnan, R.M.; Beelen, R.; Peters, A.; Ostro, B.; Brunekreef, B.; Kaufman, J.D. Long-Term Air Pollution Exposure and Cardio- Respiratory Mortality: A Review. Environ. Health 2013, 12, 43. [Google Scholar] [CrossRef]
  11. Olsson, A.C.; Fevotte, J.; Fletcher, T.; Cassidy, A.; Mannetje, A.; Zaridze, D.; Szeszenia-Dabrowska, N.; Rudnai, P.; Lissowska, J.; Fabianova, E. Occupational Exposure to Polycyclic Aromatic Hydrocarbons and Lung Cancer Risk: A Multicenter Study in Europe. Occup. Environ. Med. 2010, 67, 98–103. [Google Scholar] [CrossRef]
  12. Shang, Y.; Chen, C.; Li, Y.; Zhao, J.; Zhu, T. Hydroxyl Radical Generation Mechanism during the Redox Cycling Process of 1, 4-Naphthoquinone. Environ. Sci. Technol. 2012, 46, 2935–2942. [Google Scholar] [CrossRef] [PubMed]
  13. Gao, B.; Yu, J.Z.; Li, S.X.; Ding, X.; He, Q.F.; Wang, X.M. Roadside and Rooftop Measurements of Polycyclic Aromatic Hydrocarbons in PM2.5 in Urban Guangzhou: Evaluation of Vehicular and Regional Combustion Source Contributions. Atmos. Environ. 2011, 45, 7184–7191. [Google Scholar] [CrossRef]
  14. Gao, B.; Guo, H.; Wang, X.M.; Zhao, X.Y.; Ling, Z.H.; Zhang, Z.; Liu, T.Y. Tracer-Based Source Apportionment of Polycyclic Aromatic Hydrocarbons in PM2.5 in Guangzhou, Southern China, Using Positive Matrix Factorization (PMF). Environ. Sci. Pollut. Res. 2013, 20, 2398–2409. [Google Scholar] [CrossRef]
  15. IPCC. Climate Change 2021: The Physical Science Basis; Contribution of Working Group I to the Sixth Assessment Report of the Intergovernmental Panel on Climate Change; Masson-Delmotte, V., Zhai, P., Pirani, A., Connors, S.L., Péan, C., Berger, S., Caud, N., Chen, Y., Goldfarb, L., Gomis, M.I., et al., Eds.; Cambridge University Press: Cambridge, UK; New York, NY, USA, 2021; 2391p. [Google Scholar] [CrossRef]
  16. Andreae, M.O.; Gelencsér, A. Black Carbon or Brown Carbon? The Nature of Light-Absorbing Carbonaceous Aerosols. Atmos. Chem. Phys. 2006, 6, 3131–3148. [Google Scholar] [CrossRef]
  17. Lin, P.; Aiona, P.K.; Li, Y.; Shiraiwa, M.; Laskin, J.; Nizkorodov, S.A.; Laskin, A. Molecular Characterization of Brown Carbon in Biomass Burning Aerosol Particles. Environ. Sci. Technol. 2016, 50, 11815–11824. [Google Scholar] [CrossRef]
  18. Zhang, R.; Song, W.; Zhang, Y.; Wang, X.; Fu, X.; Li, S. Particulate Nitrated Aromatic Compounds from Corn Straw Burning: Compositions, Optical Properties and Potential Health Risks. Environ. Pollut. 2023, 323, 121332. [Google Scholar] [CrossRef]
  19. Feng, Y.; Ramanathan, V.; Kotamarthi, V.R. Brown Carbon: A Significant Atmospheric Absorber of Solar Radiation. Atmos. Chem. Phys. 2013, 13, 8607–8621. [Google Scholar] [CrossRef]
  20. Laskin, A.; Laskin, J.; Nizkorodov, S.A. Chemistry of Atmospheric Brown Carbon. Chem. Rev. 2015, 115, 4335–4382. [Google Scholar] [CrossRef]
  21. Xu, L.; Peng, Y.; Ram, K.; Zhang, Y.; Bao, M.; Wei, J. Investigation of the Uncertainties of Simulated Optical Properties of Brown Carbon at Two Asian Sites Using a Modified Bulk Aerosol Optical Scheme of the Community Atmospheric Model Version 5.3. J. Geophys. Res. Atmos. 2021, 126, e2020JD033942. [Google Scholar] [CrossRef]
  22. Ji, D.; Gao, M.; Maenhaut, W.; He, J.; Wu, C.; Cheng, L.; Gao, W.; Sun, Y.; Sun, J.; Xin, J.; et al. The Carbonaceous Aerosol Levels Still Remain a Challenge in the Beijing-Tianjin-Hebei Region of China: Insights from Continuous High Temporal Resolution Measurements in Multiple Cities. Environ. Int. 2019, 126, 171–183. [Google Scholar] [CrossRef] [PubMed]
  23. Yao, L.; Huo, J.; Wang, D.; Fu, Q.; Sun, W.; Li, Q.; Chen, J. Online Measurement of Carbonaceous Aerosols in Suburban Shanghai during Winter over a Three-Year Period: Temporal Variations, Meteorological Effects, and Sources. Atmos. Environ. 2020, 226, 117408. [Google Scholar] [CrossRef]
  24. Lu, M.; Zheng, J.; Huang, Z.; Wu, C.; Zheng, C.; Jia, G.; Zhang, L.; Jiang, F.; Li, Z.; Liu, J.; et al. Insight into the Characteristics of Carbonaceous Aerosols at Urban and Regional Sites in the Downwind Area of Pearl River Delta Region, China. Sci. Total Environ. 2021, 778, 146251. [Google Scholar] [CrossRef] [PubMed]
  25. Chen, Y.; Xie, S.; Luo, B.; Zhai, C. Characteristics and Origins of Carbonaceous Aerosol in the Sichuan Basin, China. Atmos. Environ. 2014, 94, 215–223. [Google Scholar] [CrossRef]
  26. Zhan, C.; Zhang, J.; Zheng, J.; Yao, R.; Wang, P.; Liu, H.; Xiao, W.; Liu, X.; Cao, J. Characterization of Carbonaceous Fractions in PM2.5 and PM10 over a Typical Industrial City in Central China. Environ. Sci. Pollut. Res. 2019, 26, 16855–16867. [Google Scholar] [CrossRef]
  27. Srivastava, P.; Naja, M. Characteristics of Carbonaceous Aerosols Derived from Long-Term High-Resolution Measurements at a High-Altitude Site in the Central Himalayas: Radiative Forcing Estimates and Role of Meteorology and Biomass Burning. Environ. Sci. Pollut. Res. 2021, 28, 14654–14670. [Google Scholar] [CrossRef]
  28. Li, J.; Zhang, Q.; Wang, G.; Li, J.; Wu, C.; Liu, L.; Wang, J.; Jiang, W.; Li, L.; Fai Ho, K.; et al. Optical Properties and Molecular Compositions of Water-Soluble and Water-Insoluble Brown Carbon (BrC) Aerosols in Northwest China. Atmos. Chem. Phys. 2020, 20, 4889–4904. [Google Scholar] [CrossRef]
  29. Bond, T.C.; Bergstrom, R.W. Light Absorption by Carbonaceous Particles: An Investigative Review. Aerosol Sci. Technol. 2006, 40, 27–67. [Google Scholar] [CrossRef]
  30. Bond, T.C.; Doherty, S.J.; Fahey, D.W.; Forster, P.M.; Berntsen, T.; Deangelo, B.J.; Flanner, M.G.; Ghan, S.; Kärcher, B.; Koch, D.; et al. Bounding the Role of Black Carbon in the Climate System: A Scientific Assessment. J. Geophys. Res. Atmos. 2013, 118, 5380–5552. [Google Scholar] [CrossRef]
  31. Becerril-Valle, M.; Coz, E.; Prévôt, A.S.H.; Močnik, G.; Pandis, S.N.; Sánchez de la Campa, A.M.; Alastuey, A.; Díaz, E.; Pérez, R.M.; Artíñano, B. Characterization of Atmospheric Black Carbon and Co-Pollutants in Urban and Rural Areas of Spain. Atmos. Environ. 2017, 169, 36–53. [Google Scholar] [CrossRef]
  32. Khan, B.; Hays, M.D.; Geron, C.; Jetter, J. Differences in the OC/EC Ratios That Characterize Ambient and Source Aerosols Due to Thermal-Optical Analysis. Aerosol Sci. Technol. 2012, 46, 127–137. [Google Scholar] [CrossRef]
  33. Spracklen, D.V.; Jimenez, J.L.; Carslaw, K.S.; Worsnop, D.R.; Evans, M.J.; Mann, G.W.; Zhang, Q.; Canagaratna, M.R.; Allan, J.; Coe, H.; et al. Aerosol Mass Spectrometer Constraint on the Global Secondary Organic Aerosol Budget. Atmos. Chem. Phys. 2011, 11, 12109–12136. [Google Scholar] [CrossRef]
  34. Hodzic, A.; Kasibhatla, P.S.; Jo, D.S.; Cappa, C.D.; Jimenez, J.L.; Madronich, S.; Park, R.J. Rethinking the Global Secondary Organic Aerosol (SOA) Budget: Stronger Production, Faster Removal, Shorter Lifetime. Atmos. Chem. Phys. 2016, 16, 7917–7941. [Google Scholar] [CrossRef]
  35. Wu, C.; Wang, G.; Li, J.; Li, J.; Cao, C.; Ge, S.; Xie, Y.; Chen, J.; Li, X.; Xue, G.; et al. The Characteristics of Atmospheric Brown Carbon in Xi’an, Inland China: Sources, Size Distributions and Optical Properties. Atmos. Chem. Phys. 2020, 20, 2017–2030. [Google Scholar] [CrossRef]
  36. Liu, J.; Mo, Y.; Ding, P.; Li, J.; Shen, C.; Zhang, G. Dual Carbon Isotopes (14C and 13C) and Optical Properties of WSOC and HULIS-C during Winter in Guangzhou, China. Sci. Total Environ. 2018, 633, 1571–1578. [Google Scholar] [CrossRef] [PubMed]
  37. Zhang, Y.L.; Huang, R.J.; El Haddad, I.; Ho, K.F.; Cao, J.J.; Han, Y.; Zotter, P.; Bozzetti, C.; Daellenbach, K.R.; Canonaco, F.; et al. Fossil vs. Non-Fossil Sources of Fine Carbonaceous Aerosols in Four Chinese Cities during the Extreme Winter Haze Episode of 2013. Atmos. Chem. Phys. 2015, 15, 1299–1312. [Google Scholar] [CrossRef]
  38. Huang, J.; Zhang, Z.; Tao, J.; Zhang, L.; Nie, F.; Fei, L. Source Apportionment of Carbonaceous Aerosols Using Hourly Data and Implications for Reducing PM2.5 in the Pearl River Delta Region of South China. Environ. Res. 2022, 210, 112960. [Google Scholar] [CrossRef]
  39. Xu, T.; Zhang, C.; Liu, C.; Hu, Q. Variability of PM2.5 and O3 Concentrations and Their Driving Forces over Chinese Megacities during 2018–2020. J. Environ. Sci. 2023, 124, 1–10. [Google Scholar] [CrossRef]
  40. World Health Organization. WHO Global Air Quality Guidelines: Particulate Matter (PM2.5 and PM10), Ozone, Nitrogen Dioxide, Sulfur Dioxide and Carbon Monoxide: Executive Summary; World Health Organization: Geneva, Switzerland, 2021. [Google Scholar]
  41. Guangdong Provincial Bureau of Statistics, People’s Republic of China. Guangdong Province Statistical Yearbook 2022; China Statistics Publishing House: Guangdong, China, 2022. [Google Scholar]
  42. Yu, X.; Yu, Q.; Zhu, M.; Tang, M.; Li, S.; Yang, W.; Zhang, Y.; Deng, W.; Li, G.; Yu, Y.; et al. Water Soluble Organic Nitrogen (WSON) in Ambient Fine Particles over a Megacity in South China: Spatiotemporal Variations and Source Apportionment. J. Geophys. Res. Atmos. 2017, 122, 13045–13060. [Google Scholar] [CrossRef]
  43. Li, S.; Zhu, M.; Yang, W.; Tang, M.; Huang, X.; Yu, Y.; Fang, H.; Yu, X.; Yu, Q.; Fu, X.; et al. Filter-Based Measurement of Light Absorption by Brown Carbon in PM2.5 in a Megacity in South China. Sci. Total Environ. 2018, 633, 1360–1369. [Google Scholar] [CrossRef]
  44. Chow, J.C.; Watson, J.G.; Robles, J.; Wang, X.; Chen, L.-W.A.; Trimble, D.L.; Kohl, S.D.; Tropp, R.J.; Fung, K.K. Quality Assurance and Quality Control for Thermal/Optical Analysis of Aerosol Samples for Organic and Elemental Carbon. Anal. Bioanal. Chem. 2011, 401, 3141–3152. [Google Scholar] [CrossRef] [PubMed]
  45. Chow, J.C.; Watson, J.G.; Chen, L.-W.A.; Chang, M.C.O.; Robinson, N.F.; Trimble, D.; Kohl, S. The IMPROVE_A Temperature Protocol for Thermal/Optical Carbon Analysis: Maintaining Consistency with a Long-Term Database. J. Air Waste Manag. Assoc. 2007, 57, 1014–1023. [Google Scholar] [CrossRef] [PubMed]
  46. Turpin, B.J.; Huntzicker, J.J. Identification of Secondary Organic Aerosol Episodes and Quantitation of Primary and Secondary Organic Aerosol Concentrations during SCAQS. Atmos. Environ. 1995, 29, 3527–3544. [Google Scholar] [CrossRef]
  47. Chen, C.; Zhang, H.; Li, H.; Wu, N.; Zhang, Q. Chemical Characteristics and Source Apportionment of Ambient PM1.0 and PM2.5 in a Polluted City in North China Plain. Atmos. Environ. 2020, 242, 117867. [Google Scholar] [CrossRef]
  48. Khan, J.Z.; Sun, L.; Tian, Y.; Shi, G.; Feng, Y. Chemical Characterization and Source Apportionment of PM1 and PM2.5 in Tianjin, China: Impacts of Biomass Burning and Primary Biogenic Sources. J. Environ. Sci. 2021, 99, 196–209. [Google Scholar] [CrossRef]
  49. Wu, C.; Wu, D.; Yu, J.Z. Estimation and Uncertainty Analysis of Secondary Organic Carbon Using 1 Year of Hourly Organic and Elemental Carbon Data. J. Geophys. Res. Atmos. 2019, 124, 2774–2795. [Google Scholar] [CrossRef]
  50. Yu, Q.; Gao, B.; Li, G.; Zhang, Y.; He, Q.; Deng, W.; Huang, Z.; Ding, X.; Hu, Q.; Huang, Z.; et al. Attributing Risk Burden of PM2.5-Bound Polycyclic Aromatic Hydrocarbons to Major Emission Sources: Case Study in Guangzhou, South China. Atmos. Environ. 2016, 142, 313–323. [Google Scholar] [CrossRef]
  51. Fu, X.; Guo, H.; Wang, X.; Ding, X.; He, Q.; Liu, T.; Zhang, Z. PM2.5 Acidity at a Background Site in the Pearl River Delta Region in Fall-Winter of 2007–2012. J. Hazard. Mater. 2015, 286, 484–492. [Google Scholar] [CrossRef]
  52. Oros, D.R.; Simoneit, B.R.T. Identification and Emission Rates of Molecular Tracers in Coal Smoke Particulate Matter. Fuel 2000, 79, 515–536. [Google Scholar] [CrossRef]
  53. Huang, K.; Zhuang, G.; Lin, Y.; Wang, Q.; Fu, J.S.; Fu, Q.; Liu, T.; Deng, C. How to Improve the Air Quality over Megacities in China: Pollution Characterization and Source Analysis in Shanghai before, during, and after the 2010 World Expo. Atmos. Chem. Phys. 2013, 13, 5927–5942. [Google Scholar] [CrossRef]
  54. Yuanjian, L.; Aihua, W.; Mengxue, T.; Shengji, L.; Ji, L. Review of Screening and Applications of Organic Tracers in Fine Particulate Matter. Environ. Sci. 2021, 42, 1013–1022. [Google Scholar]
  55. Al-Naiema, I.M.; Stone, E.A. Evaluation of Anthropogenic Secondary Organic Aerosol Tracersfrom Aromatic Hydrocarbons. Atmos. Chem. Phys. 2017, 17, 2053–2065. [Google Scholar] [CrossRef]
  56. Scott, C.E.; Rap, A.; Spracklen, D.V.; Forster, P.M.; Carslaw, K.S.; Mann, G.W.; Pringle, K.J.; Kivekäs, N.; Kulmala, M.; Lihavainen, H.; et al. The Direct and Indirect Radiative Effects of Biogenic Secondary Organic Aerosol. Atmos. Chem. Phys. 2014, 14, 447–470. [Google Scholar] [CrossRef]
  57. Rogge, W.F.; Hildemann, L.M.; Mazurek, M.A.; Cass, G.R. Sources of Fine Organic Aerosol. 1. Charbroilers and Meat Cooking Operations. Environ. Sci. Technol. 1991, 25, 1112–1125. [Google Scholar] [CrossRef]
  58. Bhattarai, H.; Saikawa, E.; Wan, X.; Zhu, H.; Ram, K.; Gao, S.; Kang, S.; Zhang, Q.; Zhang, Y.; Wu, G. Levoglucosan as a Tracer of Biomass Burning: Recent Progress and Perspectives. Atmos. Res. 2019, 220, 20–33. [Google Scholar] [CrossRef]
  59. Simoneit, B.R.T.; Schauer, J.J.; Nolte, C.G.; Oros, D.R.; Elias, V.O.; Fraser, M.P.; Rogge, W.F.; Cass, G.R. Levoglucosan, a Tracer for Cellulose in Biomass Burning and Atmospheric Particles. Atmos. Environ. 1999, 33, 173–182. [Google Scholar] [CrossRef]
  60. Yang, M.; Howell, S.G.; Zhuang, J.; Huebert, B.J. Attribution of Aerosol Light Absorption to Black Carbon, Brown Carbon, and Dust in China—Interpretations of Atmospheric Measurements during EAST-AIRE. Atmos. Chem. Phys. 2009, 9, 2035–2050. [Google Scholar] [CrossRef]
  61. Yan, C.-Q.; Zheng, M.; Zhang, Y.-H. Research Progress and Direction of Atmospheric Brown Carbon. Huan Jing ke Xue Huanjing Kexue 2014, 35, 4404–4414. [Google Scholar]
  62. Chen, L.A.; Chow, J.C.; Wang, X.L.; Robles, J.A.; Sumlin, B.J.; Lowenthal, D.H.; Zimmermann, R. Multi-Wavelength Optical Measurement to Enhance Thermal / Optical Analysis for Carbonaceous Aerosol. Atmos. Meas. Tech. 2015, 8, 451–461. [Google Scholar] [CrossRef]
  63. Huang, X.F.; Yun, H.; Gong, Z.H.; Li, X.; He, L.Y.; Zhang, Y.H.; Hu, M. Source Apportionment and Secondary Organic Aerosol Estimation of PM2.5 in an Urban Atmosphere in China. Sci. China Earth Sci. 2014, 57, 1352–1362. [Google Scholar] [CrossRef]
  64. Cai, J.; Yang, J.; Chen, Y.; Zhang, W.; Cheng, M.; Sun, J. Origin, Properties, Measurement and Emission Estimation of Brown Carbon Aerosols. Res. Environ. Sci. 2015, 28, 1797–1814. [Google Scholar]
  65. Collaud Coen, M.; Weingartner, E.; Apituley, A.; Ceburnis, D.; Fierz-Schmidhauser, R.; Flentje, H.; Henzing, J.S.; Jennings, S.G.; Moerman, M.; Petzold, A.; et al. Minimizing Light Absorption Measurement Artifacts of the Aethalometer: Evaluation of Five Correction Algorithms. Atmos. Meas. Tech. 2010, 3, 457–474. [Google Scholar] [CrossRef]
  66. Lack, D.A.; Langridge, J.M. On the Attribution of Black and Brown Carbon Light Absorption Using the Ångström Exponent. Atmos. Chem. Phys. 2013, 13, 10535–10543. [Google Scholar] [CrossRef]
  67. Xing, L.; Fu, T.-M.; Cao, J.J.; Lee, S.C.; Wang, G.H.; Ho, K.F.; Cheng, M.-C.; You, C.-F.; Wang, T.J. Seasonal and Spatial Variability of the OM/OC Mass Ratios and High Regional Correlation between Oxalic Acid and Zinc in Chinese Urban Organic Aerosols. Atmos. Chem. Phys. 2013, 13, 4307–4318. [Google Scholar] [CrossRef]
  68. Andreae, M.O.; Schmid, O.; Yang, H.; Chand, D.; Yu, J.Z.; Zeng, L.-M.; Zhang, Y.-H. Optical Properties and Chemical Composition of the Atmospheric Aerosol in Urban Guangzhou, China. Atmos. Environ. 2008, 42, 6335–6350. [Google Scholar] [CrossRef]
  69. Chow, J.C.; Watson, J.G.; Lu, Z.; Lowenthal, D.H.; Frazier, C.A.; Solomon, P.A.; Thuillier, R.H.; Magliano, K. Descriptive Analysis of PM2.5 and PM10 at Regionally Representative Locations during SJVAQS/AUSPEX. Atmos. Environ. 1996, 30, 2079–2112. [Google Scholar] [CrossRef]
  70. Li, B.; Zhang, J.; Zhao, Y.; Yuan, S.; Zhao, Q.; Shen, G.; Wu, H. Seasonal Variation of Urban Carbonaceous Aerosols in a Typical City Nanjing in Yangtze River Delta, China. Atmos. Environ. 2015, 106, 223–231. [Google Scholar] [CrossRef]
  71. Ren, Y.Q.; Wei, J.; Ji, Y.Y.; Wu, Z.H.; Bi, F.; Gao, R.; Wang, X.Z.; Li, H. Chemical Composition of Fine Organic Aerosols during a Moderate Pollution Event in Summertime in Beijing: Combined Effect of Primary Emission and Secondary Formation. Atmos. Environ. 2021, 246, 118167. [Google Scholar] [CrossRef]
  72. Gao, C.; Zhang, X.L.; Xiu, A.J.; Huang, L.; Zhao, H.M.; Wang, K.; Tong, Q.Q. Spatiotemporal Distribution of Biogenic Volatile Organic Compounds Emissions in China. Acta Sci. Circumstantiae 2019, 39, 4140–4151. [Google Scholar]
  73. Shrestha, A.K.; Thapa, A.; Gautam, H. Solar Radiation, Air Temperature, Relative Humidity, and Dew Point Study: Damak, Jhapa, Nepal. Int. J. Photoenergy 2019, 2019, 8369231. [Google Scholar] [CrossRef]
  74. Wang, Q.; He, X.; Huang, X.H.H.; Griffith, S.M.; Feng, Y.; Zhang, T.; Zhang, Q.; Wu, D.; Yu, J.Z. Impact of Secondary Organic Aerosol Tracers on Tracer-Based Source Apportionment of Organic Carbon and PM2.5: A Case Study in the Pearl River Delta, China. ACS Earth Sp. Chem. 2017, 1, 562–571. [Google Scholar] [CrossRef]
  75. Yuan, Q.; Lai, S.; Song, J.; Ding, X.; Zheng, L.; Wang, X.; Zhao, Y.; Zheng, J.; Yue, D.; Zhong, L. Seasonal Cycles of Secondary Organic Aerosol Tracers in Rural Guangzhou, Southern China: The Importance of Atmospheric Oxidants. Environ. Pollut. 2018, 240, 884–893. [Google Scholar] [CrossRef]
  76. Wu, Y.; Gu, F.; Ji, Y.; Ma, S.; Guo, J. Electric Vehicle Adoption and Local PM2.5 Reduction: Evidence from China. J. Clean. Prod. 2023, 396, 136508. [Google Scholar] [CrossRef]
  77. Ke, W.; Zhang, S.; Wu, Y.; Zhao, B.; Wang, S.; Hao, J. Assessing the Future Vehicle Fleet Electrification: The Impacts on Regional and Urban Air Quality. Environ. Sci. Technol. 2017, 51, 1007–1016. [Google Scholar] [CrossRef] [PubMed]
  78. Pei, C.; Yang, W.; Zhang, Y.; Song, W.; Xiao, S.; Wang, J.; Zhang, J.; Zhang, T.; Chen, D.; Wang, Y.; et al. Decrease in Ambient Volatile Organic Compounds during the COVID-19 Lockdown Period in the Pearl River Delta Region, South China. Sci. Total Environ. 2022, 823, 153720. [Google Scholar] [CrossRef] [PubMed]
  79. Wang, Q.; Wang, L.; Tao, M.; Chen, N.; Lei, Y.; Sun, Y.; Xin, J.; Li, T.; Zhou, J.; Liu, J.; et al. Exploring the Variation of Black and Brown Carbon during COVID-19 Lockdown in Megacity Wuhan and Its Surrounding Cities, China. Sci. Total Environ. 2021, 791, 1–9. [Google Scholar] [CrossRef]
  80. Deng, J.; Ma, H.; Wang, X.; Zhong, S.; Zhang, Z.; Zhu, J.; Fan, Y. Measurement Report: Optical Properties and Sources of Water-Soluble Brown Carbon in Tianjin, North China—Insights from Organic Molecular Compositions. Atmos. Chem. Phys. 2022, 22, 6449–6470. [Google Scholar] [CrossRef]
  81. Peng, C.; Yang, F.; Tian, M.; Shi, G.; Li, L.; Huang, R.J.; Yao, X.; Luo, B.; Zhai, C.; Chen, Y. Brown Carbon Aerosol in Two Megacities in the Sichuan Basin of Southwestern China: Light Absorption Properties and Implications. Sci. Total Environ. 2020, 719. [Google Scholar] [CrossRef]
  82. Peng, C.; Tian, M.; Wang, X.; Yang, F.; Shi, G.; Huang, R.J.; Yao, X.; Wang, Q.; Zhai, C.; Zhang, S.; et al. Light Absorption of Brown Carbon in PM2.5 in the Three Gorges Reservoir Region, Southwestern China: Implications of Biomass Burning and Secondary Formation. Atmos. Environ. 2020, 229, 117409. [Google Scholar] [CrossRef]
  83. Choudhary, V.; Singh, G.K.; Gupta, T.; Paul, D. Absorption and Radiative Characteristics of Brown Carbon Aerosols during Crop Residue Burning in the Source Region of Indo-Gangetic Plain. Atmos. Res. 2021, 249, 105285. [Google Scholar] [CrossRef]
  84. Li, X.; Zhao, Q.; Yang, Y.; Zhao, Z.; Liu, Z.; Wen, T.; Hu, B.; Wang, Y.; Wang, L.; Wang, G. Composition and Sources of Brown Carbon Aerosols in Megacity Beijing during the Winter of 2016. Atmos. Res. 2021, 262, 105773. [Google Scholar] [CrossRef]
  85. Kaskaoutis, D.G.; Grivas, G.; Stavroulas, I.; Bougiatioti, A.; Liakakou, E.; Dumka, U.C.; Gerasopoulos, E.; Mihalopoulos, N. Apportionment of Black and Brown Carbon Spectral Absorption Sources in the Urban Environment of Athens, Greece, during Winter. Sci. Total Environ. 2021, 801, 149739. [Google Scholar] [CrossRef] [PubMed]
  86. Zhao, R.; Lee, A.K.Y.; Huang, L.; Li, X.; Yang, F.; Abbatt, J.P.D. Photochemical Processing of Aqueous Atmospheric Brown Carbon. Atmos. Chem. Phys. 2015, 15, 6087–6100. [Google Scholar] [CrossRef]
  87. Zeng, Y.; Shen, Z.; Takahama, S.; Zhang, L.; Zhang, T.; Lei, Y.; Zhang, Q.; Xu, H.; Ning, Y.; Huang, Y.; et al. Molecular Absorption and Evolution Mechanisms of PM2.5 Brown Carbon Revealed by Electrospray Ionization Fourier Transform–Ion Cyclotron Resonance Mass Spectrometry during a Severe Winter Pollution Episode in Xi’an, China. Geophys. Res. Lett. 2020, 47, e2020GL087977. [Google Scholar] [CrossRef]
  88. Sumlin, B.; Fortner, E.; Lambe, A.; Shetty, N.J.; Daube, C.; Liu, P.; Majluf, F.; Herndon, S.; Chakrabarty, R.K. Diel Cycle Impacts on the Chemical and Light Absorption Properties of Organic Carbon Aerosol from Wildfires in the Western United States. Atmos. Chem. Phys. 2021, 21, 11843–11856. [Google Scholar] [CrossRef]
  89. Oroumiyeh, F.; Jerrett, M.; Del Rosario, I.; Lipsitt, J.; Liu, J.; Paulson, S.E.; Ritz, B.; Schauer, J.J.; Shafer, M.M.; Shen, J. Elemental Composition of Fine and Coarse Particles across the Greater Los Angeles Area: Spatial Variation and Contributing Sources. Environ. Pollut. 2022, 292, 118356. [Google Scholar] [CrossRef]
  90. Liu, J.; Lin, P.; Laskin, A.; Laskin, J.; Kathmann, S.M.; Wise, M.; Caylor, R.; Imholt, F.; Selimovic, V.; Shilling, J.E. Optical Properties and Aging of Light-Absorbing Secondary Organic Aerosol. Atmos. Chem. Phys. 2016, 16, 12815–12827. [Google Scholar] [CrossRef]
Figure 1. Locations of the six sampling sites in Guangzhou.
Atmosphere 14 01545 g001
Figure 2. EC (a) and OC (b) concentrations at the three sites: aut and win indicate autumn and winter, respectively; D and N indicate daytime and nighttime, respectively; the number above the box is the number of samples. IQR indicates interquartile range.
Atmosphere 14 01545 g002
Figure 3. SOC concentrations at the three sites.
Atmosphere 14 01545 g003
Figure 4. Comparison of babs,BC,405 (a) and babs,BrC,405 (b) at the sampling sites.
Atmosphere 14 01545 g004
Figure 5. MAC of BC (a) and BrC (b) observed at the sampling sites.
Atmosphere 14 01545 g005
Figure 6. Pearson correlation coefficients between OC, EC, babs,BrC,405, babs,BC,405, and source marker in (a) autumn and (b) winter.
Atmosphere 14 01545 g006
Table 1. Summary of the percentage of TC and CA in PM2.5 and the radio of OC/EC and SOC/OC in autumn and winter.
SeasonTC/PM2.5 (%)CA/PM2.5 (%)OC/ECSOC/OC (%)
autumn15.1 ± 3.725.8 ± 6.57.5 ± 2.173.7 ± 7.3
winter17.5 ± 7.229.6 ± 11.96.6 ± 2.068.4 ± 13.1
Table 2. Daytime and nighttime boundary layer heights (BLHs) and concentrations of source tracers, namely levoglucosan (LG), hopanes, higher-molecular-weight polycyclic aromatic hydrocarbons (HMW-PAHs), sterols, biogenic secondary organic aerosols (BSOAs), and 2,3-dihydroxy-4-oxopentanoic acid (DHOPA), in autumn and winter. * Daytime/nighttime; ** nighttime concentration subtracted by daytime concentration; *** nighttime concentration/daytime concentration.
BLH or TracersSeasonAutumn (Mean ± 95% C.I.)Winter (Mean ± 95% C.I.)
Sample SiteXHJLSZHGXHSZHKUST
BLH
(m)
daytime 616 ± 20612 ± 25644 ± 24647 ± 32644 ± 98633 ± 104541 ± 77
nighttime81 ± 39110 ± 57109 ± 43182 ± 78373 ± 173372 ± 154271 ± 142
Ratio *7.6 5.6 5.9 3.6 1.7 1.7 2.0
LG
(ng/m3)
daytime 15.2 ± 5.563.0 ± 94.617.8 ± 5.517.0 ± 11.531.0 ± 11.237.7 ± 9.923.0 ± 9.3
nighttime43.2 ± 15.3164 ± 17431.4 ± 13.216.2 ± 11.043.9 ± 21.550.0 ± 20.631.4 ± 12.8
ΔLG **27.9 101 13.6 −0.8 12.9 12.3 8.3
Ratio ***2.8 2.6 1.8 1.0 1.4 1.3 1.4
Hopanes
(ng/m3)
daytime 0.4 ± 0.10.7 ± 0.20.8 ± 0.10.5 ± 0.20.5 ± 0.10.6 ± 0.10.6 ± 0.2
nighttime0.6 ± 0.10.8 ± 0.20.9 ± 0.20.5 ± 0.20.6 ± 0.20.8 ± 0.31.1 ± 0.6
Δhopanes **0.2 0.1 0.1 −0.1 0.2 0.2 0.5
Ratio *1.6 1.1 1.2 0.8 1.4 1.3 1.8
HMW-PAHs
(ng/m3)
daytime 0.3 ± 0.10.6 ± 0.50.4 ± 0.20.3 ± 0.10.8 ± 0.31.0 ± 0.20.8 ± 0.4
nighttime0.7 ± 0.31.6 ± 1.10.5 ± 0.20.5 ± 0.41.6 ± 1.31.5 ± 0.61.3 ± 0.6
ΔHMWPAHs **0.4 0.9 0.1 0.2 0.8 0.5 0.5
Ratio *2.7 2.5 1.3 1.6 2.0 1.5 1.6
Sterols
(ng/m3)
daytime 4.6 ± 1.912.0 ± 17.46.3 ± 6.02.8 ± 2.43.1 ± 1.42.5 ± 0.81.1 ± 0.4
nighttime10.5 ± 16.115.1 ± 18.09.8 ± 10.21.7 ± 1.06.2 ± 5.910.1 ± 8.02.8 ± 2.3
Δsterols **5.9 3.1 3.5 −1.1 3.1 7.7 1.7
Ratio *2.3 1.3 1.6 0.6 2.0 4.1 2.5
BSOA
(ng/m3)
daytime 122 ± 78245 ± 98149 ± 92101 ± 9312.0 ± 4.718.3 ± 6.013.8 ± 6.0
nighttime135 ± 80216 ± 145137 ± 8588 ± 8412.8 ± 5.915.8 ± 5.313.7 ± 4.4
ΔBSOA **13.1 −29.4 −12.2 −13.4 0.7 −2.5 −0.1
Ratio *1.1 0.9 0.9 0.9 1.1 0.9 1.0
DHOPA
(ng/m3)
daytime 4.9 ± 3.510.7 ± 9.27.0 ± 4.55.9 ± 4.90.3 ± 0.41.1 ± 1.00.2 ± 0.1
nighttime2.0 ± 1.35.3 ± 3.03.1 ± 2.42.2 ± 1.90.2 ± 0.10.6 ± 0.80.2 ± 0.1
ΔDHOPA **−2.9 −5.4 −3.9 −3.7 −0.2 −0.5 0.0
Ratio *0.4 0.5 0.4 0.4 0.5 0.6 1.0
Table 3. Average concentrations of PM2.5 and carbonaceous aerosols and average MAC of TC, OC, and EC during the field campaign in autumn 2021 in comparison to those during the field campaign in autumn 2015. Values are reported as average (Ave) ± standard deviation (Std). CA = EC + OM = EC + 1.8 × OC.
Ave ± StdDecrease in Percentage (%)
2015 (25–30 September)2021 (11–31 November)
PM2.5 (µg/m3)47.9 ± 21.047.4 ± 14.81.0
TC (µg/m3)12.2 ± 5.57.4 ± 2.939.5
OC (µg/m3)8.6 ± 4.06.4 ± 2.625.4
EC (µg/m3)3.6 ± 1.71.0 ± 0.473.4
SOC (µg/m3)4.3 ± 2.34.7 ± 2.0−8.0
OC/EC2.4 ± 0.66.8 ± 1.6−179.7
CA (µg/m3)19.1 ± 8.714.2 ± 5.625.4
MACBrC,405 (m2/g)1.30.655.4
MACBC,405 (m2/g)13.414.7−9.7
MACTC,405 (m2/g)5.03.431.3
Disclaimer/Publisher’s Note: The statements, opinions and data contained in all publications are solely those of the individual author(s) and contributor(s) and not of MDPI and/or the editor(s). MDPI and/or the editor(s) disclaim responsibility for any injury to people or property resulting from any ideas, methods, instructions or products referred to in the content.

