Article

Sensitivity Analysis of the Land Surface Characteristic Parameters in Different Climatic Regions of the Loess Plateau

1
Key Laboratory of Arid Climatic Changing and Reducing Disaster of Gansu Province, Key Laboratory of Arid Change and Disaster Reduction of CMA, Institute of Arid Meteorology, China Meteorological Administration, Lanzhou 730020, China
2
Gansu Branch of the China Meteorological Administration Meteorological Cadre Training College, Lanzhou 730030, China
*
Author to whom correspondence should be addressed.
Atmosphere 2023, 14(10), 1528; https://doi.org/10.3390/atmos14101528
Submission received: 28 August 2023 / Revised: 25 September 2023 / Accepted: 2 October 2023 / Published: 4 October 2023
(This article belongs to the Special Issue Land-Atmosphere Interactions over the Tibetan Plateau)

Abstract

:
Land surface parameters are crucial in land surface process model simulations. Considering the complex land surface characteristics of the Loess Plateau, a parametric sensitivity analysis was conducted to determine the key parameters of its Noah Multi-Parameterization (Noah-MP) land surface model. Sensitivity analysis can better elucidate the influence of different parameters on the model simulation results and evaluate the rationality of each model parameter. The extended Fourier amplitude sensitivity test (EFAST) method is a classical global sensitivity analysis method, whose theory is derived from the analysis of variance and Fourier transform. In this study, the EFAST method was used to perform sensitivity analyses on the land surface characteristic parameters in different climatic regions of the Loess Plateau. The results showed that the Noah-MP model can represent the land surface characteristics of the Loess Plateau well. With sensible and latent heat fluxes as criteria, the main sensitivity parameters were the vegetation roughness length (Z0), the soil quartz content (QUARTZ), the maximum volumetric soil moisture (MAXSMC), and the soil parameter “b”. The coupling effect between parameters has a greater impact on the sensitivity analysis. The probability densities of the three most sensitive parameters were evenly distributed in each interval, whereas those of the other parameters were distributed within 0–0.2 of the standardized value. Moreover, almost half of the land surface parameters accounted for 80% of the total sensitivity. Based on the seasonal sensitivity distribution of the land surface parameters, Z0 dominated throughout all four seasons, QUARTZ sensitivity was high in spring, and both MAXSMC and QUARTZ showed high sensitivities in winter.

1. Introduction

The exchange of energy, water, and matter between the Earth and atmosphere is the primary mechanism of surface–atmosphere interactions. The land surface process model used to describe these interactions contains a series of parameters involving surface biological, physical, and soil, water, and heat exchange processes. However, owing to the limitations of observation, experimental conditions, and scientific understanding, some parameters in the current land surface process model cannot accurately describe the underlying surface characteristics, greatly limiting its simulation performance. Land surface conditions, such as vegetation cover and soil moisture, significantly impact the surface energy and water budgets at large and even regional scales owing to their uneven spatial distribution and seasonal changes [1,2,3]. The land–atmosphere exchange of matter and energy is one of the primary physical processes that determines the state of climate and atmospheric circulation [4,5]. Surface layer observation experiments are invaluable for the extensive study of the interaction mechanisms between various underlying surfaces and the atmosphere. Understanding these interactions may elucidate the land surface process mechanisms, optimize the land surface parameterization schemes, and ultimately improve the level of weather and climate prediction.
Land surface processes are organic connections between the spherical layers of the earth science system [6]. Land–atmosphere interactions directly affect local weather processes and atmospheric circulation movements, forming the basic characteristics of regional and global climates. Moreover, climate change has a reaction effect on land–atmosphere interactions, affecting the surface ecology [7]. As an important component of numerical weather modeling, land surface process models provide the underlying heat, energy, and material bases for simulating various weather processes. The current land surface process model involves numerous parameters; most of the preset values of these parameters come from observation and empirical estimation. However, owing to the limitations of actual observation conditions and scientific cognition, considerable deviations often arise, and the actual needs cannot be met. The effect of the land surface model simulation depends not only on the physical parameterization scheme of the model, quality of the initial field, and the driving data but also on the representativeness and accuracy of the parameters. The land surface process model contains a variety of physical, chemical, and biological process parameterization schemes [8]. The physical process parameterization scheme is based on some assumptions, including various land surface parameter settings [9]. Different land surface parameters represent different underlying surface characteristics, some of which are directly observable, whereas other supposed “functional parameters” are not [10,11].
Land surface process parameters play a crucial role in land surface process model simulations; their magnitude and the correctness and fairness of the parameterization scheme directly affect the accuracy of the model simulation results. Because the characteristics of land surface process parameters vary from place to place, the parametric scheme has an empirical and local nature [12,13,14]. Therefore, meticulously analyzing and discussing the parametric characteristics and parameterization methods of land surface processes in specific research areas can significantly improve the simulation performance of land surface process patterns. Classifying local climate zones based on land surface characteristics evidences an understanding of the difference in the land surface temperature and the relationship between both factors [15,16,17,18].
A parametric sensitivity analysis can be used to determine the key parameters of a pattern. Parameter sensitivity analysis and single station optimization can be used to diagnose the degree of response of different parameters. Additionally, it can help to quantitatively understand their contribution and physical processes in the model to the model output as well as verify the impact of different parameters on a specific period or watershed simulation [19,20,21]. The sensitivity analysis and optimization results of the parameters show that the model output is often affected by a few main parameters, while the interaction between parameters greatly influences the model output [22,23,24].
In 1992, a working group on numerical tests under the Atmospheric Science Committee of the World Meteorological Organization and a continental-scale international program jointly held an intercomparison program for land surface parameterization [25]. They conducted sensitivity tests on a series of key parameters and tested the simulation of water heat flux on the land surface under the same atmospheric forcing using over 20 different land surface process models. The verification showed that the simulation results of water and heat flux differed for different land surface models, indicating great uncertainty in the description of the surface turbulent exchange process. Other studies have also shown that the parameterization of land surface processes in current atmospheric models is not ideal, and the resulting surface flux uncertainties are considerable [26]. Generally, parameters with clear physical meaning in the land surface model, such as surface albedo, vegetation coverage, and leaf area index, do not depend on the model parameterization scheme. However, other “functional parameters” such as the stomatal resistance, aerodynamic roughness, and soil heat capacity are difficult to quantify [10,11]. In addition, the underlying surface parameter sets used by different land surface models have varying resolutions and are affected by different vegetation and soil classification methods. Even for the same soil or vegetation type, parameters with the same physical meaning are different for different models [10,27]. The influence of the spatial heterogeneity of the model parameters on the land surface process model simulation results has also attracted considerable attention [28,29].
Many scholars in China have conducted simulation experiments on different land surface models at various stations and regions [30,31,32,33]. They demonstrated that each model can effectively simulate the changing land surface characteristic trends of their corresponding stations or regions. Because of the harsh natural environment and lack of surface layer observation experiments, accurately determining the land surface process parameters and soil thermal properties is difficult. The land surface process model can usually only use the default parameters of the model, which introduces uncertainty to the simulation results of the land surface process in this area. Thus, the weather and climate model performance coupled with the land surface process model is reduced. To address this problem, many scholars have conducted research on land surface parameterization [34,35,36,37]. Relevant studies have also been conducted on the land surface parameters of the complex underlying surface in Northwest China [38,39,40,41]. However, the Northwest region, particularly the Loess Plateau, has complex and diverse underlying surfaces. The suitability of the land surface parameters used in the land surface model of this region and the sensitivity of the model output results to these parameters are difficult to determine. This is owing to the lack of observational data in this region, with research being relatively limited.
The characteristic land–air interactions in the Loess Plateau are attributed to the peculiarity of its complex underlying surface. First, owing to the uneven distribution of this underlying surface, the land–air interactions are multilayered. Second, the soil, water, and heat exchange processes in arid areas have different characteristics from those of other underlying surfaces; under dry conditions, the contribution of water vapor movement in the soil to the water cycle is more important than that of the liquid water movement [42]. Third, sparsely vegetated areas often appear in the degraded vegetation area of arid and semi-arid regions. These are different from the ground gas exchange process between vegetation and dense vegetation, where so-called “reverse gradient transport” often occurs [42]. Fourth, arid and semiarid areas have high atmospheric transparency under sunny conditions, with surfaces that absorb more solar radiation; however, due to the arid climate and desertification, their soil is loose, and sandstorms can easily occur during the strong convective weather in spring and summer.
Although the weather forecasting of complex underlying surface areas is difficult for model forecasting, it is the focus of forecasters and model researchers. In addition, the expression of the land–air interaction processes in this region is extremely important in weather models. Because of its complexity, the study of the land surface processes in this area is particularly important. In this study, a sensitivity analysis was conducted on the land surface parameters in complex terrain areas. The aim was to identify the key parameters that greatly influence the surface sensible and latent heat fluxes of many land surface parameters and analyze their characteristics. Moreover, sensitivity analysis can better elucidate the influence of different parameters on the model simulation results and evaluate the rationality of each parameter of the model. In the optimization of the land surface parameters, the dimension of the parameters was reduced, and the efficiency and quality of the parameter optimization were improved. By focusing on and adjusting the parameters that are more sensitive to the simulation results, the simulation effect of the land surface process model in the Loess Plateau region is expected to improve.

2. Data and Methods

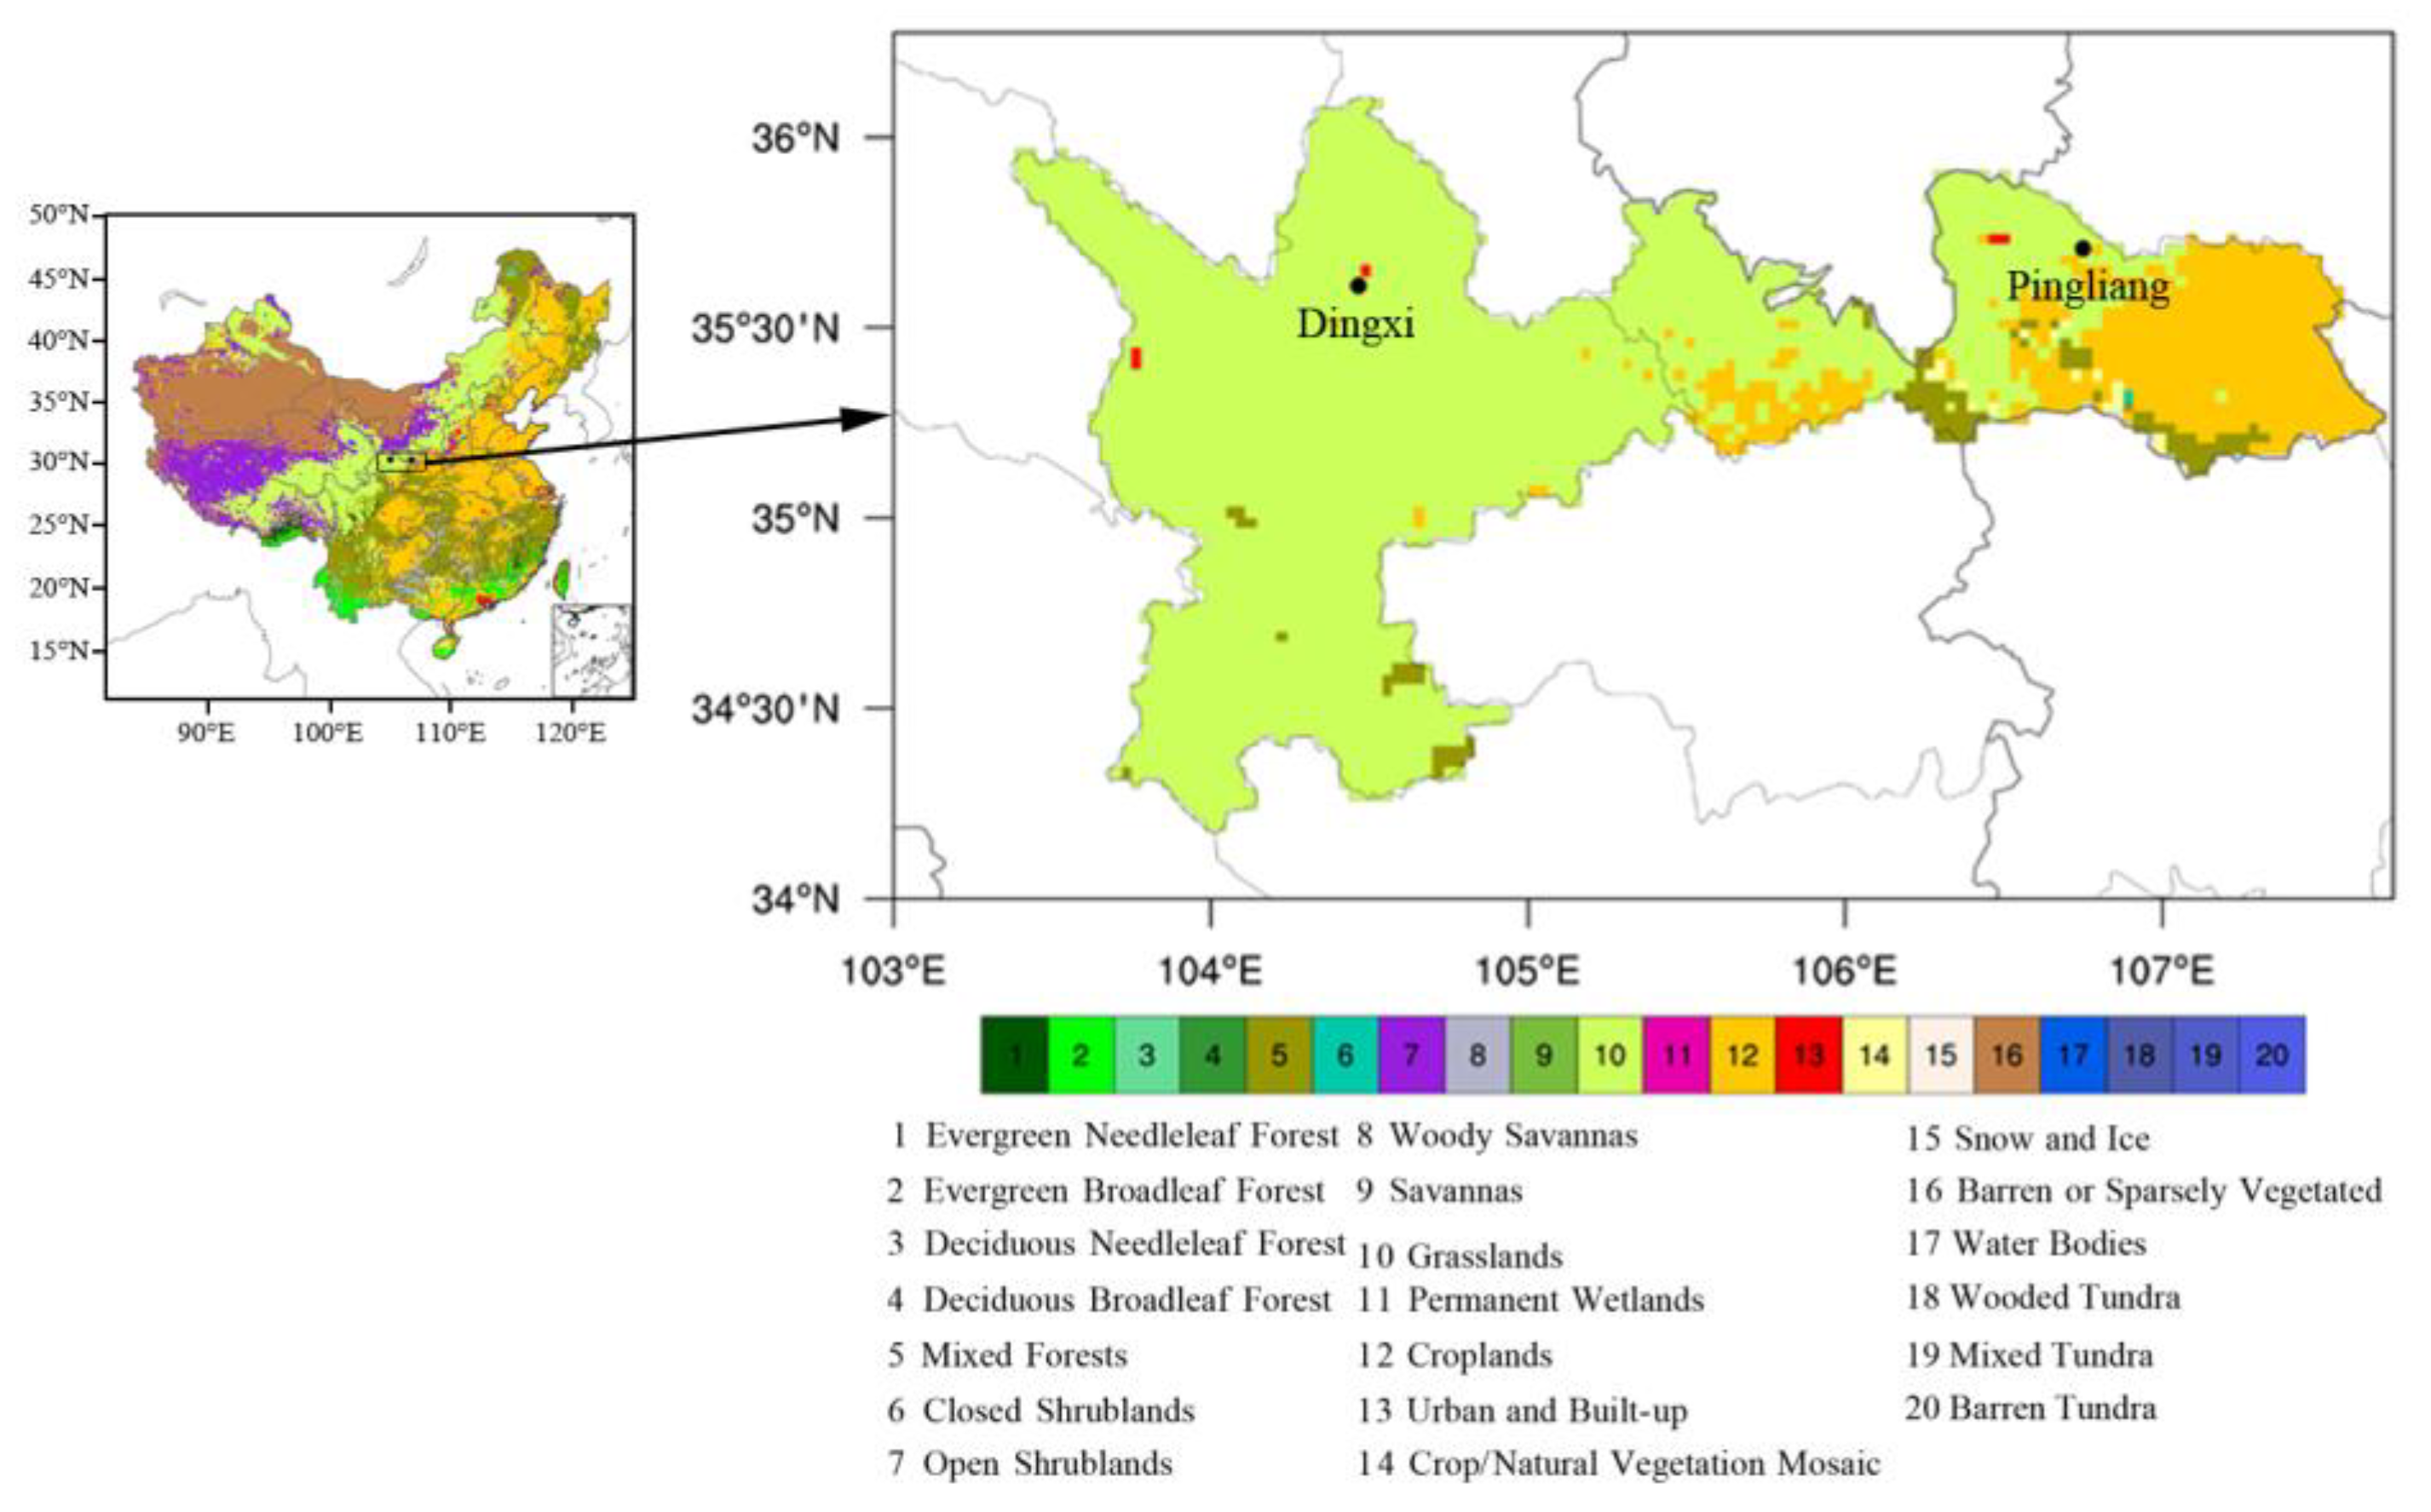
2.1. Observation Stations and Data Introduction

The Dingxi Experimental Station (35°33′22″ N, 104°35′37″ E) is located in the Agricultural Science and Technology Park in the western suburbs of the city of Dingxi, approximately 5 km from the edge of the urban area and 1860 m above sea level. It is located in the uplift extension areas of the Loess Plateau, a typical multi-gully geomorphological area. It is a semiarid climatic area affected by monsoons. The annual average precipitation is approximately 386.0 mm, but the evaporation is as high as 1400 mm. The land surface characteristics of this area include crop and grassland mosaic vegetation coverage, and the dominant soil type is sandy clay.
The Pingliang Experimental Station (35°31′33″ N, 106°56′35″ E) is located on the grass peak plateau northeast of the city of Pingliang, with an altitude of 1480 m. It is approximately 23 km away from the edge of the city, located on farmland where the land surface is characterized by farmland vegetation cover and silty clay soil. The geographical location and vegetation distribution of Dingxi and Pingliang are shown in Figure 1.
In this study, land surface data from 2017 in the Dingxi Land Surface Observatory were observed hourly, and land surface data from 2018 in Pingliang were also observed. The data elements studied, namely air pressure, wind speed, 2 m temperature, 2 m relative humidity, downward shortwave radiation, downward longwave radiation, and precipitation, were used to drive a Noah-MP land surface model. Detailed information on the observational data used in this study is shown in Table 1.

2.2. Noah-MP Model

The Noah-MP expands upon the Noah land surface model [43] and improves some of its existing problems. It also has the advantage of multiple optional physical parameterization schemes [2,44]. For example, the Noah-MP can add a separate vegetation canopy, introduce a three-layer snow model, and improve the snow and frozen soil scheme as well as the two-flow approximation scheme for incoming canopy radiation. Moreover, it adds a short-term dynamic vegetation model and updates the surface water seepage model [45]. The sensible heat flux H in the model is calculated using the following formula:
H = ρ c p C h u θ s θ a i r ,
where ρ is the air density at standard atmospheric pressure (g·cm−3), c p is the specific heat capacity of the air (J·kg−1·K−1), u is the near surface wind speed, θ s is the surface potential temperature (K), θ a i r is the potential temperature at a reference altitude (K), and C h is the surface heat exchange coefficient. C h is determined by the soil water potential function and roughness, where the value of the soil water potential function is related to the soil type.
The latent heat flux in the model is calculated by:
λ E p = Δ R n G 0 ρ c p C h + θ 0 T 0 + A 1 + R R Δ + R R + 1   ,
where
R R = 4 σ T 0 4 R d p s f c c p C h
A = λ c p q s a t q a   .
In the formula, Δ is the slope of the saturation specific humidity curve (kPa·K−1), θ 0 and T 0 are the potential and air temperatures, respectively, p s f c is air pressure near the surface, R d is the psychrometer constant, and q s a t and q a are the saturated and actual specific humidities (kg·kg−1), respectively.
Most of the parameters and parameter settings in the Noah-MP model are included in the parameter list, such as general, vegetation, and soil parameters. These play a role in the calculation of various equations in the model, which then affect the modeling results. The 20 parameters selected in this paper have been commonly used in such models [22,24]. A total of 12 parameters were included for soil and 8 parameters for vegetation. Table 2 shows the 20 land surface parameters selected in the Noah-MP. Default values and feasible ranges for all parameters were taken from the model and the related literature [22]. Other parameters adopted the default value settings of the model.

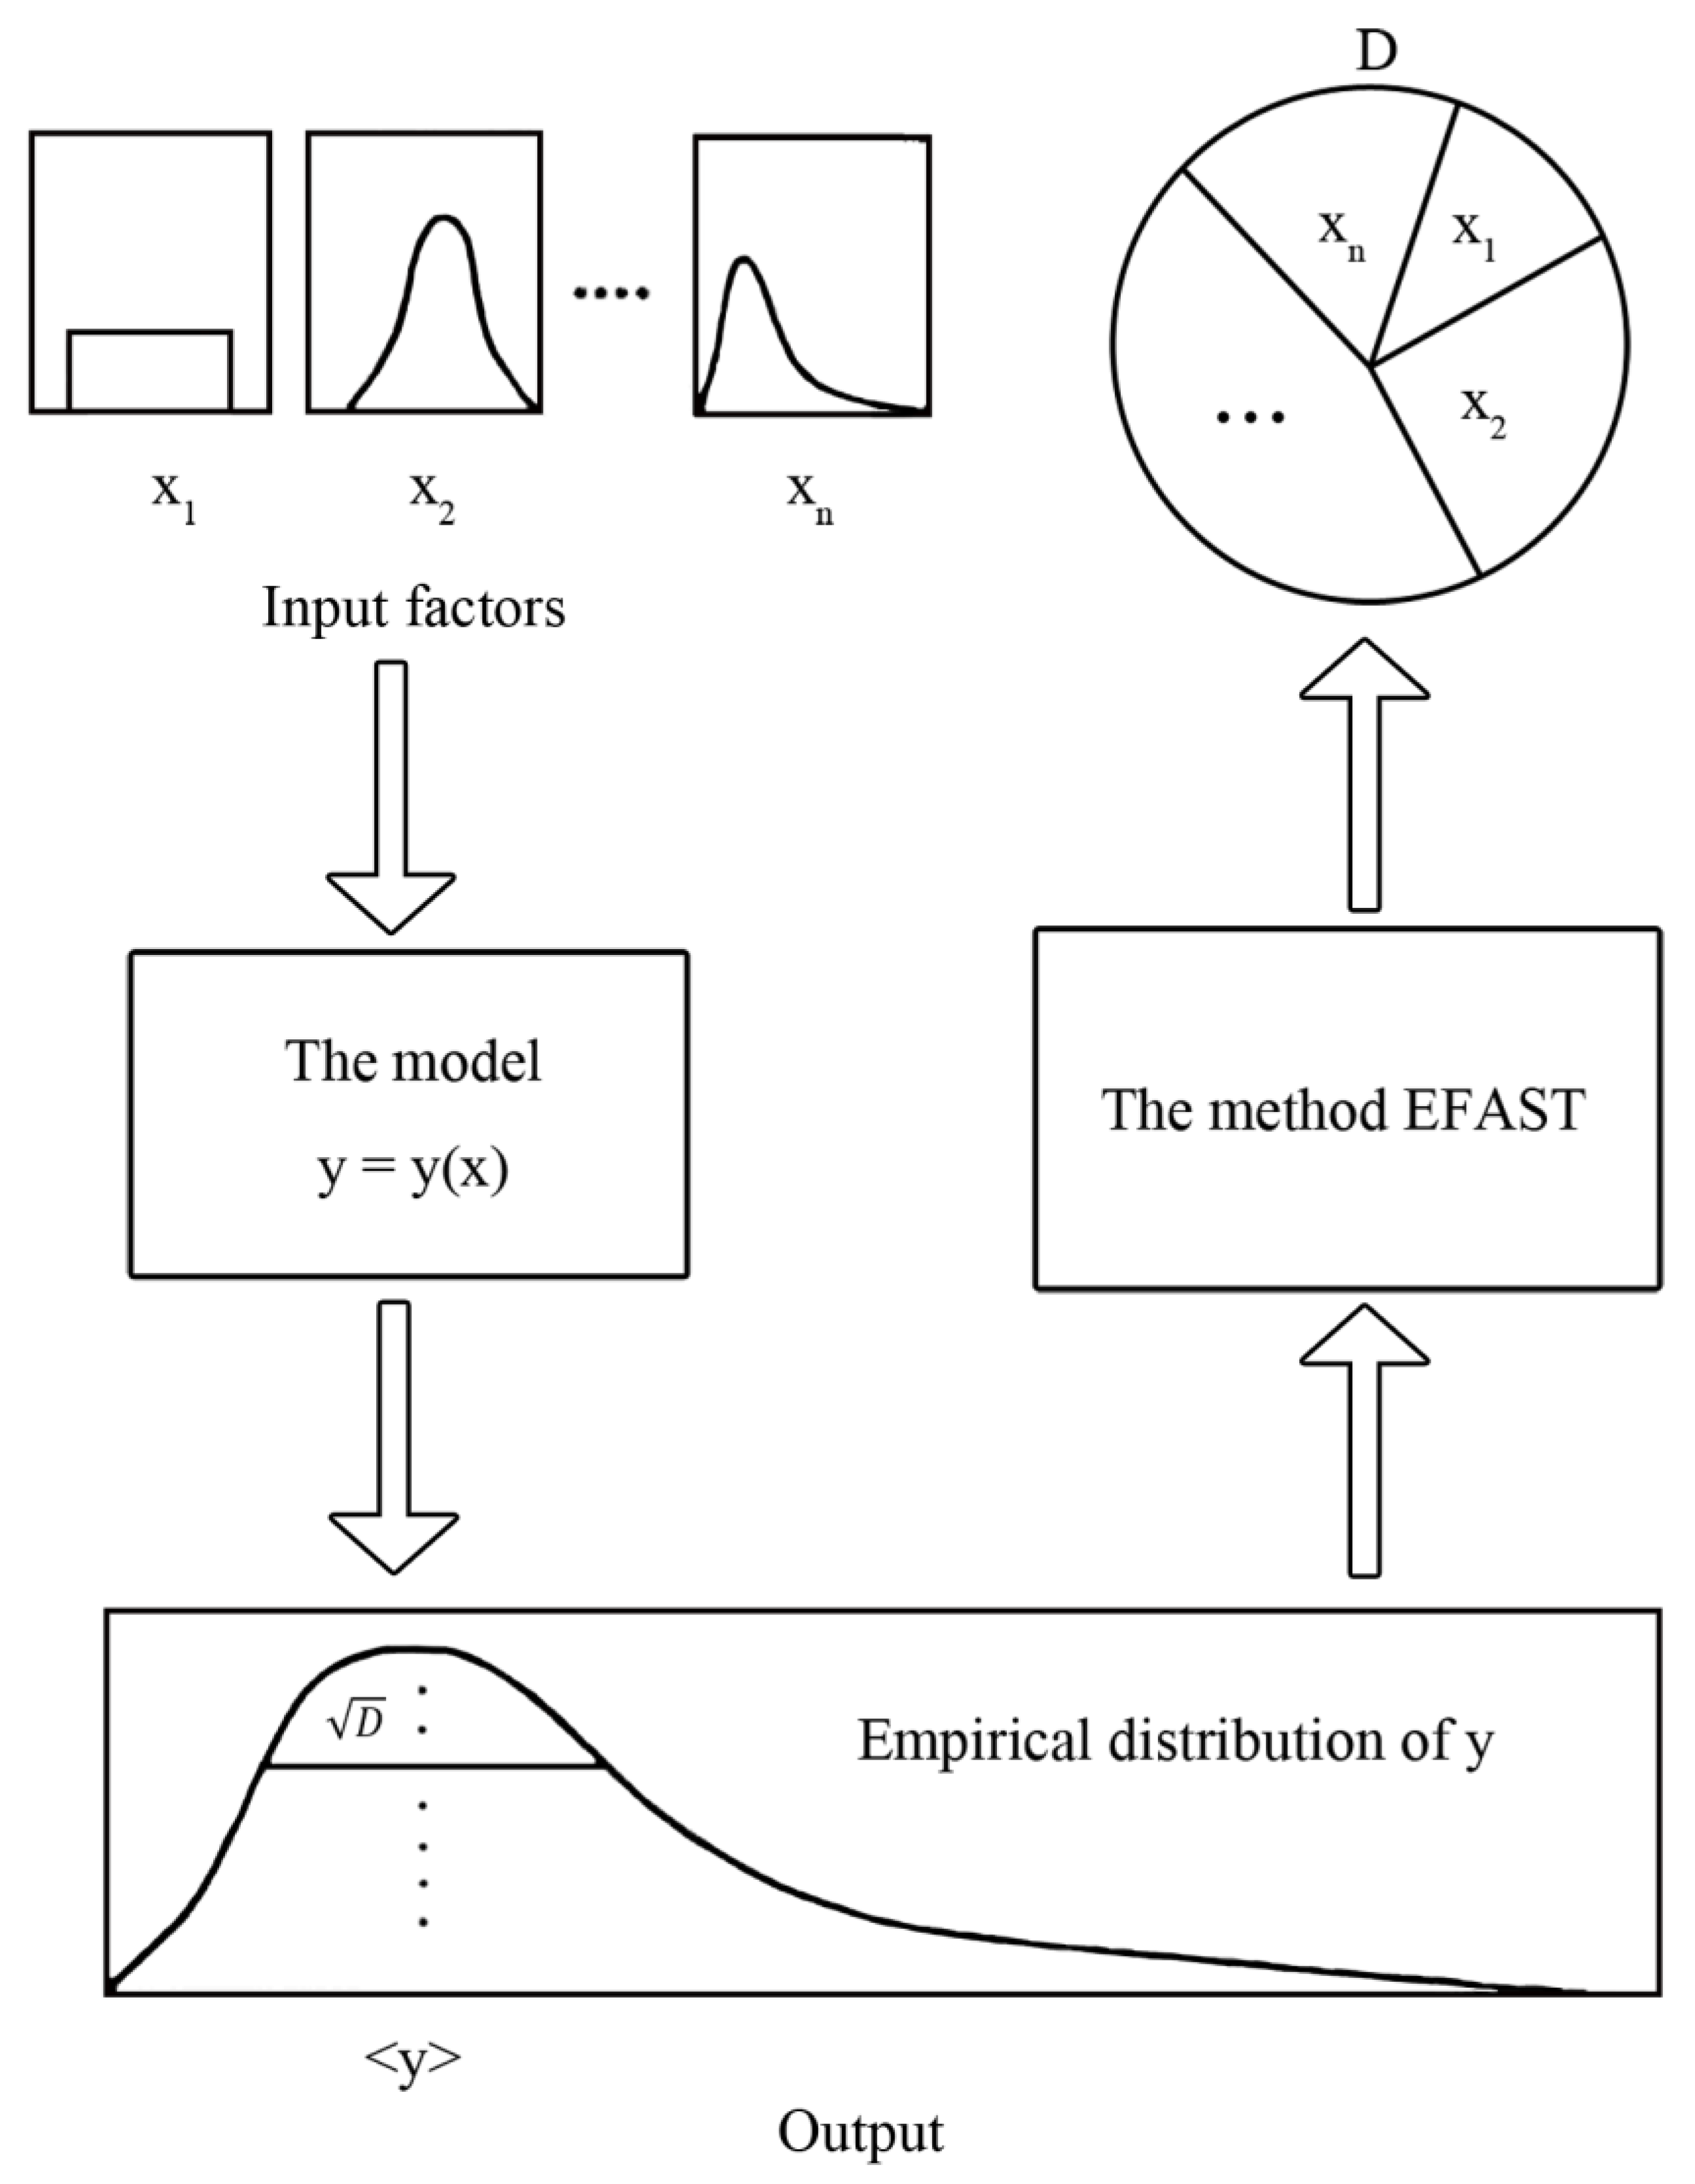
2.3. Sensitivity Analysis

The Fourier amplitude sensitivity test (FAST) is a classical global sensitivity analysis method whose theory is derived from the analysis of variance and Fourier transform [46]. FAST determines the first-order sensitivity of a parameter by calculating the contribution of the model output variance caused by the specified parameter to the overall model variance. The extended FAST (EFAST) method builds upon FAST to address the problems of the overall sensitivity analysis [47]. Its operational framework is shown in Figure 2.
The specific calculation steps of the EFAST method are as follows. Assuming that the pattern is y = f X and the input parameters are X = X x 1 , x 2 , , x n , X then exists in the certain n-dimensional space K n . To make it traverse the value range, X is treated as a random variable, thereby satisfying the probability distribution P X = P x 1 , x 2 , , x n . The r-order distance y r of Y is then satisfied.
y r = K n f r x 1 , x 2 , , x n P x 1 , x 2 , , x n d x
Theoretically, using a multidimensional Fourier transform, turning X into a one-dimensional form and mapping K n in a one-dimensional space for further calculation is possible. The specific method involves selecting the conversion function G i .
x i s = G i sin ω i s ,   i = 1 , 2 , , n ,
where the scalar s is < s < + , and   ω i is the integer frequency corresponding to x i . Selecting a suitable value allows the range of values to be traversed. By substituting (6) into (5), we obtain
y ¯ r = lim T 1 2 T T T f r x 1 s , x 2 s , , x n s d s .
Taking 2 and 1 of r in Equation (7), the second and first moments of y ¯ can be calculated, respectively, resulting in y ¯ 2 and y ¯ 1 , which are then substituted into the equation
v a r Y = y ¯ 2 y ¯ 1 2 .
The variance v a r Y can then be obtained. Furthermore, the Fourier series expansion of f s can be expressed as
y = f s = j = + A j cos j s + B j sin j s ,
where
A ω i = 1 2 π π π f s cos ω i s d s B ω i = 1 2 π π π f s sin ω i s d s .
The variance change caused by the i -th parameter is the sum of the squared amplitudes of an integer multiple of ω i ; that is,
v a r x i E Y | x i = p Z 0 ( A p ω i 2 + B p ω i 2 ) ,
where E Y | X is the expectation of Y when x takes a fixed value, and v a r x is the variance when x traverses the range of values of x. The total variance of the model and the first-order variance caused by parameter i are calculated using Equations (9) and (10). The first-order sensitivity value of parameter i in the pattern is calculated after ignoring the coupling with other parameters according to Equation (11).
S i = v a r x i E Y | x i v a r Y
After considering the coupling of parameters for the global sensitivity index parameter i, the coupling part between parameters is also considered.
S T i = 1 v a r x i E Y | x i v a r Y ,
where E Y | x i is the complementary set of E Y | x i . The global sensitivity S T i can then be calculated.
The parameter sensitivity analysis test was conducted using the sensitivity and uncertainty analysis software Simlab [48]. The selected parameters were randomly sampled with the Monte Carlo method; that is, the minimum and maximum values of the parameters were given such that the samples conformed to a normal distribution form. Because the number of samples was more than 65 times the number of parameters, the number of samples per parameter was 1460. The sampling results of each parameter were substituted into the model for simulation calculation, obtaining 1460 model results. Then, the sensible and latent heat flux values calculated by the model were substituted into the Simlab software. The sensitivity of each parameter to the sensible and latent heat fluxes was calculated using the EFAST method, obtaining the first-order and global sensitivities of each parameter.

3. Results

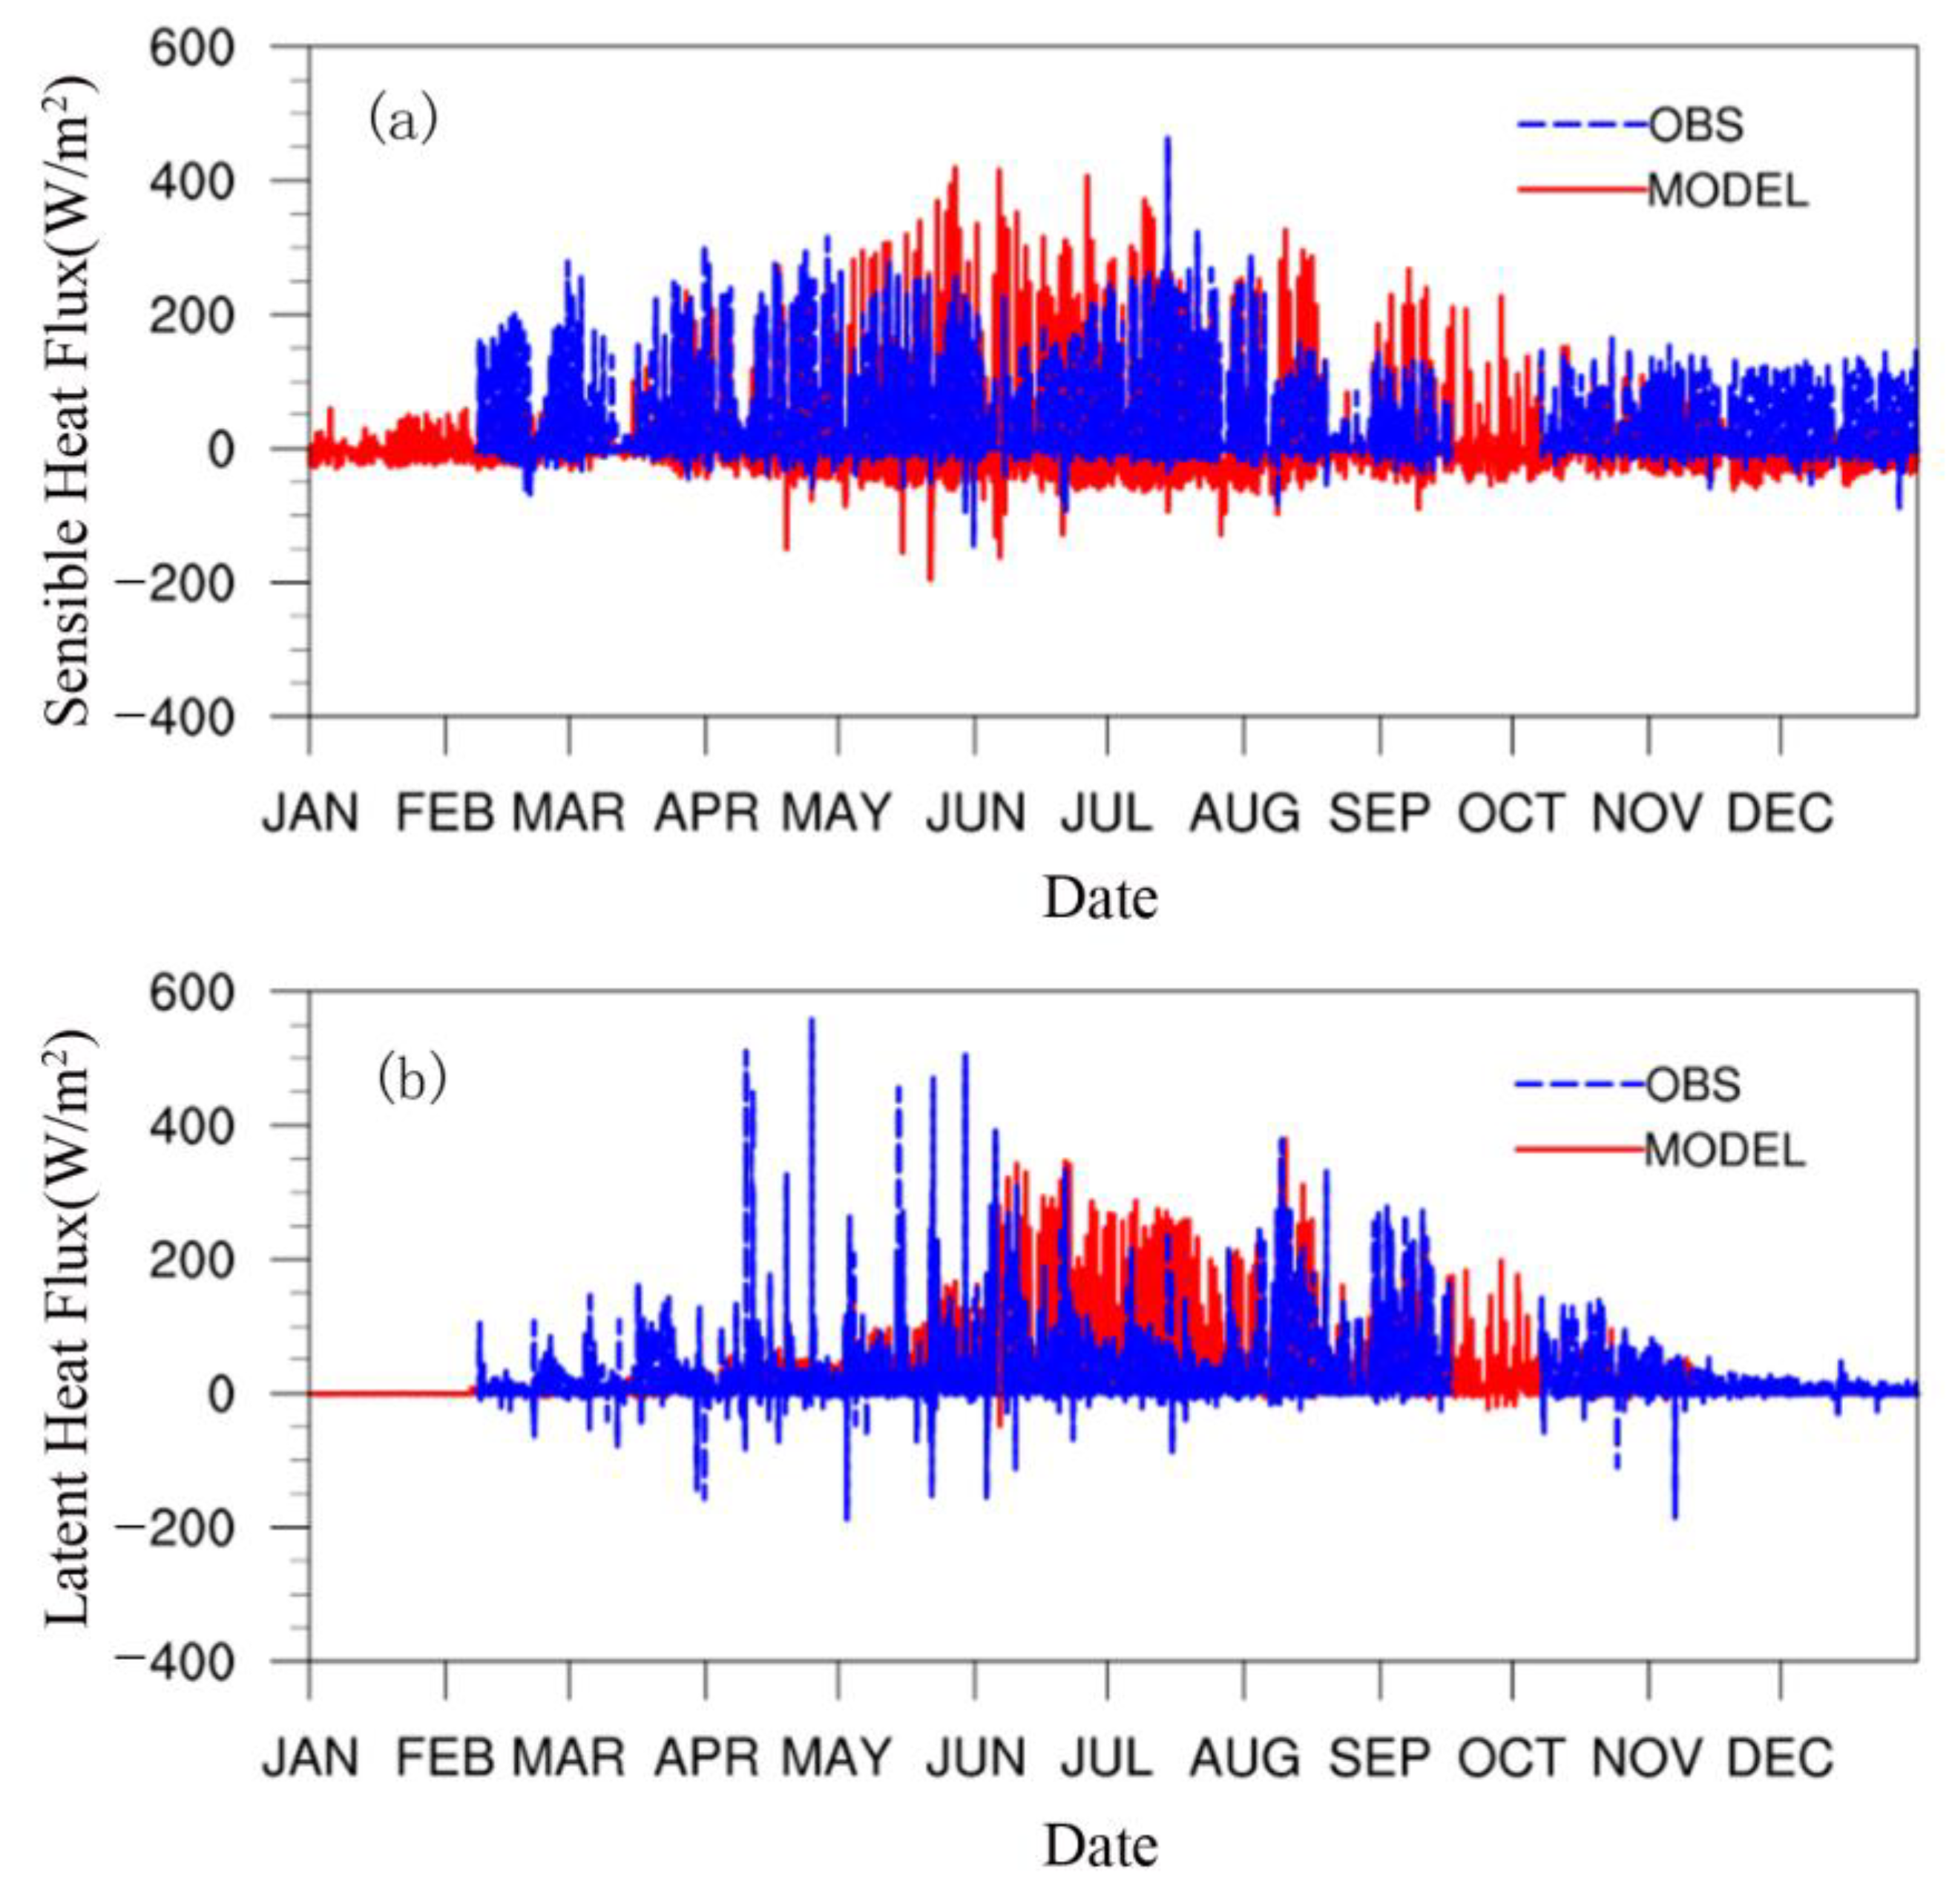
3.1. Model Validation

The observation data of the Dingxi and Pingliang stations were used to drive the Noah-MP model. The parameterization scheme and parameter settings in the model used the default values that come with it. The applicability of the Noah-MP model for the Loess Plateau was analyzed. Figure 1 shows the observed and simulated values of the sensible and latent heat fluxes in 2017. Comparing the observed and simulated values, the annual trend of the simulated sensible heat flux (Figure 3a) was consistent with the actual observations, that is, low in the winter and high in the summer. Numerically, the simulated values were higher than the observed values, especially in summer. This may be related to the higher temperature simulated by the model (figure omitted), especially in summer, which had the largest error. The root mean square error (RMSE) of the sensible heat flux simulation was 77.90 W·m−2. The comparison between the simulated latent heat flux and the observed conditions (Figure 3b) was the same as that of the sensible heat flux; however, the actual latent heat flux of some days in April and May was significantly higher than the simulated values, likely caused by the observation value. The RMSE of the latent heat flux simulation was 43.29 W·m−2. Figure 4a–d show the simulated soil temperature and observation values in 2017, demonstrating a good correspondence between the simulated annual change in soil temperature and the actual observation. However, from a numerical perspective, the soil temperature simulated by the model exhibited a deep cold deviation. From top to bottom, the RMSEs of the soil temperature simulation were 6.01, 5.37, 4.91, and 4.30 °C. Although the correspondence between the simulated and observed values for soil moisture (Figure 4e–h) was not as good as that of the soil temperature, the simulated model was consistent with its annual variation characteristics, simulating dry topsoil and wet deep soil. The RMSEs of soil moisture simulation from top to bottom were 0.097, 0.076, 0.072, and 0.044 m3·m−3.
The simulation results of the model for Pingliang were basically the same as the trend of the Dingxi simulation (figure omitted), but its RMSE was slightly different. The RMSEs of the sensible and latent heat flux simulations were 57.88 and 61.49 W·m−2, respectively. From top to bottom, the RMSEs of soil temperature simulation were 3.90, 2.65, 2.64, and 2.27 °C, and those of the soil moisture simulation were 0.131, 0.071, 0.101, and 0.132 m3·m−3.
In short, the sensible and latent heat flux, soil temperature, and soil moisture simulated result errors of the Noah-MP model in the Loess Plateau were within a reasonable range compared with those in other places [49,50]. Therefore, the model is suitable for modeling studies on land surface characteristics in the region.

3.2. Sensitivity of the Land Surface Parameters in the Semiarid Region of the Loess Plateau

The sensitivities of the land surface parameters were determined by considering the sensible and latent heat fluxes as criteria. The first-order and global sensitivity analyses of land surface parameters in the semiarid area of the Loess Plateau were analyzed.

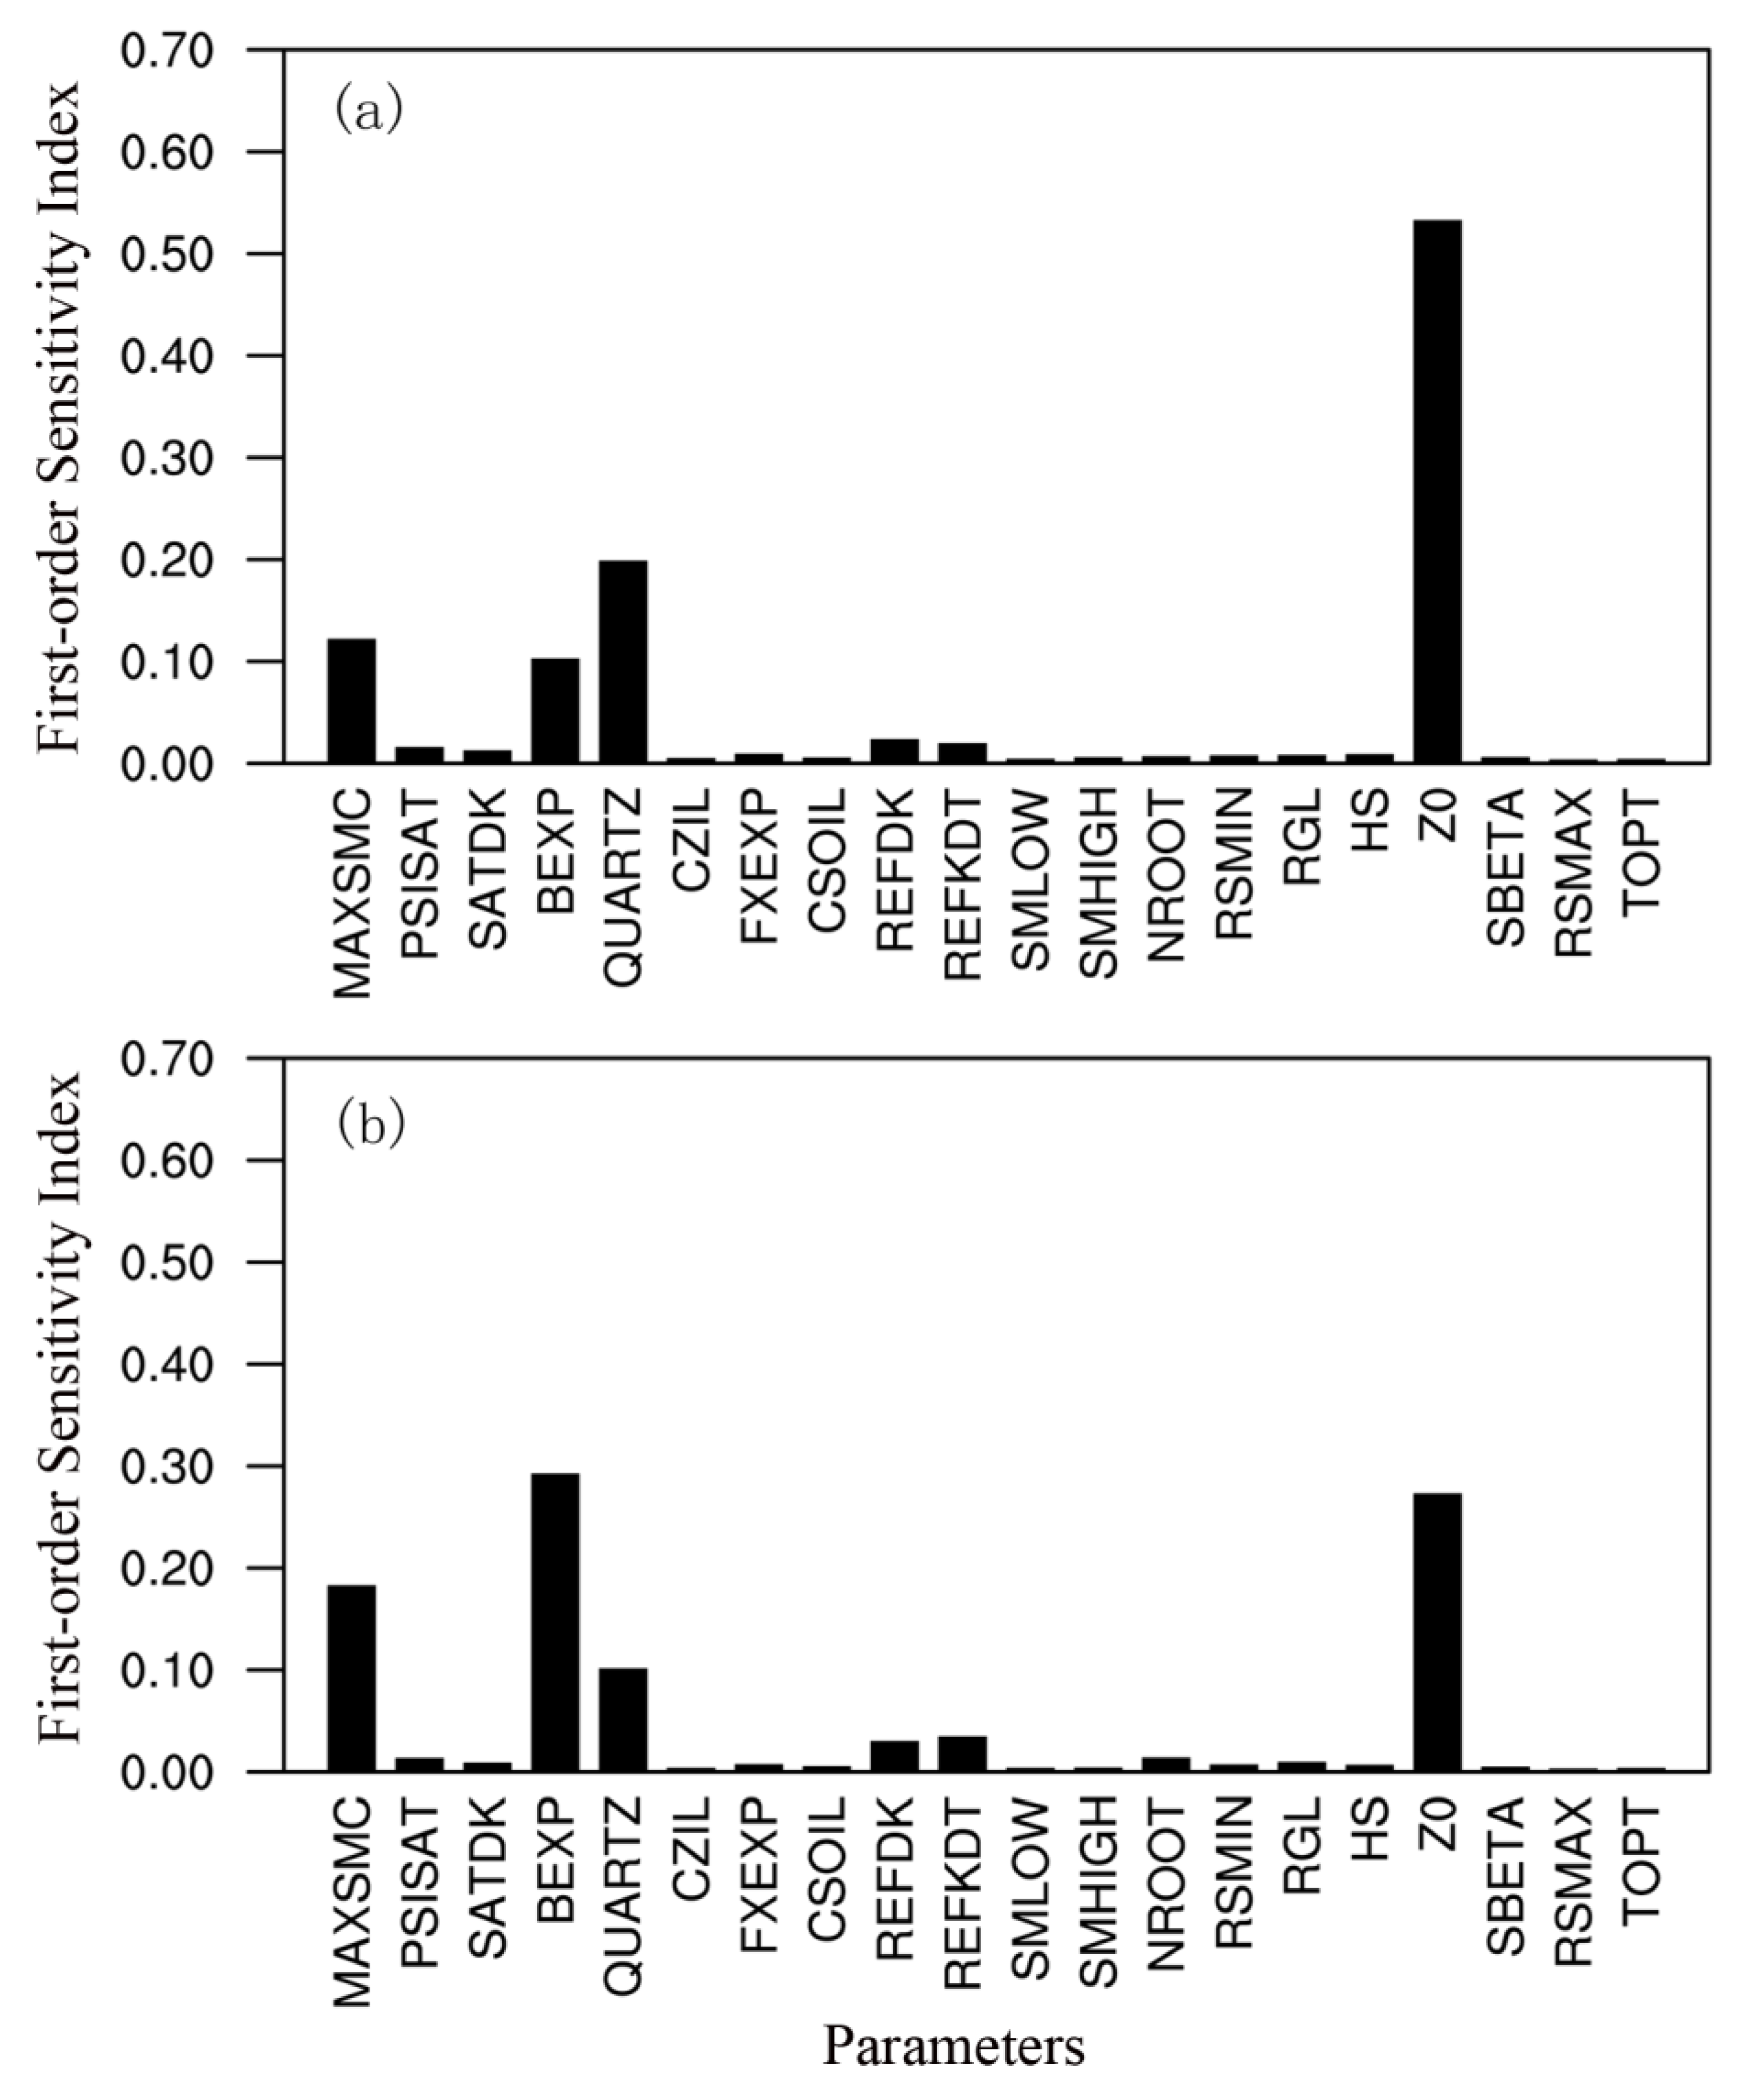
3.2.1. First-Order Sensitivity

Based on the first-order sensitivity analysis of the land surface parameters in Dingxi, the semiarid region of the Loess Plateau, the most sensitive parameters affecting heat flux were the vegetation roughness length (Z0), the soil quartz content (QUARTZ), the maximum volumetric soil moisture (MAXSMC), and the soil parameter “b” (BEXP) (Figure 5a). Among them, Z0 had the highest first-order sensitivity, which was over two times higher than that of the other parameters. The sensible heat flux had a high sensitivity to the vegetation parameters. The most sensitive parameters that affected the latent heat flux were also Z0, BEXP, MAXSMC, and QUARTZ (Figure 5b). Although Z0 had the highest first-order sensitivity, its sensitivity was slightly greater than that of the other three parameters; that is, the latent heat flux had a similar sensitivity to the vegetation and soil parameters. Regardless of whether sensible or latent heat flux was used as the sensitivity criterion, among the 20 parameters, except for the main four, the sensitivities of the other 16 were low or even negligible.

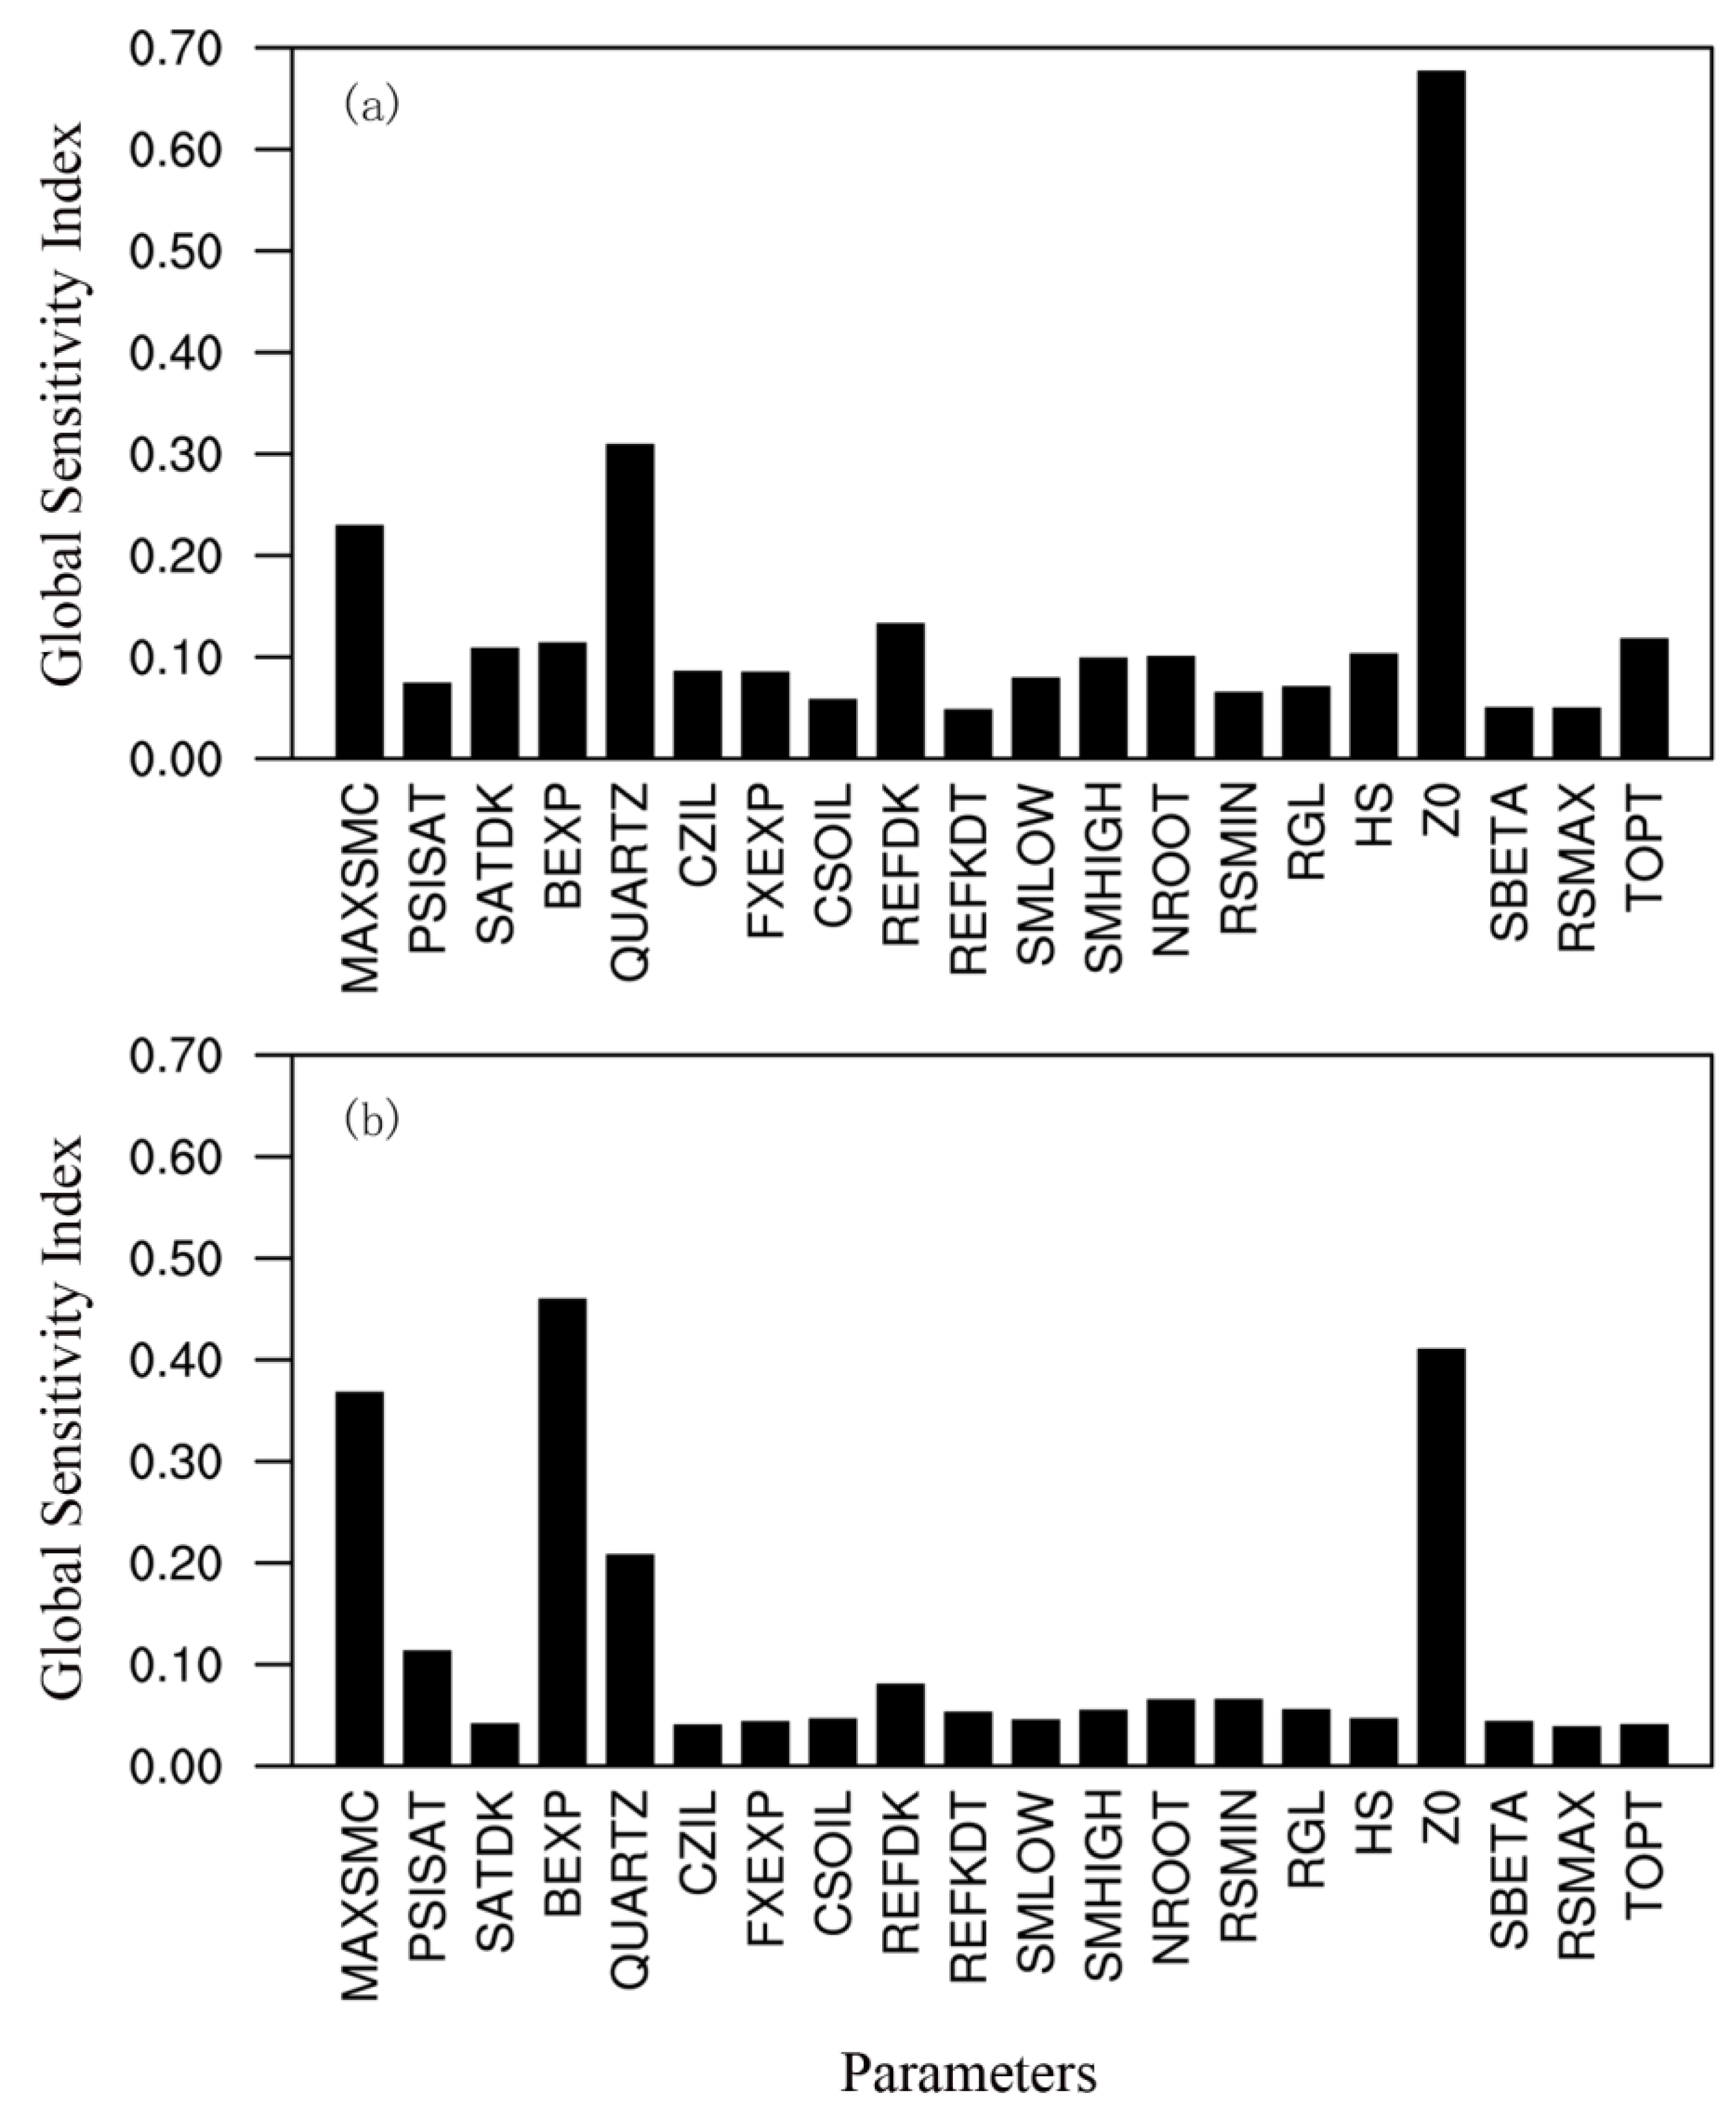
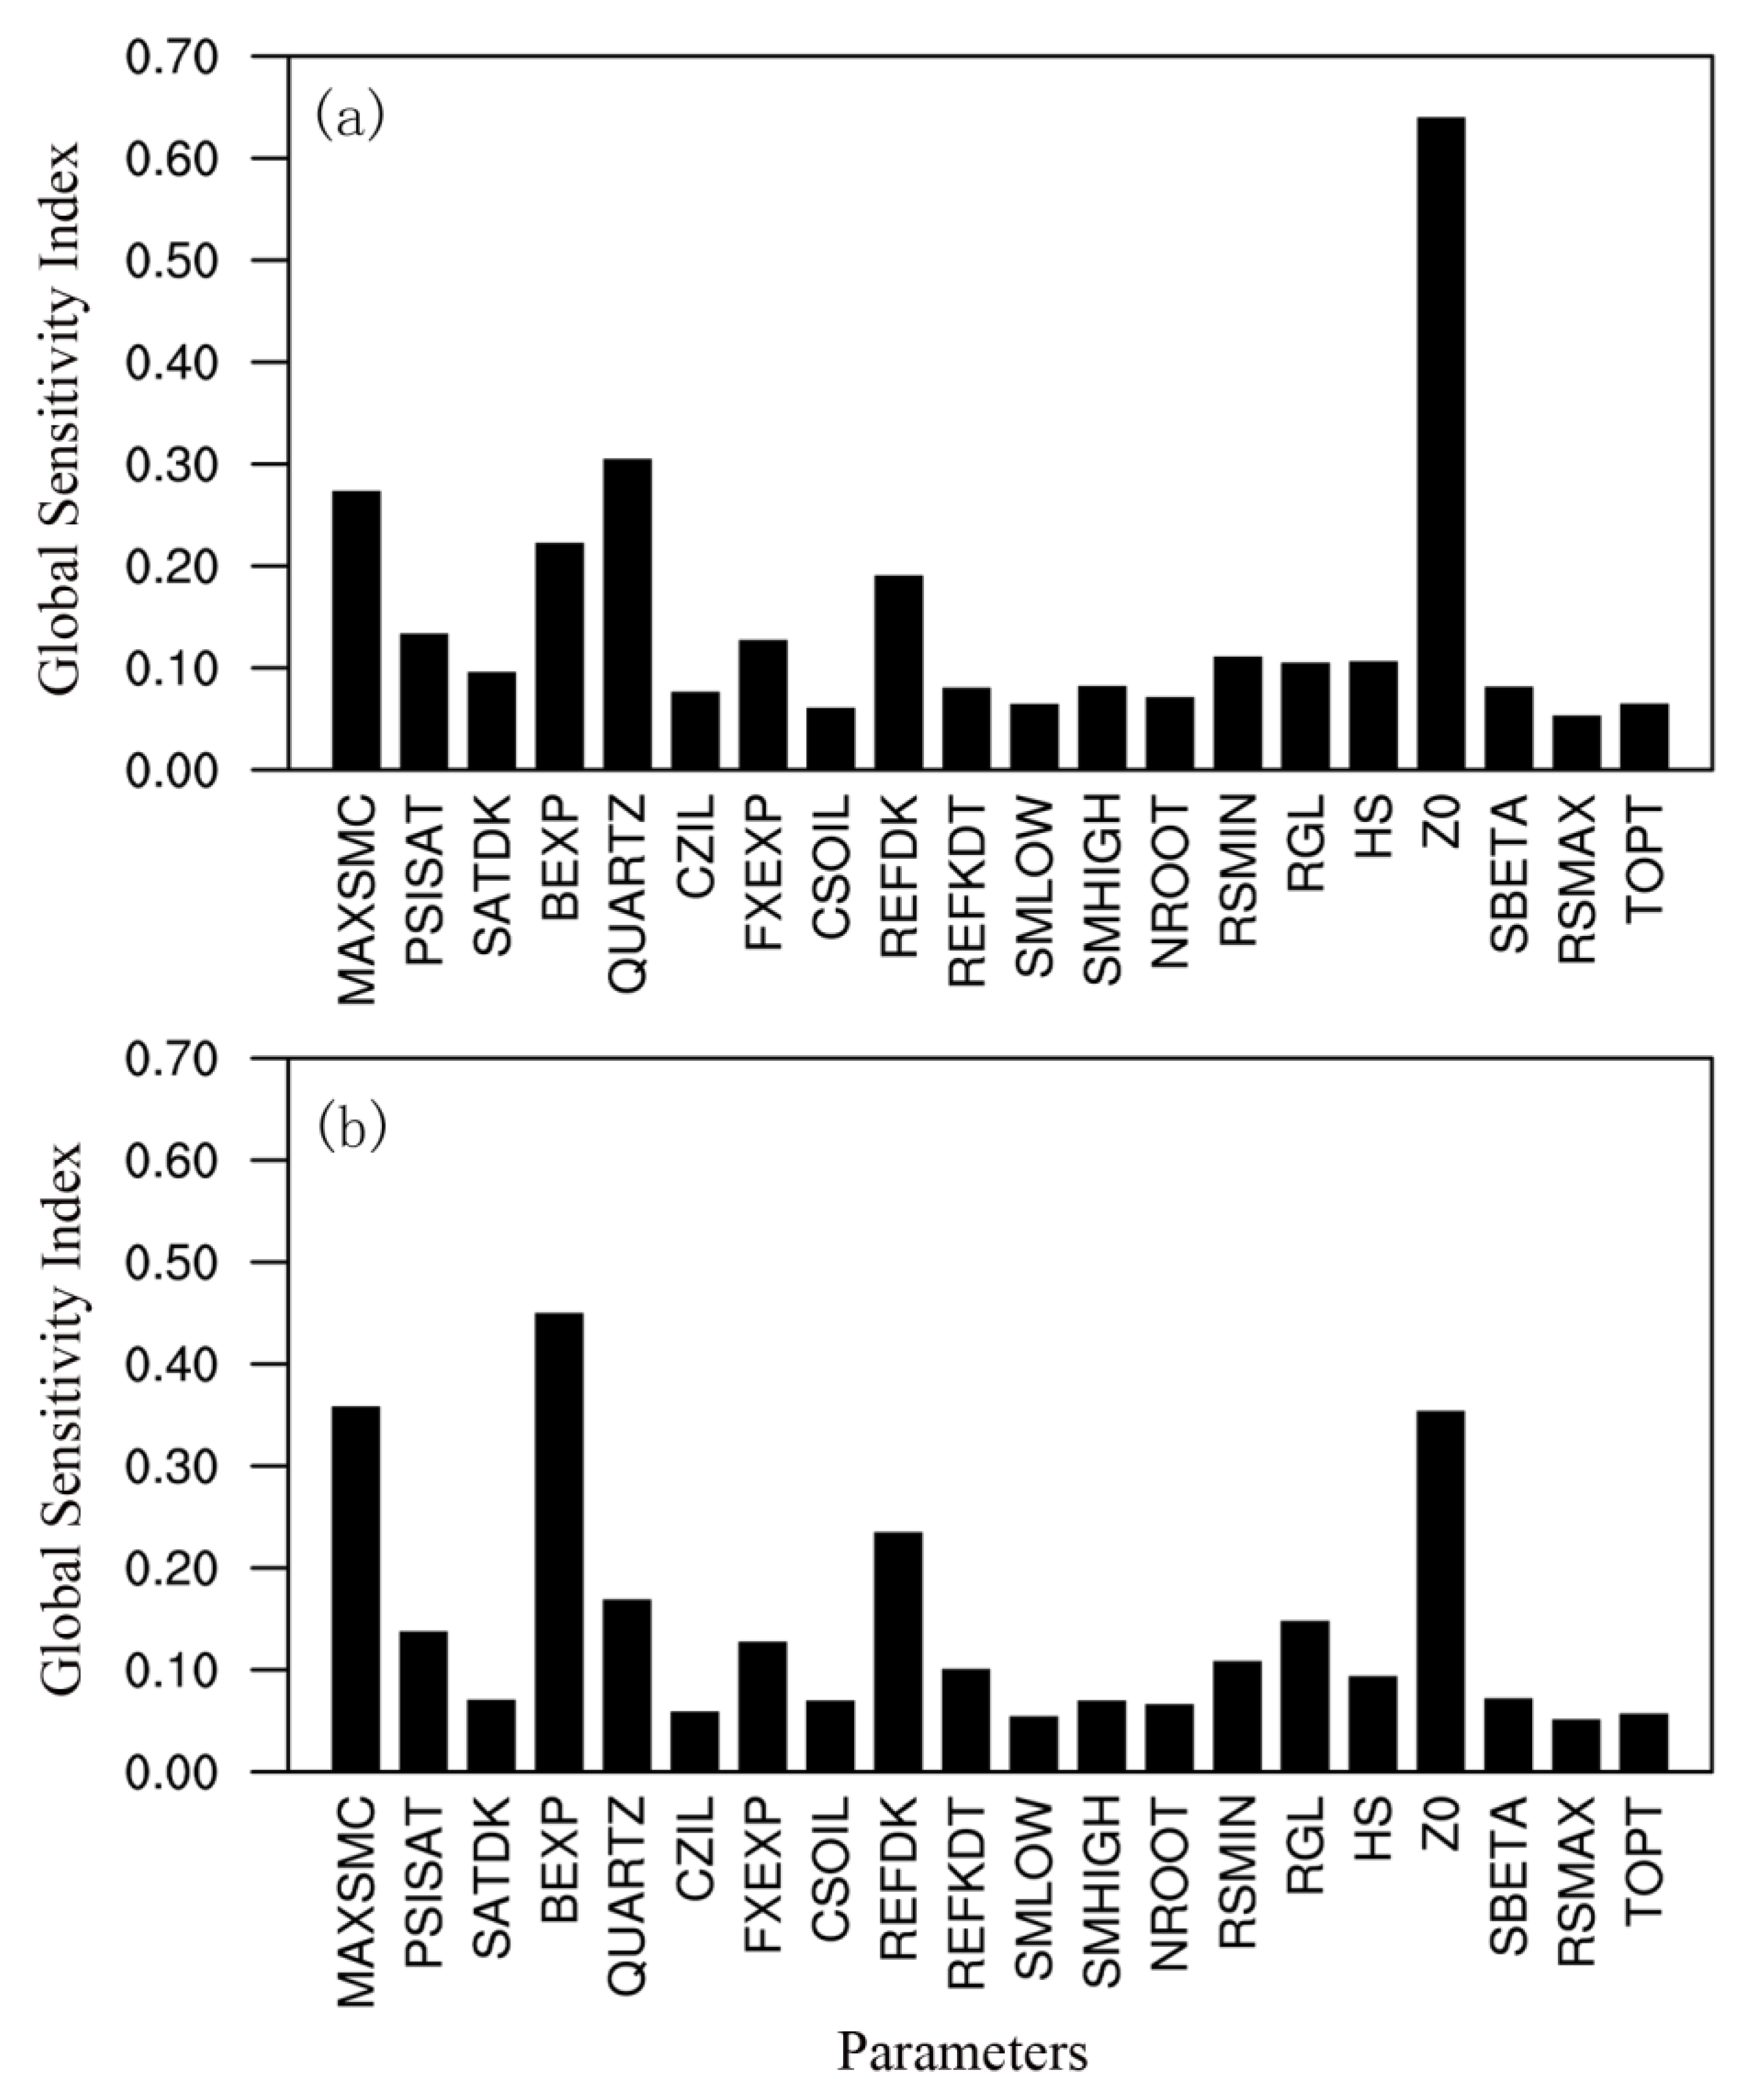
3.2.2. Global Sensitivity

Figure 6 shows the global sensitivity analyses of the land surface parameters. Comparing the global sensitivity of the parameters and the first-order sensitivity, the ranking of the parameters was identical when the sensible heat flux was used as the criterion. However, that of the latent heat flux slightly differed, while the global sensitivity values were numerically greater than the first-order sensitivity values. Although the sensitivity of the runoff parameter (REFDK) was low in the first-order analysis, it had a greater role in the global sensitivity analysis. The 16 parameters with negligible sensitivity in the first-order sensitivity analysis had higher sensitivities in the global sensitivity analysis. This indicates that the coupling effect between parameters greatly impacted the sensitivity analysis. In the land surface model, the role of each parameter is not independent, and they affect each other. Therefore, global sensitivity analyses are important in determining the sensitivities of land surface parameters.

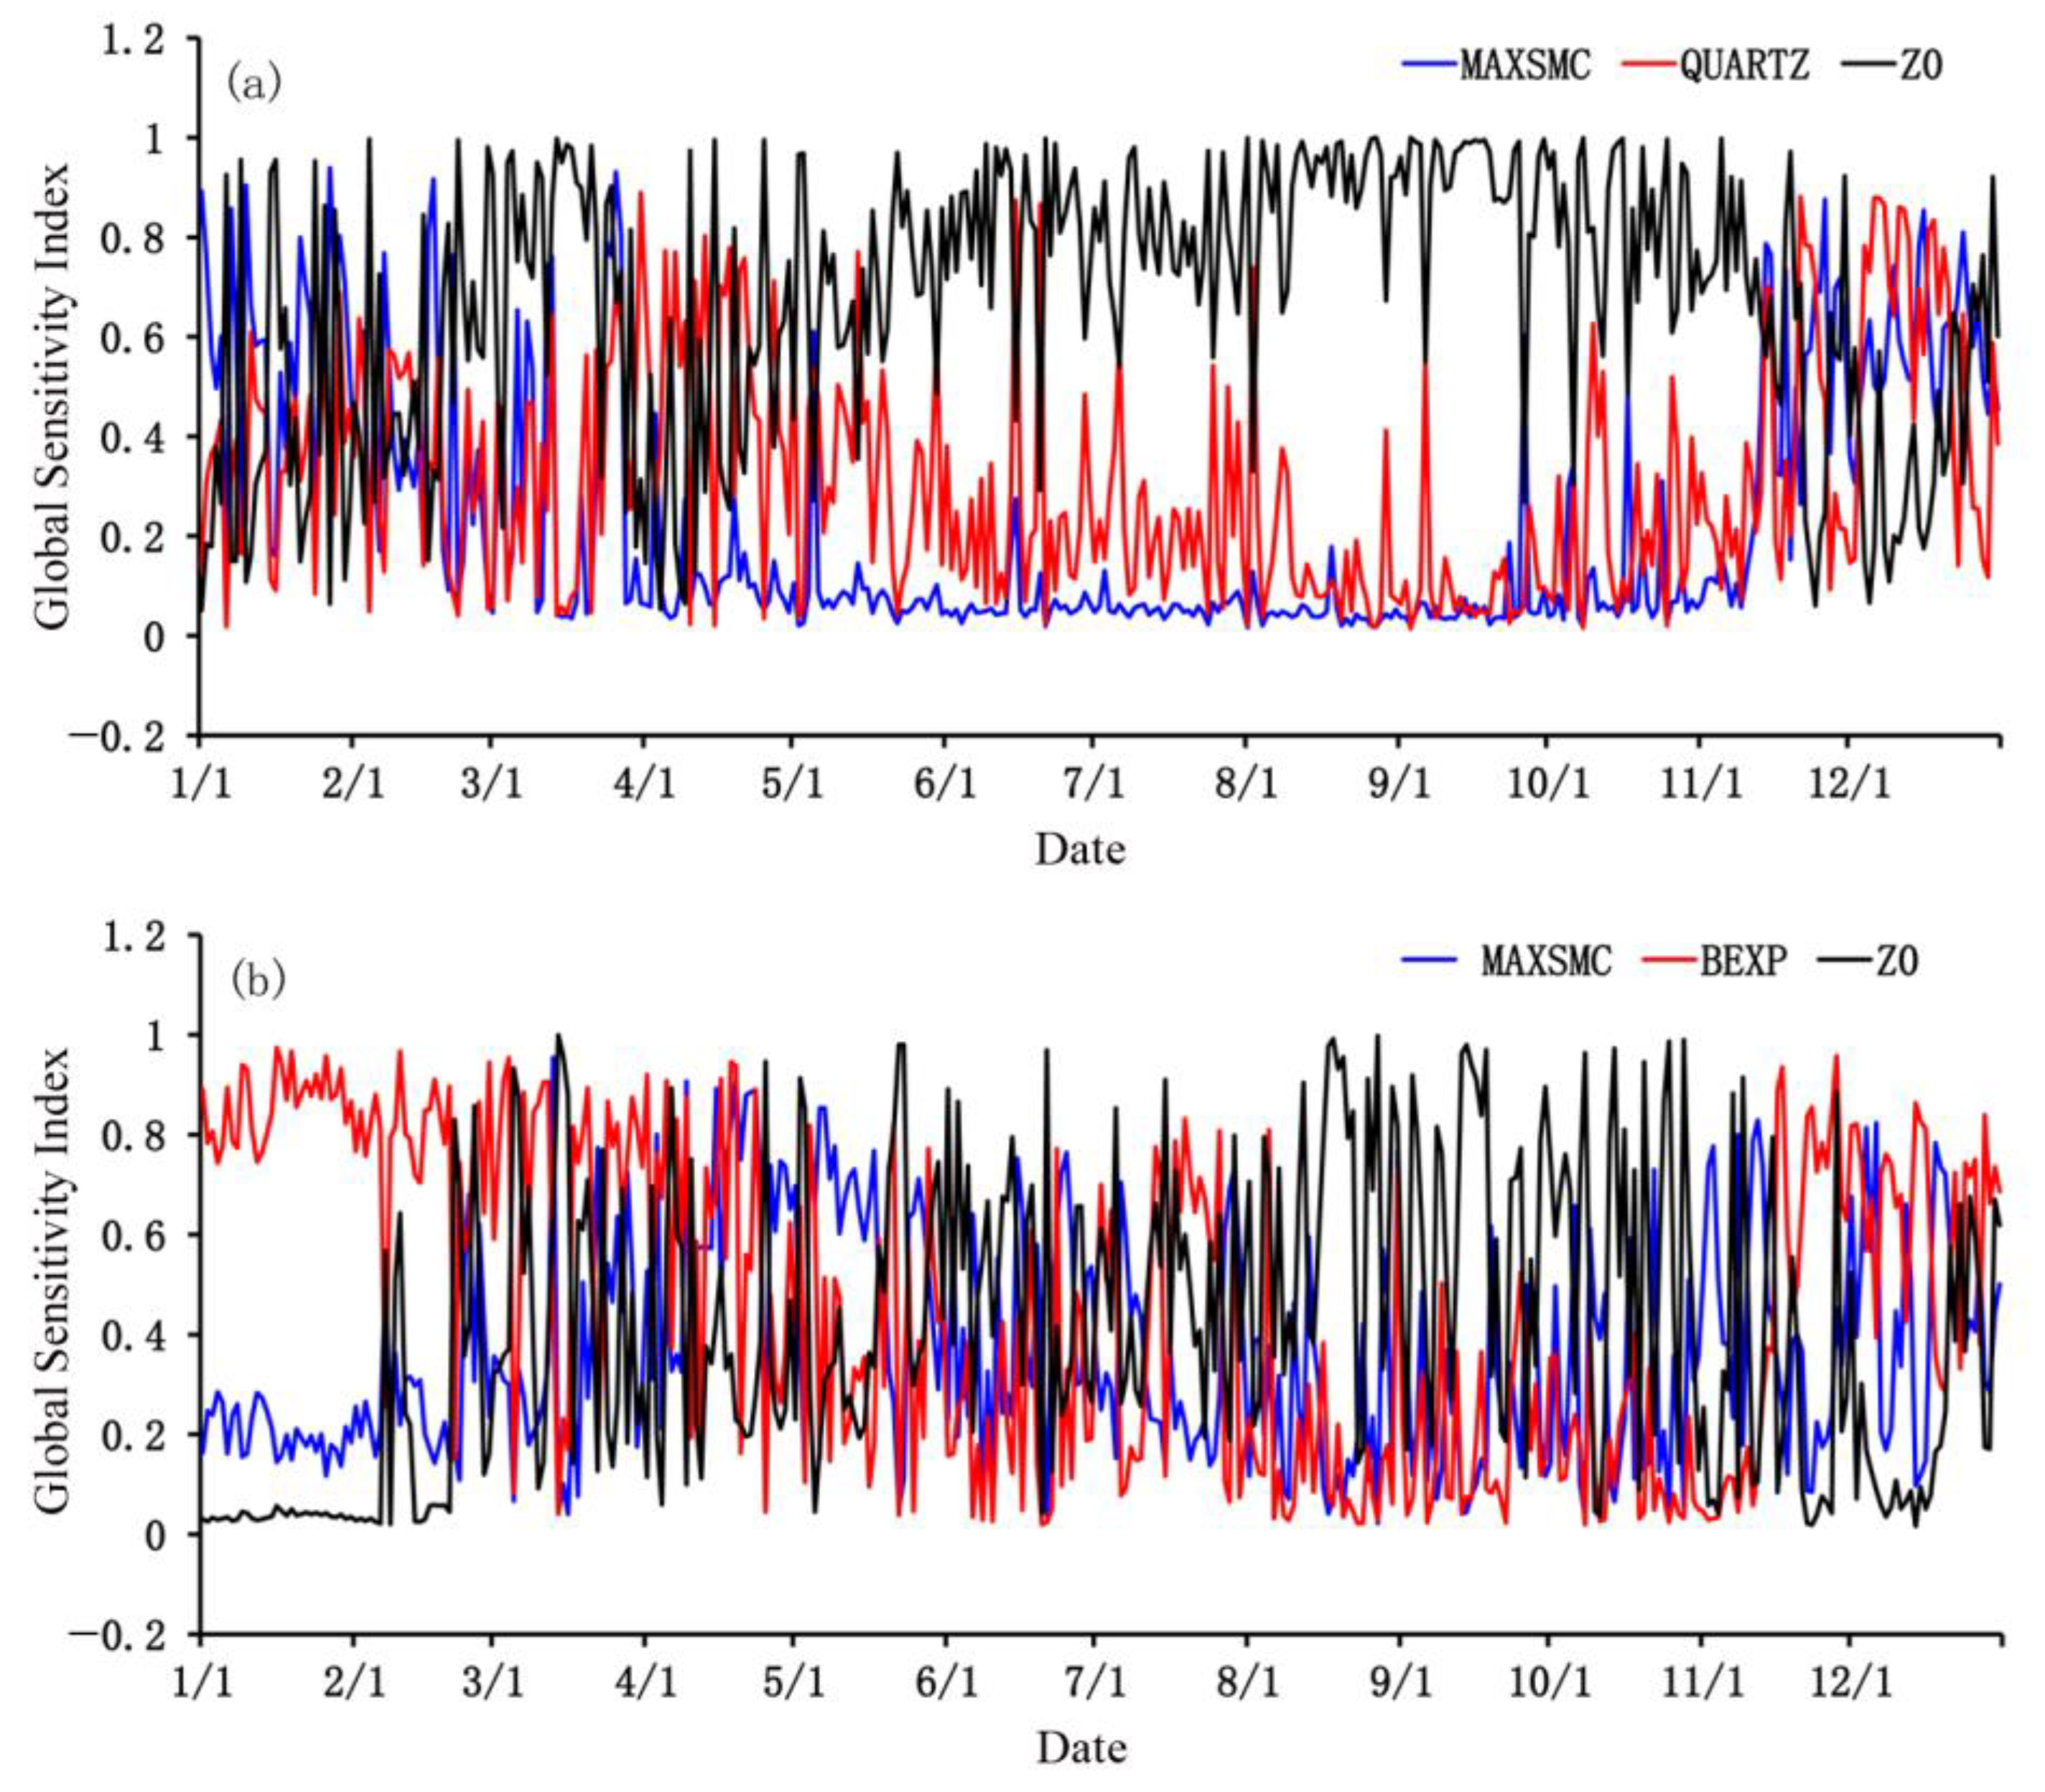
3.2.3. Annual Variation Characteristics of the Main Sensitivity Parameters

The annual variation characteristics of the main sensitivity parameters, MAXSMC, QUARTZ, BEXP, and Z0, that affect the sensible and latent heat fluxes were analyzed (Figure 7). As shown in Figure 7a, the sensitivities of the three most sensitive parameters that largely influenced the sensible heat flux varied greatly from late autumn to spring, but the differences between the three were not obvious. However, the sensitivity changes in the three parameters from late spring to autumn were smaller, and the differences between them were large. The sensitivity of MAXSMC was negligible, whereas Z0 maintained a high sensitivity. As shown in Figure 7b, the sensitivities of the three most sensitive parameters that largely influenced the latent heat flux varied greatly throughout the year, with discreet seasonal characteristics. However, the dominant positions of the three parameters in various periods differed. The sensitivity of BEXP from late autumn to spring was the highest, and that of Z0 was highest from late spring to autumn, whereas the sensitivity of MAXSMC was in the middle.

3.3. Sensitivity of the Land Surface Parameters in the Semi-Humid Region of the Loess Plateau

3.3.1. First-Order Sensitivity

The EFAST method was used to analyze the 2018 land surface parameters in Pingliang, located in a semi-humid area of the Loess Plateau. Sensible (Figure 8a) and latent (Figure 8b) heat fluxes were used as criteria to analyze the first-order sensitivities of 20 land surface parameters (Table 1). As shown in Figure 8a, the sensitivity parameters with the greatest influence on sensible heat flux were Z0, followed by QUARTZ, MAXSMC, and BEXP. The sensitivities of the other 16 parameters were low. The sensitivity of Z0 was more than twice that of the other major parameters. When the latent heat flux was used as the sensitivity criterion, BEXP had the highest sensitivity, followed by Z0, MAXSMC, and QUARTZ, while the other parameters had low sensitivities. Regardless of the use of sensible or latent heat flux as the sensitivity criterion, the main sensitivity parameters were Z0, QUARTZ, MAXSMC, and BEXP. However, Z0 had the highest sensitivity for the sensible heat flux and BEXP had the highest sensitivity for the latent heat flux.

3.3.2. Global Sensitivity

The global sensitivity analysis of the land surface parameters (Figure 9) revealed that the rankings of the parameters were consistent with that of the first-order sensitivity analysis with sensible heat flux as the criterion. In contrast, the sensitivity ranking of the parameters slightly differed compared with the latent heat flux. For example, the sensitivity of REFDK was higher than that of QUARTZ in the global sensitivity analysis, but the sensitivity degree of both parameters was higher than the first-order sensitivity. The sensitivities of REFDK and that of other parameters increased significantly in the global sensitivity analysis. Compared with the sensitivities of the parameters in Dingxi, the sensitivity rankings of the land surface parameters of Pingliang differed. This is mainly explained by the sensitivity of REFDK in the analysis at the Pingliang test station being higher than that of the Dingxi test station. This shows that the sensitivities of the land surface parameters slightly differed in different climatic regions.

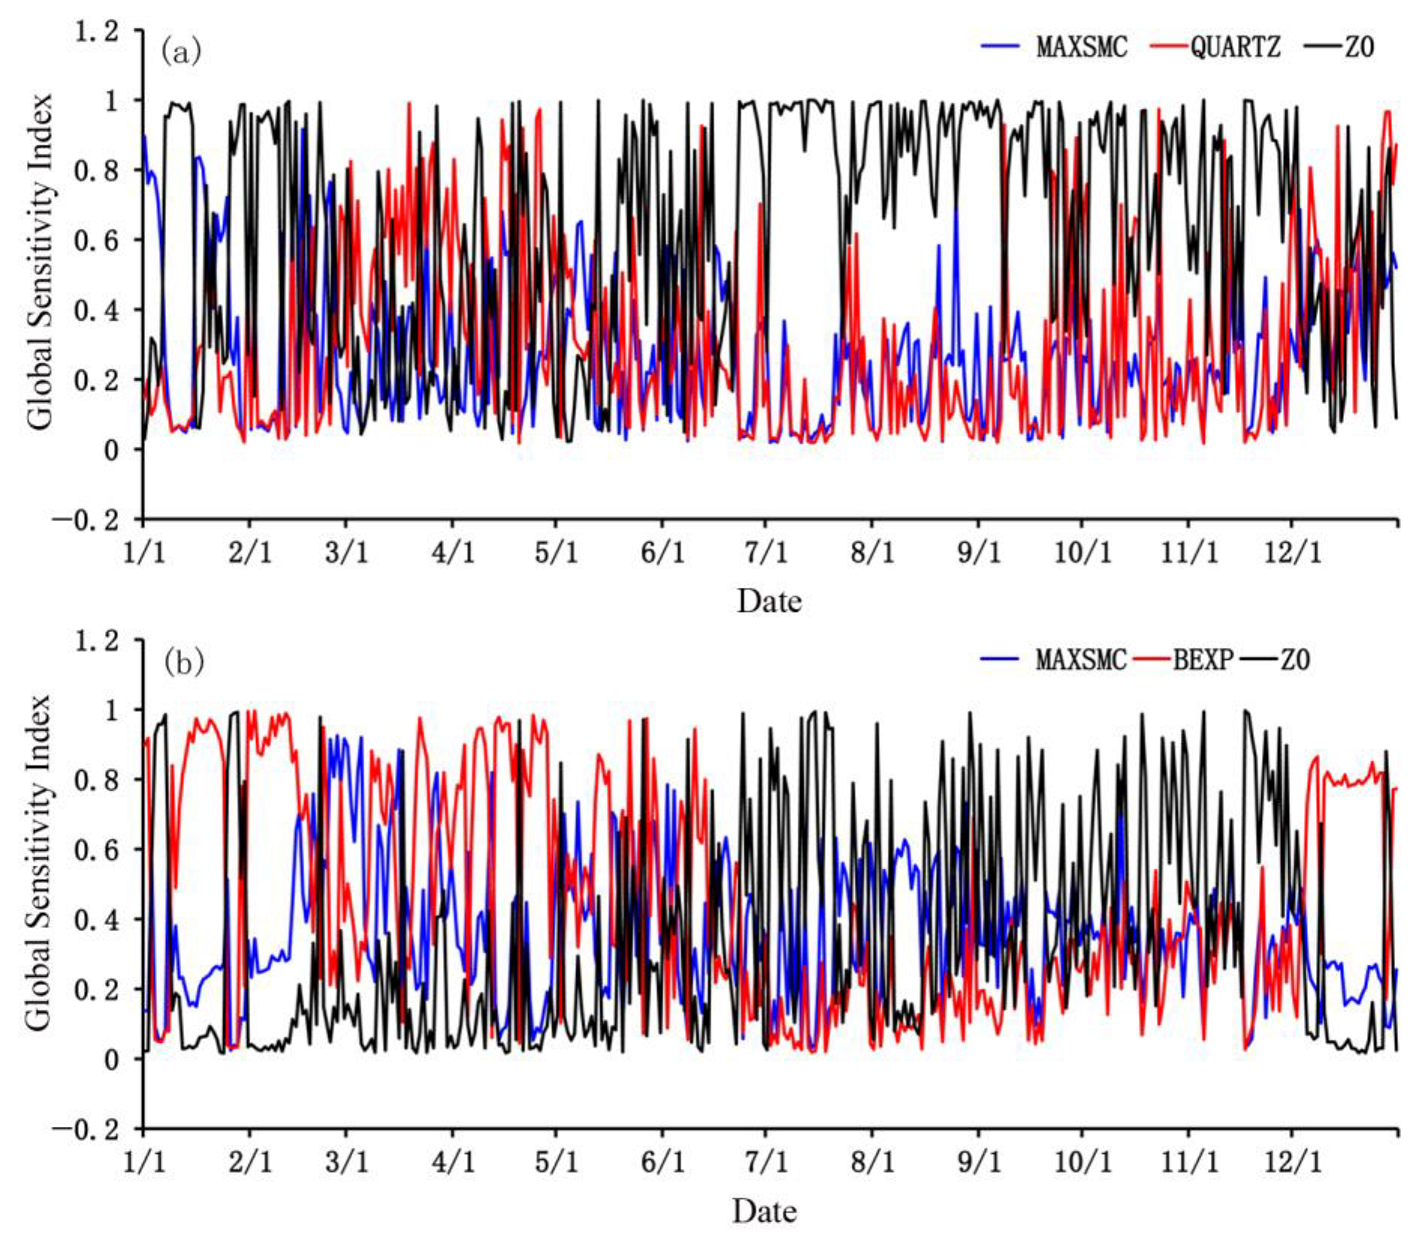
3.3.3. Annual Variation Characteristics of the Main Sensitivity Parameters

Analysis of the annual variation characteristics of the most sensitive land surface parameters (Figure 10) shows that Z0 was the primary parameter that affected the heat flux throughout the year. In contrast, the sensitivities of QUARTZ and MAXSMC were relatively small from July to September. Based on the sensitivities of the influencing parameters of the latent heat flux (Figure 10b), the land surface parameters varied in different periods, and their sensitivity ranking also changed. From July to November, Z0 dominated, whereas in the other months, BEXP dominated. When the sensitivity of Z0 was high, the sensitivity of BEXP was low. Conversely, when the sensitivity of BEXP was high, the corresponding sensitivity of Z0 was low. In summary, seasonal differences exist in the sensitivity of the land surface parameters.

3.4. Statistical Sensitivity Characteristics of the Land Surface Parameters in the Loess Plateau

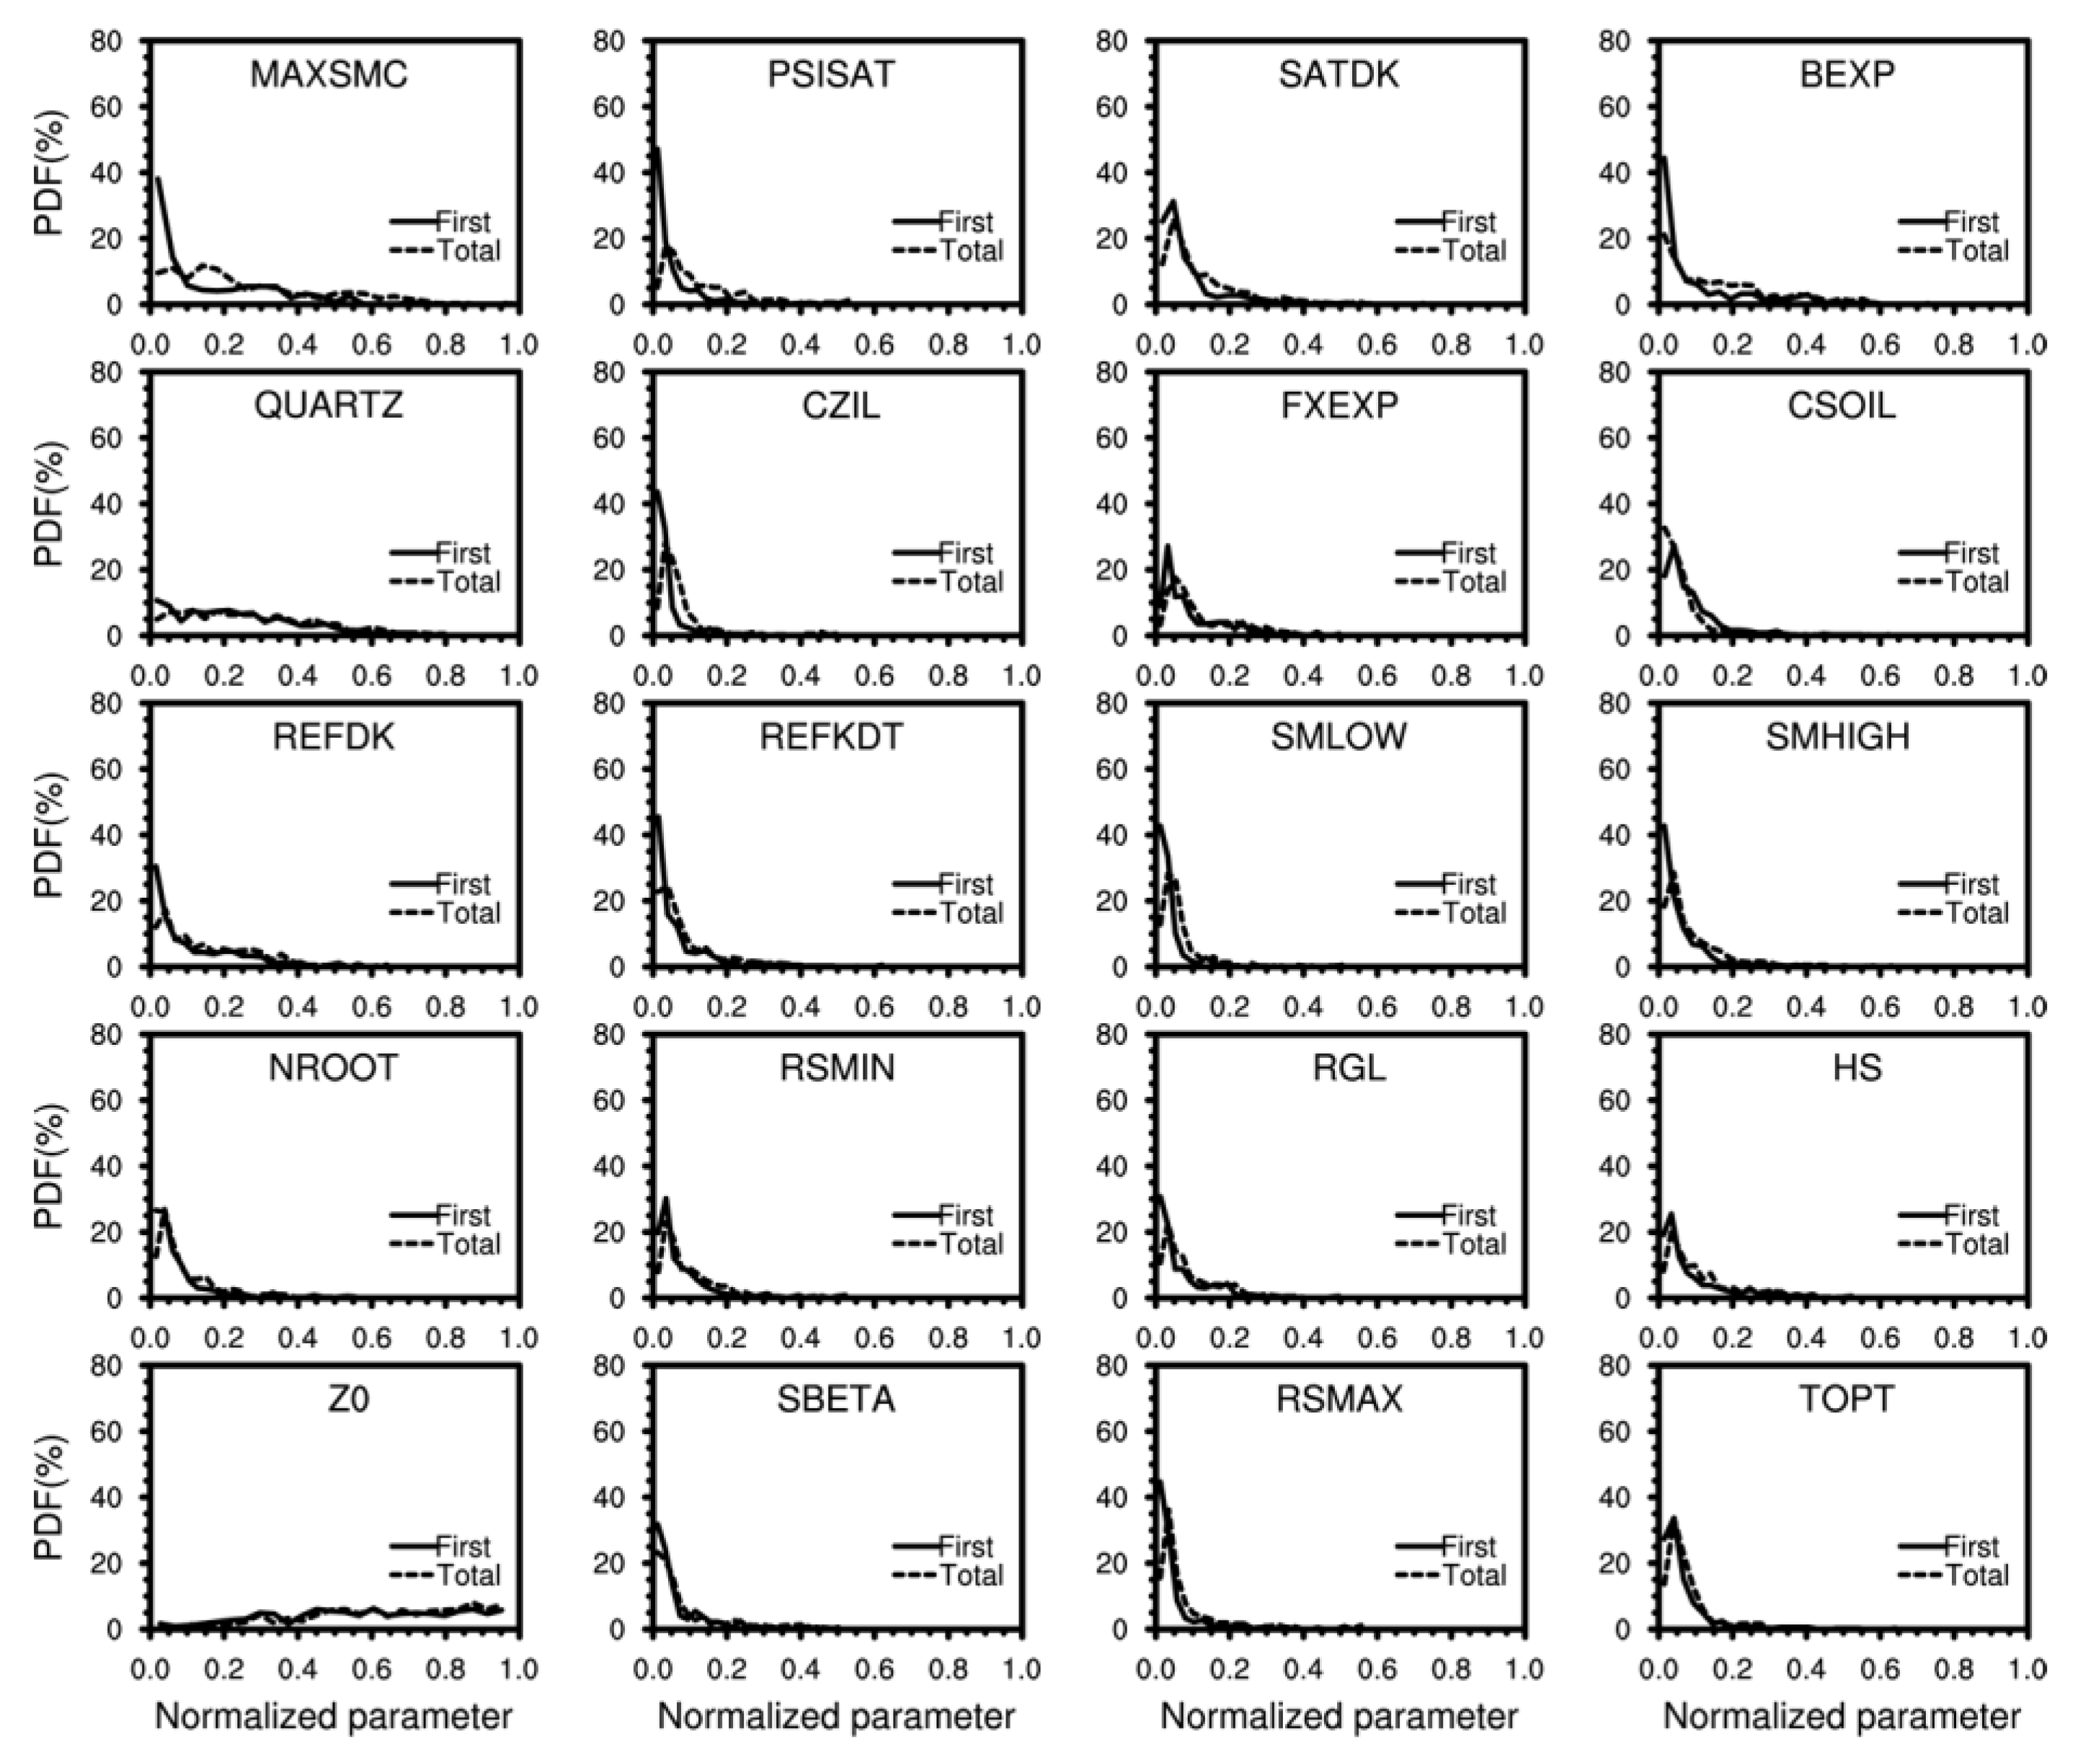
3.4.1. Sensitivity Probability Density Distribution of the Parameters

To analyze the sensitivity characteristics of the land surface parameters in the semiarid and semi-humid areas of the Loess Plateau, the parameter sensitivity results of the Dingxi and Pingliang experimental stations were averaged. Figure 11 shows the interval probability density distribution after normalizing the sensitivities of the land surface parameters with sensible heat flux as the criterion. The sensitivity probability density distributions of the other parameters were similar; that is, they were mainly distributed within 0–0.2 of the normalized value. When the probability density distributions of the first-order and global sensitivities were compared, the two exhibited similar distribution patterns. However, the global sensitivity probability density was slightly lower than that of the first-order sensitivity in each interval. Figure 12 shows the probability density distribution of the intervals after standardizing the sensitivities of the land surface parameters with latent heat flux as the criterion. As shown in Figure 12, the sensitivity probability density distribution patterns of MAXSMC, BEXP, Z0, and the other 17 parameters were consistent. The sensitivities of the first three parameters were almost evenly distributed in each interval. Conversely, the sensitivity probability density of the other 17 parameters was mainly distributed within 0–0.2 of the standardized value. The first-order sensitivity was consistent with the global sensitivity probability density distribution pattern. Comparing Figure 11 and Figure 12, different criteria altered the probability density distribution morphology of the sensitivity of each parameter. In particular, MAXSMC, BEXP, and Z0 had the largest morphological differences.

3.4.2. Cumulative Variance Contribution Rate of the Parameters

Figure 13 shows the cumulative variance distribution map of the normalized sensitivities of the land surface parameters of the Loess Plateau. When sensible heat flux was used as a criterion for sensitivity analysis, the first 11 of the 20 land surface parameters accounted for 80% of the explanatory variance. Conversely, the first 10 parameters accounted for 80% of the explanatory variance when the latent heat flux was used as the criterion. This shows that when the sensitivity analysis of 20 land surface parameters was conducted, the sensitivity degree of almost half of the parameters accounted for 80% of the sensitivity of all parameters. That is, the sensitivities of the first 10 parameters were high, and the sensitivities of the last 10 were small or negligible. When the sensible heat flux was used as the criterion for sensitivity analysis, the distribution of the variance contribution of the parameters of the Dingxi and Pingliang stations was consistent. However, when the latent heat flux was used, the sensitivity variance contribution varied between the two stations, especially from the second to eighth parameters. This indicates that compared with the sensible heat flux, the sensitivities of these seven parameters differed.

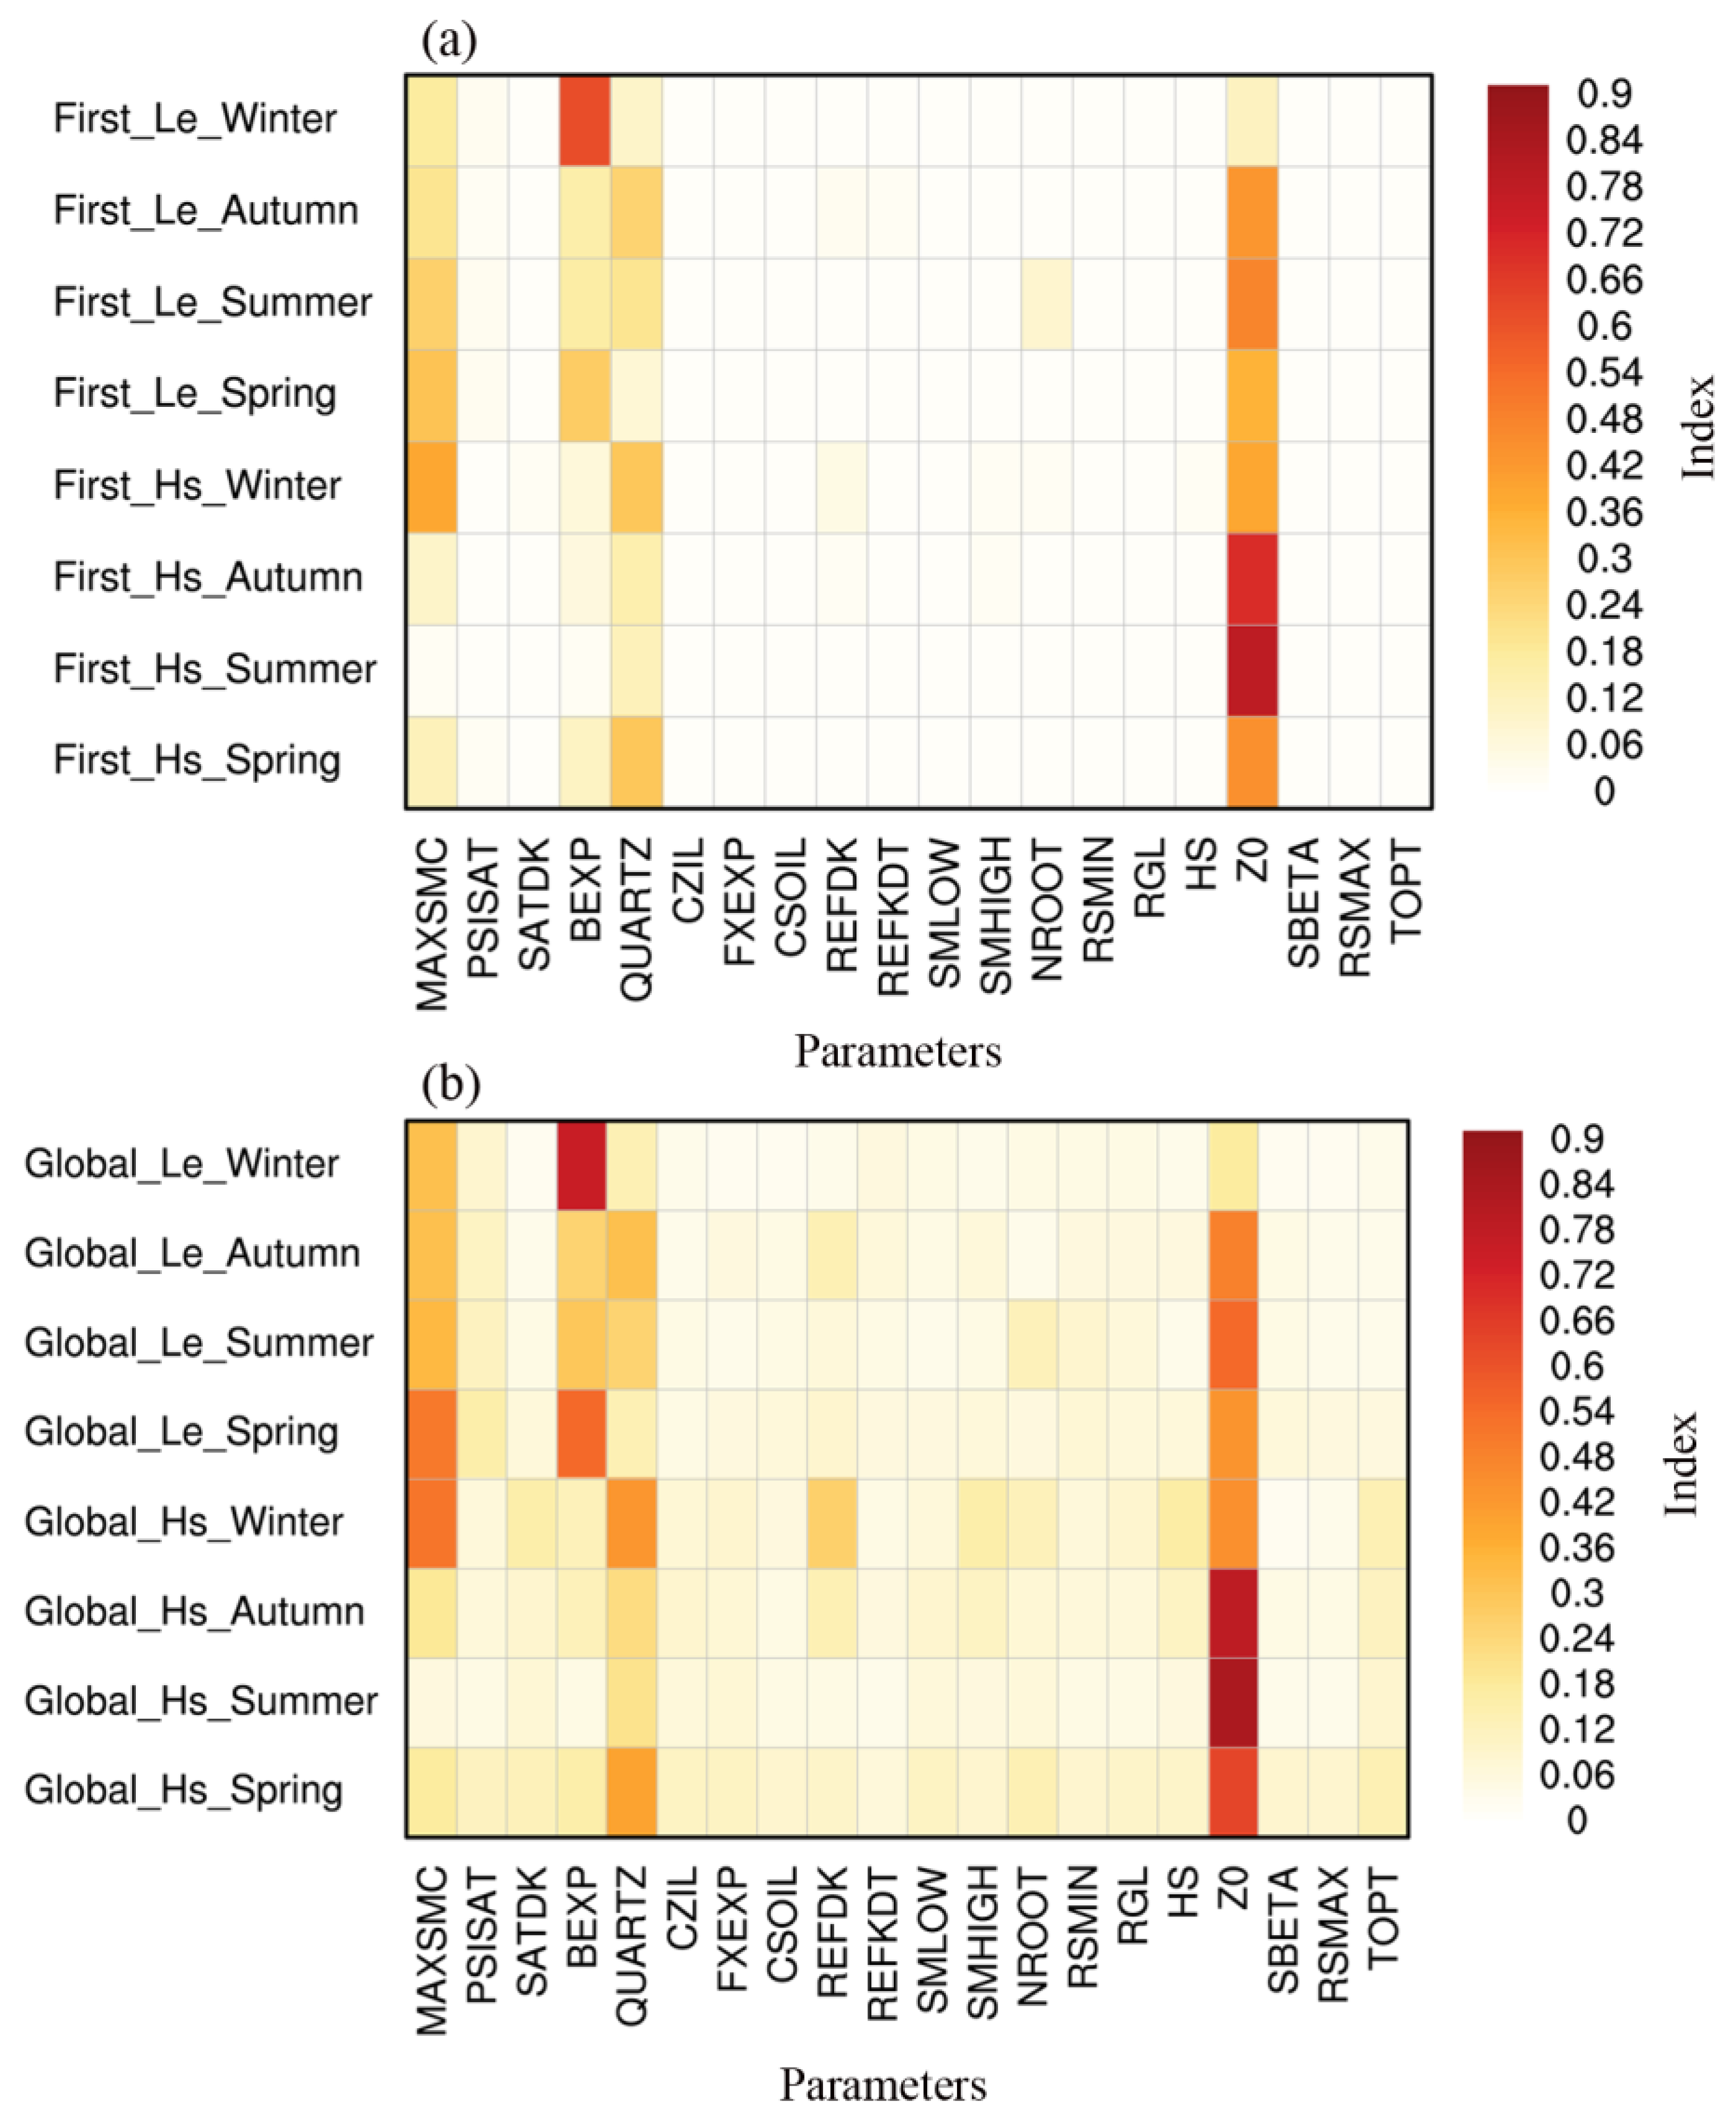
3.4.3. Seasonal Sensitivity Distribution Characteristics of the Parameters

The seasonal sensitivity distribution of the land surface parameters of the Loess Plateau is shown in Figure 14. It shows that the sensitivities of the different land surface parameters varied depending on the season, and that the seasonal sensitivity distribution was inconsistent with different criteria. When the sensible heat flux was used, Z0 had a high sensitivity in summer and autumn and a relatively low sensitivity in spring and winter. MAXSMC had a high sensitivity in winter and a low sensitivity in spring, summer, and autumn. BEXP had low sensitivity throughout the year, with the lowest in summer. QUARTZ had high sensitivity in spring and winter and low sensitivity in summer and autumn. When the latent heat flux was used, the seasonal sensitivity distribution of Z0 was consistent with that of the sensible heat flux. However, MAXSMC had high sensitivity in spring and low sensitivity in other seasons. BEXP had the highest sensitivity in spring and winter and the lowest sensitivity in summer and autumn. QUARTZ had high sensitivity in summer and autumn and lower sensitivity in spring and winter, opposite to the seasonal distribution of the sensible heat flux. While the seasonal distribution characteristics of the first-order (Figure 14a) and global (Figure 14b) sensitivities of the land surface parameters of the Loess Plateau were the same, the global sensitivity was significantly higher than the first-order sensitivity.

4. Discussion

Based on the sensitivity analyses of the land surface parameters of the Loess Plateau, the four parameters with the highest sensitivities were Z0, MAXSMC, QUARTZ, and BEXP. The influence mechanisms of these four parameters on the sensible and latent heat fluxes were analyzed. Theoretical analyses and numerical experiments have shown that the inhomogeneity of the surface parameters has an important impact on the calculation of the surface turbulent circulation [51]. The vegetation roughness can affect the aerodynamic impedance calculations, and the sensible heat flux can be estimated using the damping formula of the overall transmission. Thus, Z0 influences sensible and latent heat fluxes through aerodynamic impedance. The setting of the soil parameters affects the transmission of water and energy inside the soil and the exchange of water and energy between the soil and atmosphere, which then affects the sensible and latent heat fluxes. In particular, changes in the soil-saturated water content alter the surface water cycle, affecting the energy exchange between the atmosphere and land. A problem that has not been completely resolved is the influence of the land surface process parameter setting on the parameterization scheme. The individual influences of each parameter and their coupled influences on the land surface process are also yet to be addressed [23,24,52].
The main vegetation in the Dingxi and Pingliang experimental stations has obvious seasonal differences compared with the growth season. For example, there is basically no vegetation cover on the land after the harvest of autumn crops, making Z0 almost 0. In contrast, the vegetation grows vigorously in summer, with the vegetation height and the corresponding Z0 reaching maximum values. Therefore, Z0 and MAXSMC, as well as other parameters with seasonal characteristics, should vary in different seasons. However, seasonal changes were not distinguished in the model settings. This may lead to large seasonal differences in the model simulation results, especially in summer (Figure 5). Sensible and latent heat fluxes have large seasonal variation characteristics due to seasonal changes in precipitation [53]; therefore, the corresponding simulation error also has a large seasonal error. Future work must research the influence of different seasonal dynamic parameter settings on the model simulation results.
Sensible heat flux is the turbulent heat exchange between the atmosphere and the underlying surface caused by temperature changes; it is positively related to the surface temperature differences and wind speed [54,55]. The latent heat flux is the heat transport caused by the phase change of water in the atmosphere, which is positively related to precipitation and soil water content [56,57]. Based on Equation (1), the sensible heat flux has a close relationship with the wind speed. As the size of the land surface parameter Z0 directly affects the size of the ground wind speed, Z0 has a greater impact on the sensible heat flux. The calculation of the latent heat flux (Equation (2)) reveals that it has a close relationship with humidity. The other three highly sensitive parameters analyzed in this paper are related to soil structure, which in turn affects the soil’s water content; hence, they have a greater influence on the latent heat flux. In conclusion, the sensitivity order of the land surface parameters differs depending on the sensible heat and latent heat fluxes (Figure 5, Figure 6, Figure 8 and Figure 9).

5. Conclusions

In this study, the EFAST method was used to analyze the land surface parameters of different climatic regions in the Loess Plateau. The results were as follows:
(1)
With sensible and latent heat fluxes as the sensitivity criteria, the main land surface parameters were Z0, QUARTZ, MAXSMC, and BEXP. Comparing the global and first-order sensitivity analyses of the parameters obtained a similar order, but the global sensitivity values were numerically greater than the first-order sensitivity values. Moreover, the coupling effect between the parameters had a significant influence on their sensitivity analysis. Seasonal differences were observed in the sensitivities of land surface parameters, which were largely related to their attribute characteristics.
(2)
The first-order sensitivity had the same pattern as the global sensitivity probability density distribution. However, the global sensitivity probability density in each interval was slightly lower than the first-order sensitivity probability density. The sensitivities of the first three main parameters were almost evenly distributed in each interval, while the sensitivity probability densities of the other parameters were distributed within 0–0.2 of the standardized value. Almost half of the 20 land surface parameters accounted for 80% of the total sensitivity. The sensitivities of the first half were high, while the sensitivities of the latter parameters were negligible.
(3)
The sensitivities of different land surface parameters varied in different seasons, and their seasonal sensitivity distributions were inconsistent with varying criteria. Their sensitivities also fluctuated in different seasons due to the attribute characteristics of the parameters. Although Z0 occupied an absolutely dominant position in all four seasons, the position occupied by the spring QUARTZ could not be ignored, whereas the winter MAXSMC and QUARTZ had higher sensitivities.
The results of the land surface parameter sensitivity analyses were greatly influenced by the selected criterion; when the criterion differed, the obtained results also differed. Therefore, criterion selection is a key step in parameter sensitivity analysis. The sensitivities of land surface parameters also vary across different climatic regions. This study did not delve into the interplay of the land surface parameters or the intricate impact of coupled parameters on land surface processes. Therefore, future work should focus on the influence of coupling the land surface parameters of land surface processes in the Loess Plateau. The sensitivity parameters obtained in this paper will be optimized to improve the simulation performance of the Noah-MP model in the Loess Plateau.

Author Contributions

Conceptualization, Y.L. and C.G.; data curation, Y.L. and S.W.; formal analysis, Y.L.; funding acquisition, Y.L.; methodology, Y.L. and Y.R.; software, Y.L., C.G. and D.Z.; visualization, Y.L., D.Z. and X.L.; writing—original draft, Y.L.; writing—review and editing, Y.L. and S.W. All authors have read and agreed to the published version of the manuscript.

Funding

This research was financially supported by the Science and Technology Planning Project of Gansu Province (22JR5RA747) and the National Natural Science Foundation of China (41805079).

Institutional Review Board Statement

Not applicable.

Informed Consent Statement

Not applicable.

Data Availability Statement

Data not available due to legal restrictions and observation team requirements.

Acknowledgments

We are grateful to the Dingxi Arid Meteorology and Ecological Environment Experimental Station (DAMES) for providing observed land surface data for this study. We also thank the reviewers for their valuable comments.

Conflicts of Interest

The authors declare no conflict of interest.

References

  1. Jiang, X.; Niu, G.-Y.; Yang, Z.-L. Impacts of vegetation and groundwater dynamics on warm season precipitation over the Central United States. J. Geophys. Res. Atmos. 2009, 114, D06109. [Google Scholar] [CrossRef]
  2. Niu, G.-Y.; Yang, Z.-L.; Mitchell, K.E.; Chen, F.; Ek, M.B.; Barlage, M.; Kumar, A.; Manning, K.; Niyogi, D.; Rosero, E.; et al. The community Noah land surface model with multiparameterization options (Noah-MP): 1. Model description and evaluation with local-scale measurements. J. Geophys. Res. 2011, 116, D12109. [Google Scholar] [CrossRef]
  3. Taylor, C.M.; de Jeu, R.A.M.; Guichard, F.; Harris, P.P.; Dorigo, W.A. Afternoon rain more likely over drier soils. Nature 2012, 489, 423–426. [Google Scholar] [CrossRef] [PubMed]
  4. Dickinson, R.E. Land-atmosphere interaction. Rev. Geophys. 1995, 33, 917–922. [Google Scholar] [CrossRef]
  5. Sun, S. The Physical, Biochemical, Mechanisms and Parameterization Model of Land Surface Processes; Meteorological Press: Beijing, China, 2005. (In Chinese) [Google Scholar]
  6. Zeng, Q.; Zhou, G.; Pu, Y. Research on the Earth System Dynamic Model and Some Related Numerical Simulations. Chin. J. Atmos. Sci. 2008, 32, 653–690. (In Chinese) [Google Scholar] [CrossRef]
  7. Bonan, G.B. The land surface climatology of the NCAR land surface model coupled to the NCAR community climate model. J. Clim. 1998, 11, 1307–1326. [Google Scholar] [CrossRef]
  8. Kahan, D.S.; Xue, Y.; Allen, S.J. The impact of vegetation and soil parameters in simulations of surface energy and water balance in the semi-arid Sahel: A case study using SEBEX and HAPEX-Sahel data. J. Hydrometeorol. 2006, 320, 238–259. [Google Scholar] [CrossRef]
  9. Liu, S.; Wen, P.; Zhang, Y.; Hong, Z.; Hu, F.; Liu, H. Sensitivity tests of interaction between land surface physical process and atmospheric boundary layer. Acta Meteorol. Sin. 2001, 59, 533–548. (In Chinese) [Google Scholar]
  10. Gupta, H.V.; Bastidas, L.A.; Sorooshian, S.; Shuttleworth, W.J.; Yang, Z.L. Parameter estimation of a land surface scheme using multicriteria methods. J. Geophys. Res. 1999, 104, 19491–19503. [Google Scholar] [CrossRef]
  11. Bastidas, L.A.; Hogue, T.S.; Sorooshian, S.; Gupta, H.V.; Shuttleworth, W.J. Parameter sensitivity analysis for different complexity land surface models using multicriteria methods. J. Geophys. Res. Atmos. 2006, 111, 1–19. [Google Scholar] [CrossRef]
  12. Liu, H.; Tu, G.; Dong, W. Variation characteristics of surface albedo of different underlying surfaces in semi-arid region. Chin. Sci. Bull. 2008, 53, 1220–1227. (In Chinese) [Google Scholar]
  13. Yao, T.; Zhang, Q. Study on land-surface albedo over different types of underlying surfaces in North China. Acta. Phys. Sin. 2014, 63, 089201. (In Chinese) [Google Scholar] [CrossRef]
  14. Yang, K.; Koike, T.; Ishikawa, H.; Kim, J.; Li, X.; Liu, H.; Liu, S.; Ma, Y.; Wang, J. Turbulent flux transfer over bare-soil surfaces: Characteristics and parameterization. J. Appl. Meteorol. Climatol. 2008, 47, 276–290. [Google Scholar] [CrossRef]
  15. Lu, S.; Guo, W.; Ge, J.; Zhang, Y. Impacts of Land Surface Parameterizations on Simulations over the Arid and Semiarid Regions: The Case of the Loess Plateau in China. J. Hydrometeorol. 2022, 23, 891–907. [Google Scholar] [CrossRef]
  16. Sewall, J.O.; Sloan, L.C.; Huber, M.; Wing, S. Climate sensitivity to changes in land surface characteristics. Glob. Planet. Chang. 2000, 26, 445–465. [Google Scholar] [CrossRef]
  17. Firozjaei, M.K.; Kiavarz, M.; Alavipanah, S.K. Impact of surface characteristics and their adjacency effects on urban land surface temperature in different seasonal conditions and latitudes. Build. Environ. 2022, 219, 109145. [Google Scholar] [CrossRef]
  18. Geletič, J.; Lehnert, M.; Dobrovolný, P. Land Surface Temperature Differences within Local Climate Zones, Based on Two Central European Cities. Remote Sens. 2016, 8, 788. [Google Scholar] [CrossRef]
  19. Seneviratne, S.I.; Corti, T.; Davin, E.L.; Hirschi, M.; Jaeger, E.B.; Lehner, I.; Orlowsky, B.; Teuling, A.J. Investigating soil moisture—Climate interactions in a changing climate: A review. Earth Sci. Rev. 2010, 99, 125–161. [Google Scholar] [CrossRef]
  20. Li, Y.; Huang, C.; Lu, L. Global Sensitivity Analysis of SEBS Model Parameters based on EFAST Method. Remote Sens. Technol. Appl. 2014, 29, 719–726. (In Chinese) [Google Scholar] [CrossRef]
  21. Li, D.; Duan, Y.; Zhang, S.; Wen, X. Quantifying parameter sensitivity and calibration in simulating soil temperature and moisture. Chin. J. Atmos. Sci. 2015, 39, 991–1010. (In Chinese) [Google Scholar] [CrossRef]
  22. Rosero, E.; Yang, Z.; Wagener, T.; Gulden, L.E.; Yatheendradas, S.; Niu, G. Quantifying parameter sensitivity, interaction, and transferability in hydrologically enhanced versions of the Noah land surface model over transition zones during the warm season. J. Geophys. Res. 2010, 115, D03106. [Google Scholar] [CrossRef]
  23. Wang, J.-D.; Guo, W.-D.; Li, H.-Q. Application of extended Fourier amplitude sensitivity test (EFAST) method in land surface parameter sensitivity analysis. Acta Phys. Sin. 2013, 62, 050202. [Google Scholar] [CrossRef]
  24. Li, H. Applications of random balance design Fourier amplitude sensitivity test and extended Fourier amplitude sensitivity test in the parameter sensitivity analysis of land surface process model. Acta Phys. Sin. 2015, 64, 069201. (In Chinese) [Google Scholar] [CrossRef]
  25. Lohmann, D.; Lettenmaier, D.P.; Liang, X.; Wood, E.F.; Boone, A.; Chang, S.; Chen, F.; Dai, Y.; Desborough, C.; Dickinson, R.E.; et al. The project for intercomparison of land-surface parameterization schemes (PILPS) phase 2(c) Red-Arkansas River basin experiment: 3. Spatial and temporal analysis of water fluxes. Glob. Plan. Chang. 1998, 19, 161–179. [Google Scholar] [CrossRef]
  26. Henderson, S.A. The project for intercomparison of land-surface parameterization schemes. Bull. Am. Meteorol. Soc. 1993, 74, 1335–1348. [Google Scholar] [CrossRef]
  27. Li, D.; Zhang, S.; Duan, Y.; Cui, J. Calibration of parameters in soil moisture equation with shuffled complex evolution algorithm. Chin. J. Atmos. Sci. 2013, 37, 971–982. (In Chinese) [Google Scholar] [CrossRef]
  28. Perrin, C.; Michel, C.; Andréassian, V. Does a large number of parameters enhance model performance? Comparative assessment of common catchment model structures on 429 catchments. J. Hydrometeorol. 2001, 242, 275–301. [Google Scholar] [CrossRef]
  29. Ronda, R.J.; Hurk, J.M.; Holtslag, A.M. Spatial heterogeneity of the soil moisture content and its impact on surface flux densities and near-surface meteorology. J. Hydrometeorol. 2002, 3, 556–570. [Google Scholar] [CrossRef]
  30. Zhou, W.; Luo, Y.; Guo, P. A modified BATS and its off line experiments. J. Nanjing Meteorol. 2005, 28, 730–738. (In Chinese) [Google Scholar]
  31. Dai, Y.; Zeng, X.; Dickinson, R.E.; Baker, I.; Bonan, G.B.; Bosilovich, M.G.; Denning, A.S.; Dirmeyer, P.A.; Houser, P.R.; Niu, G.; et al. The Common Land Model. Bull. Am. Meteorol. Soc. 2003, 84, 1013–1023. [Google Scholar] [CrossRef]
  32. Song, Y. Comparison of Parameterization Schemes, Sensitivity Analysis and Optimization of Parameters in Land Surface Mode. Ph.D. Dissertation, Nanjing University, Nanjing, China, 2008. (In Chinese). [Google Scholar]
  33. Luo, S.; Lv, S.; Zhang, Y.; Hu, Z.; Ma, Y.; Li, S.; Shang, L. Simulation analysis on land surface process of BJ site of Central Tibetan Plateau using CoLM. Plateau Meteorol. 2008, 27, 259–271. (In Chinese) [Google Scholar]
  34. Chen, J.; Wen, J.; Wang, X.; Zhang, T.; Jia, D.; Zhou, J.; Wang, Z. Characteristics of water and heat exchanges and their crucial influencing factors on the alpine wetland during the warm season in the source region of the Yellow River. Chin. J. Atmos. Sci. 2017, 41, 302–312. (In Chinese) [Google Scholar] [CrossRef]
  35. Ma, X.; Zhang, Y.; Wu, T.; Song, M.; Wang, S. Effect of the root-water-uptake process parameterization schemes on the land-surface-process simulation in the Qinghai-tibet plateau. Chin. J. Atmos. Sci. 2020, 44, 211–224. (In Chinese) [Google Scholar] [CrossRef]
  36. Zhao, X.; Liu, C.; Tong, B.; Li, Y.; Wang, L.; Ma, Y.; Gao, Z. Study on surface process parameters and soil thermal parameters at Shiquanhe in the western Qinghai-Xizang plateau. Plateau Meteorol. 2021, 40, 711–723. (In Chinese) [Google Scholar] [CrossRef]
  37. Cheng, P.; Lv, S.; Sun, H.; Luo, J.; Xu, Y.; Tao, X.; Zhang, Y. Numerical simulation of the influence of soil gravel parameterization on the formation and development of a plateau vortex. Plateau Meteorol. 2022, 41, 391–403. (In Chinese) [Google Scholar] [CrossRef]
  38. Zhang, Q.; Li, H.; Zhang, L.; Yue, P.; Shi, J. Responses of the land-surface process and its parameters over the natural vegetation underlying surface of the middle of Gansu in loess plateau to precipitation fluctuation. Acta Phys. Sin. 2013, 62, 019201. (In Chinese) [Google Scholar] [CrossRef]
  39. Zheng, H.; Liu, S. Land surface parameterization and modeling over desert. Chin. J. Geophys. 2013, 56, 2207–2217. (In Chinese) [Google Scholar] [CrossRef]
  40. Zheng, Z.; Wei, Z.; Li, Z.; Wei, H.; Liu, H. Study of parameterization of surface albedo of bare soil over the Gobi desert in the Dunhuang region. Chin. J. Atmos. Sci. 2014, 38, 297–308. (In Chinese) [Google Scholar] [CrossRef]
  41. Chen, J.; Zuo, H.; Wang, Y.; Reng, P.; Wan, W.; Dong, L.; Wang, X. Parameterization scheme about albedo changing with solar altitude angle over different underlying surface in arid areas of northwest China. Plateau Meteorol. 2014, 33, 80–88. (In Chinese) [Google Scholar] [CrossRef]
  42. Sun, S.; Jin, J. Several problems in the study of land surface processes. J. Appl. Meteorol. 1997, 8, 50–57. (In Chinese) [Google Scholar]
  43. Ek, M.B.; Mitchell, K.E.; Lin, Y.; Rogers, E.; Grunmann, P.; Koren, V.; Gayno, G.; Tarpley, J.D. Implementation of Noah land surface model advances in the National Centers for Environmental Prediction operational mesoscale Eta model. J. Geophys. Res. Earth Surf. 2003, 108, 8851. [Google Scholar] [CrossRef]
  44. Yang, Z.-L.; Niu, G.-Y.; Mitchell, K.E.; Chen, F.; Ek, M.B.; Barlage, M.; Longuevergne, L.; Manning, K.; Niyogi, D.; Tewari, M.; et al. The community Noah land surface model with multiparameterization options (Noah-MP): 2. Evaluation over global river basins. J. Geophys. Res. Atmos. 2011, 116, D12110. [Google Scholar] [CrossRef]
  45. Ma, N.; Niu, G.-Y.; Xia, Y.; Cai, X.; Zhang, Y.; Ma, Y.; Fang, Y. A systematic evaluation of Noah-MP in simulating land-atmosphere energy, water, and carbon exchanges over the continental United States. J. Geophys. Res. Atmos. 2017, 122, 12245–12268. [Google Scholar] [CrossRef]
  46. Cukier, R.I.; Fortuin, C.M.; Shuler, K.E.; Petschek, A.G.; Schaibly, J.H. Study of the sensitivity of coupled reaction systems to uncertainties in rate coefficients. I Theory. J. Chem. Phys. 1973, 59, 3873–3878. [Google Scholar] [CrossRef]
  47. Saltelli, A.; Tarantola, S.; Chan, K.A. Quantitative model-independent method for global sensitivity analysis of model output. Technometrics 1999, 41, 39–56. [Google Scholar] [CrossRef]
  48. Simlab. Version 2.2. Simulation Environment for Uncertainty and Sensitivity Analysis. 2009. Available online: http://simlab.jrc.ec.europa.eu (accessed on 1 November 2019).
  49. Ye, D.; Zhang, S.; Wang, F.; Mao, F.; Yang, X. The applicability of different parameterization schemes in semi-arid region based on Noah-MP land surface model. Chin. J. Atmos. Sci. 2017, 41, 189–201. (In Chinese) [Google Scholar] [CrossRef]
  50. Zhang, G.; Zhou, G. Analysis on effect of the diurnal variation of sparse vegetation land surface albedo on flux simulation: Taking the sensible and latent heat fluxes in desert steppe o Inner Mongolia as a case. Plateau Meteorol. 2012, 31, 942–951. (In Chinese) [Google Scholar]
  51. Chen, B.; Xu, X.; Ding, Y.; Shi, X. The impact of heterogeneity of land surface roughness length on estimation of turbulent flux in model. Plateau Meteorol. 2010, 29, 340–348. (In Chinese) [Google Scholar]
  52. Song, Y.; Guo, W.; Zhang, Y. Simulation of latent heat flux exchange between land surface and atmosphere intemperate mixed forest and subtropical artificial coniferous forest sites in China by CoLM. Plateau Meteorol. 2008, 27, 967–977. (In Chinese) [Google Scholar]
  53. Chen, X.; Yu, Y.; Chen, J.; Li, Z.; Ma, C.; Xie, J. Seasonal variation of radiation and energy fluxes over the rain-fed cropland in the semi-arid area of Loess Plateau. Plateau Meteorol. 2016, 35, 351–362. (In Chinese) [Google Scholar] [CrossRef]
  54. Wang, X.; Yang, M.; Wan, G. Temporal-spatial distribution and evolution of surface sensible heat flux over Qinghai-Xizang Plateau during last 60 years. Plateau Meteorol. 2013, 32, 1557–1567. (In Chinese) [Google Scholar] [CrossRef]
  55. Yang, K.; Guo, X.; Wu, B. Recent trends in surface sensible heat flux on the Tibetan Plateau. Sci. China Earth Sci. 2011, 54, 19–28. (In Chinese) [Google Scholar] [CrossRef]
  56. Xie, J.; Yu, Y.; Liu, C.; Ge, J. Characteristics of surface sensible heat flux over the Qinghai-Tibetan Plateau and its response to climate change. Plateau Meteorol. 2018, 37, 28–42. (In Chinese) [Google Scholar] [CrossRef]
  57. Li, S.; Ai, L. Comparative analysis of surface energy fluxes over Sino-US semi-arid land. Plateau Meteorol. 2014, 33, 1262–1271. (In Chinese) [Google Scholar] [CrossRef]
Figure 1. Locations of the Dingxi and Pingliang experimental stations and the land use distribution of the study area.
Atmosphere 14 01528 g001
Figure 2. General scheme of the extended Fourier amplitude sensitivity test (EFAST) [47]. (D is the variance of the model.).
Atmosphere 14 01528 g002
Figure 3. Comparison of the observed (OBS) and simulated (MODEL). (a) Sensible and (b) latent heat fluxes in Dingxi in 2017.
Atmosphere 14 01528 g003
Figure 4. Comparison of observed and simulated (ad) soil temperature and (eh) soil moisture values in Dingxi in 2017.
Atmosphere 14 01528 g004
Figure 5. First-order sensitivity analyses of the land surface parameters in Dingxi in 2017. (a) Sensible and (b) latent heat fluxes.
Atmosphere 14 01528 g005
Figure 6. Global sensitivity analyses of the land surface parameters in Dingxi in 2017. (a) Sensible and (b) latent heat fluxes.
Atmosphere 14 01528 g006
Figure 7. Global sensitivity change characteristics of the key land surface parameters in Dingxi in 2017. (a) Sensible and (b) latent heat fluxes.
Atmosphere 14 01528 g007
Figure 8. First-order sensitivity analyses of the land surface parameters in Pingliang in 2018. (a) Sensible and (b) latent heat fluxes.
Atmosphere 14 01528 g008
Figure 9. Global sensitivity analyses of the land surface parameters in Pingliang in 2018. (a) Sensible and (b) latent heat fluxes.
Atmosphere 14 01528 g009
Figure 10. Global sensitivity variation characteristics of the key land surface parameters in Pingliang in 2018. (a) Sensible and (b) latent heat fluxes.
Atmosphere 14 01528 g010
Figure 11. Probability density distribution of the intervals after normalizing the sensitivity of each land surface parameter obtained using sensible heat flux of the Loess Plateau.
Atmosphere 14 01528 g011
Figure 12. Probability density distribution of the intervals after normalizing the sensitivity of each land surface parameter obtained using the latent heat flux of the Loess Plateau.
Atmosphere 14 01528 g012
Figure 13. Cumulative normalization sensitivity analysis of the land surface parameters.
Atmosphere 14 01528 g013
Figure 14. Seasonal sensitivity distribution characteristics of the land surface parameters of the Loess Plateau. (a) First-order and (b) global sensitivities.
Atmosphere 14 01528 g014
Table 1. Information of the observational data.
NameHeight
(m)
UnitTime Interval
(min)
Pressure2Kpa5
Wind speed10m/s5
Temperature2°C5
Relative humidity2%5
Precipitation2mm5
Downward shortwave radiation2W/m230
Downward longwave radiation2W/m230
Soil temperature−0.1, −0.2, −0.5, −1.0°C30
Soil moisture−0.1, −0.2, −0.5, −1.0m3/m330
Sensible heat flux2W/m230
Latent heat flux2W/m230
Table 2. Feasible ranges of the Noah multi-parameterization land surface model parameters that are considered in the sensitivity analysis.
ParameterDefaultMinMaxUnitDescription
MAXSMC0.4060.350.55m3 m−3Maximum volumetric soil moisture
PSISAT0.0980.010.65m m−1Saturated soil matric potential
SATDK7.22 × 10−60.1 × 10−60.1 × 10−5m s−1Saturated soil hydraulic conductivity
BEXP10.734.012.0-The “b” parameter
QUARTZ0.520.10.82-Quartz content
CZIL0.10.058-Zilintikevich parameter
FXEXP2.00.24-Bare soil evaporation exponent
CSOIL2.0 × 1061.26 × 1063.5 × 106J m−3 K−1Soil heat capacity
REFDK2.0 × 10−60.5 × 10−73.0 × 10−6 Used with REFKDT to compute runoff parameter KDT
REFKDT3.00.110 Surface runoff parameter
SMLOW0.50.011.0 Used to compute soil moisture wilting value
SMHIGH3.028 Used to compute soil moisture reference value
NROOT324-Root layers
RSMIN4040400s m−1Minimal stomatal resistance
RGL10030150 Radiation stress parameter used in Fx terms of canopy resistance
HS36.2536.2555 Coefficient of vapor pressure deficit term Fx in canopy resistance
Z00.140.011.0mRoughness length
SBETA−2.0−4−1-Used to compute canopy effect on ground heat flux
RSMAX5000200010,000s m−1Maximum stomatal resistance
TOPT298.0293303KOptimum air temperature for transpiration
Disclaimer/Publisher’s Note: The statements, opinions and data contained in all publications are solely those of the individual author(s) and contributor(s) and not of MDPI and/or the editor(s). MDPI and/or the editor(s) disclaim responsibility for any injury to people or property resulting from any ideas, methods, instructions or products referred to in the content.

