Article

Characterization of the Airborne Microbiome in Different Indoor and Outdoor Locations of a University Building Using an Innovative Compositional Data Analysis Approach

1
CEDAD-Centre of Applied Physics, Dating and Diagnostics, Department of Mathematics and Physics “Ennio de Giorgi”, University of Salento, Via per Arnesano, 73100 Lecce, Italy
2
National Institute of Nuclear Physics—Unit of Lecce (INFN), Via Monteroni, 73100 Lecce, Italy
3
Department of Biological and Environmental Sciences and Technologies, University of Salento, Via Monteroni, 73100 Lecce, Italy
*
Author to whom correspondence should be addressed.
Atmosphere 2023, 14(10), 1529; https://doi.org/10.3390/atmos14101529
Submission received: 13 July 2023 / Revised: 27 September 2023 / Accepted: 2 October 2023 / Published: 4 October 2023
(This article belongs to the Section Aerosols)

Abstract

:
In this work, we investigated the structure of the airborne bacterial community obtained by 16S rRNA gene sequencing performed on aerosol samples from different indoor and outdoor locations. The 48-h aerosol samples were collected in two laboratories, in the corridors, and on the roof of the Mathematics and Physics Department of the University of Salento (Italy). The investigation was carried out through the application of an innovative compositional data analysis approach, mainly based on a centered log-ratio transformation as a standardization procedure, the Aitchison distance for data ordination, and the principal component analysis via singular value decomposition for data clustering. This methodology allowed us to explore the main relationships among samples, identifying different results between indoor and outdoor samples both at the genus level and at the species level. Bacillus and Pseudomonas represented the most abundant genera identified in the analyzed samples. Out of the 21 identified bacterial species with the highest abundances in the collected aerosol samples, Acinetobacter lwoffii, Propionibacterium acnes, Diplorickettsia massiliensis, and Corynebacterium tuberculostearicum were the only four commonly classified as human opportunistic pathogens. Among the genera mostly associated with indoor environments, Hymenobacter and Arthrobacter could be noted as including many species that are unique in being radiation resistant.

1. Introduction

Considering the growing interest of the scientific community in the study of the relationships between bioaerosol particles and air quality in both indoor and outdoor environments, different applications of DNA-based methods have been recently developed to accurately examine and characterize the atmospheric microbiome [1]. In more detail, the bioaerosol concentration could be significantly higher in some indoor environments due to the presence of several sources of airborne microorganisms [2]. Therefore, particular attention should be devoted to testing the air quality inside various types of buildings and to studying how outdoor pollutants can affect the indoor environments while also focusing on the effects of the type of ventilation or air conditioning on indoor air quality, especially on the different bacterial components. To this end, Cichowicz and Dobrzanski [3] studied the relationships between indoor and outdoor air quality in a nine-story building in Lodz, Poland, including the effects of the height and the location of the building and the meteorological conditions, while Zhou et al. [4] investigated the connection between indoor and outdoor bioaerosols and collected some aerosol samples in a building in Beijing, China. Using these recent and innovative DNA-based techniques, several studies reported more accurate analyses on the structure of particulate matter (PM)-associated airborne bacteria communities at different taxonomic levels [5,6,7,8,9,10,11]. Although these DNA-based methods represent an important step for a more accurate investigation of the atmospheric microbiome, on the other hand, the analysis of large microbiome datasets such as those from the high-throughput sequencing (HTS) experiments presents many challenges. Among them, one of the main aspects currently addressed by the scientific community is the appropriate choice of the most suitable numerical tools to further summarize and explore the HTS data [12]. This is mainly due to the compositionality of such datasets, which means that they tend to be predefined or constrained to some constants, resulting in meaningless total values of the data. Indeed, in the HTS process, the observed number of reads (sequencing depth) strictly depends on the capacity of the machine (the selected sequencing platform) and on the number of samples that are multiplexed in the run [13,14]. Therefore, analyzing compositional data using standard techniques could be problematic. Consequently, the innovative compositional data analysis (CoDa) approach developed by Gloor et al. [13] (see Figure 2 of their work) can provide a valid solution in the analysis of this kind of data. The first step of this analysis workflow started with a centered log-ratio (CLR) transformation of the compositional dataset from HTS. As the second step, Gloor et al. [13] proposed the Aitchison distance that was selected as the most suitable choice for the clustering and ordination method. The third step of the developed workflow was a compositional principal component analysis (PCA) biplot via a singular value decomposition (SVD) of the CLR-based initial dataset, which will be used as the first exploratory tool [15]. Microbiome data have been previously investigated using the compositional SVD-PCA biplot in some works [16,17,18]. Consequently, considering the advantages introduced by the workflow developed by Gloor et al. [13] in the analysis of HTS data, we decided to use this compositional analysis methodology to investigate the 16S rRNA gene sequencing outputs from 18 aerosol samples collected at the Mathematics and Physics Department of the University of Salento in Lecce, Italy, in different indoor and outdoor environments. The normalization procedure of our initial dataset was based on the CLR transformation, the data ordination was performed using the Aitchison distance, and the data clustering was based on the compositional SVD-PCA biplot. The innovative compositional data approach was used to define the main structural characteristics of the airborne bacterial community profiles, both at the genus level and the species level. In addition, the selected methodology allowed us to explore the main relationships among taxa, among samples (also studying possible differences between indoor and outdoor samplings), and between taxa and samples, besides identifying some pathogenic bacterial species in the collected samples.

2. Materials and Methods

2.1. Methodology Adopted for Aerosol Detection

All the aerosol samples analyzed in this work were collected using a high-volume and dry-filter sampler called ACD-200 Bobcat (InnovaPrep, Drexel, MO, USA). A particular feature of this portable device is that it uses 52 mm diameter electret filters made up of dielectric polymer fibers. This type of filter allows for a high collection efficiency of airborne biological components, such as large viruses, bacteria, pollen, moulds, and fungal spores, with a size range between 0.1 and about 10 μm [19,20,21]. As suggested by King et al. [22], during the selected time intervals, we placed the device at a height of 50 cm above the floor. This particular height allowed us to minimize potential contamination due to the floor. More details on the main characteristics of the ACD-200 Bobcat device were provided by Bøifot et al. [23], while more details on the sampling methodologies applied in this work can be found in Perrone et al. [24]. Note that several recent studies presented some results obtained from aerosol samples collected by the ACD-200 Bobcat both in outdoor [25,26,27] and in indoor environments [28,29,30,31,32].

2.2. Procedure Adopted for DNA Extraction and 16S rRNA Gene Metabarcoding

DNA extraction was performed on each liquid solution obtained from the 18 aerosol samples collected on electret filters during the monitoring campaign. In more detail, each liquid solution was stored at −30 °C after the respective sampling period, and then DNA extraction was performed using the DNeasy PowerWater kit (Qiagen, Düsseldorf, Germany) according to the manufacturer’s recommendations. The high-throughput sequencing tests and the initial bioinformatics proofs on the DNA extracts were carried out by the company Genomix4life S.R.L. (Baronissi, Salerno, Italy). DNA quantity and quality were evaluated by the NanoDropOne spectrophotometer (Thermo Scientific, Waltham, MA, USA) and the Qubit Fluorometer 4.0 (Invitrogen Co., Carlsbad, CA, USA, respectively. Then, the following primers were adopted for the PCR amplification of the V3 and V4 regions within the 16S rRNA gene, Forward 5′-CCTACGGGNGGCWGCAG-3′ and Reverse 5′-GACTACHVGGG TATCTAATCC-3′ [33], while the 16S Metagenomic Sequencing Library Preparation (Illumina, San Diego, CA, USA) was exploited to assemble every PCR reaction. MiSeq platform (Illumina, San Diego, CA, USA) was operated to acquire sequences from pooled samples in a 2 × 250 paired-end format. The FASTQ software was lastly utilized for the final quality control of the produced raw sequences. The use of some negative controls confirmed the absence of contamination. The 16S Metagenomics app (Illumina, Version 1.1.0) based on the Ribosomal Database Project (RDP) classifier was consulted to execute the taxonomic classification of the amplicon 16S rRNA-gene reads [34]. More details on the procedures adopted both for DNA extraction and for 16S rRNA gene metabarcoding on the aerosol samples collected in this study can be found in Romano et al. [35,36].

2.3. Locations Selected for Air Sampling

Both indoor and outdoor aerosol samples examined in this study were collected at the Mathematics and Physics Department of the University of Salento (40.33° N; 18.11° E; 30 m a.s.l.) in a suburban site of the small city of Lecce, which is located in the south-eastern part of Italy, specifically on the flat Salento peninsula. The site is about 6 km from the city center and has characteristics similar to other coastal sites of the Central Mediterranean that are not affected by major sources of air pollution [37]. Therefore, the monitoring area can be associated with a large variety of aerosol particles such as mineral dust from the Sahara Desert (~1500 km away) and surrounding arid regions, polluted particles from urban and industrial areas of both Northern and Eastern Europe, sea salt and spray from the Mediterranean Sea itself or from the Atlantic Ocean, and biomass burning particles produced by forest fires, especially in summer [38].
The 18 aerosol samples investigated in this work were collected by means of the ACD-200 Bobcat from September 2020 to January 2021, as reported in Table 1. The samplings were performed on the first floor of the F2 building of the Mathematics and Physics Department, except for some outdoor samples that were collected on the department’s roof. The first floor is mainly intended for technical purposes, while the second floor hosts the teaching classrooms and the professors’ and students’ rooms. The height of the rooms and laboratories on the first floor is about 4 m. The F2 building selected for this study is surrounded by different green areas, and there is another university building at a distance of about 100 m. Within an area of 500 m starting from the F2 building, it is possible to find similar buildings with similar heights. In more detail, 13 out of the total 18 samples were collected in indoor environments: 4 samples in the High-energy laboratory (denoted by “AE”), 5 samples in the Electronics laboratory (denoted by “R”), and 4 samples in the corridors of the university department (denoted by “C”). The samplings lasted 48 h, starting at 12:00 UTC on each selected date. The AE laboratory was characterized by the continuous presence of 3 technicians during the working hours of the selected sampling intervals and presented an area of about 200 m2 with 3 high-volume devices that were continuously working during the measurements analyzed in this study. In addition, this laboratory is characterized by the presence of an old aeration system based on mechanical ventilation. The R laboratory was instead characterized by the stable presence of 5 technicians during the working hours of the selected time intervals. It presents an area of about 80 m2 with some low-volume devices that were working during the measurements. It is also characterized by the presence of a modern aeration system with air conditioning. The corridors of the selected university building present an area of about 80 m2, with a modern aeration system with air conditioning, and are generally frequented by numerous students, professors, and other university staff members. The remaining 5 samples were, instead, collected from outdoor environments, namely the department’s roof, and were denoted by “F”. A map of the selected sampling locations can be found in Supplementary Figure S1.

2.4. Procedures Used for Compositional Data Analysis Approach

In this study, all the statistical procedures used for the data analysis were based on the compositional data (CoDa) workflow developed by Gloor et al. [13]. Some of the authors of this manuscript have already applied the proposed workflow to characterize the microbiome identified in some aerosol samples collected in different departments of a hospital [24]. Therefore, the criteria adopted in this work to select the bacterial genera and species with the greatest number of reads in each sample in order to apply the CoDa analysis approach are the same as reported in Perrone et al. [24]. The first step of the selected workflow is based on a CLR (centered log-ratio) transformation [39] of the selected bacterial genus and species reads. More information about the properties of the CLR transformation was provided by Perrone et al. [24]. Since the CLR-transformed matrix of the dataset with all the selected bacterial genus and species reads cannot be calculated without changing each zero-count value, we used the approach developed by Martín-Fernandez et al. [40] as zero-count replacement procedure. Then, we used the R package heatmap function to plot the respective heatmaps of the CLR-transformed and zero-replaced initial datasets. The second step of the workflow developed by Gloor et al. [13] is represented by the calculation of the Aitchison distance (i.e., the Euclidean distance after CLR transformation of the initial data [41,42]) matrix among all the samples investigated in the study. Note that we used the unweighted pair-group average to plot the dendrograms based on the Aitchison distance matrix. The last step of the workflow used in this study was a principal component analysis (PCA) based on a singular value decomposition (SVD) of the CLR-transformed dataset. In more detail, the prcomp R function was adopted to perform the SVD-PCA exploratory data analysis and investigate the relationships between bacterial genera/species and samples. More details on this technique and an example of its usage can be found in Bian et al. [43] and in Perrone et al. [24].

3. Main Results

The bacterial community sampled in the selected indoor/outdoor environments of the Mathematics and Physics Department of the University of Salento in Lecce, Italy, was analyzed in this section both at the genus and at the species level, with the main goal of comparing the airborne microbiome from different locations and identify potential pathogens through an innovative analytical approach, as described in the previous section.

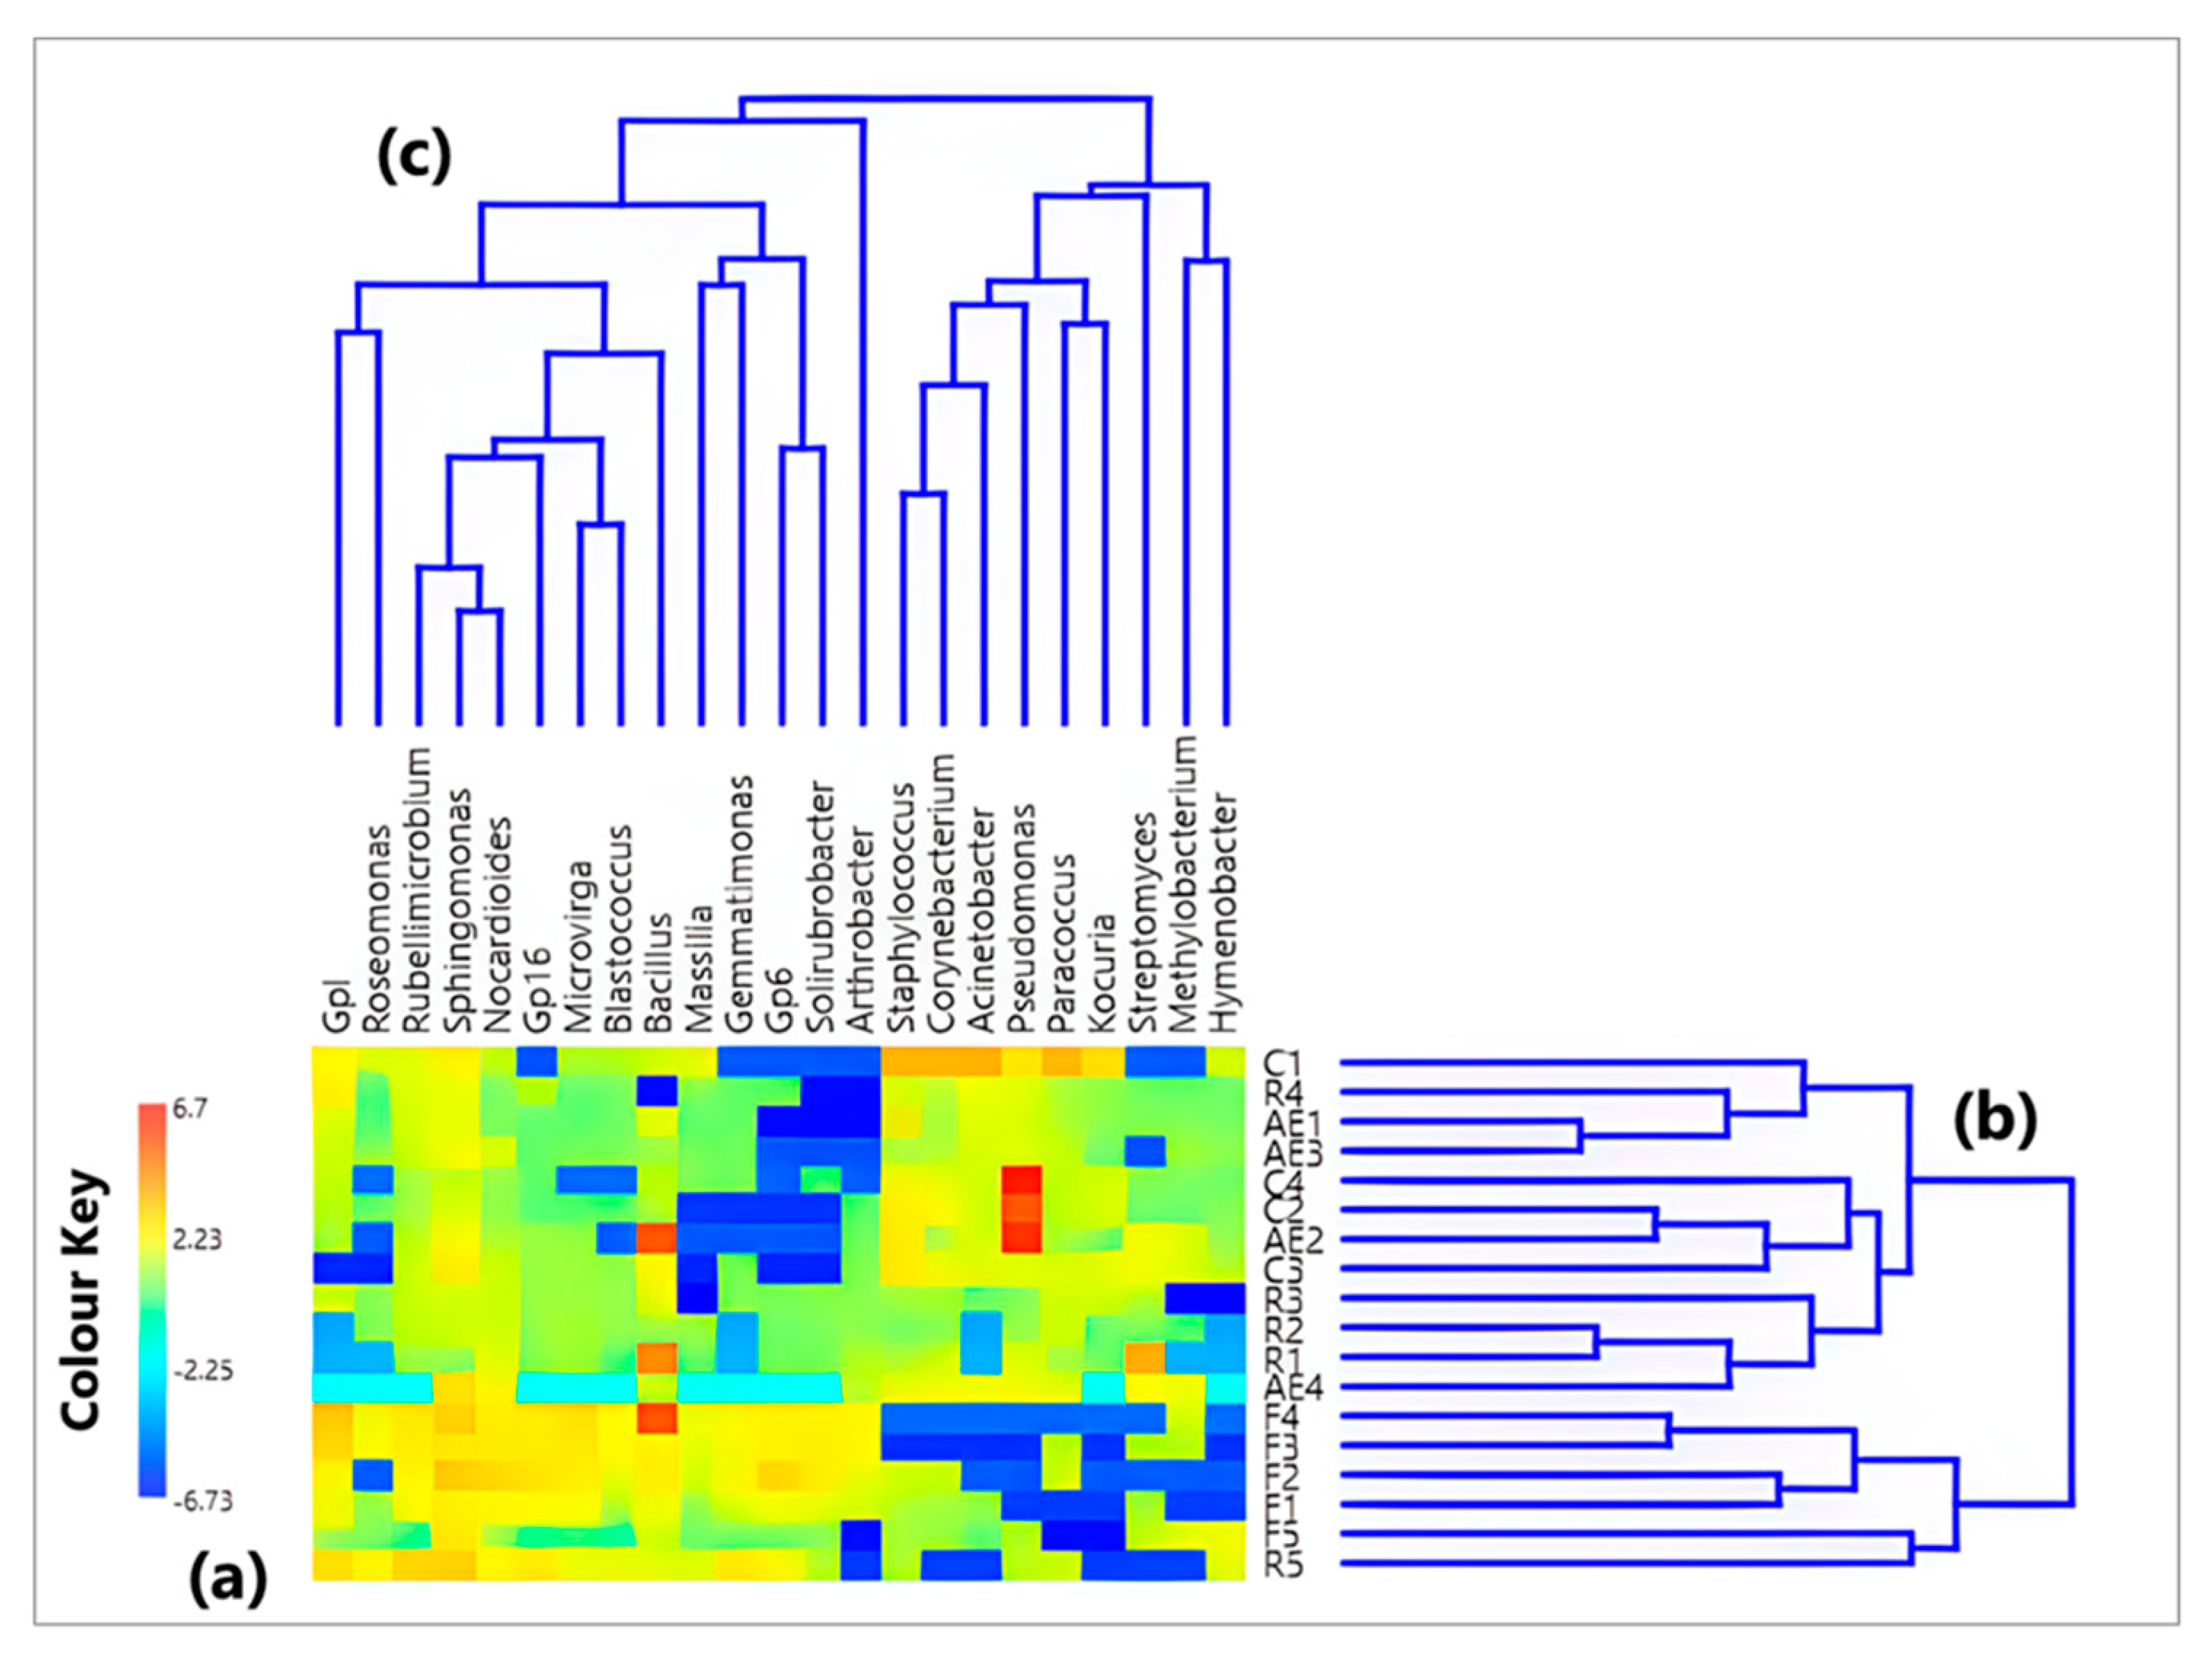
3.1. Characterization of the Bacterial Community at the Genus Level

Firstly, the CoDa methodology was applied to the 23 genera (out of 1932 in total) selected among those with the highest number of reads in each sample and common in at least 50% of the 18 detected samples. The corresponding numbers of identified genera and related reads are reported in Table 1. Figure 1a displays a color plot of the CLR heatmap of the 23 selected genera, which are listed in the figure in addition to the 18 samples where they were detected (see Supplementary Table S1 for the corresponding CLR values). The dendrograms of Figure 1b and c based on the Aitchison distances (reported in Table S2) give a first indication of the relationship between samples and between genera, respectively. The color plot of Figure 1a shows that the CLR value associated with each genus varies between samples because the sample taxonomic structure is strictly dependent on the sampling location. The highest CLR values were reached by two bacterial genera, i.e., Bacillus and Pseudomonas, in both indoor and outdoor samples. In more detail, Bacillus CLR values peaked in samples F4 (8 September 2020), R1 (10 September 2020), and AE2 (23 October 2020) from the roof, the Electronics, and the High-energy laboratories, respectively. On the other hand, Pseudomonas was the prevailing genus in AE2, as well as in two other indoor samples from the department corridor, C2 (collected on 4 November 2020) and C4 (collected on 9 November 2020). Moreover, Figure 1b identifies the two main sample clusters, one predominantly made up of samples from indoor locations (AE1, AE2, AE3, AE4, C1, C2, C3, C4, R1, R2, R3, and R4) and another one including the outdoor samples (F1, F2, F3, F4, and F5) in addition to R5, which was collected in the Electronics laboratory on 3 October 2020 but features a bacterial genus composition similar to that of the outdoor samples.
The exploratory study of the CLR-based genus dataset was also achieved by the SVD-PCA to define the relations among samples and among bacterial genera. SVD-PCA results are strictly related to the genera having the prevalent variation in the input dataset and permit the detection of the principal associations between samples and bacterial genera by linking score and loading plots, which are represented in Figure 2 by sample names (colors differ depending on the sampling location) and black arrows, respectively. In the loading plot of Figure 2, note that the distance from the origin and the direction of each arrow is proportional to the standard deviation of the related genus CLR value in each examined dataset [43]. In addition, the distance between two arrows is inversely proportional to their corresponding compositional association: the closeness between two arrows indicates that the related genera could have similar abundances within the closest samples. Indeed, the SVD-PCA was selected because it also represents the ideal analytical method when the number of input genera is higher than the related number of samples, as in our case the number of genera is equal to 23 and the number of samples equal to 18, respectively. The variance percentage explained by the first two PCA axes (42.90% and 15.88%, respectively) indicates an appropriate performance of this adopted procedure. The score plot (sample names) in Figure 2 first indicates that all five outdoor samples are on the right side of the first PCA axis, together with four out of five samples from the Electronics laboratory (R1, R2, R3, and R5), while the remaining samples on the left side of that axis are associated with indoor environments. Furthermore, the loading plot (arrows) in Figure 2 points out the rather diverse bacterial structure between the abovementioned sample groups: in particular, the genera mainly associated with the samples from the corridors and the High-energy laboratory, in addition to R4 from the Electronics laboratory (on the left side of the plot), are the ones including several human opportunistic pathogenic species (e.g., Corynebacterium, Acinetobacter, Staphylococcus, Pseudomonas and Paracoccus). As shown in Figure 1c, these five genera are highly interrelated since they belong to the same cluster. The color plot in Figure 1a also supports the fact that they are prevailing genera in samples from the corridors (especially C1) and the High-energy laboratory.

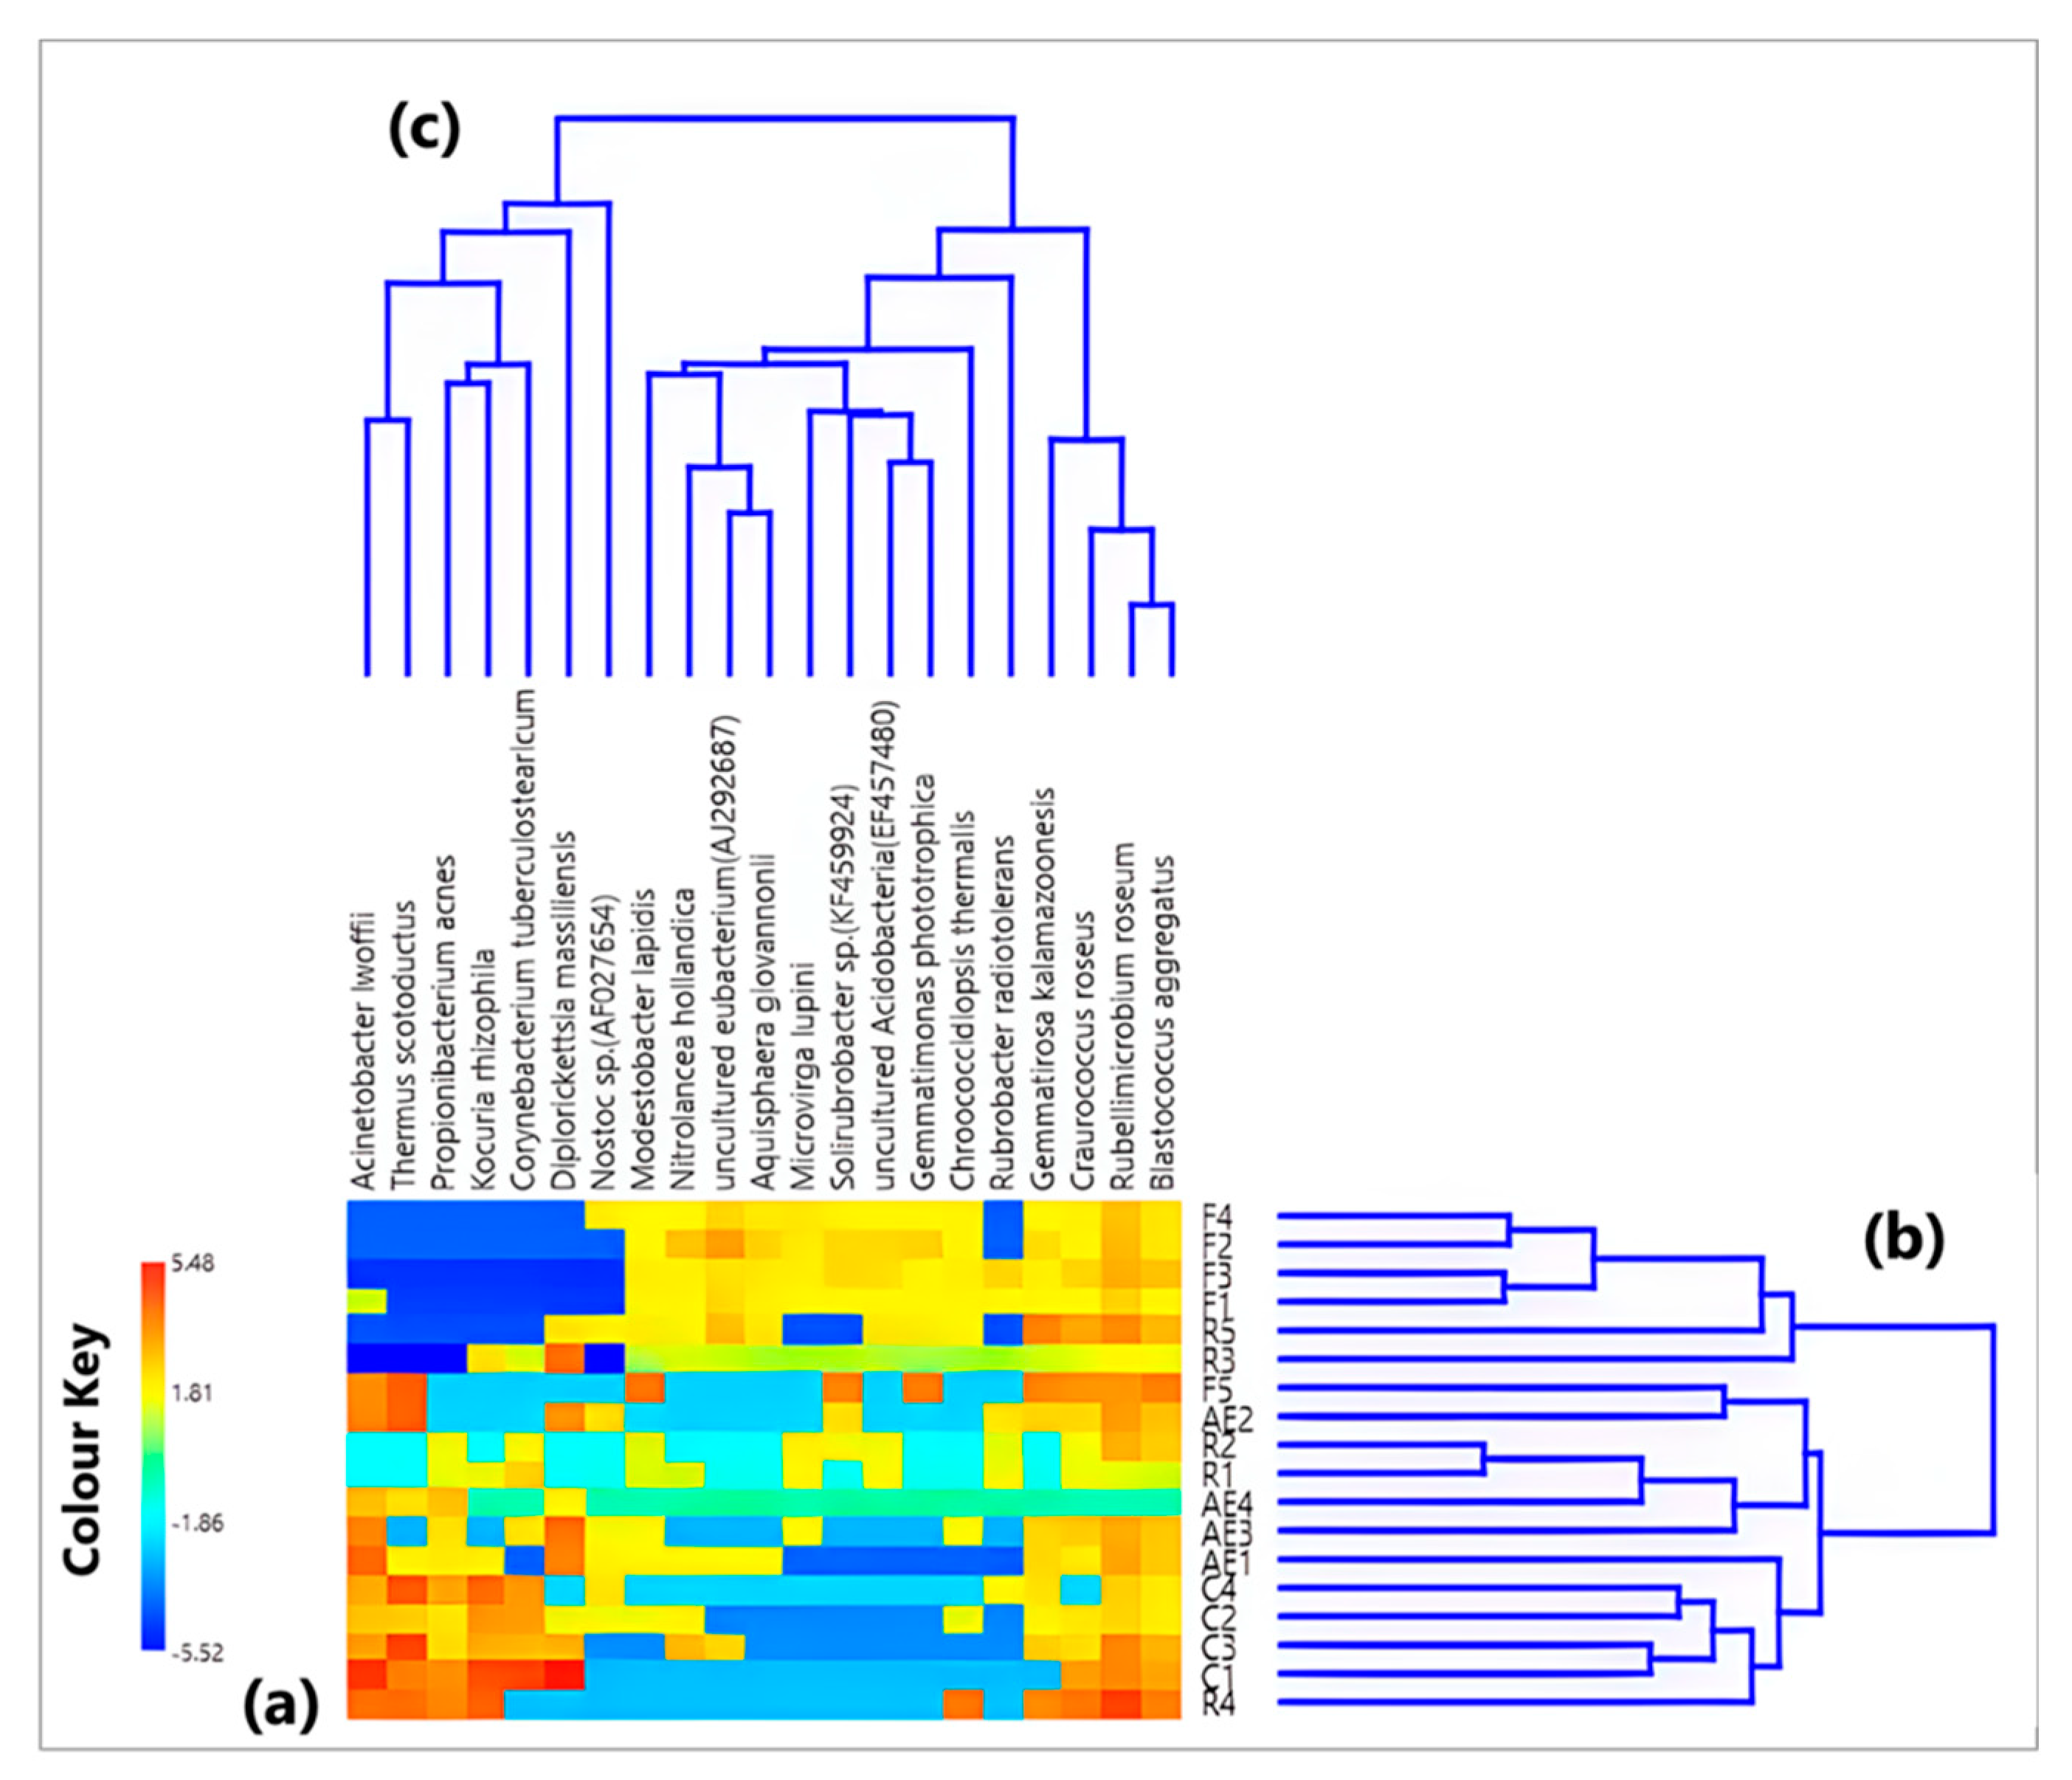
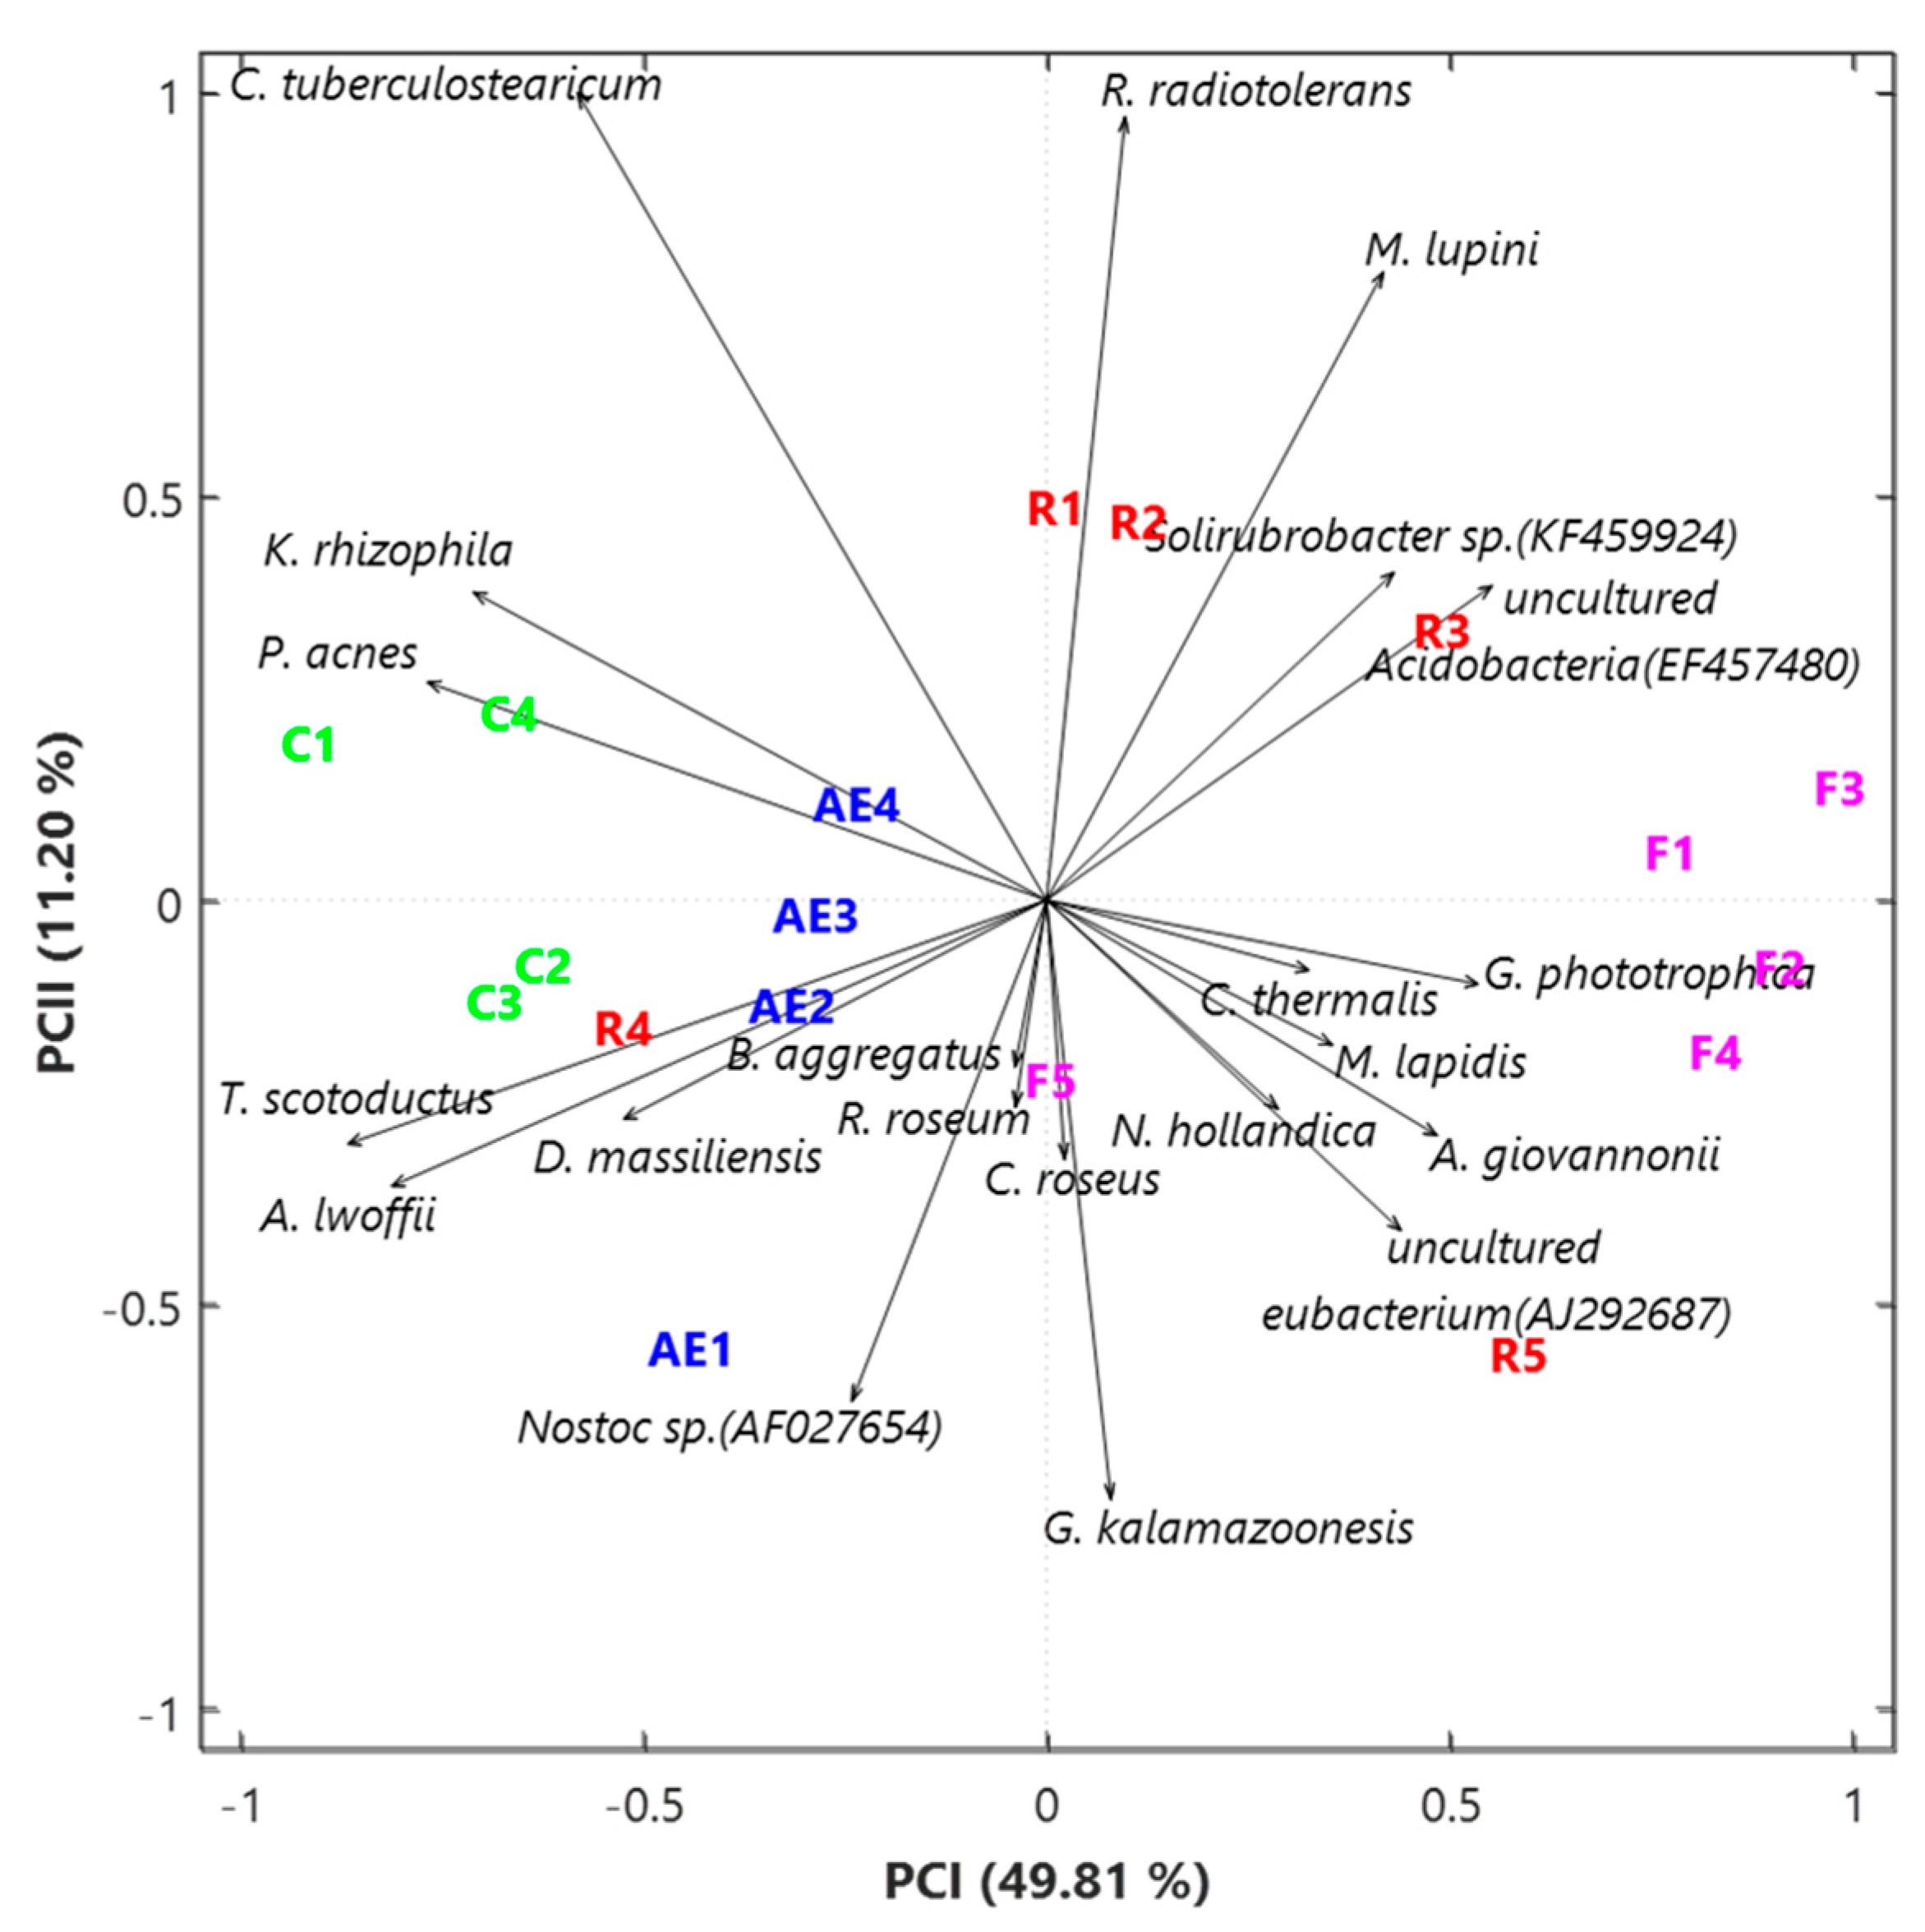
3.2. Characterization of the Bacterial Community at the Species Level

Twenty-one bacterial species (out of 5903 in total) were chosen among those characterized by the largest number of reads in every sample and detected at least in 40% of the 18 analyzed samples. The corresponding numbers of detected bacterial species and related reads are reported in Table 1. The heatmap plotted on the CLR values of the 21 selected species is displayed by a color plot in Figure 3a (see Supplementary Table S3 for the CLR values). Figure 3b,c, instead, show the Aitchison distance-based dendrograms to visualize the associations among the collected samples and among the analyzed species, respectively (the corresponding Aitchison distance matrix is reported in Table S4). Figure 3b allows us to identify two main clusters of samples, which are slightly different from those in Figure 1b, related to the bacterial genera (Section 3.1). Indeed, the first cluster is made up of four outdoor samples, F1, F2, F3, and F4, in addition to two samples collected in the Electronics laboratory (R3 and R5). Conversely, the second cluster includes the remaining outdoor sample F5 and R1, R2, and R4 from the Electronics laboratory, as well as the other eight indoor samples from the High-energy laboratory and the corridor.
Out of the 21 identified bacterial species with the highest abundances in the collected aerosol samples, Acinetobacter lwoffii, Propionibacterium acnes, Diplorickettsia massiliensis, and Corynebacterium tuberculostearicum represented the only four commonly classified as human opportunistic pathogens, according to the consulted databases and pathogen libraries, i.e., the EID2 (Enhanced Infectious Diseases) web-fronted relational database (https://eid2.liverpool.ac.uk/, accessed on 17 April 2023), the NCBI (National Center for Biotechnology Information) Taxonomy database (http://www.ncbi.nlm.nih.gov/taxonomy, accessed on 17 April 2023), and the NCBI Nucleotide database (http://www.ncbi.nlm.nih.gov/nuccore, accessed on 17 April 2023).
We used the application of the SVD-PCA to the CLR-based species dataset to explore how the 18 samples and the 21 species were related to each other. Figure 4 shows the PCA score (sample names in different colors depending on the sampling location) and loading plots (black arrows). The variance percentages explained by the first two PCA axes are 49.81% and 11.20%, respectively, which prove an appropriate performance of the selected method. Outdoor samples F1, F2, F3, and F4, together with R3 and R5 from the Electronics laboratory, are on the right half-plane of the SVD-PCA area in Figure 4, while all the remaining indoor samples are located on the left half-plane. The only exception is represented by the R1 and R2 samples that, in addition to the outdoor sample F5, are located very close to the first PCA axis. It is noteworthy that the four abovementioned human opportunistic pathogenic species are the main bacteria associated with the samples from indoor areas that are on the left side of the first PCA axis, as shown by the loading (arrows) plot in Figure 4. On the contrary, all the species associated with the four outdoor and two indoor samples on the right-side plane of the biplot are reportedly non-pathogenic species.

4. Discussion

In this section, we report a discussion about the most significant results obtained in this work. Regarding the characterization analysis of the bacterial community at the genus level, note that all the indoor samples (except R5) were included in the same cluster; therefore, the different aeration systems used in the selected environments did not present a significant effect on the bacterial communities at the genus level (see Section 3.1). Similar results were also reported by Zhou et al. [4] and by Perrone et al. [24]. In addition, among the genera mostly associated with indoor environments (in particular, the R and AE laboratories), Hymenobacter and Arthrobacter, which include many species that are unique in being radiation resistant, should be noted [44,45,46,47,48,49,50,51,52]. Then, regarding the characterization analysis of the bacterial community at the species level, observe from Figure 3b that all the indoor samples (except R3 and R5) were included in the same cluster; therefore, the different aeration systems in the selected environments did not also present a significant effect on the bacterial communities at the species level (see Section 3.2), which is analogous to what was found at the genus level.
Another interesting result of this work is related to the opportunistic pathogenic species: it is worth observing that all the four pathogenic species identified in this study and described in the following reached the highest CLR values (i.e., the highest abundances) in indoor samples.
Acinetobacter lwoffii is an opportunistic pathogen isolated in immunocompromised patients with a significant role in some nosocomial infections like septicaemia, pneumonia, and meningitis [53]. In more detail, we found its highest CLR values in samples AE1, R4, and, mainly, C1 collected on 2 November 2020 in the department corridor.
Propionibacterium acnes is particularly abundant in sample R4 (30 September 2020), in addition to some samples from the corridor, while it is characterized by lower CLR values in the High-energy laboratory. This species is a saprophyte of the skin, which generally has been implicated in acne inflammation and pathogenesis [54]. Currently, P. acnes, also known as Cutibacterium acnes [55], is emerging as an important opportunistic pathogen, and it is now the second most frequent pathogen after coagulase-negative staphylococci (CoNS), and rates of infection due to this bacterium have increased from 1.5 to 38% according to recent studies [56,57,58].
Diplorickettsia massiliensis, recently isolated from Ixodes ricinus ticks, has been proven via serological and molecular tests to cause infections in patients with suspected tick-borne diseases [59]. It represented the prevailing species in sample C1, but it also reached considerable abundances in AE1, AE2, AE3, and R3.
Corynebacterium tuberculostearicum generally represents a colonizer on the skin of hospitalized patients with potential risks of infections [60]. It was predominant in the samples from the corridor, particularly in C1, being less abundant in other indoor samples (apart from R1 and AE3).
This study has also revealed that the SVD-PCA biplot has noticeably demonstrated that the relations between bacterial species and samples are strictly dependent on the respective observing places. In fact, both the Aitchison distance-based dendrograms and the SVD-PCA biplot obtained from the bacterial genus dataset allowed us to identify two main sample clusters, one mostly made up of samples from indoor locations and another one including the outdoor samples in addition to a sample collected in the R laboratory with a bacterial genus composition similar to that of the outdoor samples. On the contrary, we obtained a different grouping of our samples through the analysis of the Aitchison distance-based dendrogram concerning the bacterial species dataset: the first cluster included four outdoor samples (F1, F2, F3, and F4) and two samples collected in the R laboratory (R3 and R5), while the second cluster included the remaining outdoor sample F5 and R1, R2, and R4 from the R laboratory, as well as the other eight indoor samples from AE laboratory and the corridors. Therefore, the grouping of the investigated samples was not significantly affected by the different aeration systems of the selected sampling locations.
Consistent with the SVD-PCA analysis at the genus level, the enrichment of radiation-resistant species, in particular, Rubrobacter radiotolerans (also known as Arthrobacter radiotolerans) [61] and Thermus scotoductus (phylum Deinococcota) [62], in addition to the above-cited Acinetobacter lwoffii [63], should also be noted in indoor environments (in particular, R and AE laboratories).

5. Conclusions

In this work, we characterized and discussed the main properties of the airborne bacterial community structure identified in different indoor/outdoor locations of a university building in Lecce, Italy. Considering the bacterial community profiles at both the genus and the species level, our main goal was to compare the airborne microbiome from different locations and identify potential pathogens using a recent analytical approach. According to the 16S rRNA gene metabarcoding results obtained in this study, Bacillus and Pseudomonas represented the bacterial genera with the highest abundances in both indoor and outdoor samples. We detected four bacterial species classified as human opportunistic pathogens among those with the highest abundances in the collected aerosol samples (Acinetobacter lwoffii, Propionibacterium acnes, Diplorickettsia massiliensis, and Corynebacterium tuberculostearicum). Moreover, among the taxa mostly associated with indoor environments, genera (Hymenobacter and Arthrobacter) and species (Rubrobacter radiotolerans, also known as Arthrobacter radiotolerans, Thermus scotoductus, and Acinetobacter lwoffii) that include strains that are extremely resistant to radiation should be noted. In more detail, we also proved that these human opportunistic pathogenic species presented the largest abundances in the indoor samples. The SVD-PCA biplot was also able to group pathogenic and non-pathogenic species in different clusters. In conclusion, the results obtained in this study clearly proved that both Aitchison distance-based dendrograms and SVD-PCA biplots could be significant tools in the characterization of airborne bacterial communities and can also provide an appropriate clustering of the samples based on their monitoring location.

Supplementary Materials

The following supporting information can be downloaded at https://www.mdpi.com/article/10.3390/atmos14101529/s1. Figure S1: A picture of the F2 building of the Mathematics and Physics Department of the University of Salento in Lecce (Italy) selected for the sampling campaign is reported. Table S1: Heatmap of the 23 selected bacterial genera as a function of the analyzed samples; Table S2: Aitchison distance matrix for the 23 selected bacterial genera; Table S3: Heatmap of the 21 selected bacterial species as a function of the analyzed samples; Table S4: Aitchison distance matrix for the 21 selected bacterial species.

Author Contributions

Conceptualization, M.F. and S.R.; methodology, M.F., S.R., D.P., A.T. and A.B.; software, M.F. and S.R.; formal analysis, M.F., S.R., D.P., A.B. and A.T.; investigation, M.F., S.R., D.P. and A.T.; resources, M.F., S.R. and D.P.; data curation, M.F., S.R., D.P. and A.T.; writing—original draft preparation, M.F. and S.R.; writing—review and editing, M.F., S.R., A.T. and P.A.; supervision, S.R., P.A., G.Q. and L.C.; project administration, S.R., G.Q. and L.C.; funding acquisition, S.R. and L.C. All authors have read and agreed to the published version of the manuscript.

Funding

M. Fragola carried out this work with the support of a PhD fellowship from Regione Puglia (FSE-2020)—CUP: F88D19002400002. D. Peccarrisi carried out this work with the support of a fellowship financed by the Italian “PON Ricerca e Innovazione 2014–2020” within the framework of the Project CIR01_00015_464576. The work was supported by the INFN (Istituto Nazionale Fisica Nucleare) of Italy, within the framework of the projects IS-ABS (Integrated System for Aerosol and Bioaerosol Studies at the Pierre Auger Observatory) and AT-SVB (Airborne Transmission of SARS-CoV-2, Viruses, and Bacteria in workplaces); by the Project PER-ACTRIS-IT Enhancement of the Italian Component of the Aerosol, Clouds, and Trace Gases Research InfraStructure (PIR01_00015); and by the Project ANTHEM (AdvaNced Technologies for HumancentrEd Medicine) funded by MUR (D.D. n. 931/2022).

Institutional Review Board Statement

Not applicable.

Informed Consent Statement

Not applicable.

Data Availability Statement

Data are contained within the article or in the Supplementary Materials.

Conflicts of Interest

The authors declare no conflict of interest.

References

  1. Fröhlich-Nowoisky, J.; Kampf, C.J.; Weber, B.; Huffman, J.A.; Pöhlker, C.; Andreae, M.O.; Lang-Yona, N.; Burrows, S.M.; Gunthe, S.S.; Elbert, W.; et al. Bioaerosols in the earth system: Climate, health, and ecosystem interactions. Atmos. Res. 2016, 182, 346–376. [Google Scholar] [CrossRef]
  2. Prussin, A.J.; Marr, L.C. Sources of airborne microorganisms in the built environment. Microbiome 2015, 3, 78. [Google Scholar] [CrossRef]
  3. Cichowicz, R.; Dobrzanski, M. Indoor and Outdoor Concentrations of Particulate Matter and Gaseous Pollutants on Different Floors of a University Building: A Case Study. J. Ecol. Eng. 2021, 22, 162–173. [Google Scholar] [CrossRef]
  4. Zhou, F.; Niu, M.; Zheng, Y.; Sun, Y.; Wu, Y.; Zhu, T.; Shen, F. Impact of outdoor air on indoor airborne microbiome under hazy air pollution: A case study in winter Beijing. J. Aerosol Sci. 2021, 156, 105798. [Google Scholar] [CrossRef]
  5. Innocente, E.; Squizzato, S.; Visin, F.; Facca, C.; Rampazzo, G.; Bertolini, V.; Gandolfi, I.; Franzetti, A.; Ambrosini, R.; Bestetti, G. Influence of seasonality, air mass origin and particulate matter chemical composition on airborne bacterial community structure in the Po Valley, Italy. Sci. Total Environ. 2017, 593–594, 677–687. [Google Scholar] [CrossRef] [PubMed]
  6. Gat, D.; Mazar, Y.; Cytryn, E.; Rudich, Y. Origin-dependent variations in the atmospheric microbiome community in Eastern Mediterranean Dust Storms. Environ. Sci. Technol. 2017, 51, 6709–6718. [Google Scholar] [CrossRef] [PubMed]
  7. Zhen, Q.; Deng, Y.; Wang, Y.; Wang, X.; Zhang, H.; Sun, X.; Ouyang, Z. Meteorological factors had more impact on airborne bacterial communities than air pollutants. Sci. Total Environ. 2017, 60, 703–712. [Google Scholar] [CrossRef] [PubMed]
  8. Sun, Y.; Xu, S.; Zheng, D.; Li, J.; Tian, H.; Wang, Y. Effects of haze pollution on microbial community changes and correlation with chemical components in atmospheric particulate matter. Sci. Total Environ. 2018, 637–638, 507–516. [Google Scholar] [CrossRef] [PubMed]
  9. Yan, D.; Zhang, T.; Su, J.; Zhao, L.-L.; Wang, H.; Fang, X.-M.; Zhang, Y.-Q.; Liu, H.-Y.; Yu, L.-Y. Structural variation in the bacterial community associated with airborne particulate matter in Beijing, China, during hazy and non-hazy days. Appl. Environ. Microbiol. 2018, 84, e00004-18. [Google Scholar] [CrossRef] [PubMed]
  10. Pan, Y.; Pan, X.; Xiao, H.; Xiao, H. Structural characteristics and functional implications of PM2.5 bacterial communities during fall in Beijing and Shanghai, China. Front. Microbiol. 2019, 10, 2369. [Google Scholar] [CrossRef]
  11. Erkorkmaz, B.A.; Gat, D.; Rudich, Y. Aerial transport of bacteria by dust plumes in the Eastern Mediterranean revealed by complementary rRNA/rRNA-gene sequencing. Commun. Earth Environ. 2023, 4, 24. [Google Scholar] [CrossRef]
  12. Robinson, C.K.; Brotman, R.M.; Ravel, J. Intricacies of assessing the human microbiome in epidemiologic studies. Ann. Epidemiol. 2016, 26, 311–321. [Google Scholar] [CrossRef] [PubMed]
  13. Gloor, G.B.; Macklaim, J.M.; Pawlowsky-Glahn, V.; Egozcue, J.J. Microbiome Datasets Are Compositional: And This Is Not Optional. Front. Microbiol. 2017, 8, 2224. [Google Scholar] [CrossRef]
  14. Xia, Y. Correlation and association analyses in microbiome study integrating multiomics in health and disease. Prog. Mol. Biol. Transl. Sci. 2020, 171, 309–491. [Google Scholar] [CrossRef] [PubMed]
  15. Aitchison, J.; Greenacre, M. Biplots of Compositional Data. J. R. Stat. Soc. Ser. C Appl. Stat. 2002, 51, 375–392. [Google Scholar] [CrossRef]
  16. Satten, G.A.; Tyx, R.E.; Rivera, A.J.; Stanfill, S. Restoring the Duality between Principal Components of a Distance Matrix and Linear Combinations of Predictors, with Application to Studies of the Microbiome. PLoS ONE 2017, 12, e0168131. [Google Scholar] [CrossRef]
  17. Wang, Y.; Randolph, T.W.; Shojaie, A.; Ma, J. The generalized matrix decomposition biplot and its application to microbiome data. mSystems 2019, 4, e00504-19. [Google Scholar] [CrossRef]
  18. Greenacre, M.; Martínez-Álvaro, M.; Blasco, A. Compositional Data Analysis of Microbiome and Any-Omics Datasets: A Validation of the Additive Logratio Transformation. Front. Microbiol. 2021, 12, 727398. [Google Scholar] [CrossRef]
  19. Barrett, L.W.; Rousseau, A.D. Aerosol Loading Performance of Electret Filter Media. Am. Ind. Hyg. Assoc. J. 1998, 59, 532–539. [Google Scholar] [CrossRef]
  20. Romay, F.J.; Liu, B.Y.H.; Chae, S.-J. Experimental Study of Electrostatic Capture Mechanisms in Commercial Electret Filters. Aerosol Sci. Technol. 1998, 28, 224–234. [Google Scholar] [CrossRef]
  21. Shu, H.; Xiangchao, C.; Peng, L.; Hui, G. Study on Electret Technology of Air Filtration Material. IOP Conf. Ser. Earth Environ. Sci. 2017, 100, 012110. [Google Scholar] [CrossRef]
  22. King, P.; Pham, L.K.; Waltz, S.; Sphar, D.; Yamamoto, R.T.; Conrad, D.; Taplitz, R.; Torriani, F.; Forsyth, R.A. Longitudinal Metagenomic Analysis of Hospital Air Identifies Clinically Relevant Microbes. PLoS ONE 2016, 11, e0160124. [Google Scholar] [CrossRef] [PubMed]
  23. Bøifot, K.O.; Gohli, J.; Slogan, G.; Dybwad, M. Performance Evaluation of High-Volume Electret Filter Air Samplers in Aerosol Microbiome Research. Environ. Microbiome 2020, 15, 14. [Google Scholar] [CrossRef] [PubMed]
  24. Perrone, M.R.; Romano, S.; De Maria, G.; Tundo, P.; Bruno, A.R.; Tagliaferro, L.; Maffia, M.; Fragola, M. Compositional Data Analysis of 16S rRNA Gene Sequencing Results from Hospital Airborne Microbiome Samples. Int. J. Environ. Res. Public Health 2022, 19, 10107. [Google Scholar] [CrossRef]
  25. Jaing, C.; Thissen, J.; Morrison, M.; Dillon, M.B.; Waters, S.M.; Graham, G.T.; Be, N.A.; Nicoll, P.; Verma, S.; Caro, T.; et al. Sierra Nevada sweep: Metagenomic measurements of bioaerosols vertically distributed across the troposphere. Sci. Rep. 2020, 10, 12399. [Google Scholar] [CrossRef] [PubMed]
  26. Ginn, O.; Rocha-Melogno, L.; Bivins, A.; Lowry, S.; Cardelino, M.; Nichols, D.; Tripathi, S.N.; Soria, F.; Andrade, M.; Bergin, M.; et al. Detection and Quantification of Enteric Pathogens in Aerosols near Open Wastewater Canals in Cities with Poor Sanitation. Environ. Sci. Technol. 2021, 55, 14758–14771. [Google Scholar] [CrossRef]
  27. Ginn, O.; Berendes, D.; Wood, A.; Bivins, A.; Rocha-Melogno, L.; Deshusses, M.A.; Tripathi, S.N.; Bergin, M.H.; Brown, J. Open Waste Canals as Potential Sources of Antimicrobial Resistance Genes in Aerosols in Urban Kanpur, India. Am. J. Trop. Med. Hyg. 2021, 104, 1761–1767. [Google Scholar] [CrossRef]
  28. Pepin, B.; Williams, T.; Polson, D.; Gauger, P.; Dee, S. Survival of swine pathogens in compost formed from preprocessed carcasses. Transbound. Emerg. Dis. 2020, 68, 2239–2249. [Google Scholar] [CrossRef]
  29. Cai, Y.; Wu, X.; Zhang, Y.; Xia, J.; Li, M.; Feng, Y.; Yu, X.; Duan, J.; Weng, X.; Chen, Y.; et al. Severe Acute Respiratory Syndrome Coronavirus 2 (SARS-CoV-2) Contamination in Air and Environment in Temporary COVID-19 ICU Wards. Res. Sq. 2020. preprint. [Google Scholar] [CrossRef]
  30. Borges, J.T.; Nakada, L.Y.K.; Maniero, M.G.; Guimarães, J.R. SARS-CoV-2: A Systematic Review of Indoor Air Sampling for Virus Detection. Environ. Sci. Pollut. Res. Int. 2021, 28, 40460–40473. [Google Scholar] [CrossRef] [PubMed]
  31. McCumber, A.W.; Kim, Y.J.; Isikhuemhen, O.S.; Tighe, R.M.; Gunsch, C.K. The Environment Shapes Swine Lung Bacterial Communities. Sci. Total Environ. 2021, 758, 143623. [Google Scholar] [CrossRef]
  32. Perrone, M.R.; Romano, S.; De Maria, G.; Tundo, P.; Bruno, A.R.; Tagliaferro, L.; Maffia, M.; Fragola, M. Simultaneous monitoring of SARS-CoV-2 and bacterial profiles from the air of hospital environments with COVID-19-affected patients. Aerobiologia 2022, 38, 391–412. [Google Scholar] [CrossRef]
  33. Klindworth, A.; Pruesse, E.; Schweer, T.; Peplies, J.; Quast, C.; Horn, M.; Glöckner, F.O. Evaluation of General 16S Ribosomal RNA Gene PCR Primers for Classical and Next-Generation Sequencing-Based Diversity Studies. Nucleic Acids Res. 2013, 41, e1. [Google Scholar] [CrossRef] [PubMed]
  34. Wang, Q.; Garrity, G.M.; Tiedje, J.M.; Cole, J.R. Naïve Bayesian Classifier for Rapid Assignment of RRNA Sequences into the New Bacterial Taxonomy. Appl. Environ. Microbiol. 2007, 73, 5261–5267. [Google Scholar] [CrossRef]
  35. Romano, S.; Di Salvo, M.; Rispoli, G.; Alifano, P.; Perrone, M.R.; Talà, A. Airborne Bacteria in the Central Mediterranean: Structure and Role of Meteorology and Air Mass Transport. Sci. Total Environ. 2019, 697, 134020. [Google Scholar] [CrossRef]
  36. Romano, S.; Becagli, S.; Lucarelli, F.; Rispoli, G.; Perrone, M.R. Airborne bacteria structure and chemical composition relationships in winter and spring PM10 samples over southeastern Italy. Sci. Total Environ. 2020, 730, 138899. [Google Scholar] [CrossRef] [PubMed]
  37. Perrone, M.R.; Romano, S.; Orza, J.A.G. Particle optical properties at a Central Mediterranean site: Impact of advection routes and local meteorology. Atmos. Res. 2014, 145–146, 152–167. [Google Scholar] [CrossRef]
  38. Romano, S.; Perrone, M.R.; Pavese, G.; Esposito, F.; Calvello, M. Optical properties of PM2.5 particles: Results from a monitoring campaign in southeastern Italy. Atmos. Environ. 2019, 203, 35–47. [Google Scholar] [CrossRef]
  39. Pawlowsky-Glahn, V.; Egozcue, J.J.; Tolosana-Delgado, R. Modeling and Analysis of Compositional Data, 1st ed.; John Wiley & Sons: Nashville, TN, USA, 2015. [Google Scholar]
  40. Martín-Fernández, J.A.; Barceló-Vidal, C.; Pawlowsky-Glahn, V. Dealing with zeros and missing values in compositional data sets using nonparametric imputation. Math. Geol. 2003, 35, 253–278. [Google Scholar] [CrossRef]
  41. Martín-Fernández, J.; Barceló-Vidal, C.; Pawlowsky-Glahn, V.; Buccianti, A.; Nardi, G.; Potenza, R. Measures of difference for compositional data and hierarchical clustering methods. Proc. IAMG 1998, 98, 526–531. [Google Scholar]
  42. Aitchison, J.; Barceló-Vidal, C.; Martín-Fernández, J.A.; Pawlowsky-Glahn, V. Logratio Analysis and Compositional Distance. Math. Geol. 2000, 32, 271–275. [Google Scholar] [CrossRef]
  43. Bian, G.; Gloor, G.B.; Gong, A.; Jia, C.; Zhang, W.; Hu, J.; Zhang, H.; Zhang, Y.; Zhou, Z.; Zhang, J.; et al. The Gut Microbiota of Healthy Aged Chinese Is Similar to That of the Healthy Young. mSphere 2017, 2, e00327-17. [Google Scholar] [CrossRef]
  44. Collins, M.D.; Hutson, R.A.; Grant, I.R.; Patterson, M.F. Phylogenetic characterization of a novel radiation-resistant bacterium from irradiated pork: Description of Hymenobacter actinosclerus sp. nov. Int. J. Syst. Evol. Microbiol. 2000, 50, 731–734. [Google Scholar] [CrossRef] [PubMed]
  45. Su, S.; Chen, M.; Teng, C.; Jiang, S.; Zhang, C.; Lin, M.; Zhang, W. Hymenobacter kanuolensis sp. nov., a novel radiation-resistant bacterium. Int. J. Syst. Evol. Microbiol. 2014, 64, 2108–2112. [Google Scholar] [CrossRef] [PubMed]
  46. Zhang, Q.; Liu, C.; Tang, Y.; Zhou, G.; Shen, P.; Fang, C.; Yokota, A. Hymenobacter xinjiangensis sp. nov., a radiation-resistant bacterium isolated from the desert of Xinjiang, China. Int. J. Syst. Evol. Microbiol. 2007, 57, 1752–1756. [Google Scholar] [CrossRef]
  47. Dai, J.; Wang, Y.; Zhang, L.; Tang, Y.; Luo, X.; An, H.; Fang, C. Hymenobacter tibetensis sp. nov., a UV-resistant bacterium isolated from Qinghai-Tibet plateau. Syst. Appl. Microbiol. 2009, 32, 543–548. [Google Scholar] [CrossRef]
  48. Sedláček, I.; Pantůček, R.; Králová, S.; Mašlaňová, I.; Holochová, P.; Staňková, E.; Vrbovská, V.; Švec, P.; Busse, H.J. Hymenobacter amundsenii sp. nov. resistant to ultraviolet radiation, isolated from regoliths in Antarctica. Syst. Appl. Microbiol. 2019, 42, 284–290. [Google Scholar] [CrossRef]
  49. Hernández-Fernández, G.; Galán, B.; Carmona, M.; Castro, L.; García, J.L. Transcriptional response of the xerotolerant Arthrobacter sp. Helios strain to PEG-induced drought stress. Front. Microbiol. 2022, 13, 1009068. [Google Scholar] [CrossRef]
  50. Mukhia, S.; Khatri, A.; Acharya, V.; Kumar, R. Comparative genomics and molecular adaptational analysis of Arthrobacter from Sikkim Himalaya provided insights into its survivability under multiple high-altitude stress. Genomics 2021, 113, 151–158. [Google Scholar] [CrossRef]
  51. Smith, D.J.; Ravichandar, J.D.; Jain, S.; Griffin, D.W.; Yu, H.; Tan, Q.; Thissen, J.; Lusby, T.; Nicoll, P.; Shedler, S.; et al. Airborne bacteria in earth’s lower stratosphere resemble taxa detected in the troposphere: Results from a new NASA Aircraft Bioaerosol Collector (ABC). Front. Microbiol. 2018, 9, 1752. [Google Scholar] [CrossRef] [PubMed]
  52. Kumar, R.; Singh, D.; Swarnkar, M.K.; Singh, A.K.; Kumar, S. Complete genome sequence of Arthrobacter alpinus ERGS4:06, a yellow pigmented bacterium tolerant to cold and radiations isolated from Sikkim Himalaya. J. Biotechnol. 2016, 220, 86–87. [Google Scholar] [CrossRef] [PubMed]
  53. Rathinavelu, S.; Zavros, Y.; Merchant, J.L. Acinetobacter lwoffii infection and gastritis. Microbes Infect. 2003, 5, 651–657. [Google Scholar] [CrossRef]
  54. Bourdeaut, F.; Quartier, P.; Alkaer, G.; Fischer, A.; Casanova, J.-L.; Blanche, S. Propionibacterium acnes chest infections in patients with chronic granulomatous disease: Case reports. Clin. Infect. Dis. 2002, 34, 853–854. [Google Scholar] [CrossRef]
  55. Mayslich, C.; Grange, P.A.; Dupin, N. Cutibacterium acnes as an opportunistic pathogen: An update of its virulence-associated factors. Microorganisms 2021, 9, 303. [Google Scholar] [CrossRef]
  56. Walti, L.N.; Conen, A.; Coward, J.; Jost, G.F.; Trampuz, A. Characteristics of infections associated with external ventricular drains of cerebrospinal fluid. J. Infect. 2013, 66, 424–431. [Google Scholar] [CrossRef]
  57. Bayo, S.M.; Ruíz, M.P.P.; Hijazo, M.M.; Usón, M.C.V. Bacteremia during COVID-19 pandemic in a tertiary hospital in Spain. Enferm. Infecc. Microbiol. Clin. 2021, 40, 183–186. [Google Scholar] [CrossRef]
  58. McDowell, A.; McLaughlin, J.; Layton, A.M. Is Cutibacterium (previously Propionibacterium) acnes a potential pathogenic factor in the aetiology of the skin disease progressive macular hypomelanosis? J. Eur. Acad. Dermatol. Venereol. 2021, 35, 338–344. [Google Scholar] [CrossRef]
  59. Subramanian, G.; Mediannikov, O.; Angelakis, E.; Socolovschi, C.; Kaplanski, G.; Martzolff, L.; Raoult, D. Diplorickettsia massiliensis as a human pathogen. Eur. J. Clin. Microbiol. Infect. Dis. 2012, 31, 365–369. [Google Scholar] [CrossRef] [PubMed]
  60. Hinic, V.; Lang, C.; Weisser, M.; Straub, C.; Frei, R.; Goldenberger, D. Corynebacterium tuberculostearicum: A potentially misidentified and multiresistant Corynebacterium species isolated from clinical specimens. J. Clin. Microbiol. 2012, 50, 2561–2567. [Google Scholar] [CrossRef]
  61. Suzuki, K.; Collins, M.D.; Iijima, E.; Komagata, K. Chemotaxonomic characterization of a radiotolerant bacterium Arthrobacter radiotolerans: Description of Rubrobacter radiotolerans gen. nov., comb. nov. FEMS Microbiol. Lett. 1988, 52, 33–40. [Google Scholar] [CrossRef]
  62. Cusick, K.D.; Lin, B.; Malanoski, A.P.; Strycharz-Glaven, S.M.; Cockrell-Zugell, A.; Fitzgerald, L.A.; Cramer, J.A.; Barlow, D.E.; Boyd, T.J.; Biffinger, J.C. Molecular mechanisms contributing to the growth and physiology of an extremophile cultured with dielectric heating. Appl. Environ. Microbiol. 2016, 82, 6233–6246. [Google Scholar] [CrossRef]
  63. Maggi, P.; Perilli, F.; Lillo, A.; Gargiulo, M.; Ferraro, S.; Grisorio, B.; Ferrara, S.; Carito, V.; Bellacosa, C.; Pastore, G.; et al. Rapid progression of carotid lesions in HAART-treated HIV-1 patients. Atherosclerosis 2007, 192, 407–412. [Google Scholar] [CrossRef]
Figure 1. (a) Heatmap based on the centered log-ratio (CLR) values of the initial dataset (reads) based on the 23 bacterial genera with the highest abundances. (b,c) show the Aitchison distance-based dendrograms pointing out the connection between samples and between genera, respectively.
Atmosphere 14 01529 g001
Figure 2. Two-dimensional principal component analysis biplot via a singular value decomposition of the CLR-based values of the initial dataset based on the 23 selected genera. The reported biplot shows the relations between samples (score plot, in different colors based on the sampling location) and genera (loading plot, black arrows). The percentages of the total variance explained by the first two principal components are also reported.
Atmosphere 14 01529 g002
Figure 3. (a) Heatmap defined on the centered log-ratio (CLR) based values of the initial dataset (reads) based on the 21 species with the highest abundances. (b,c) show the Aitchison distance dendrograms pointing out the relations among samples and among species, respectively.
Atmosphere 14 01529 g003
Figure 4. Two-dimensional principal component analysis biplot via a singular value decomposition of the CLR-based values of the initial dataset based on the 21 selected bacterial species. The reported biplot illustrates the relationships between samples (score plot, in different colors based on the sampling location) and species (loading plot, black arrows). The percentages of the total variance explained by the first two principal components are also reported.
Atmosphere 14 01529 g004
Table 1. Read number (n°) both at the genus level and species level and number of identified bacterial genera and species in the 18 collected samples. The samplings started at 12:00 UTC on the indicated dates and lasted 48 h. AE, R, and C refer to aerosol samples collected in the High-energy laboratory, Electronics laboratory, and corridors of the selected university building (indoor samples), respectively. F refers to the aerosol samples collected on the roof of the selected university building (outdoor samples).
SampleDate
(dd/mm/yy)
n° Reads
(at Genus Level)
n° Reads
(at Species Level)
n° Generan° Species
AE121 October 202071,56871,58613083074
AE223 October 202083,79483,80210872329
AE327 January 202132,77232,7748071750
AE429 January 202112,62012,620216234
R110 September 202010,87410,875360599
R211 September 202011,74011,740355593
R314 September 202092,00392,02014873642
R430 September 202073,60073,61512012594
R53 October 202071,76071,77312702764
C12 November 202051,90051,90710952524
C24 November 202067,23167,24011492546
C36 November 202086,71886,74814943568
C49 November 202080,34380,3488371390
F11 September 202049,24649,25612402791
F22 September 202052,88652,89712612919
F33 September 202084,88484,89713612944
F48 September 202053,01453,02310622376
F516 November 202076,99477,02213542955
Disclaimer/Publisher’s Note: The statements, opinions and data contained in all publications are solely those of the individual author(s) and contributor(s) and not of MDPI and/or the editor(s). MDPI and/or the editor(s) disclaim responsibility for any injury to people or property resulting from any ideas, methods, instructions or products referred to in the content.

