
Industrial Emission Monitoring and Assessment of Air Quality in Karachi Coastal City, Pakistan

Abstract
:1. Introduction
2. Materials and Methods
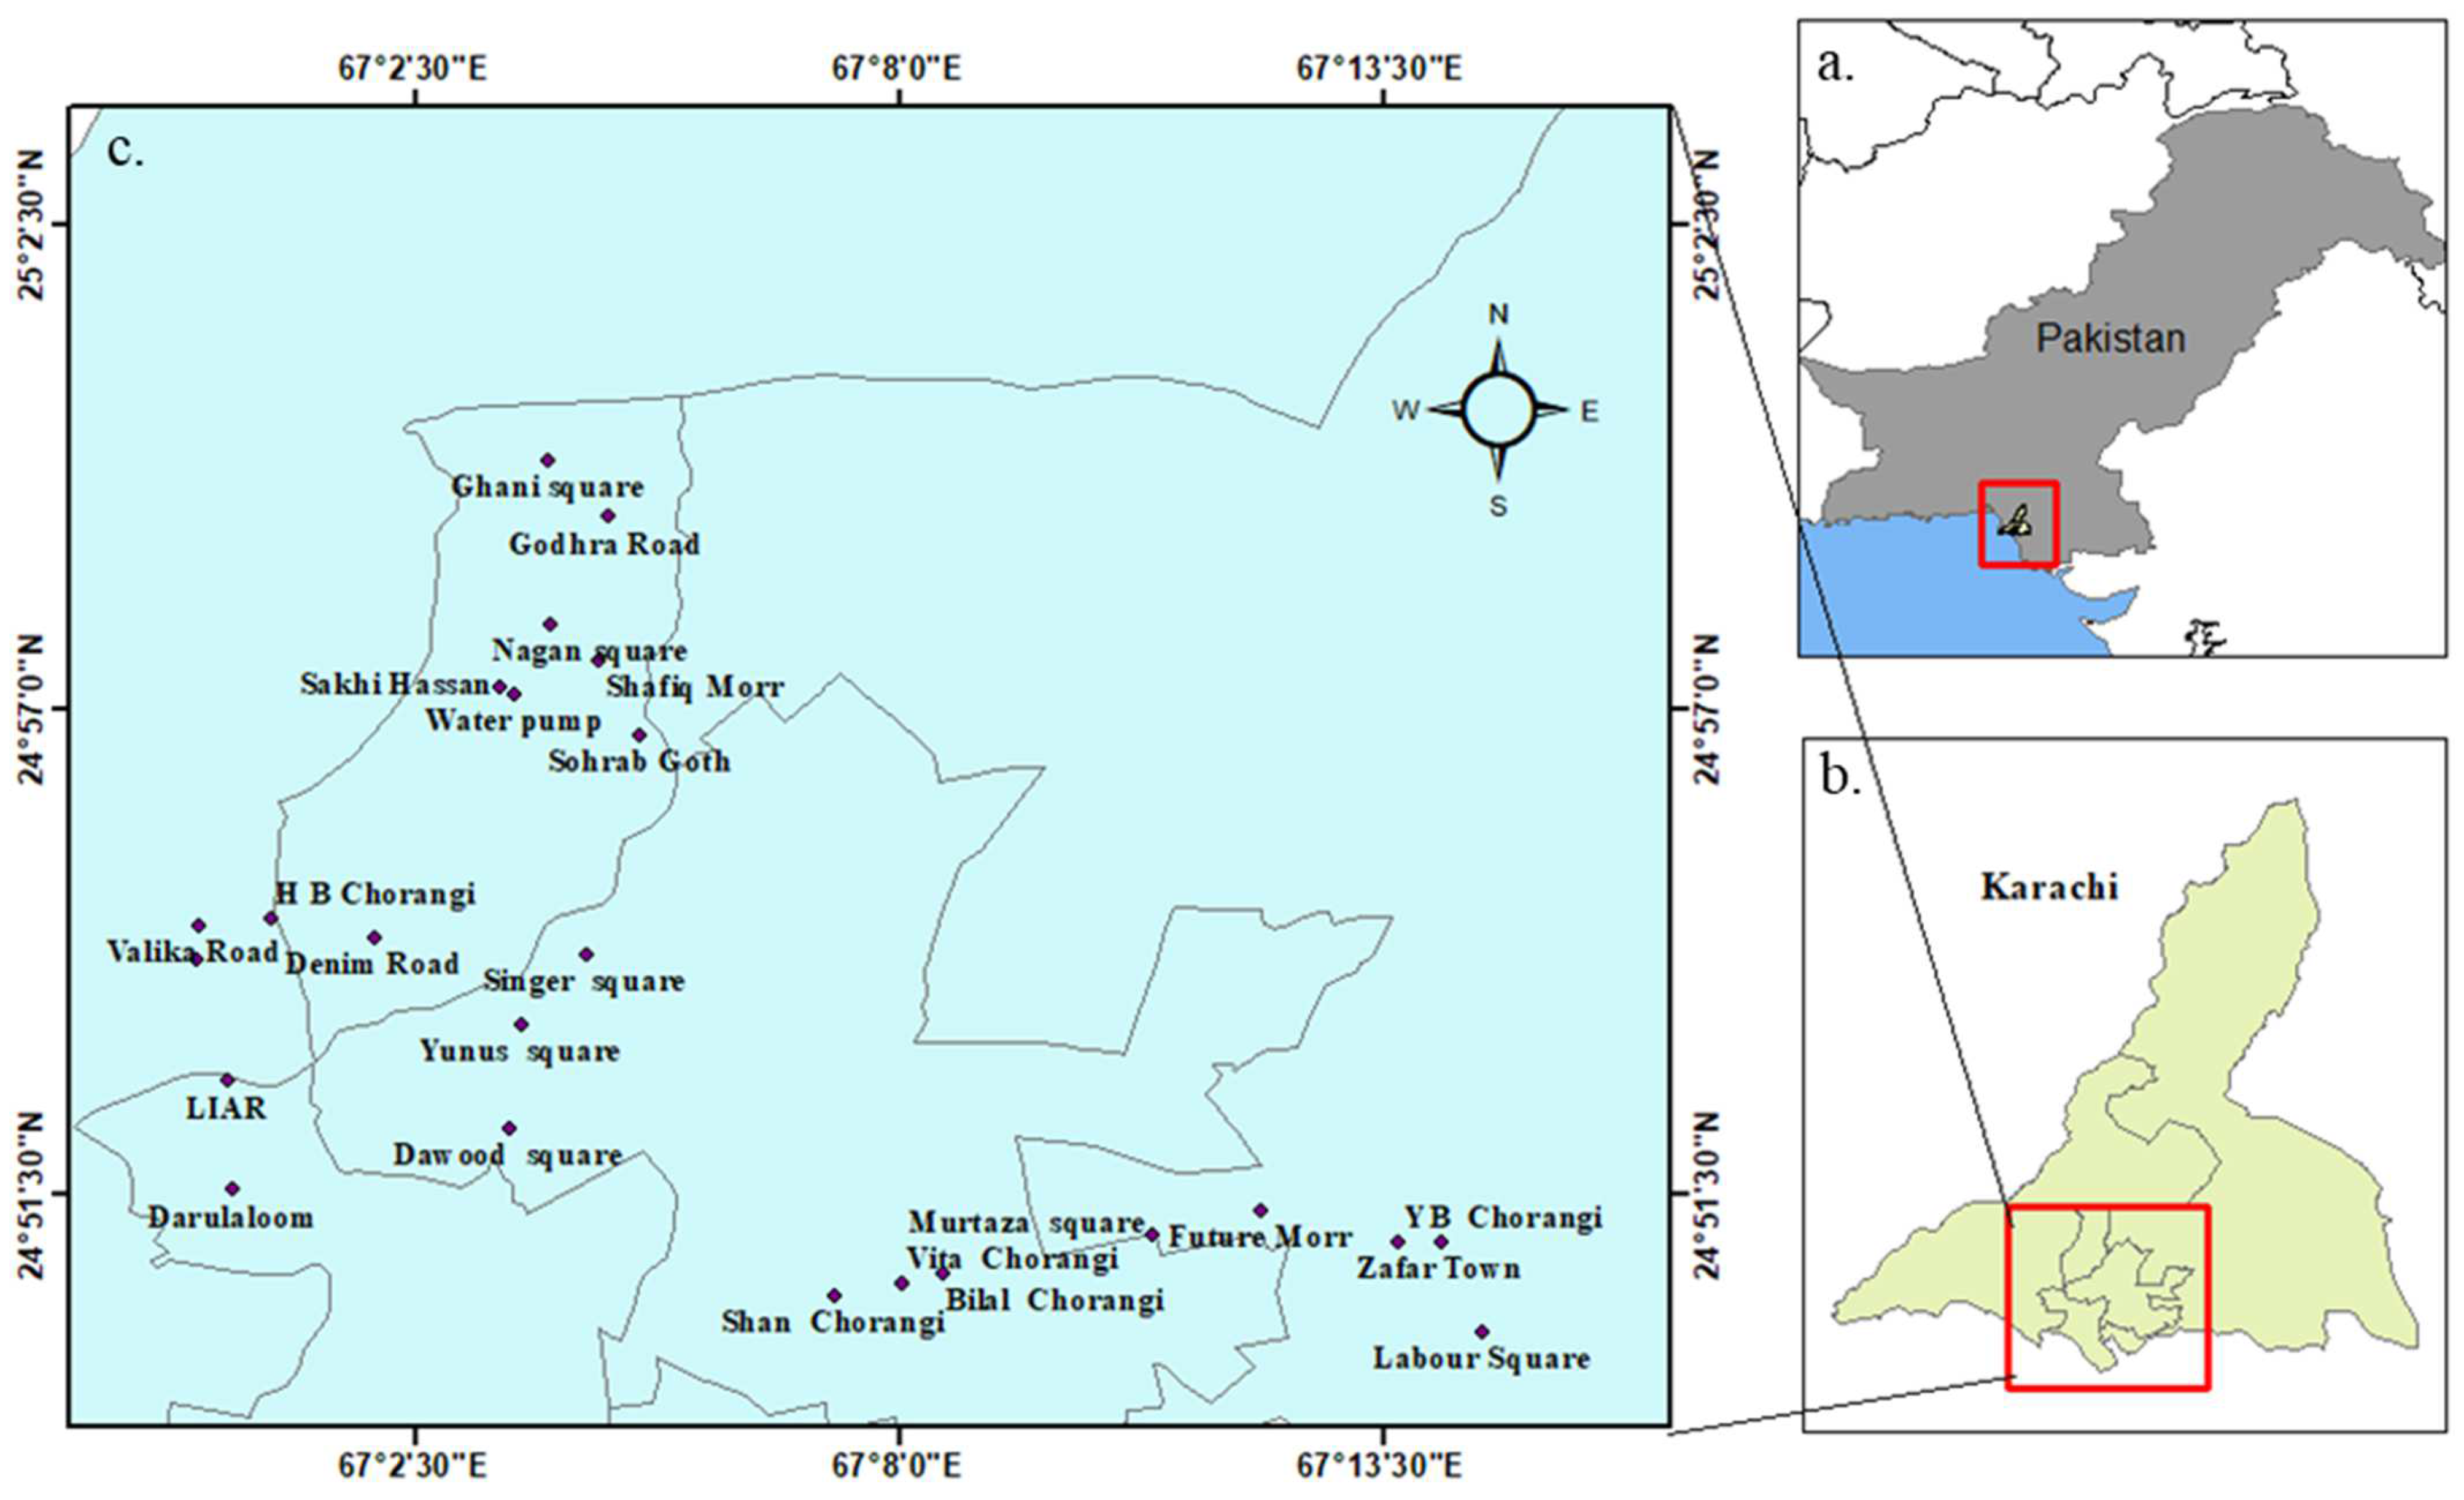
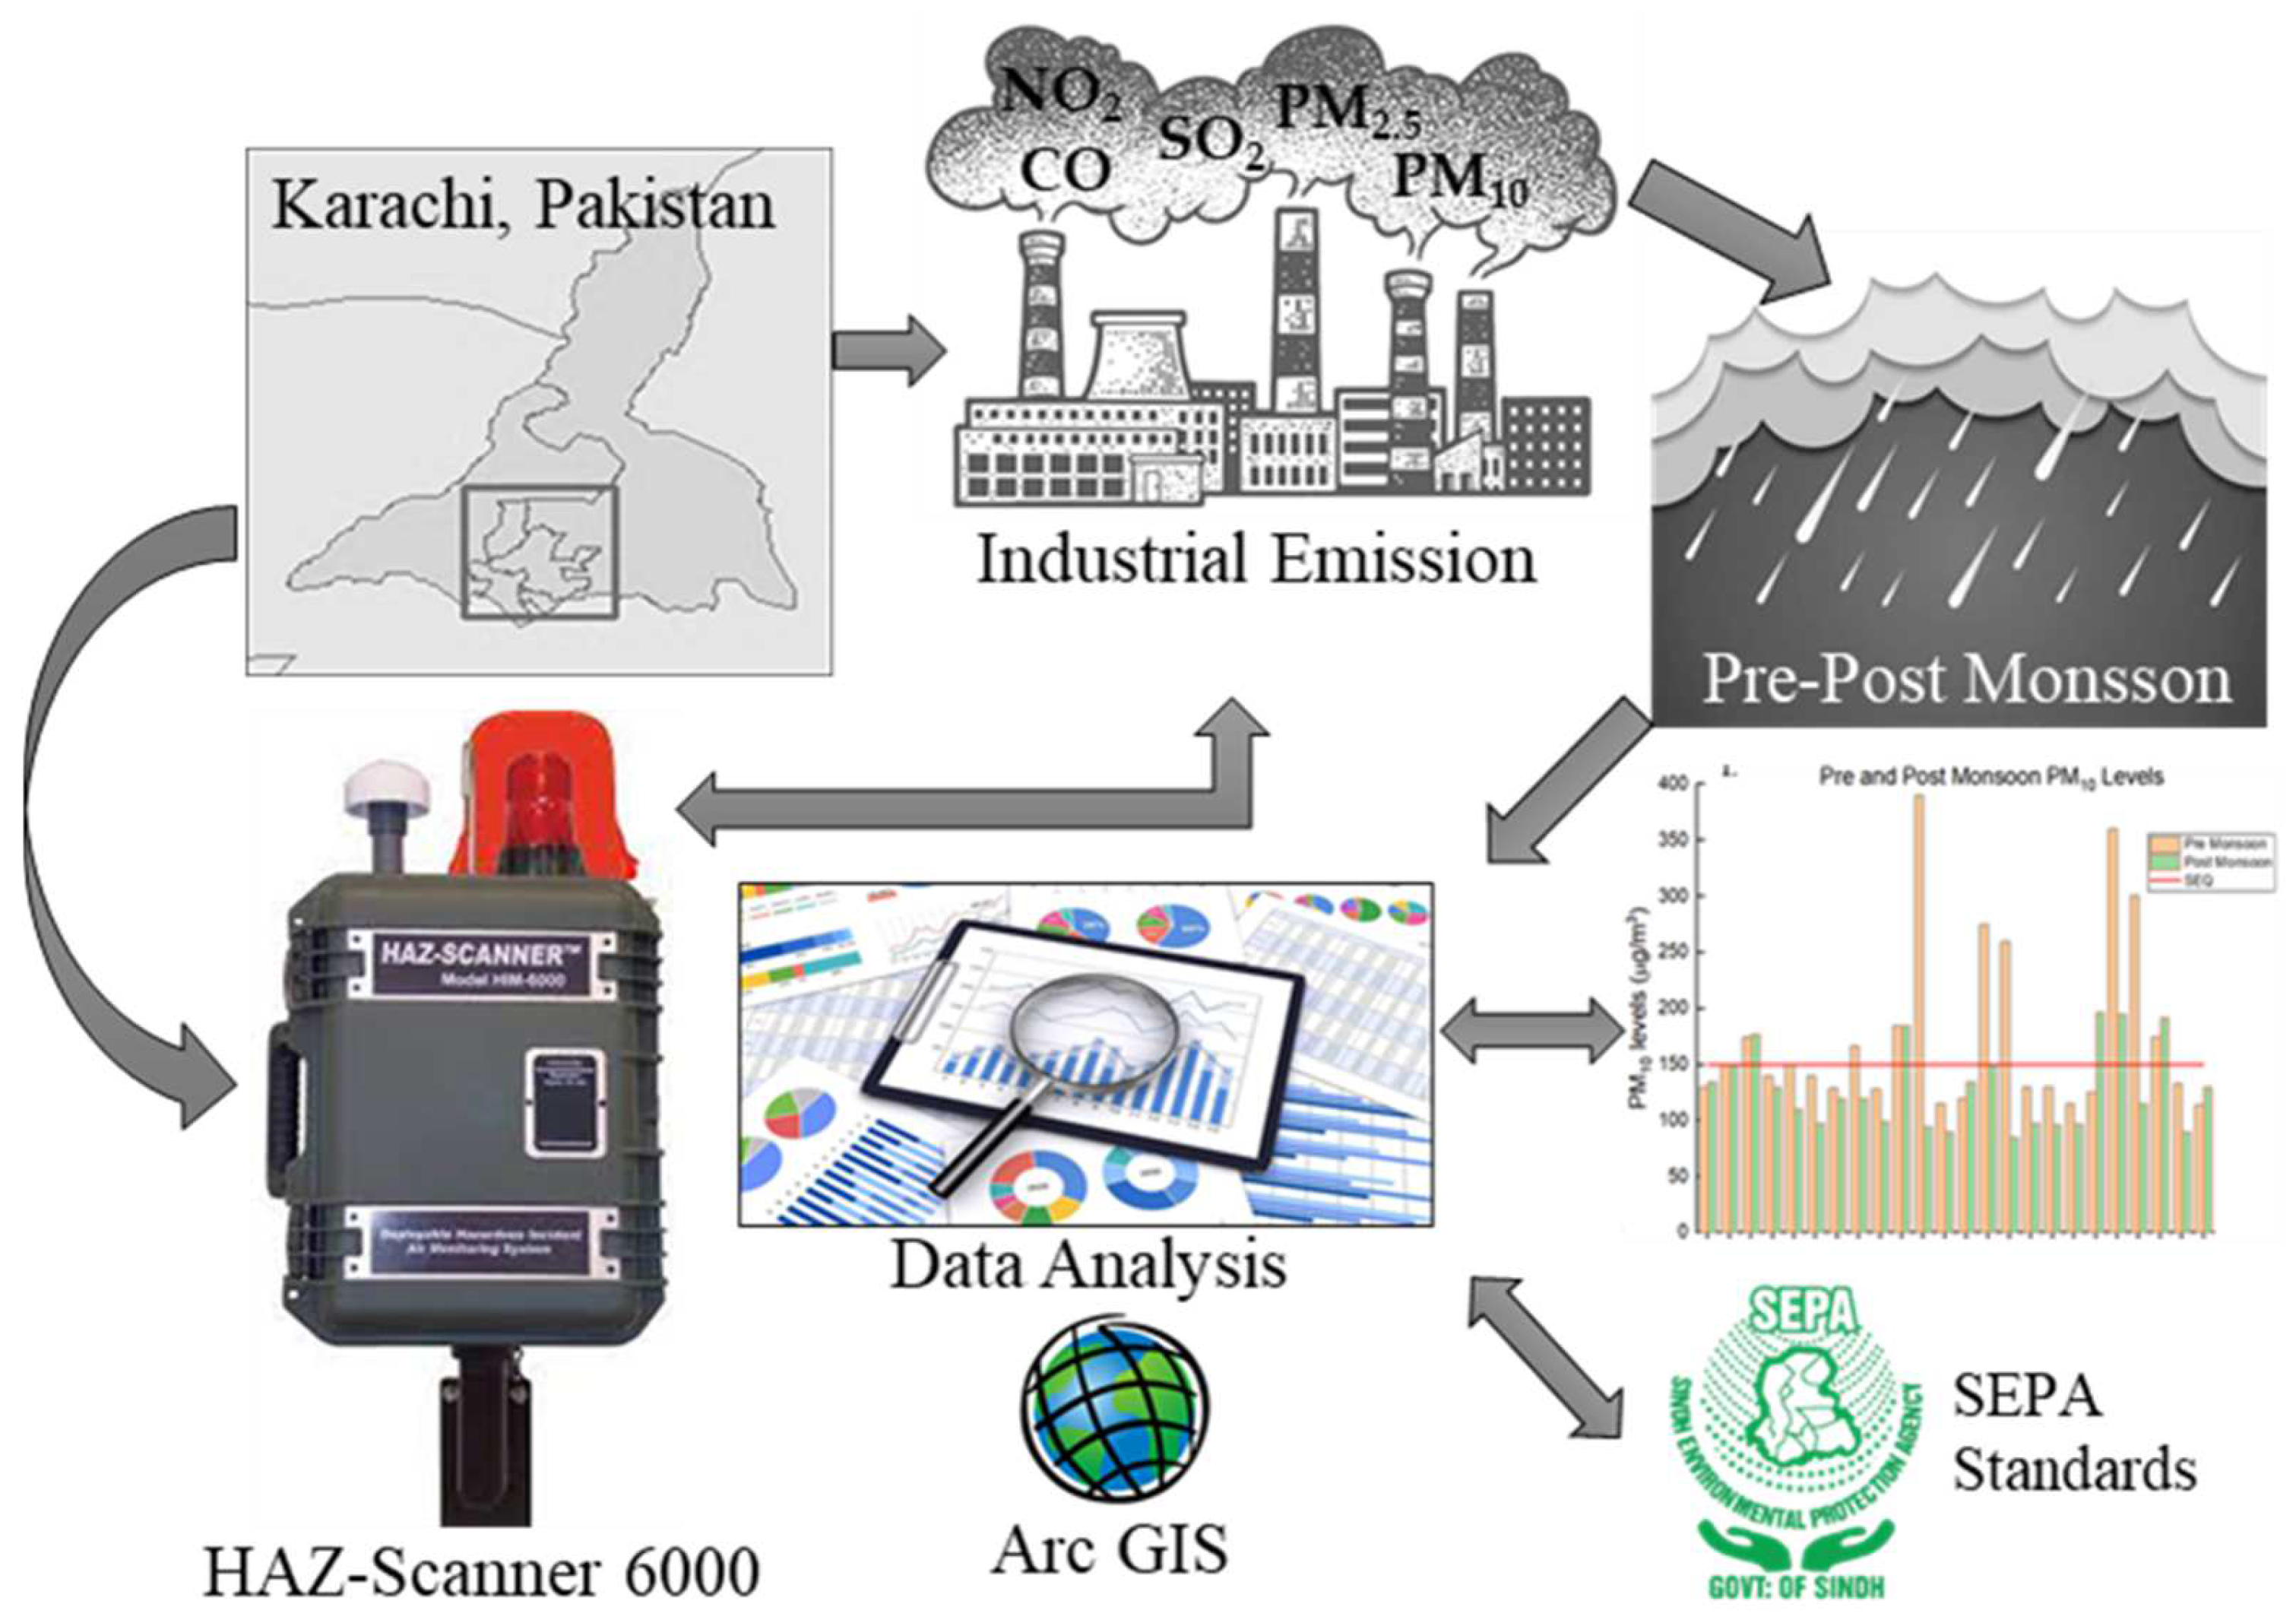
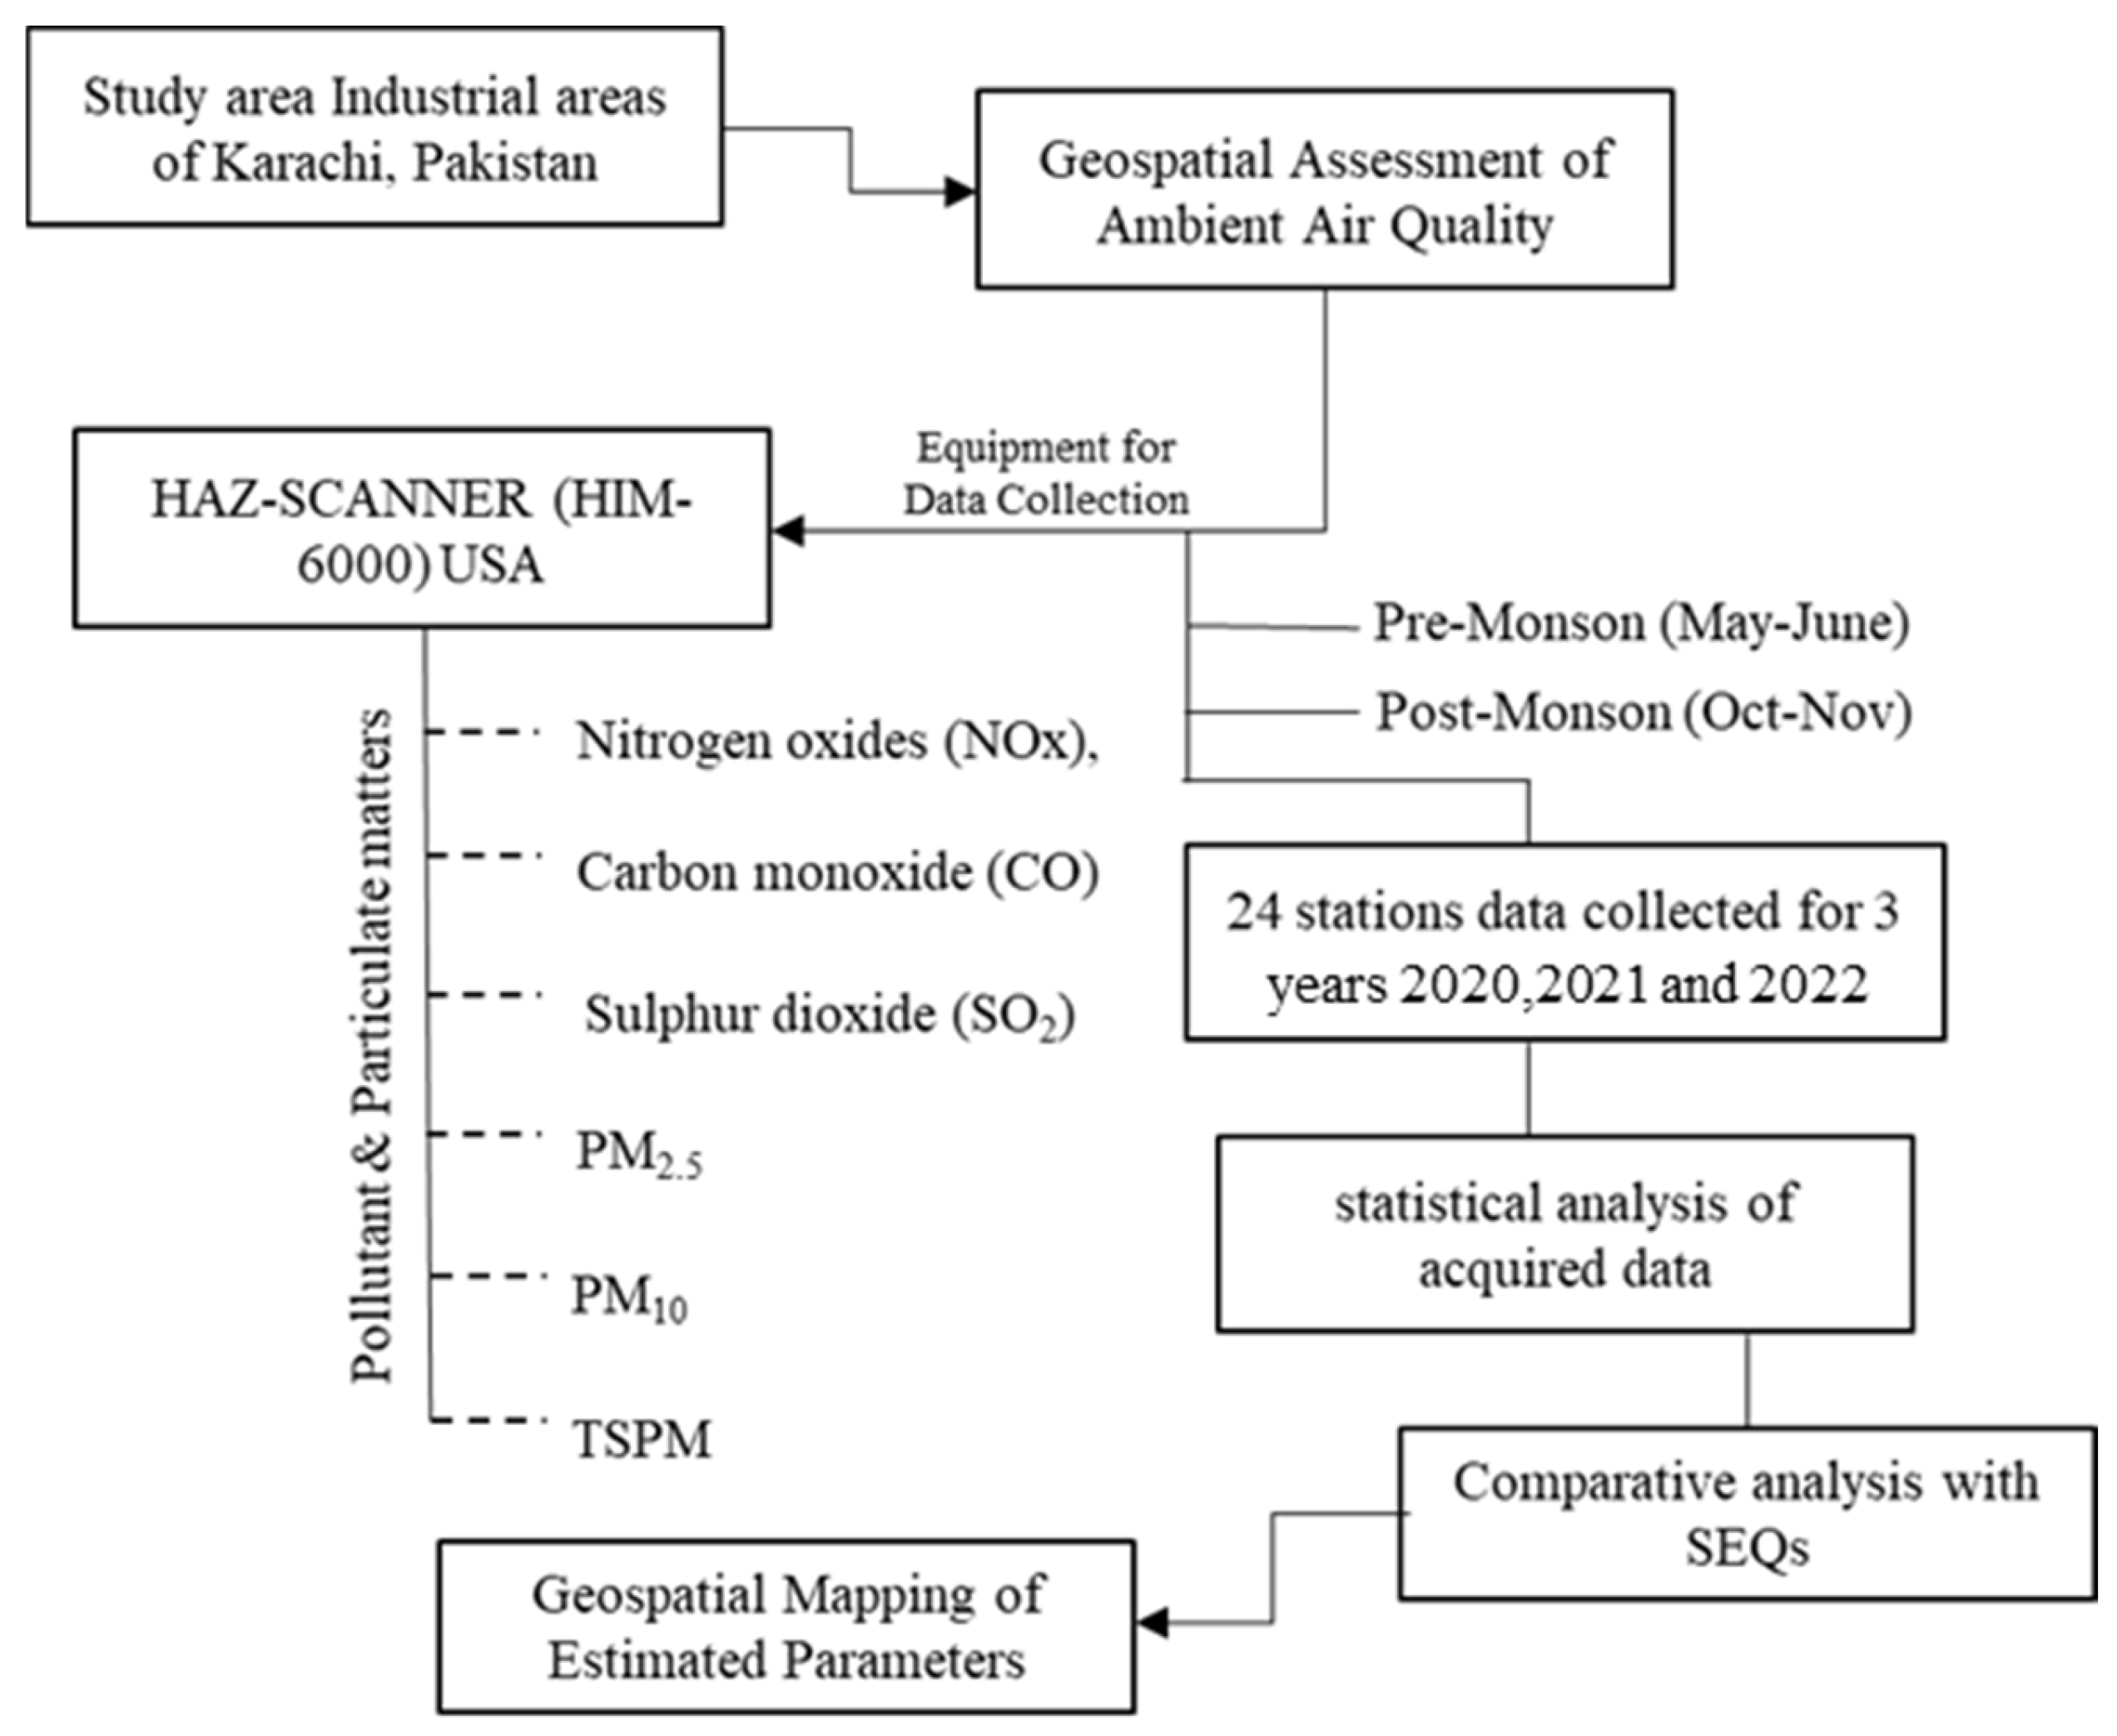
2.1. Study Area
2.2. Instrumentation
2.3. Field Experiment and Sampling Procedure
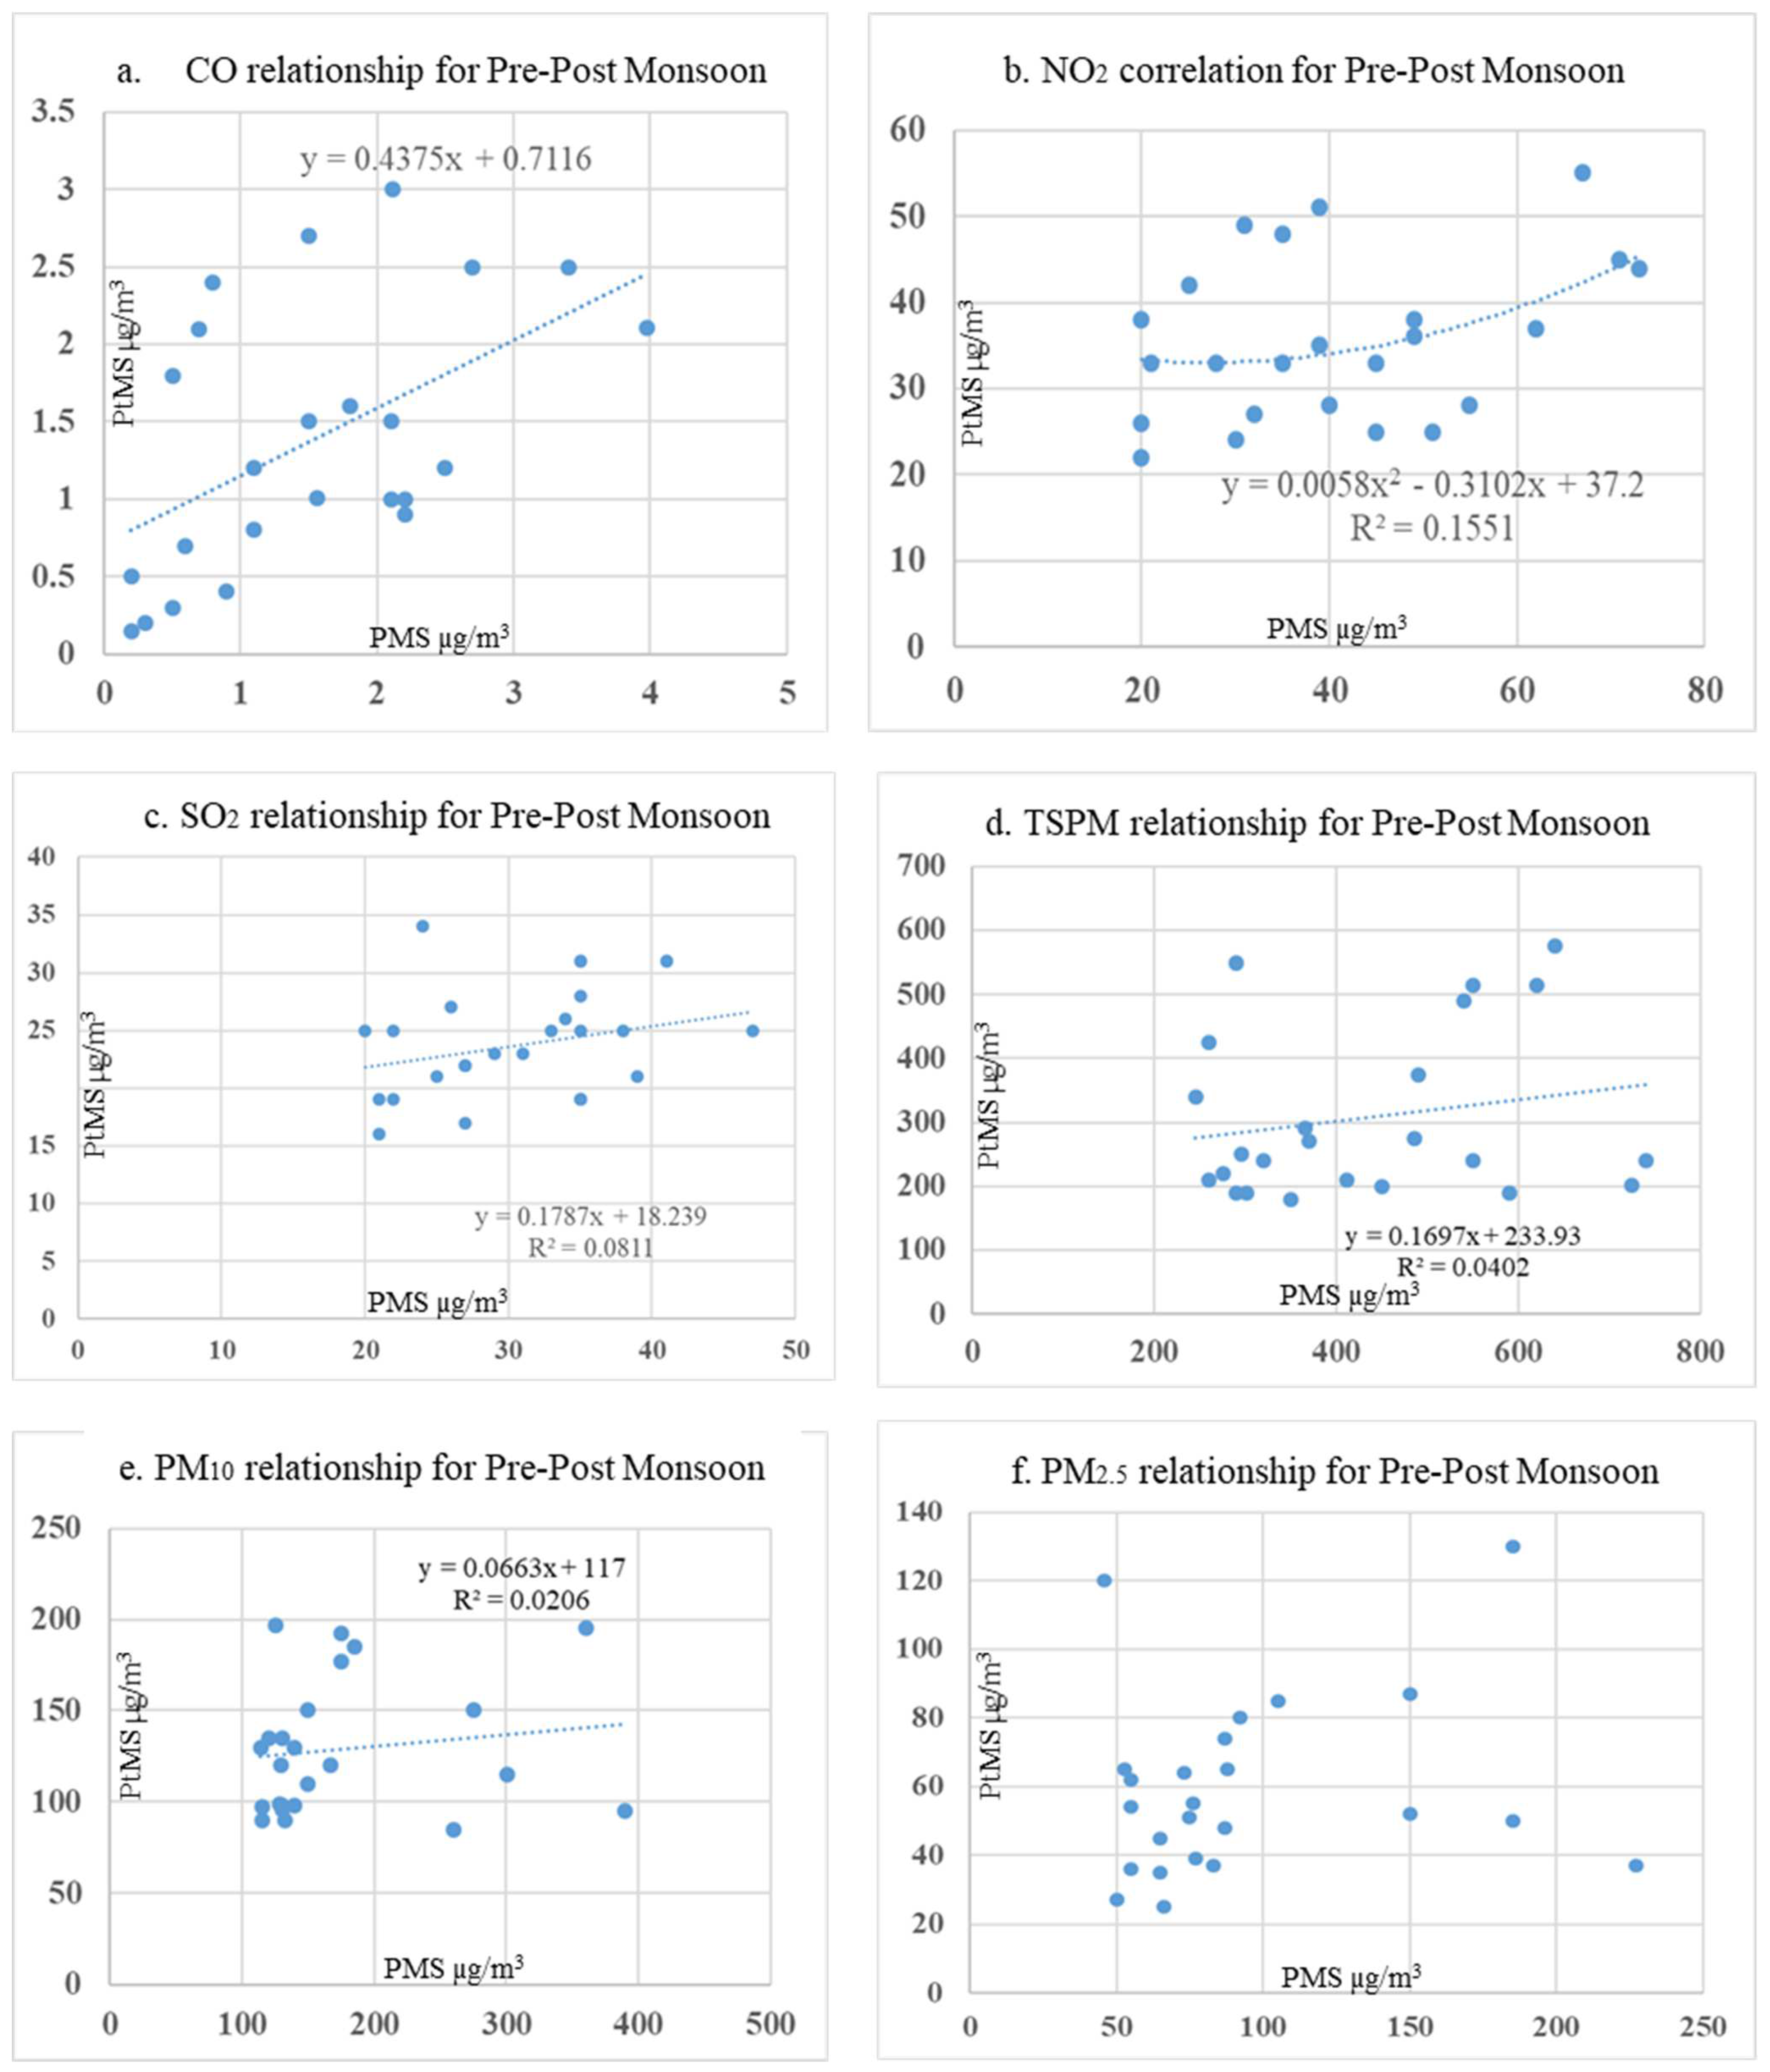
2.4. Statistical Analysis
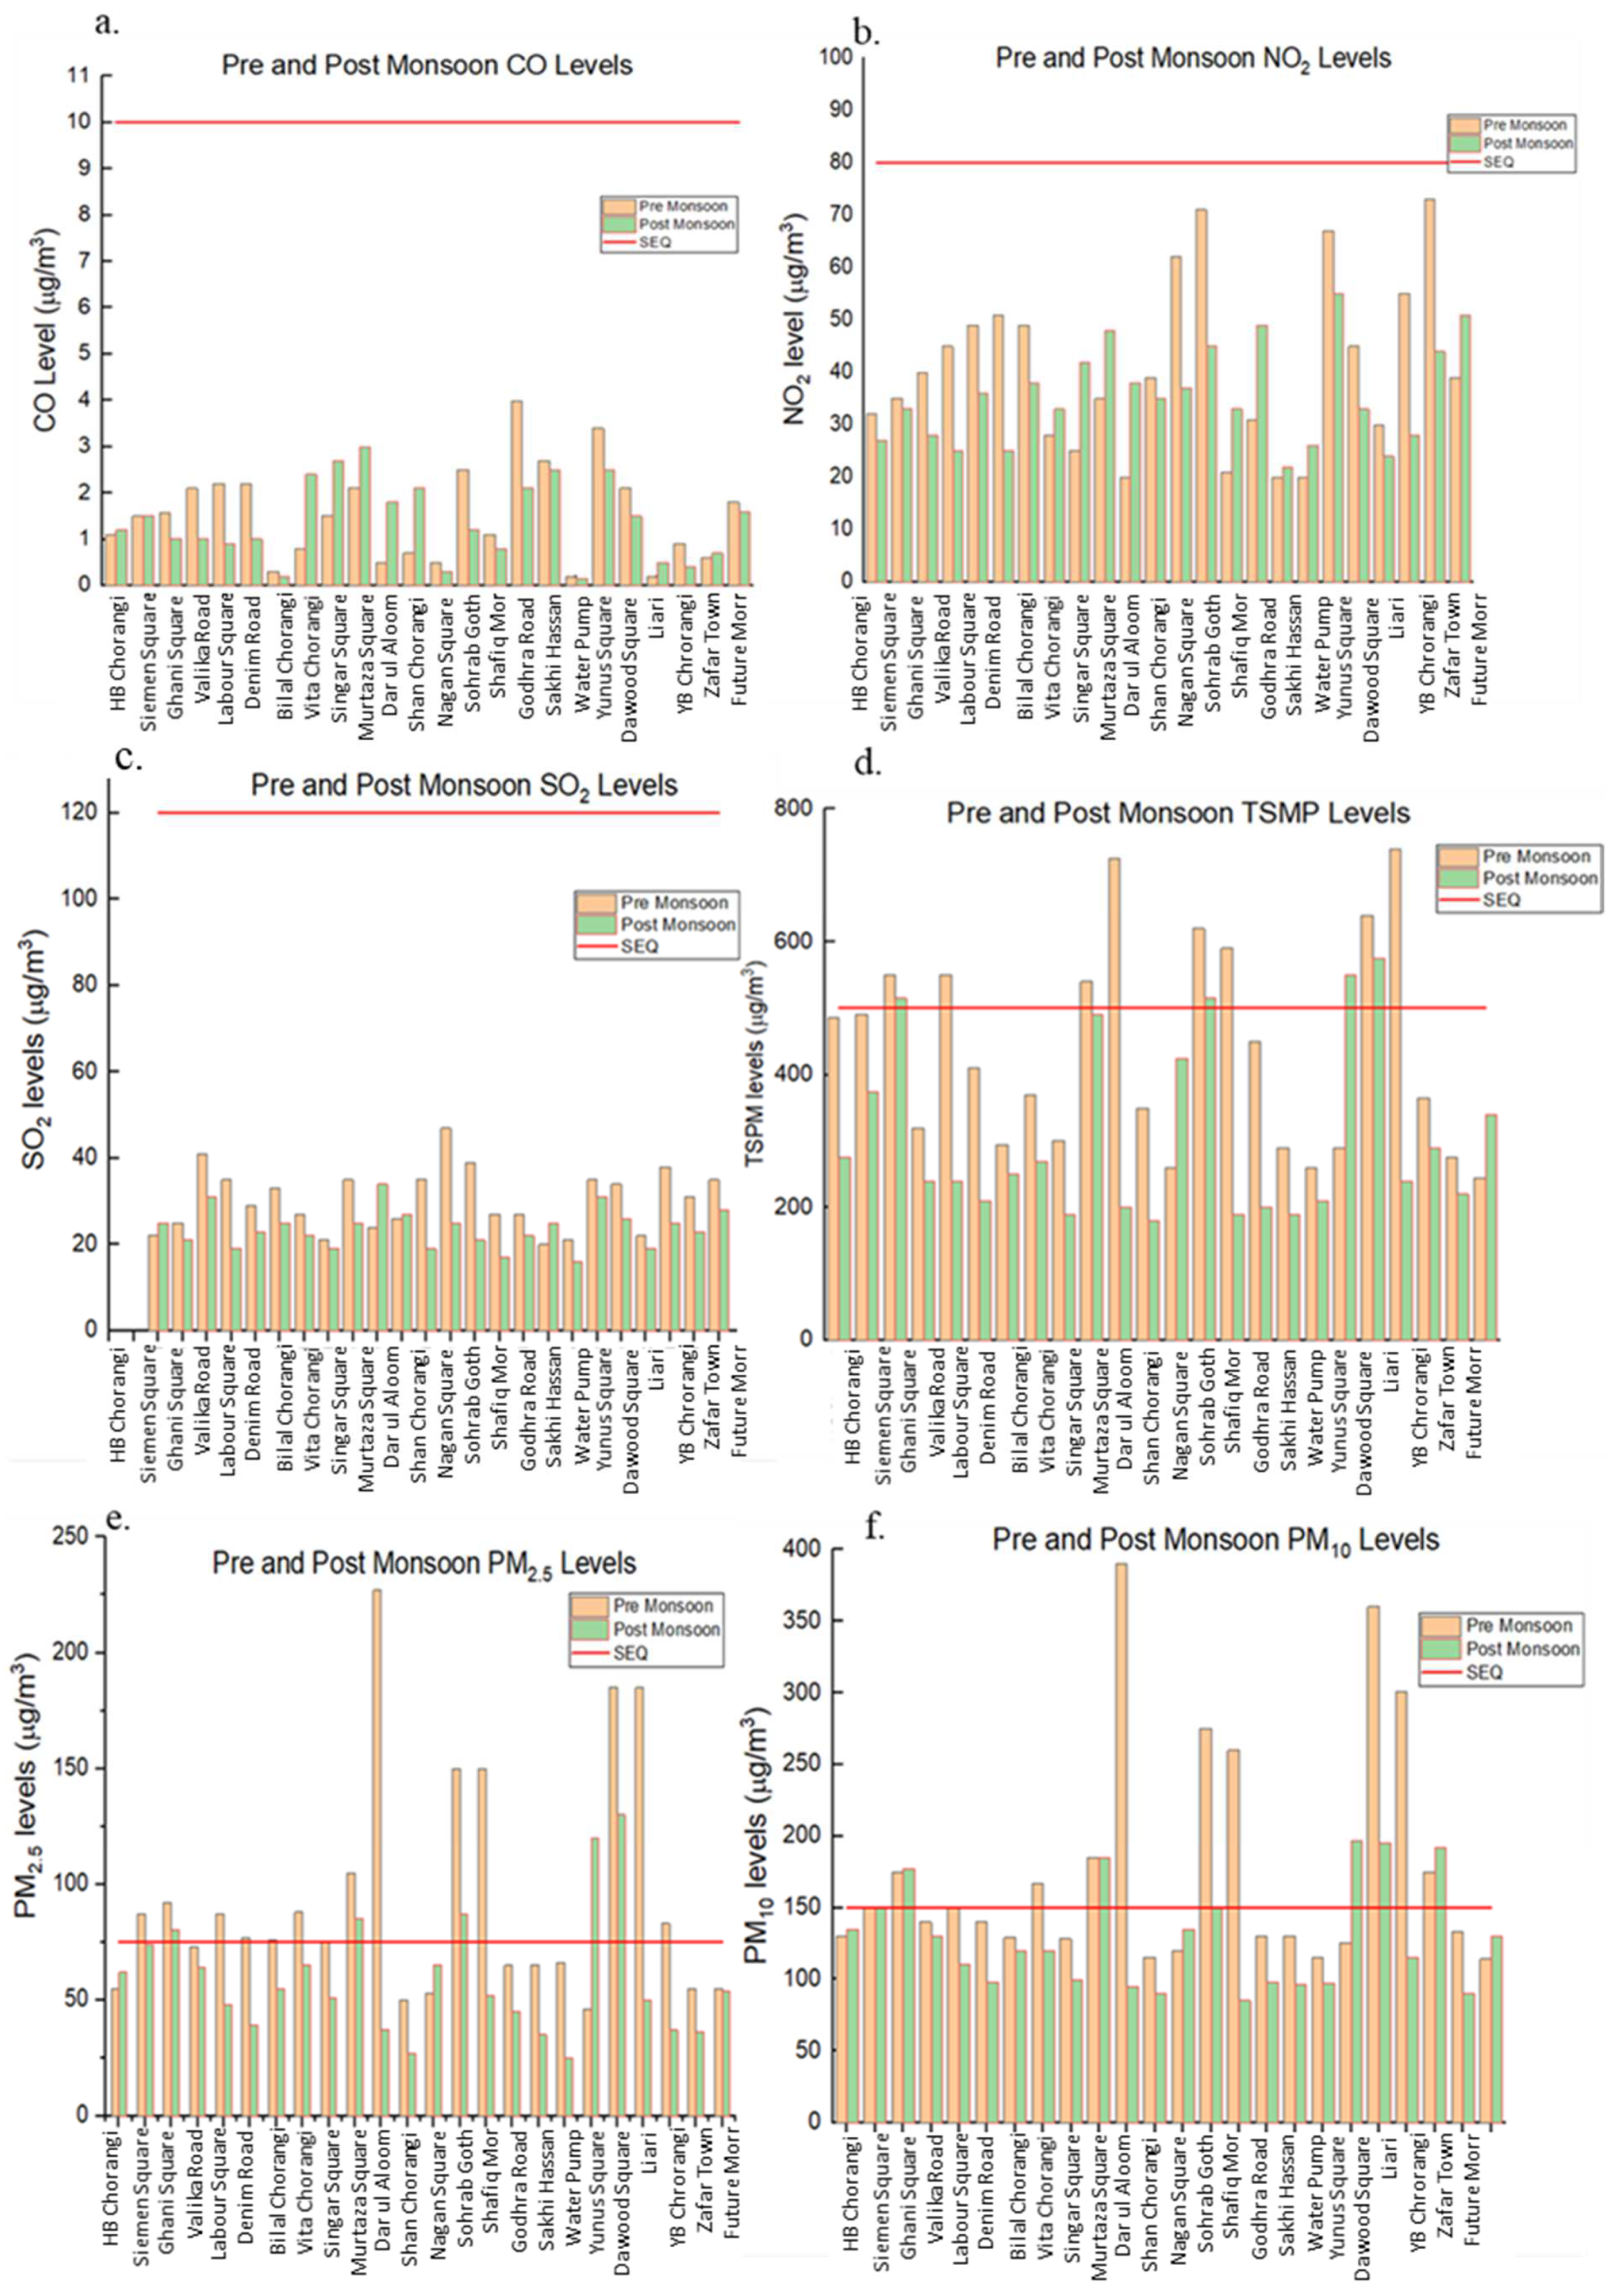
3. Results and Discussion
4. Conclusions
Author Contributions
Funding
Institutional Review Board Statement
Informed Consent Statement
Data Availability Statement
Acknowledgments
Conflicts of Interest
References
- WHO. World Health Organization Global Air Quality Guidelines: Particulate Matter (PM2.5 and PM10), Ozone, Nitrogen Dioxide, Sulfur Dioxide and Carbon Monoxide; World Health Organization: Geneva, Switzerland, 2022. [Google Scholar]
- Moyebi, O.D.; Sannoh, F.; Fatmi, Z.; Siddique, A.; Khan, K.; Zeb, J.; Hussain, M.M.; Carpenter, D.O.; Khwaja, H.A. State of gaseous air pollutants and resulting health effects in Karachi, Pakistan. Environ. Monit. Assess. 2023, 195, 266. [Google Scholar] [CrossRef]
- Fuller, R.; Landrigan, P.J.; Balakrishnan, K.; Bathan, G.; Bose-O’Reilly, S.; Brauer, M.; Caravanos, J.; Chiles, T.; Cohen, A.; Corra, L. Pollution and health: A progress update. Lancet Planet. Health 2022, 6, e535–e547. [Google Scholar] [CrossRef]
- Bank, W. The Global Health Cost of PM2.5 Air Pollution: A Case for Action beyond 2021; The World Bank: Washington, DC, USA, 2022. [Google Scholar]
- Moore, M.J.; Rathish, B.; Zahra, F. Monkeypox. In StatPearls; StatPearls Publishing: St. Petersburg, FL, USA, 2022. [Google Scholar]
- Zaman, H.M.; Saqib, Z.; Bokhari, A.S.; Akhtar, N.; Amir, S. The Dynamics of Urbanizations and Concomitant Land Use Land Cover Transformations in Planned and Quasi-Planned Urban Settlements of Pakistan. Geogr. Environ. Sustain. 2020, 13, 107–120. [Google Scholar] [CrossRef]
- Dahiya, B.; Das, A. New Urban Agenda in Asia-Pacific: Governance for Sustainable and Inclusive Cities; Springer: Berlin/Heidelberg, Germany, 2020. [Google Scholar]
- Agrawal, M.; Shashi, B. Effects of air pollution on plant diversity. In Environmental Pollution and Plant Responses; Routledge: Oxfordshire, UK, 2023; pp. 137–152. [Google Scholar]
- Chang, D.; Ding, Y.; Xie, J.; Bhunia, A.K.; Li, X.; Ma, Z.; Wu, M.; Guo, J.; Song, Y.-Z. The devil is in the channels: Mutual-channel loss for fine-grained image classification. IEEE Trans. Image Process. 2020, 29, 4683–4695. [Google Scholar] [CrossRef]
- Philip, R.K.; Purtill, H.; Reidy, E.; Daly, M.; Imcha, M.; McGrath, D.; O’Connell, N.H.; Dunne, C.P. Reduction in preterm births during the COVID-19 lockdown in Ireland: A natural experiment allowing analysis of data from the prior two decades. MedrXiv, 2020; preprint. [Google Scholar] [CrossRef]
- Tariq, M. Air Quality of Karachi and Lahore: How does the energy industry of Pakistan affect it? In Proceedings of the 2023 6th International Conference on Energy Conservation and Efficiency (ICECE), Lahore, Pakistan, 15–16 March 2023; pp. 1–4. [Google Scholar]
- Baqa, M.F.; Lu, L.; Chen, F.; Nawaz-ul-Huda, S.; Pan, L.; Tariq, A.; Qureshi, S.; Li, B.; Li, Q. Characterizing spatiotemporal variations in the urban thermal environment related to land cover changes in Karachi, Pakistan, from 2000 to 2020. Remote Sens. 2022, 14, 2164. [Google Scholar] [CrossRef]
- Seidah, N.G.; Awan, Z.; Chrétien, M.; Mbikay, M. PCSK9: A key modulator of cardiovascular health. Circ. Res. 2014, 114, 1022–1036. [Google Scholar] [CrossRef] [PubMed]
- Wang, W.; Wang, S.; Ma, X.; Gong, J. Recent advances in catalytic hydrogenation of carbon dioxide. Chem. Soc. Rev. 2011, 40, 3703–3727. [Google Scholar] [CrossRef]
- Lin, B.; Ouyang, X. Energy demand in China: Comparison of characteristics between the US and China in rapid urbanization stage. Energy Convers. Manag. 2014, 79, 128–139. [Google Scholar] [CrossRef]
- Urhie, E.; Afolabi, A.; Afolabi, A.; Matthew, O.; Osabohien, R.; Ewetan, O. Economic growth, air pollution and health outcomes in Nigeria: A moderated mediation model. Cogent Soc. Sci. 2020, 6, 1719570. [Google Scholar] [CrossRef]
- Khoshnevis Yazdi, S.; Khanalizadeh, B. Air pollution, economic growth and health care expenditure. Econ. Res.-Ekon. Istraživanja 2017, 30, 1181–1190. [Google Scholar] [CrossRef]
- Zheng, Y.; Goh, E.; Wen, J. The effects of misleading media reports about COVID-19 on Chinese tourists’ mental health: A perspective article. Anatolia 2020, 31, 337–340. [Google Scholar] [CrossRef]
- Svensson, J.-E.; Johansson, L.-G. A laboratory study of the initial stages of the atmospheric corrosion of zinc in the presence of NaCl; Influence of SO2 and NO2. Corros. Sci. 1993, 34, 721–740. [Google Scholar] [CrossRef]
- Merico, E.; Dinoi, A.; Contini, D. Development of an integrated modelling-measurement system for near-real-time estimates of harbour activity impact to atmospheric pollution in coastal cities. Transp. Res. Part D Transp. Environ. 2019, 73, 108–119. [Google Scholar] [CrossRef]
- Xu, H.; Jia, Y.; Sun, Z.; Su, J.; Liu, Q.S.; Zhou, Q.; Jiang, G. Environmental pollution, a hidden culprit for health issues. Eco-Environ. Health 2022, 1, 31–45. [Google Scholar] [CrossRef]
- Fattorini, D.; Regoli, F. Role of the chronic air pollution levels in the Covid-19 outbreak risk in Italy. Environ. Pollut. 2020, 264, 114732. [Google Scholar] [CrossRef] [PubMed]
- Premsudha, D.R.; Vasareddy, A.; Saiteja, B.; Sreeja, B.; Chandana, G. Impact Assessment on Air Quality around Integrated Municipal Solid Waste Management Plant in Hyderabad. Int. J. Adv. Res. Sci. Commun. Technol. 2022, 2, 666–677. [Google Scholar] [CrossRef]
- Zhang, B.-Z.; Chu, H.; Han, S.; Shuai, H.; Deng, J.; Hu, Y.-F.; Gong, H.-R.; Lee, A.C.-Y.; Zou, Z.; Yau, T. SARS-CoV-2 infects human neural progenitor cells and brain organoids. Cell Res. 2020, 30, 928–931. [Google Scholar] [CrossRef]
- Kumar, S.; Ahlawat, W.; Kumar, R.; Dilbaghi, N. Graphene, carbon nanotubes, zinc oxide and gold as elite nanomaterials for fabrication of biosensors for healthcare. Biosens. Bioelectron. 2015, 70, 498–503. [Google Scholar] [CrossRef] [PubMed]
- Westhoek, H.; Lesschen, J.P.; Rood, T.; Wagner, S.; De Marco, A.; Murphy-Bokern, D.; Leip, A.; van Grinsven, H.; Sutton, M.A.; Oenema, O. Food choices, health and environment: Effects of cutting Europe’s meat and dairy intake. Glob. Environ. Change 2014, 26, 196–205. [Google Scholar] [CrossRef]
- Zeeshan, H.M.A.; Lee, G.H.; Kim, H.-R.; Chae, H.-J. Endoplasmic reticulum stress and associated ROS. Int. J. Mol. Sci. 2016, 17, 327. [Google Scholar] [CrossRef]
- Khan, W.A.; Sharif, F.; Khokhar, M.F.; Shahzad, L.; Ehsan, N.; Jahanzaib, M. Monitoring of Ambient Air Quality Patterns and Assessment of Air Pollutants’ Correlation and Effects on Ambient Air Quality of Lahore, Pakistan. Atmosphere 2023, 14, 1257. [Google Scholar] [CrossRef]
- Milivojević, L.; Mrazovac Kurilić, S.; Božilović, Z.; Koprivica, S.; Krčadinac, O. Study of Particular Air Quality and Meteorological Parameters at a Construction Site. Atmosphere 2023, 14, 1267. [Google Scholar] [CrossRef]
- Rehmat, R.; Rafique, L.; Irfan, M.; Ahmed, S.R.; Lahori, A.H.; Muhammadi, A.; Taha, M.; Vambol, S.; Shulga, M. Space-borne Air Quality Monitoring of Nitrogen dioxide (NO2) over Karachi and Lahore using Remote Sensing Tools. Proc. Pak. Acad. Sci. B Life Environ. Sci. 2023, 60. [Google Scholar] [CrossRef]
- Gurjar, B.R.; Butler, T.; Lawrence, M.; Lelieveld, J. Evaluation of emissions and air quality in megacities. Atmos. Environ. 2008, 42, 1593–1606. [Google Scholar] [CrossRef]
- Zaman-ul-Haq, M.; Kanwal, A.; Gardezi, A.A.; Fatima, H.; Saqib, Z.; Bokhari, S.A.; Nasr, E.A.; Ahmad, S.; Shafiq, M. Assessing Spatial-Temporal Changes in Monetary Values of Urban Ecosystem Services through Remotely Sensed Data. Sustainability 2022, 14, 15136. [Google Scholar] [CrossRef]
- Patil, D.S.; Chavan, S.M.; Oubagaranadin, J.U.K. A review of technologies for manganese removal from wastewaters. J. Environ. Chem. Eng. 2016, 4, 468–487. [Google Scholar] [CrossRef]
- Khalil, L.; Abbas, S.; Hussain, K.; Zaman, K.; Iswan; Salamun, H.; Hassan, Z.B.; Anser, M.K. Sanitation, water, energy use, and traffic volume affect environmental quality: Go-for-green developmental policies. PLoS ONE 2022, 17, e0271017. [Google Scholar] [CrossRef] [PubMed]
- Zafar, M.W.; Saeed, A.; Zaidi, S.A.H.; Waheed, A. The linkages among natural resources, renewable energy consumption, and environmental quality: A path toward sustainable development. Sustain. Dev. 2021, 29, 353–362. [Google Scholar] [CrossRef]
- Imran, A. Four Million Added to Karachi’s Population; DAWN: Lahore, Pakistan, 2023. [Google Scholar]
- Das, A.; Nergis, Y.; Butt, J.A.; Khan, M.J. Spatial-Temporal Re-Analysis of Seasonal Air Quality Data in Karachi City for Future Prospects. Int. J. Econ. Environ. Geol. 2022, 13, 38–44. [Google Scholar] [CrossRef]
- Shelton, S.; Liyanage, G.; Jayasekara, S.; Pushpawela, B.; Rathnayake, U.; Jayasundara, A.; Jayasooriya, L.D. Seasonal Variability of Air Pollutants and Their Relationships to Meteorological Parameters in an Urban Environment. Adv. Meteorol. 2022, 2022, 5628911. [Google Scholar] [CrossRef]
- Mukta, T.A.; Hoque, M.M.M.; Sarker, M.E.; Hossain, M.N.; Biswas, G.K. Seasonal variations of gaseous air pollutants (SO2, NO2, O3, CO) and particulates (PM2.5, PM10) in Gazipur: An industrial city in Bangladesh. Adv. Environ. Technol. 2020, 6, 195–209. [Google Scholar]
- Mao, M.; Rao, L.; Jiang, H.; He, S.; Zhang, X. Air pollutants in metropolises of eastern coastal China. Int. J. Environ. Res. Public Health 2022, 19, 15332. [Google Scholar] [CrossRef] [PubMed]
- Hashmi, D.R.; Khan, F.A.; Shareef, A.; Abbasi, F.A.; Sheikh, G.H.; Munshi, A.B. Measurement of Atmospheric Concentrations of CO, SO, NO and NOx in Urban Areas of Karachi City, Pakistan: Inorganic Ion Concentrations in Urban Karachi Atmosphere. Biol. Sci.-PJSIR 2010, 53, 25–29. [Google Scholar]
- Fernández-Yáñez, P.; Soriano, J.A.; Mata, C.; Armas, O.; Pla, B.; Bermúdez, V. Simulation of Optimal Driving for Minimization of Fuel Consumption or NOx Emissions in a Diesel Vehicle. Energies 2021, 14, 5513. [Google Scholar] [CrossRef]
- Manisalidis, I.; Stavropoulou, E.; Stavropoulos, A.; Bezirtzoglou, E. Environmental and health impacts of air pollution: A review. Front. Public Health 2020, 8, 14. [Google Scholar] [CrossRef] [PubMed]
- Jia, M.; Zhao, T.; Cheng, X.; Gong, S.; Zhang, X.; Tang, L.; Liu, D.; Wu, X.; Wang, L.; Chen, Y. Inverse relations of PM2.5 and O3 in air compound pollution between cold and hot seasons over an urban area of east China. Atmosphere 2017, 8, 59. [Google Scholar] [CrossRef]
- Ravina, M.; Caramitti, G.; Panepinto, D.; Zanetti, M. Air quality and photochemical reactions: Analysis of NOx and NO2 concentrations in the urban area of Turin, Italy. Air Qual. Atmos. Health 2022, 15, 541–558. [Google Scholar] [CrossRef]
- Kyung, S.Y.; Jeong, S.H. Particulate-matter related respiratory diseases. Tuberc. Respir. Dis. 2020, 83, 116. [Google Scholar] [CrossRef]
- Zoran, M.A.; Savastru, R.S.; Savastru, D.M.; Tautan, M.N. Assessing the relationship between surface levels of PM2. 5 and PM10 particulate matter impact on COVID-19 in Milan, Italy. Sci. Total Environ. 2020, 738, 139825. [Google Scholar] [CrossRef]
- Kim, J.B.; Prunicki, M.; Haddad, F.; Dant, C.; Sampath, V.; Patel, R.; Smith, E.; Akdis, C.; Balmes, J.; Snyder, M.P. Cumulative lifetime burden of cardiovascular disease from early exposure to air pollution. J. Am. Heart Assoc. 2020, 9, e014944. [Google Scholar] [CrossRef]
- Garcia, A.; Santa-Helena, E.; De Falco, A.; de Paula Ribeiro, J.; Gioda, A.; Gioda, C.R. Toxicological Effects of Fine Particulate Matter (PM2.5): Health Risks and Associated Systemic Injuries—Systematic Review. Water Air Soil Pollut. 2023, 234, 346. [Google Scholar] [CrossRef]
- Klumpp, A.; Domingos, M.; Pignata, M.L. Air pollution and vegetation damage in South America—State of knowledge and perspectives. In Environmental Pollution and Plant Responses; Routledge: Oxfordshire, UK, 2023; pp. 111–136. [Google Scholar]
- Dadkhah-Aghdash, H.; Zare-Maivan, H.; Heydari, M.; Sharifi, M.; Lucas-Borja, M.E.; Naidu, R. Air pollution from gas refinery through contamination with various elements disrupts semiarid Zagros oak (Quercus brantii Lindl.) forests, Iran. Sci. Rep. 2022, 12, 284. [Google Scholar] [CrossRef] [PubMed]
- Liu, H.; Hu, Z.; Zhou, M.; Zhang, H.; Zhang, X.; Yue, Y.; Yao, X.; Wang, J.; Xi, C.; Zheng, P. PM2.5 drives bacterial functions for carbon, nitrogen, and sulfur cycles in the atmosphere. Environ. Pollut. 2022, 295, 118715. [Google Scholar] [CrossRef] [PubMed]
- Ayala-Cortés, M.; Barrera-Huertas, H.A.; Sedeño-Díaz, J.E.; López-López, E. Impact of Particulate Matter (PM10 and PM2.5) from a Thermoelectric Power Plant on Morpho-Functional Traits of Rhizophora mangle L. Leaves. Forests 2023, 14, 976. [Google Scholar] [CrossRef]
- Chen, S.; Oliva, P.; Zhang, P. The effect of air pollution on migration: Evidence from China. J. Dev. Econ. 2022, 156, 102833. [Google Scholar] [CrossRef]
- Piracha, A.; Chaudhary, M.T. Urban air pollution, urban heat island and human health: A review of the literature. Sustainability 2022, 14, 9234. [Google Scholar] [CrossRef]
- Singh, V.; Singh, S.; Biswal, A. Exceedances and trends of particulate matter (PM2.5) in five Indian megacities. Sci. Total Environ. 2021, 750, 141461. [Google Scholar] [CrossRef]

| Major Industrial Zones | Description of Industrial Zones in Karachi |
|---|---|
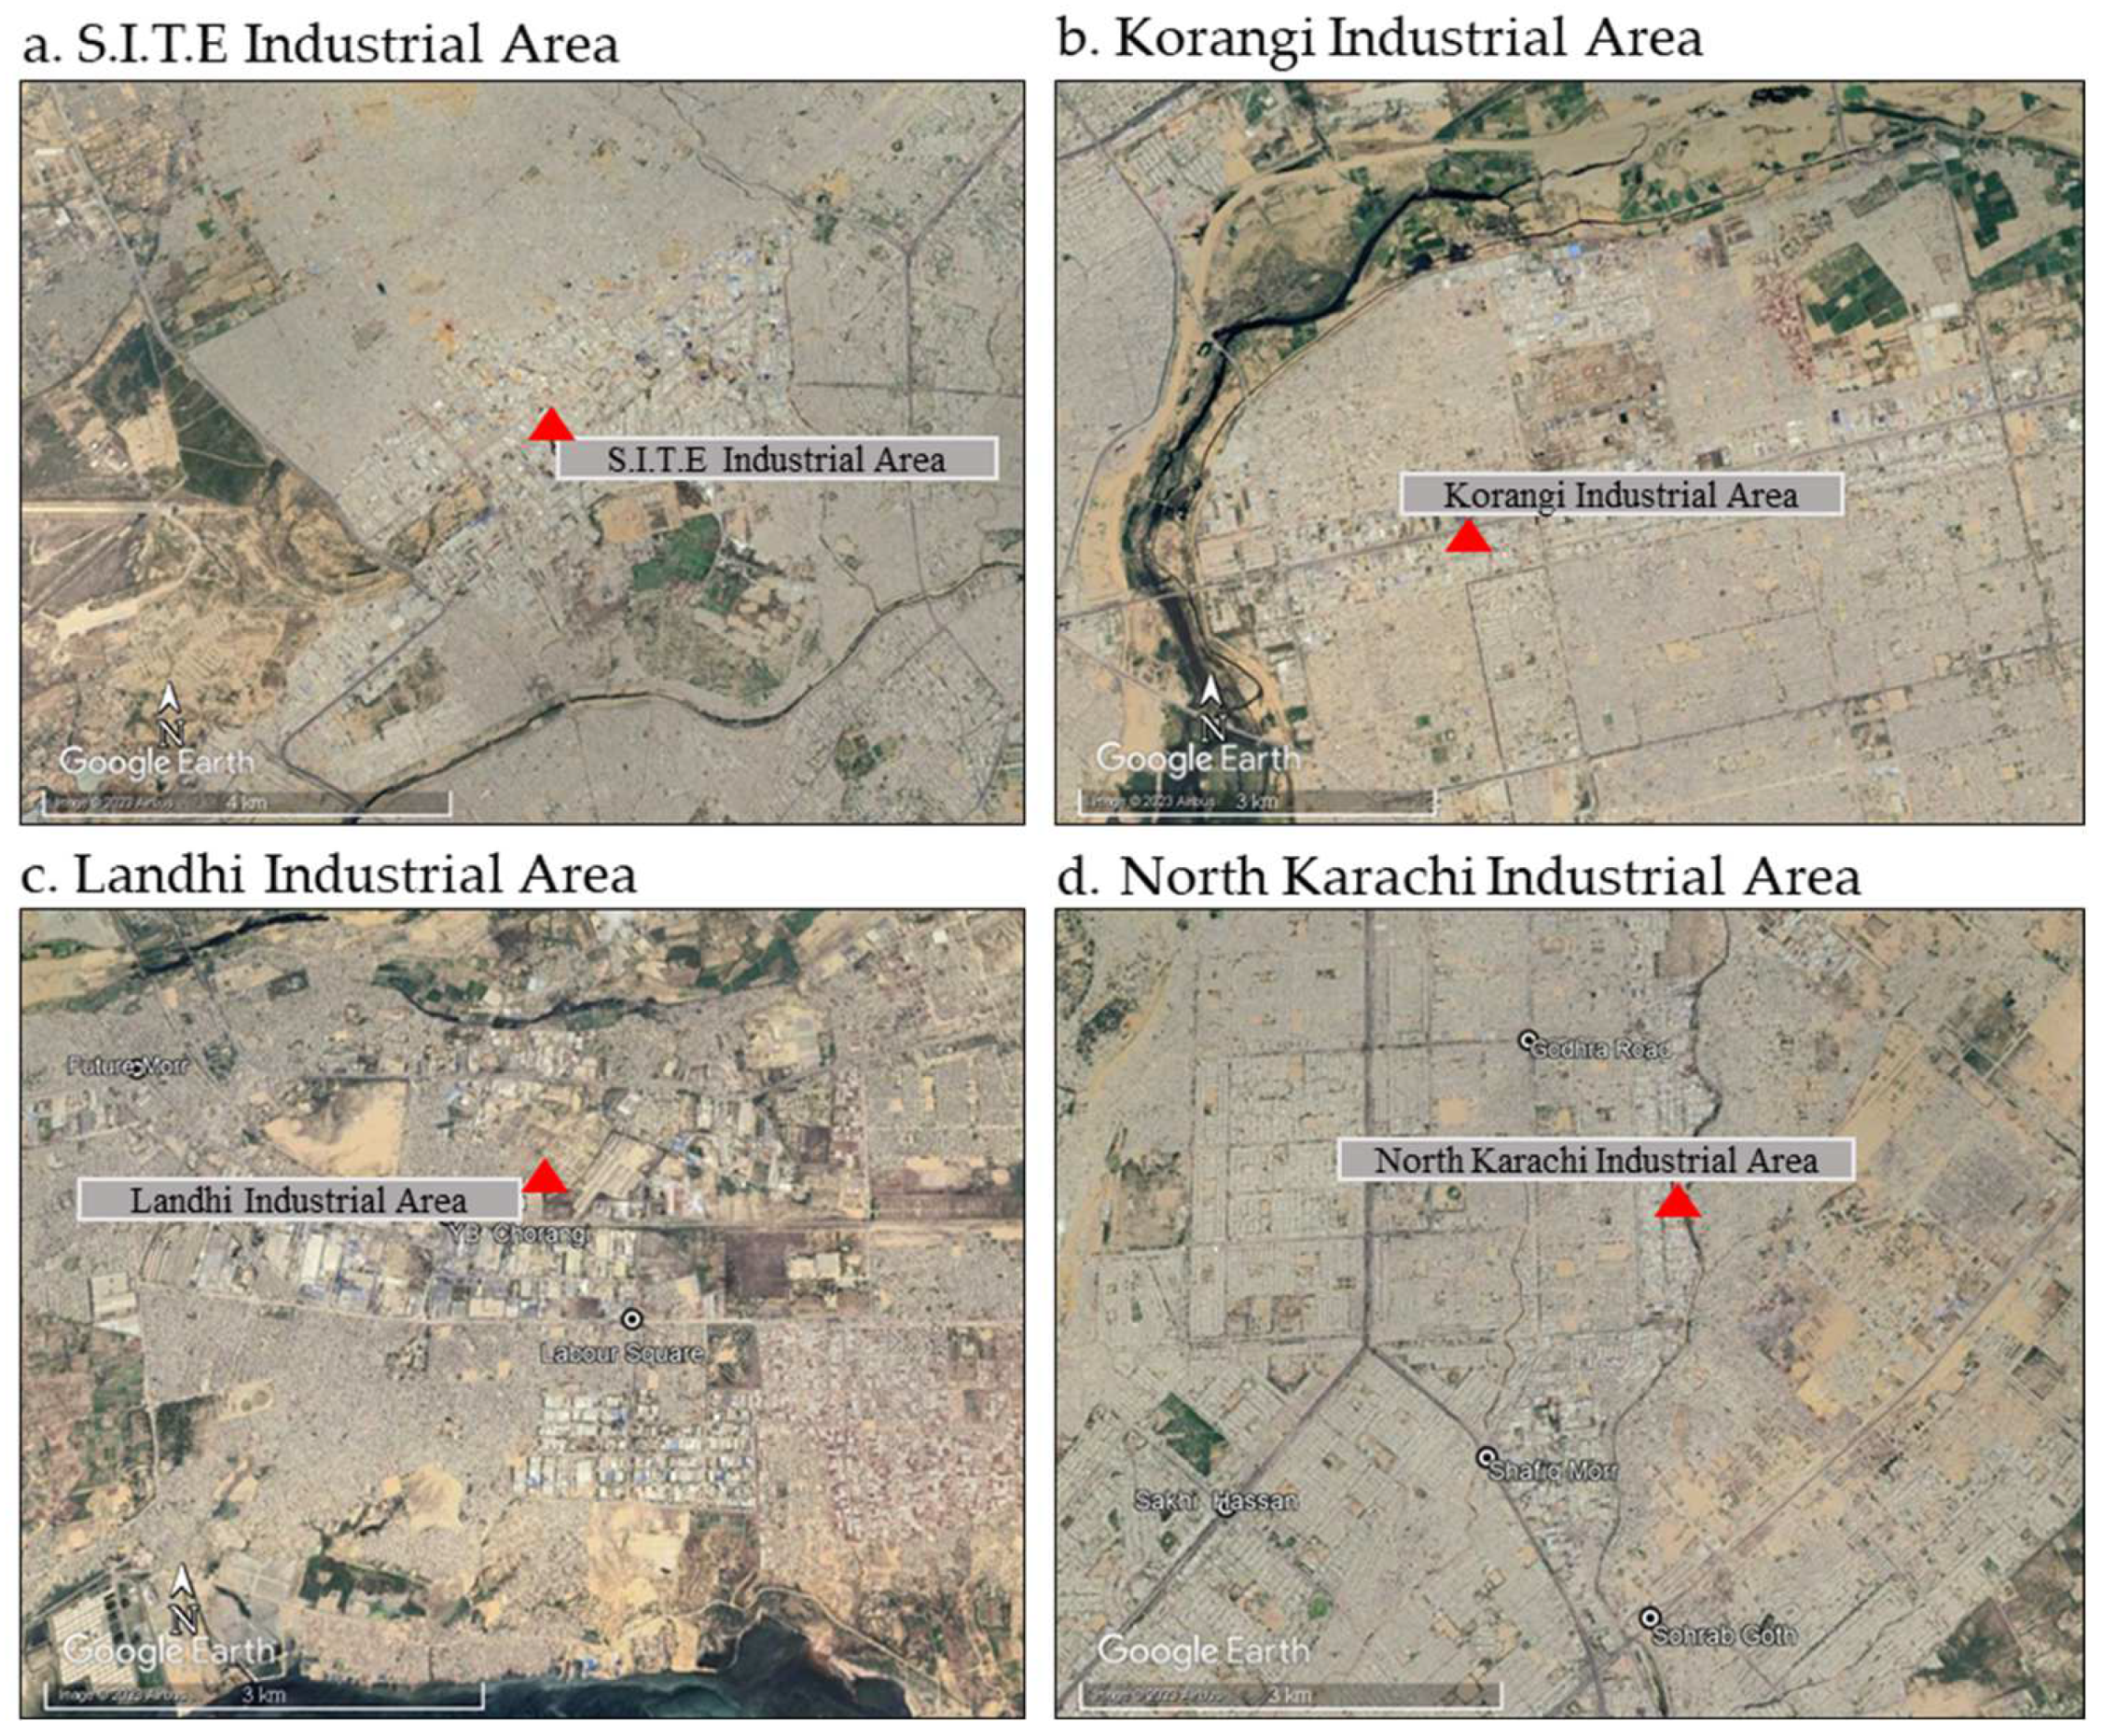
| Sindh Industrial Trading Estates (SITE) | The total covered area of 4500 acres land in west of the Lyari River, there are more than 2000 industrial units. The Textile, Steel, Pharmaceutical, Automotive, Chemical, and Engineering, Beverage, and Grain mills are some of the major industries. The worker colonies grew up around the industrial estate, the town expanded. |
| Korangi Industrial Area | It is spread over an area of 8500 acres. 8500 acres make up its total surface area. Around 3000 facilities, including those for the Textile, Steel, Pharmaceutical, Automotive, Chemical, Engineering, Food, and Wheat milling industries, are located in the Korangi Industrial Area. |
| Landhi Industrial Area | Its land area is around 11,000 acres (4500 ha), and it is made up of medium- and large-sized industries. Numerous industries are located in the industrial area, including Wheat mills, Textile, Pharmaceutical, Automotive, Chemical, and Steel. |
| North Karachi Industrial Area | It came into existence in 1974. It is scattered and spread over an area of 725 acres with more than 2000 commercial, industrial, and service units containing Automobile, Textile, Engineering, and Food, etc. |
| Contamination | Instrument | Range | Accuracy | Resolution | Manufacturer |
|---|---|---|---|---|---|
| SO2 | HIM-6000 | 0–5000 ppb | ±5 ppb | 5 min | Haz-Scanner, Plaistow, NH, USA |
| NO2 | HIM-6000 | 0–5000 ppb | ±5 ppb | 5 min | Haz-Scanner, Plaistow, NH, USA |
| CO | HIM-6000 | 0–100 ppm | ±0.01 ppm | 5 min | Haz-Scanner, Plaistow, NH, USA |
| PM2.5 | 11 R | 0.1 µg/m3–100 mg/m3 | ±3% | 1 min | GRIMM, Berlin, Germany |
| PM10 | 11 R | 0.1 µg/m3–00 mg/m3 | ±3% | 1 min | GRIMM, Berlin, Germany |
| CO | NO2 | SO2 | TSPM | PM10 | PM2.5 | ||||||||
|---|---|---|---|---|---|---|---|---|---|---|---|---|---|
| SEQs (µg/m3) | 10 | 80 | 120 | 500 | 150 | 75 | |||||||
| Sampling Sites | PMS | PtMS | PMS | PtMS | PMS | PtMS | PMS | PtMS | PMS | PtMS | PMS | PtMS | |
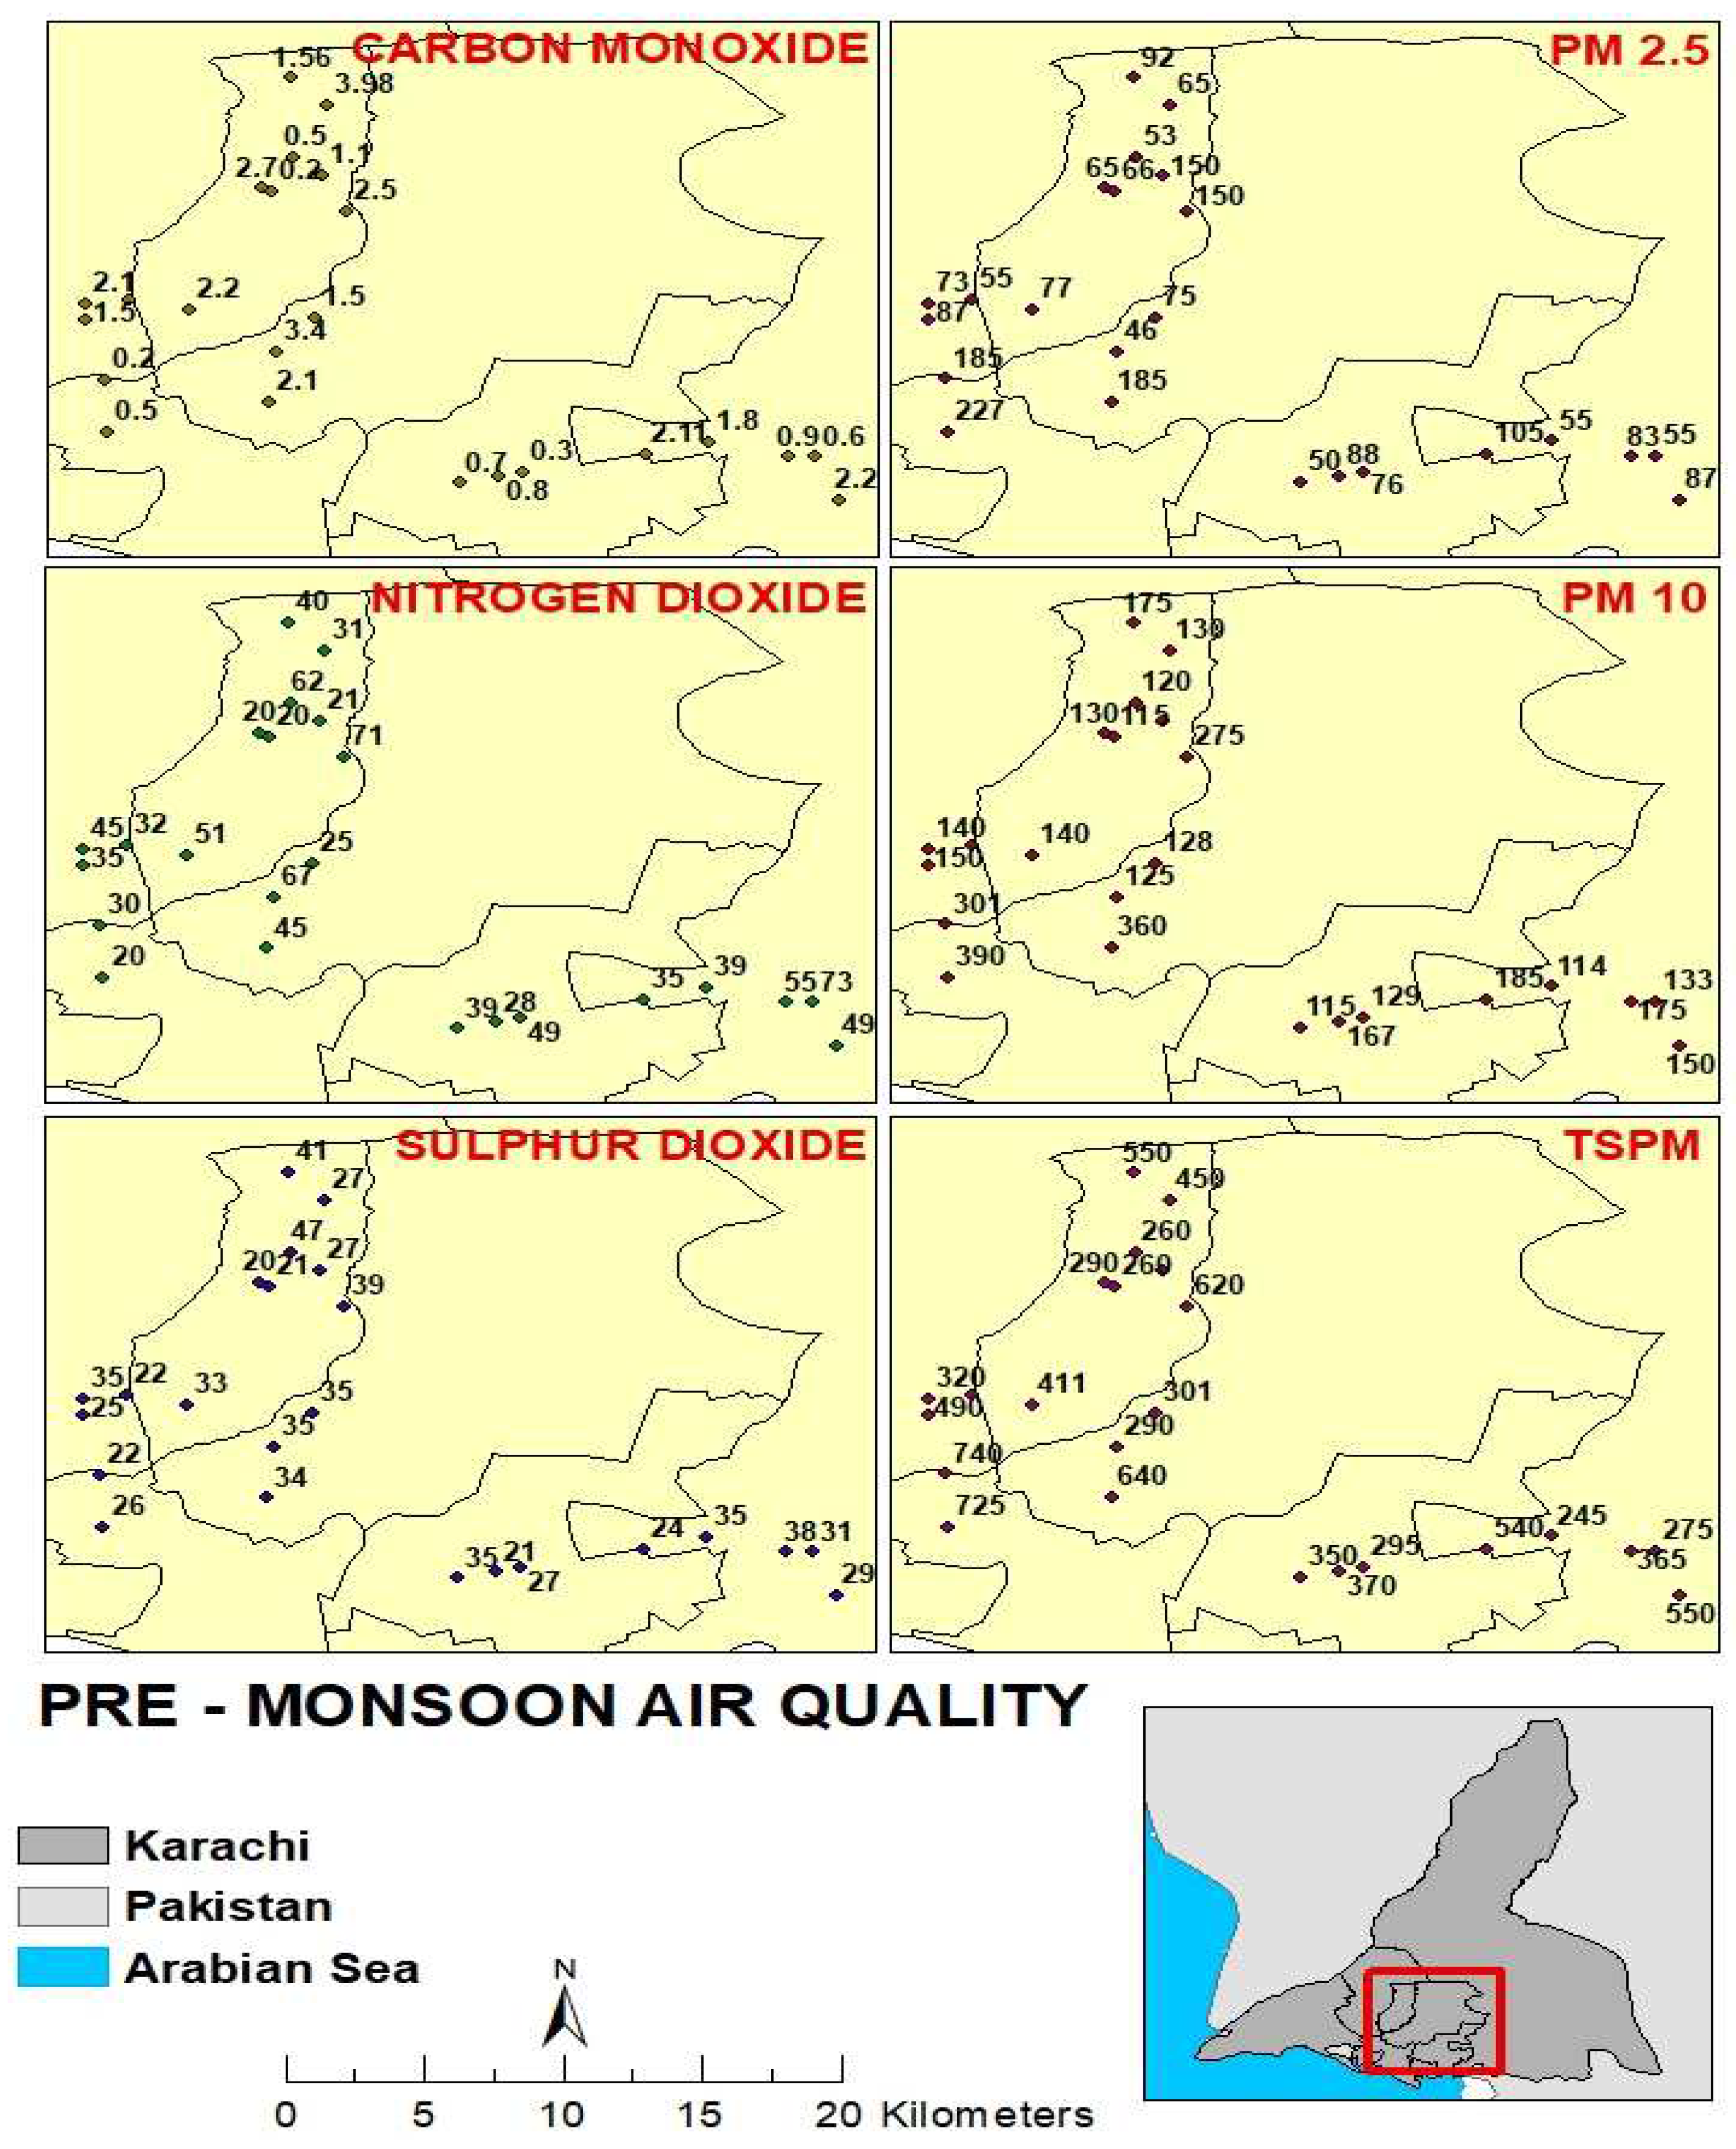
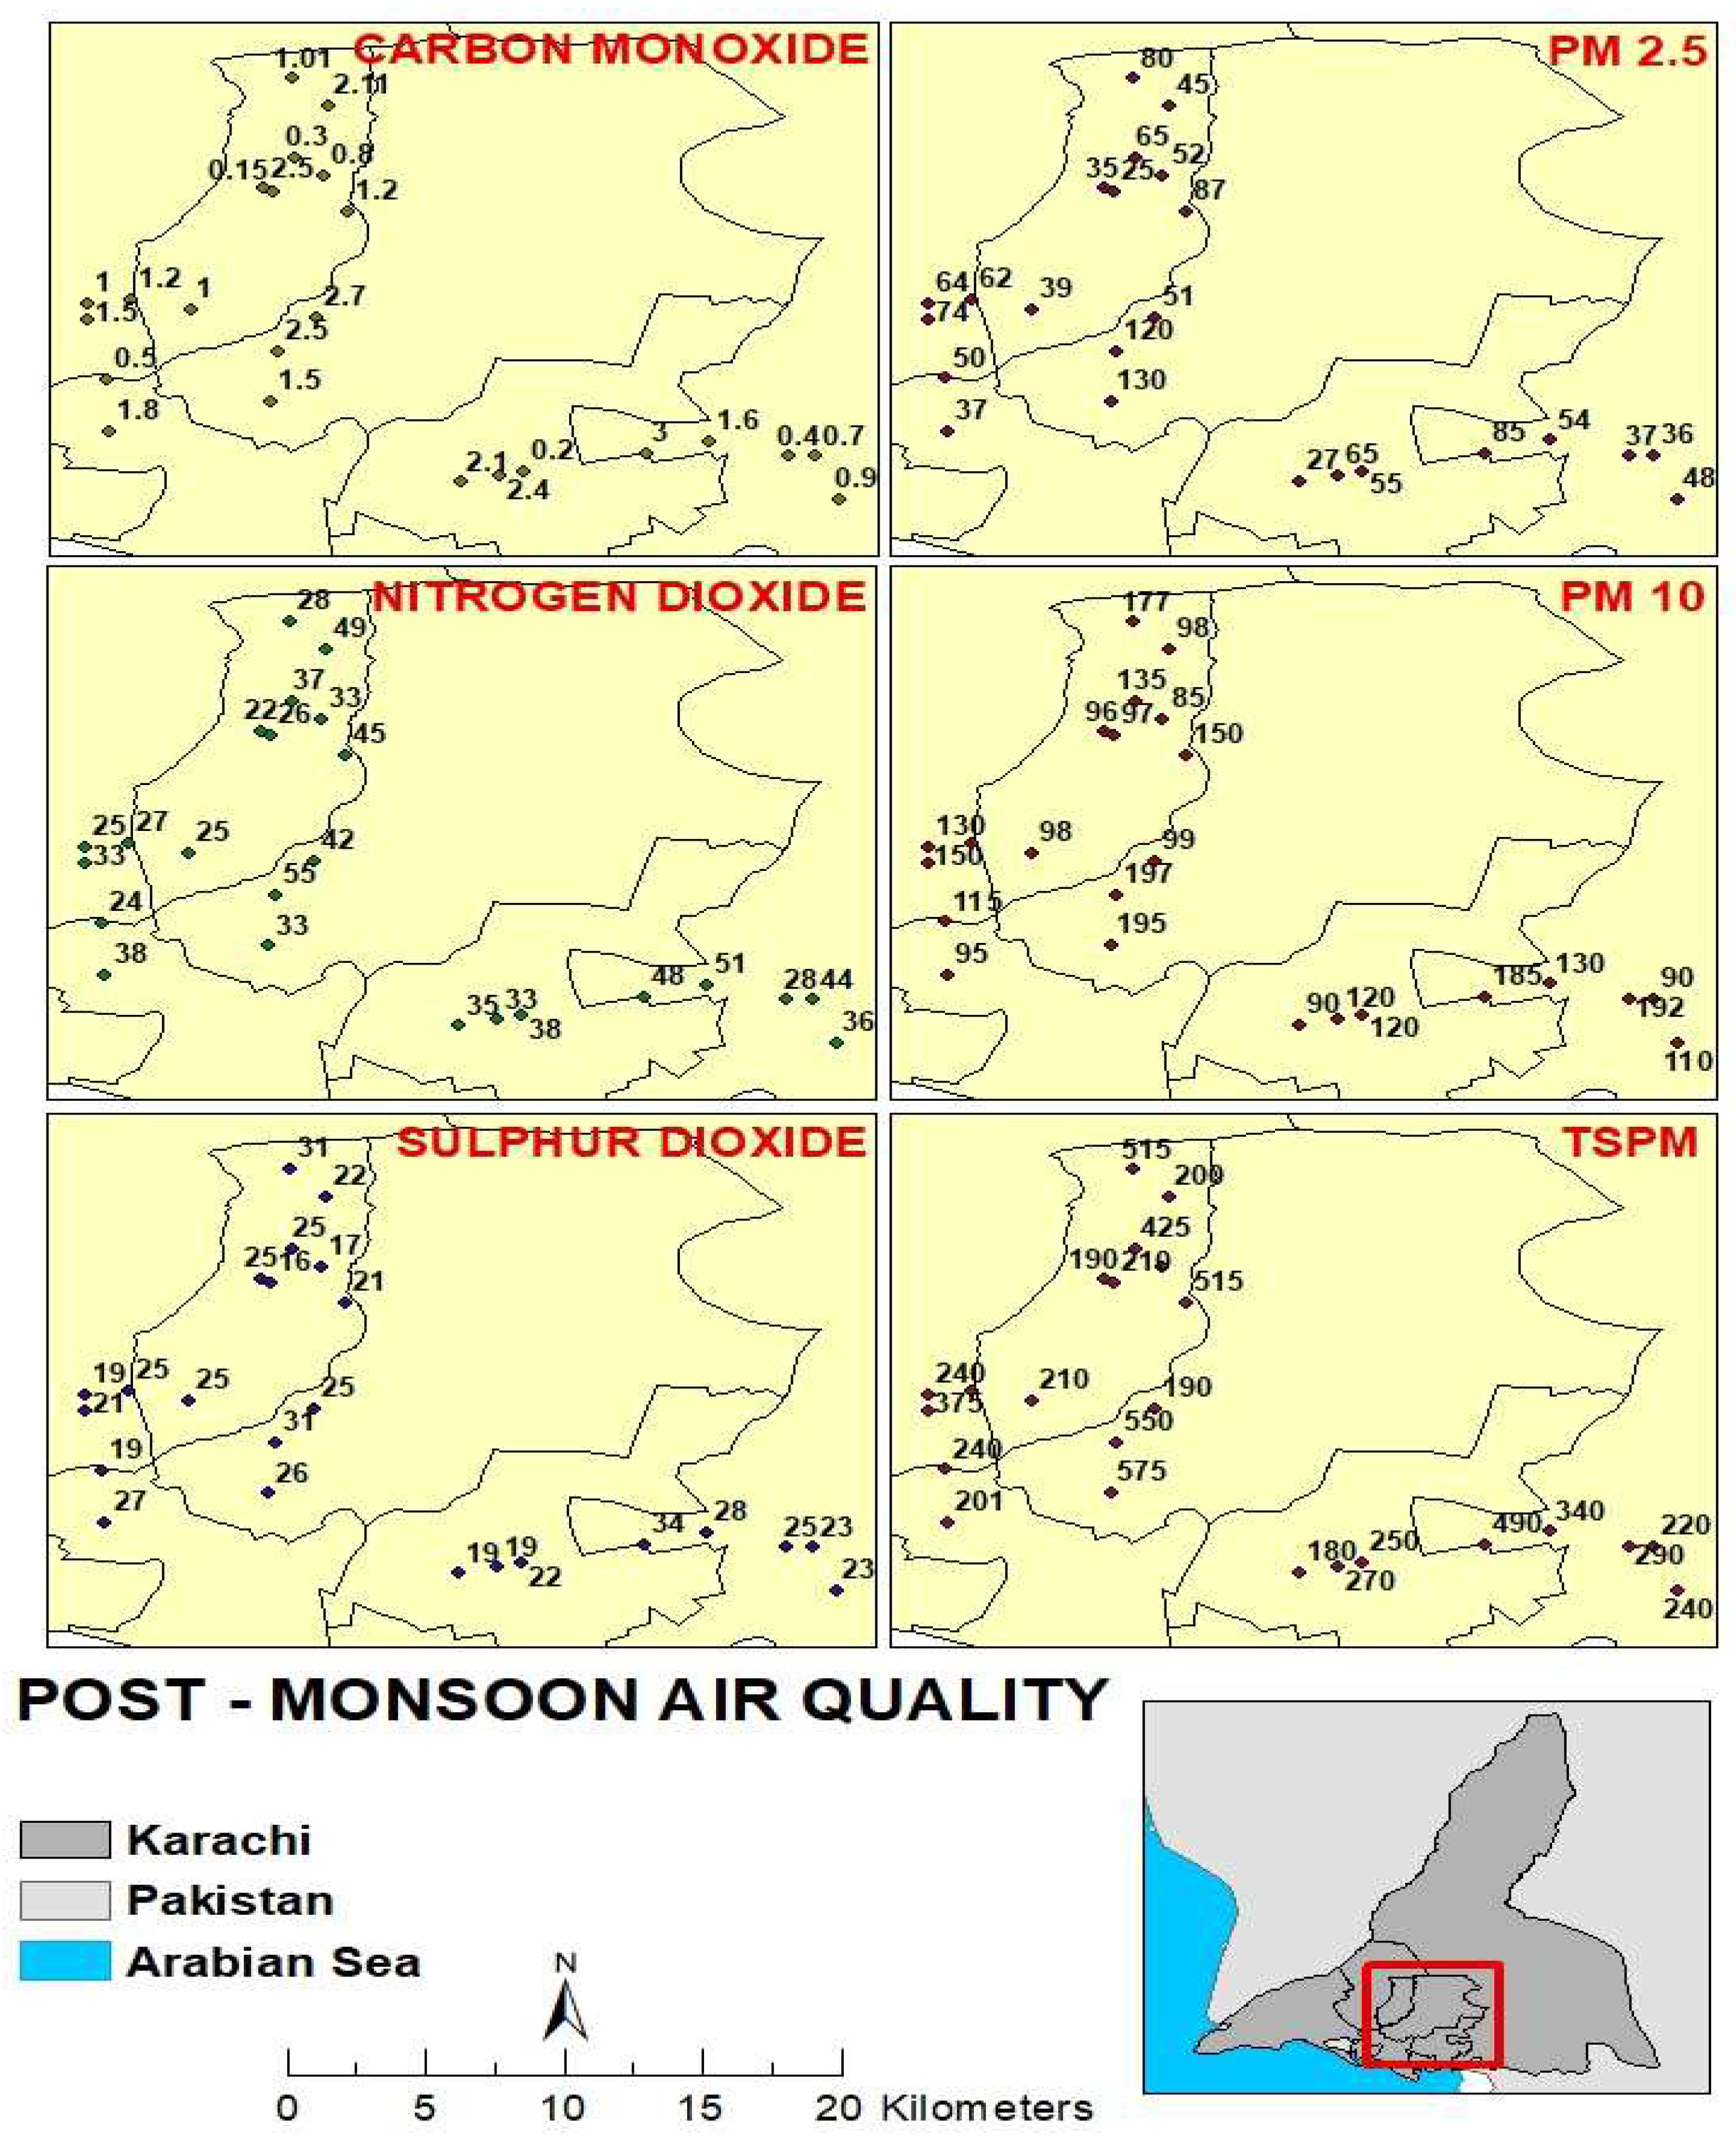
| 1 | H B Chorangi | 1.1 | 1.2 | 32 | 27 | 22 | 25 | 485 | 275 | 130 | 135 | 55 | 62 |
| 2 | Siemen Square | 1.5 | 1.5 | 35 | 33 | 25 | 21 | 490 | 375 | 150 | 150 | 87 | 74 |
| 3 | Ghani square | 1.56 | 1.01 | 40 | 28 | 41 | 31 | 550 | 515 | 175 | 177 | 92 | 80 |
| 4 | Valika Road | 2.1 | 1 | 45 | 25 | 35 | 19 | 320 | 240 | 140 | 130 | 73 | 64 |
| 5 | Labour Square | 2.2 | 0.9 | 49 | 36 | 29 | 23 | 550 | 240 | 150 | 110 | 87 | 48 |
| 6 | Denim Road | 2.2 | 1 | 51 | 25 | 33 | 25 | 411 | 210 | 140 | 98 | 77 | 39 |
| 7 | Bilal Chorangi | 0.3 | 0.2 | 49 | 38 | 27 | 22 | 295 | 250 | 129 | 120 | 76 | 55 |
| 8 | Vita Chorangi | 0.8 | 2.4 | 28 | 33 | 21 | 19 | 370 | 270 | 167 | 120 | 88 | 65 |
| 9 | Singer Square | 1.5 | 2.7 | 25 | 42 | 35 | 25 | 301 | 190 | 128 | 99 | 75 | 51 |
| 10 | Murtaza Square | 2.11 | 3 | 35 | 48 | 24 | 34 | 540 | 490 | 185 | 185 | 105 | 85 |
| 11 | Dar ul Aloom | 0.5 | 1.8 | 20 | 38 | 26 | 27 | 725 | 201 | 390 | 95 | 227 | 37 |
| 12 | Shan Chorangi | 0.7 | 2.1 | 39 | 35 | 35 | 19 | 350 | 180 | 115 | 90 | 50 | 27 |
| 13 | Nagan square | 0.5 | 0.3 | 62 | 37 | 47 | 25 | 260 | 425 | 120 | 135 | 53 | 65 |
| 14 | Sohrab Goth | 2.5 | 1.2 | 71 | 45 | 39 | 21 | 620 | 515 | 275 | 150 | 150 | 87 |
| 15 | Shafiq Morr | 1.1 | 0.8 | 21 | 33 | 27 | 17 | 590 | 190 | 260 | 85 | 150 | 52 |
| 16 | Godhra Road | 3.98 | 2.11 | 31 | 49 | 27 | 22 | 450 | 200 | 130 | 98 | 65 | 45 |
| 17 | Sakhi Hassan | 2.7 | 2.5 | 20 | 22 | 20 | 25 | 290 | 190 | 130 | 96 | 65 | 35 |
| 18 | Water pump | 0.2 | 0.15 | 20 | 26 | 21 | 16 | 260 | 210 | 115 | 97 | 66 | 25 |
| 19 | Yunus square | 3.4 | 2.5 | 67 | 55 | 35 | 31 | 290 | 550 | 125 | 197 | 46 | 120 |
| 20 | Dawood square | 2.1 | 1.5 | 45 | 33 | 34 | 26 | 640 | 575 | 360 | 195 | 185 | 130 |
| 21 | LIAR | 0.2 | 0.5 | 30 | 24 | 22 | 19 | 740 | 240 | 301 | 115 | 185 | 50 |
| 22 | YB Chorangi | 0.9 | 0.4 | 55 | 28 | 38 | 25 | 365 | 290 | 175 | 192 | 83 | 37 |
| 23 | Zafar Town | 0.6 | 0.7 | 73 | 44 | 31 | 23 | 275 | 220 | 133 | 90 | 55 | 36 |
| 24 | Future Morr | 1.8 | 1.6 | 39 | 51 | 35 | 28 | 245 | 340 | 114 | 130 | 55 | 54 |
| Parameters | Structural Equation Model |
|---|---|
| CO | |
| NO2 | |
| SO2 | |
| TSPM | |
| PM10 | |
| PM2.5 |
Disclaimer/Publisher’s Note: The statements, opinions and data contained in all publications are solely those of the individual author(s) and contributor(s) and not of MDPI and/or the editor(s). MDPI and/or the editor(s) disclaim responsibility for any injury to people or property resulting from any ideas, methods, instructions or products referred to in the content. |
© 2023 by the authors. Licensee MDPI, Basel, Switzerland. This article is an open access article distributed under the terms and conditions of the Creative Commons Attribution (CC BY) license (https://creativecommons.org/licenses/by/4.0/).
Share and Cite
Idrees, M.; Nergis, Y.; Irfan, M. Industrial Emission Monitoring and Assessment of Air Quality in Karachi Coastal City, Pakistan. Atmosphere 2023, 14, 1515. https://doi.org/10.3390/atmos14101515
Idrees M, Nergis Y, Irfan M. Industrial Emission Monitoring and Assessment of Air Quality in Karachi Coastal City, Pakistan. Atmosphere. 2023; 14(10):1515. https://doi.org/10.3390/atmos14101515
Chicago/Turabian StyleIdrees, Mohammad, Yasmin Nergis, and Muhammad Irfan. 2023. "Industrial Emission Monitoring and Assessment of Air Quality in Karachi Coastal City, Pakistan" Atmosphere 14, no. 10: 1515. https://doi.org/10.3390/atmos14101515
APA StyleIdrees, M., Nergis, Y., & Irfan, M. (2023). Industrial Emission Monitoring and Assessment of Air Quality in Karachi Coastal City, Pakistan. Atmosphere, 14(10), 1515. https://doi.org/10.3390/atmos14101515