Article

How Well Does Weather Research and Forecasting (WRF) Model Simulate Storm Rashmi (2008) Itself and Its Associated Extreme Precipitation over the Tibetan Plateau at the Same Time?

1
Department of Atmospheric and Oceanic Sciences, Institute of Atmospheric Sciences, Fudan University, Shanghai 200438, China
2
State Key Laboratory of Severe Weather, Chinese Academy of Meteorological Sciences, Beijing 100081, China
3
Sichuan Provincial Meteorological Service Center, Chengdu 610072, China
*
Author to whom correspondence should be addressed.
Atmosphere 2023, 14(10), 1479; https://doi.org/10.3390/atmos14101479
Submission received: 28 August 2023 / Revised: 17 September 2023 / Accepted: 21 September 2023 / Published: 24 September 2023
(This article belongs to the Special Issue Extreme Hydrometeorological Forecasting)

Abstract

:
Northward tropical cyclones over the Bay of Bengal (BoB TCs) often interact with atmospheric circulation, transporting large amounts of water vapor to the Tibetan Plateau (TP), causing extreme precipitation. The BoB surrounded by land on three sides and the complex topography of the TP bring challenges to implementing numerical simulation in these regions. However, the scarcity of data in the two areas makes it necessary to find a technological process to perform practicable numerical simulations on the BoB TC and its induced extreme precipitation to carry out further research. In this study, the WRF 3.9.1 is used to perform many simulation experiments on a northward BoB TC Rashmi (2008) from 24 to 27 October 2008 associated with a record-breaking extreme precipitation on the TP, indicating that the selection of the simulation region, the source of initial-boundary conditions, and the cumulus convection schemes are three important factors influencing the results. We examined and compared the simulation of Rashmi with 10 experiments that were generated by combining The Final Operational Global Analysis (FNL) reanalysis data and the European Centre for Medium-Range Weather Forecasting 5(th) generation reanalysis (ERA5) data as initial-boundary conditions with five cumulus convection schemes. Most of the experiments can predict Rashmi and precipitation in the TP to a certain degree, but present different characteristics. Compared with FNL, the ERA5 performs well regarding Rashmi’s intensity and thermal structure but overestimates Rashmi’s moving speed. For the extreme precipitation in the TP, experiments suffice to reproduce the heavy rainfall (>25 mm/day) in the TP, with TS and ETS scores above 0.3 and most HSS scores greater than 0.4. The optimal experiments of three stations with extreme precipitation deviated from the actual precipitation by less than 15%. The ERA5 TDK scheme is recommended as the optimal solution for balancing the simulation of Rashmi and its extreme precipitation in the TP.

1. Introduction

Tropical cyclones (TCs) are intense atmospheric vortex systems generated in tropical oceans. These cyclones in the Northern Indian Ocean (including the Arabian Sea and the Bay of Bengal) are commonly referred to as a ’cyclonic storm‘ and account for approximately 13% of the total number of tropical cyclones generated globally, and TCs over the Bay of Bengal (BoB TCs) represent 10% of the world total [1]. About 58% of BoB TCs made landfall in Bangladesh, a country with a flaring terrain and a concentrated coastal population, generating significant damage in the area [2]. Northward BoB TCs often bring abundant moisture to the Tibetan Plateau (TP), and their interaction with atmospheric systems such as the south branch trough (SBT) and subtropical jet can easily affect the weather in the TP, producing extreme precipitation, snow, flooding, and mudslides [3,4]. Xiao and Duan [5] showed that, in May and October, the ’double peak‘ period of TC activity in the BoB produced more than 50% of the monthly precipitation on the TP. For example, TC Rashmi, taking place in October 2008, generated significant severe rainfall and snowfall in the Tibet Autonomous Region of China during its northward progression, inflicting substantial infrastructure damage and fatalities. However, meteorological stations in the areas under BoB TCs’ influence are scarce, and the available reanalysis data (such as 0.25° resolution in ERA5 and 1° in FNL) are of coarse resolution, so studies of the fine scale of BoB TCs and the precipitation that they cause in the highlands continue to rely heavily on refined numerical simulations. The BoB is situated in a triangle between the Indian Peninsula and the Indochina Peninsula in the North Indian Ocean, and is bordered to the north by the TP. Due to its complex sea–land configuration and background circulation, it is one of the most difficult regions for mesoscale numerical simulations.
The WRF model has evolved and become the main mesoscale atmospheric model for tropical cyclone (TC) simulations in recent years [6,7,8]. There is no optimal combination of microphysical and cumulus convective parameterization schemes that can simultaneously best simulate TCs’ precipitation, track, and landfall time. Moreover, there does not exist a combination of physical parameterization schemes that performs well for all TCs [9]. Therefore, it is important to evaluate the advantages and disadvantages of different physical parameterized scheme combinations for different TCs and to explore the optimal (better) scheme combinations for further research on TCs. Sun et al. [10] examined the ability of Grell–Devenyi (GD) and Betts–Miller–Janjic (BMJ) cumulus parameterized schemes to simulate ‘Megi (2010)’ and revealed the physical mechanisms behind the differences between the two schemes. Parker et al. [11] compared the sensitivity of the track, intensification process, and velocity of tropical cyclone ‘Yasi (2011)’ to initial conditions, physical parameterization, and sea surface temperature. Islam et al. [12] and Delfino et al. [13] comprehensively evaluated initial and boundary conditions, surface flux parameterizations, cumulus convection schemes, cloud microphysics schemes, and planetary boundary layer schemes for the simulation of tropical cyclone ‘Haiyan (2013)’ in the Western Pacific. The Bay of Bengal TC simulation research has also changed from using the MM5 model to the WRF model [14]. Chutia et al. [2] evaluated different cloud microphysical parameterization schemes and horizontal resolution in WRF for the BoB TC ‘MORA (2017)’. It was found that the WSM3 scheme has the best simulation effect and improving the horizontal resolution can optimize the simulation effect. Xalxo et al. [15] simulated the track and intensity of the BoB TC ‘Amphan (2020)’ with various radiation schemes and discovered that there is no significant difference in the simulation ability of different radiation schemes. Raju et al. [16] combined two boundary layer schemes, three cumulus convection schemes, and five cloud microphysics schemes to simulate ‘Nargis (2008)’, and the result displayed that the BoB TC is highly sensitive to cumulus convection and cloud microphysics schemes. Mohan et al. [17] utilized WRF to analyze 10 TCs in the BoB at 9 km and 3 km horizontal resolution using cumulus convective parameterization and explicit convection, respectively, and found that the latter simulation performed better. Land surface processes and soil moisture can also influence the simulation of TC track and intensity after landfall [18], with Noah and RUC schemes being able to simulate the BoB TC ‘Yemyin (2007)’ better, whereas soil moisture at zero was not conducive to Yemyin’s development and maintenance [19]. There was additional research evaluating the ability of various initial conditions, cumulus convection schemes, and boundary layer schemes to mimic TCs in the BoB [20,21,22,23,24]. From these simulations, it is evident that there are still obstacles in successfully modeling the track and intensity of BoB TCs simultaneously, with shortcomings mainly in the underestimation of the simulated intensity of strong TCs and the overestimation of the simulated intensity of weak TCs, as well as the difficulty in reproducing the rapid strengthening and weakening processes [25]. In addition, mesoscale simulation models of tropical cyclones in the BoB continue to be weaker than those in the Western Pacific and Atlantic.
Some studies have shown that simulations of precipitation on the TP are very sensitive to cumulus convection and cloud microphysics schemes [26,27]. However, parametric schemes with better simulation results for TP precipitation may perform poorly in terms of TC track, intensity, and structure simulation. The capacity to simulate TCs’ extreme precipitation is uncertain, particularly under the complex topographical conditions of the TP. Therefore, it is essential to conduct a huge number of experiments and assess the results to determine the ideal combination of parametric schemes that simultaneously perform well for both the TC Rashmi and the extreme precipitation on the TP under the TC’s impact. The primary objective of this study is to compare the ability of different scheme combinations to simulate TC Rashmi and its induced precipitation on the TP using the WRF model in order to determine the optimal scheme setting for the model to describe both the Rashmi activity and its precipitation impact. Then, we also reveal some of the refined physical processes that reproduce the Rashmi’s activity and its influence on the occurrence of extreme precipitation on the TP.
The remainder of the paper is structured as follows. Section 2 gives a description of the numerical model and data used. Section 3 describes Rashmi’s activity and the precipitation in the TP. Section 4 and Section 5 are the main conclusions of the study, and Section 6 is the summaries and discussion.

2. Model Description and Data Used

With nearly ten million permutations of the main parameter schemes in the cumulus convection, cloud microphysics, boundary layer, land surface process, and radiation schemes alone [28], it is neither practical nor cost-effective to combine all the influencing factors to find the optimal solution. From the available simulation experience, different boundary layer schemes, land surface process schemes, and radiation schemes have relatively little bias in the simulation of BoB TC track and intensity [15,29], whereas different initial and boundary conditions (henceforth referred to as ‘initial-boundary conditions’) and cumulus convection schemes have greater bias [20,30,31,32]. Therefore, based on the WRF 3.9.1 model [33], we combine two initial-boundary conditions formed by commonly used reanalysis data with five cumulus convection schemes to conduct ten numerical simulation experiments. A two-layer bidirectional nested grid (Figure 1) with grid resolutions of 27 km and 9 km and a huge number of longitudinal and latitudinal grid points of 200 × 205 and 451 × 451 is used. It is important to note that the finer resolution is not adopted because we are mainly targeting the cumulus convection scheme, which is recommended to be turned off at higher resolutions.
In previous works and our experiments, we found that the track and intensity of Rashmi are very sensitive to the cumulus convective scheme, which is worthy of further study. The center of the outermost grid was positioned at (16.76° N, 92.15° E). D01 regions were outputted every 3 h, whereas D02 areas were outputted every hour. We adopted non-linear vertical stretching, with a total of 65 layers, and the model’s highest level’s pressure was 48.4 hPa. Table 1 lists the parameterization schemes used, which includes the Dudhia shortwave radiation scheme [34], the RRTM longwave radiation scheme [35], the YSU planetary boundary layer scheme [36], and the Noah land surface process scheme [37]. All following work is based on the inner nested grid data, with the model spin-up time integration starting 6 h earlier from 00:00 UTC 24 to 00:00 UTC 28 October 2008. It should be emphasized that during the simulation of Rashmi and other BoB TCs, we discover that the choice of the extent of the simulated area has a significant impact on the TC’s track, particularly when the southern boundary of the outermost grid is to the north, causing oscillations in the simulated TC’s track. This is likely due to the unique land and sea environment arrangement of the BoB, where the tiny ocean area in the simulated region causes the TC development to be too impacted by the land, hence creating a track deviation.
The Final Operational Global Analysis (FNL) reanalysis data with 1 resolution at 6 h intervals and the fifth generation of the European Centre for Medium-Range Weather Forecasts (ECMWF) reanalysis data for the global climate and weather (ERA5) with 0.25 resolution at 1 h intervals are used to form the initial field and boundary condition as the WRF’s driver. Five cumulus parameterization schemes, including Betts–Miller–Janjic (BMJ), New Tiedtke (TDK), Grell–Freitas (GF), Kain–Fritsch (KF), and New SAS (SAS), are carried out [38,39,40,41,42]. Other settings and parameter schemes are matched to the two reanalysis datasets mentioned before to provide 10 simulation and analysis comparison trials (Table 1).
The coverage of the TP (denoted by bold blue lines in Figures 1, 2, 4, 7 and bold orange lines in Figure 5) is determined by shapefile data from the Institute of Geographic Sciences and Natural Resources Research, the Chinese Academy of Sciences [43]. The 2-resolution terrain elevation data from the National Centers for Environmental Information (NCEI) of the National Oceanic and Atmospheric Administration (NOAA) are used to specify terrain heights mentioned herein.
The best track data over the North Indian Ocean, provided by the Joint Typhoon Warning Center (JTWC), are used to compare the track and intensity of Rashmi with the results of the ten experiments. Hourly geostationary top equivalent blackbody brightness temperature (TBB) data from Kochi University cloud with 0.1° resolution at 1 h intervals are used to examine the distribution of clouds in the ten experiments. The Tropical Rainfall Measuring Mission (TRMM) 3B42 product is used to evaluate the capacity of individual experiments to replicate precipitation patterns, while the China Meteorological Administration station precipitation data are used to evaluate the ability to simulate daily precipitation.

3. Rashmi’s Activity and Precipitation in TP

According to the JTWC’s best track dataset, Rashmi formed in the BoB (16° N, 85° E) around 00:00 UTC 24 October 2008, with a maximum near-center wind speed (Vmax) of 7.72 m s−1 and a minimum sea level pressure (MSLP) of 1010 hPa. It made landfall off the southern coast of Khulna, Bangladesh at around 22:30 UTC 26 October [44] and weakened to the north, halting at 06:00 UTC 27 October (25° N, 90.6° E) with Vmax as 12.86 m s−1 and MSLP of 989 hPa. Precipitation on the southeast of the TP mostly occurred between 12:00 UTC 26 October and 12:00 UTC 27 October, both before and after the TC made landfall.
Compared to the normal BoB TC, Rashmi is weaker and has a shorter life, but its main cloud system is larger in extent (Figure 2a). The radius of maximum wind (RMW) reached 92.6 km when Rashmi was on the surface of the BoB (00:00 UTC 26 October), which is 1.7 times the average RMW (55 km) of all BoB TCs from 2001 to 2018 [4,45]. Rashmi had a broad inner core and its core temperature was less than −80 °C, with deep convection development prior to landfall on 18:00 UTC 26 October. But, after landfall on 00:00 UTC 27 October, the area covered by the main cloud system decreased sharply and the core that was less than −80 °C disappeared with Rashmi weakening. However, Rashmi’s southwest–northeast trending cloud band on the TP extending over the TP developed and strengthened (Figure 2b). At 06:00 UTC 27 October, the main cloud system dissipated as Rashmi ceased to compose (Figure 2c), but a pile-up developed on the southern side of the TP, after which the residual cloud system continued to weaken and moved northeastward to the southeastern side of the TP (Figure 2d). Areas of precipitation during this period roughly overlap with the cloud system influence area (figures omitted), with snowfall on the TP, occurring mainly in areas with TBB ≤ −50 °C in particular. On the southeastern side of the TP, the daily precipitation at six stations—Bomi (95.76° E, 29.86° N), Cona (91.95° E, 27.98° N), Zayu (97.46° E, 28.65° N), Gongshan (98.66° E, 27.75° N), Milin (94.22° E, 29.22° N), and Deqin (98.91° E, 28.48° N)—from 12:00 UTC 26 October to 12:00 UTC 27 October exceeded the extreme precipitation threshold maximum of 51.9 mm on the TP from 1961 to 2017 according to Ma et al. [46]. This extreme precipitation process occurred with a mixture of rain and snow, with most of the snowfall occurring in areas above 4 km in altitude. When the precipitation simulations are compared below, no distinction is made between precipitation patterns for the time being.

4. Results

For the ten experiments, Rashmi’s center is plotted every six hours to build tracks, using the MSLP as Rashmi’s centers and the 10 m high instantaneous maximum wind speed at ground level (10 m-MWS) as the Vmax. For each moment in the experiment and JTWC, the absolute distance error (km) from Rashmi’s center, the MSLP errors, and the Vmax errors are determined. For convenience, we refer to the two sets of experiments using FNL (ERA5) data as the initial-boundary conditions as FNL (ERA5) experiments. The scheme with FNL (ERA5) data as the initial-boundary conditions in combination with BMJ cumulus convection is termed the FNL BMJ (ERA5 BMJ) scheme. BMJ schemes will represent the FNL BMJ scheme and ERA5 BMJ scheme. The same applies to others.

4.1. Simulations of the Track and Strength of Rashmi

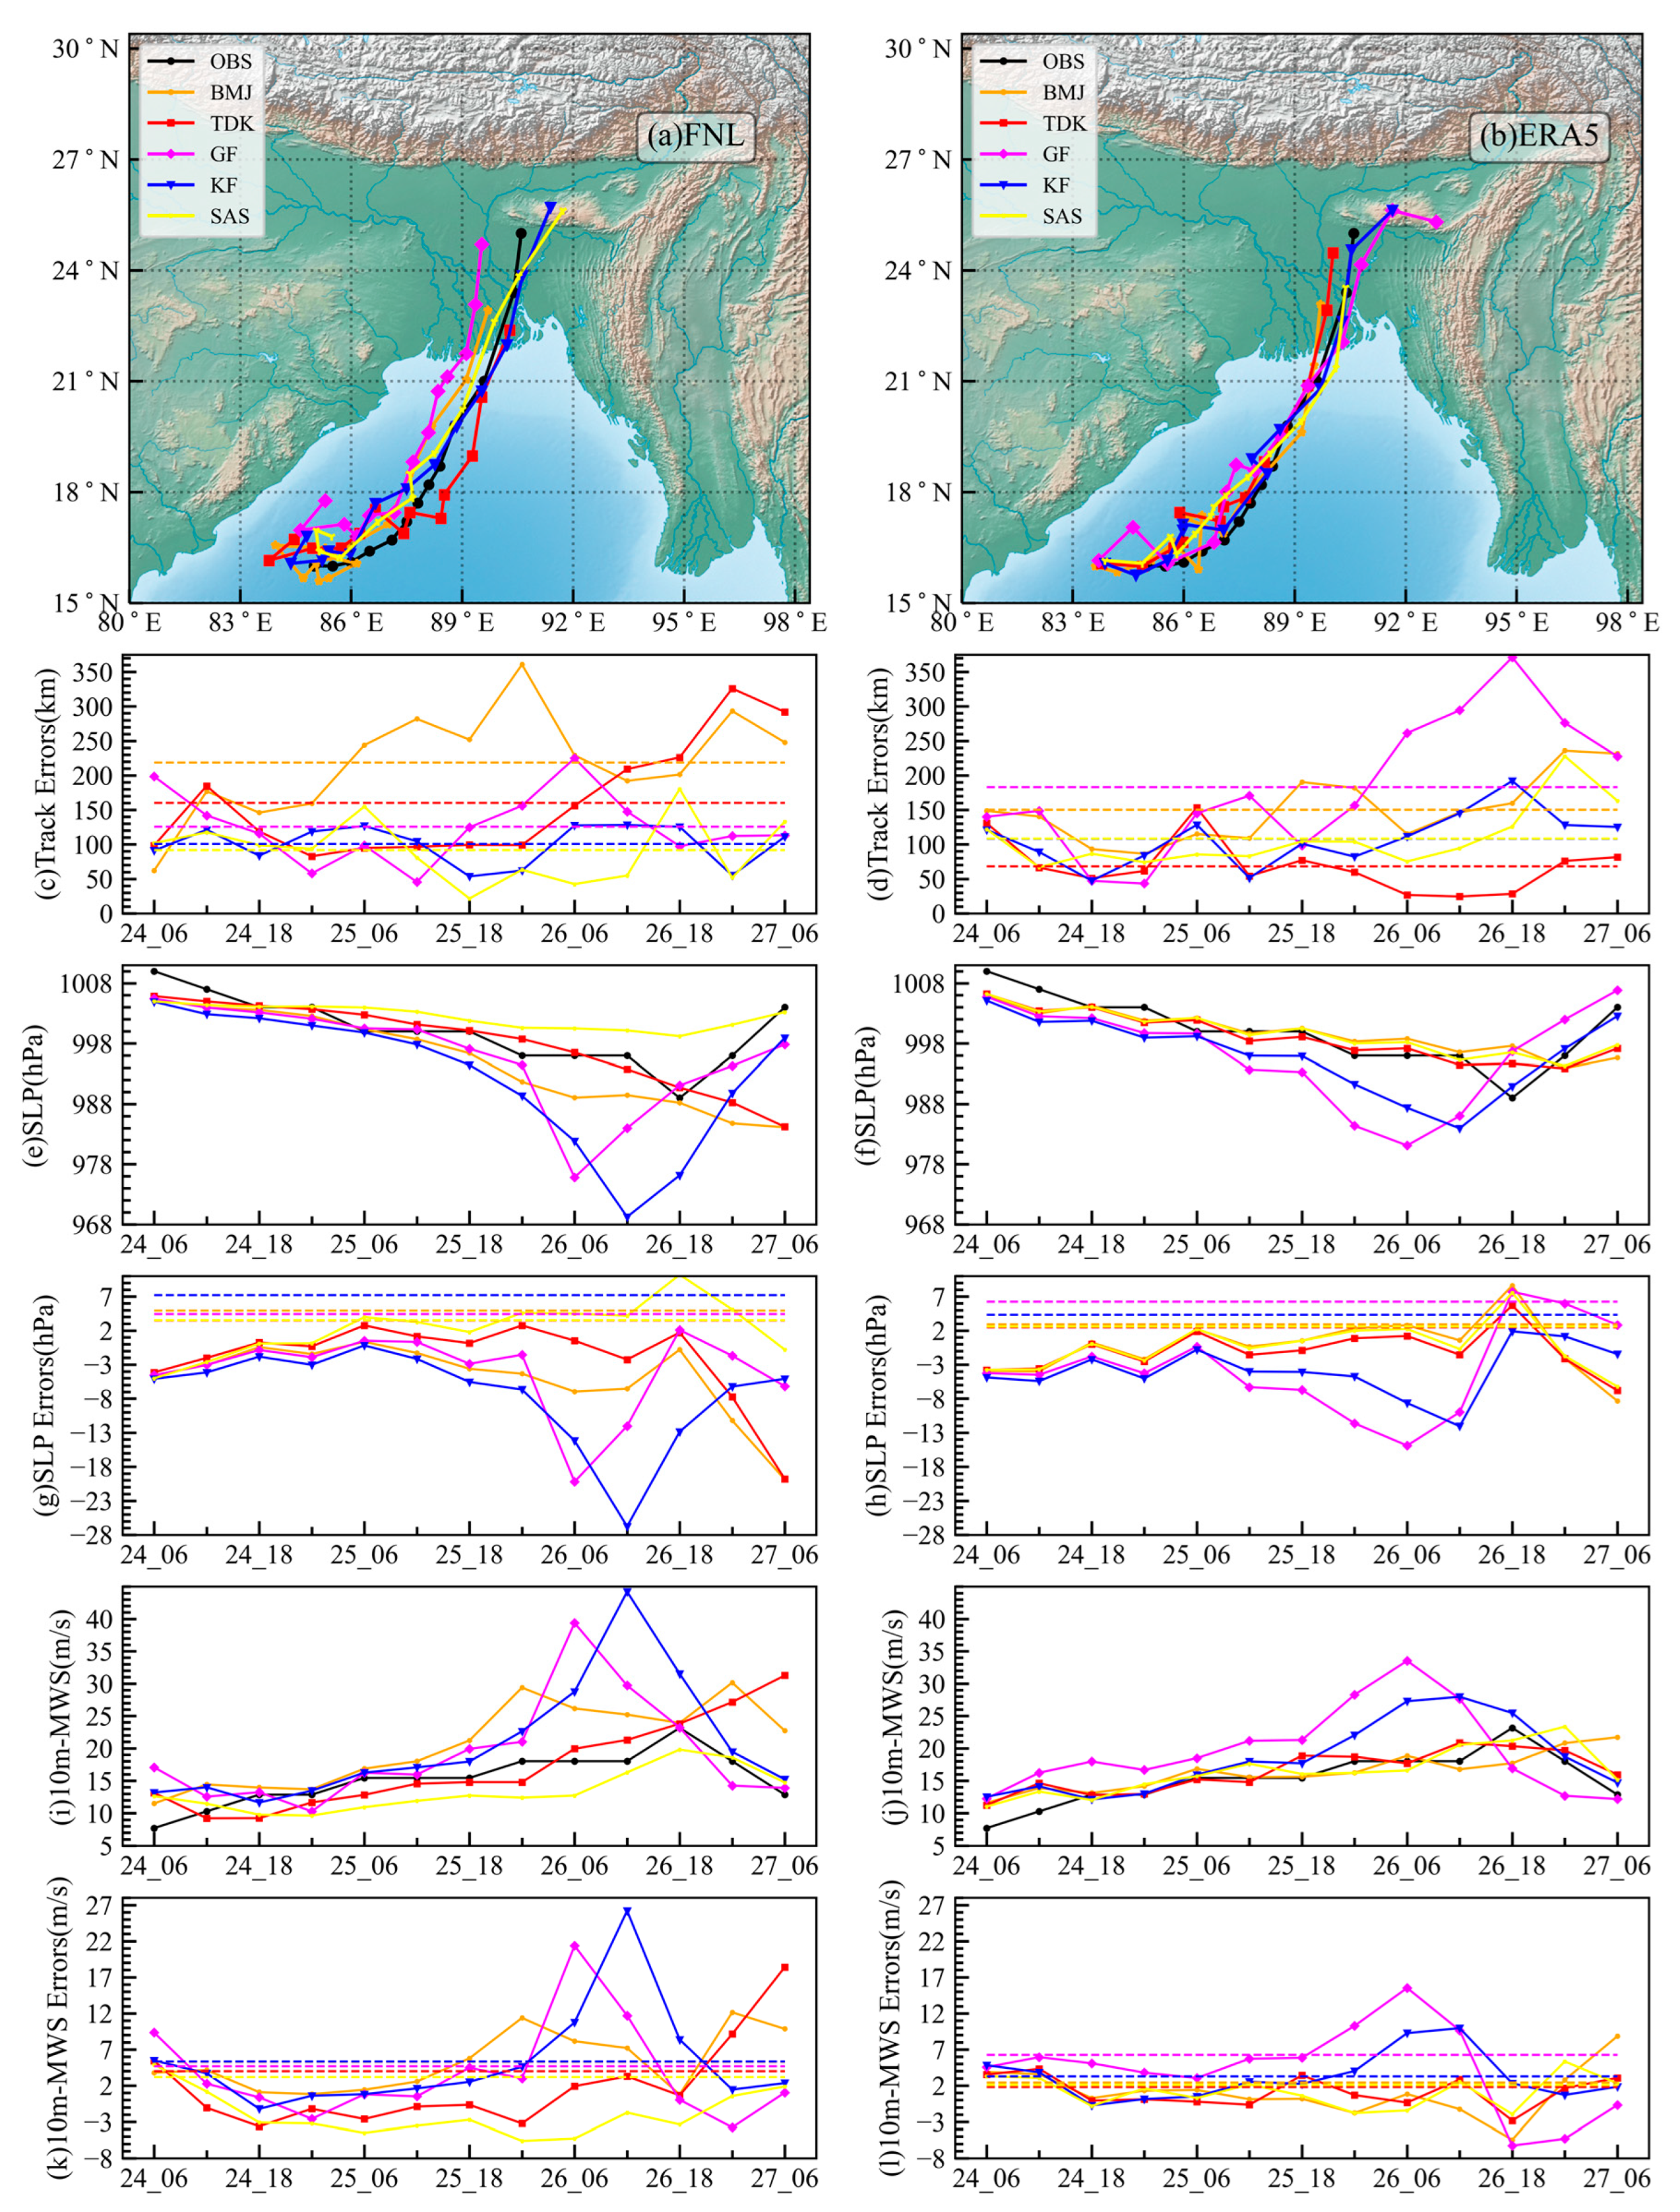
The ERA5 experiments’ tracks simulation is more concentrated than the FNL (Figure 3a,b), and the errors between the former and JTWC are also slightly smaller than the latter. The FNL BMJ, FNL TDK, ERA5 BMJ, and ERA5 SAS schemes have a slow overall movement velocity. The FNL SAS, FNL KF, ERA5 GF, and ERA5 KF schemes are too fast, while the FNL GF scheme and ERA5 TDK scheme are normal. The sensitivity of the TDK, SAS, and GF cumulus convection schemes to the initial-boundary conditions is higher than that of the BMJ and KF cumulus convection schemes, as shown by the similarity of the BMJ and KF schemes for the two different initial-boundary conditions. Based on the track error lines (yellow line in Figure 3c and red line in Figure 3d) and the mean absolute track error (Table 2), we can find that the FNL SAS scheme and the ERA5 TDK scheme are the best schemes for the two different initial-boundary conditions tests, with mean absolute errors of 91.9 km and 68.5 km, respectively.
The MSLP (Figure 3e,f) and 10 m MWS (Figure 3i,j) show that the MSLP (10 m MWS) of the FNL experiments is slightly lower (higher) than that of the ERA5 experiments, indicating that the FNL experiment is about 40% stronger than the ERA5 experiment (calculated by average of 10 m MWS), but the latter is closer to the weak TC intensity of the Rashmi. The mean MSLP errors for the FNL TDK and ERA5 TDK schemes are 3.5 hPa and 2.5 hPa, respectively, although the FNL SAS and ERA5 SAS schemes are extremely near to both. The FNL SAS and ERA5 TDK systems have mean 10 m MWS errors of 3.19 m/s and 1.83 m/s, respectively. In terms of track error, SLP, and 10 m MWS, the FNL SAS and ERA5 TDK schemes are the best in both experiments, whereas the FNL KF and ERA5 GF schemes performed the worst, respectively.

4.2. Simulation of Rashmi’s Cloud System Structure

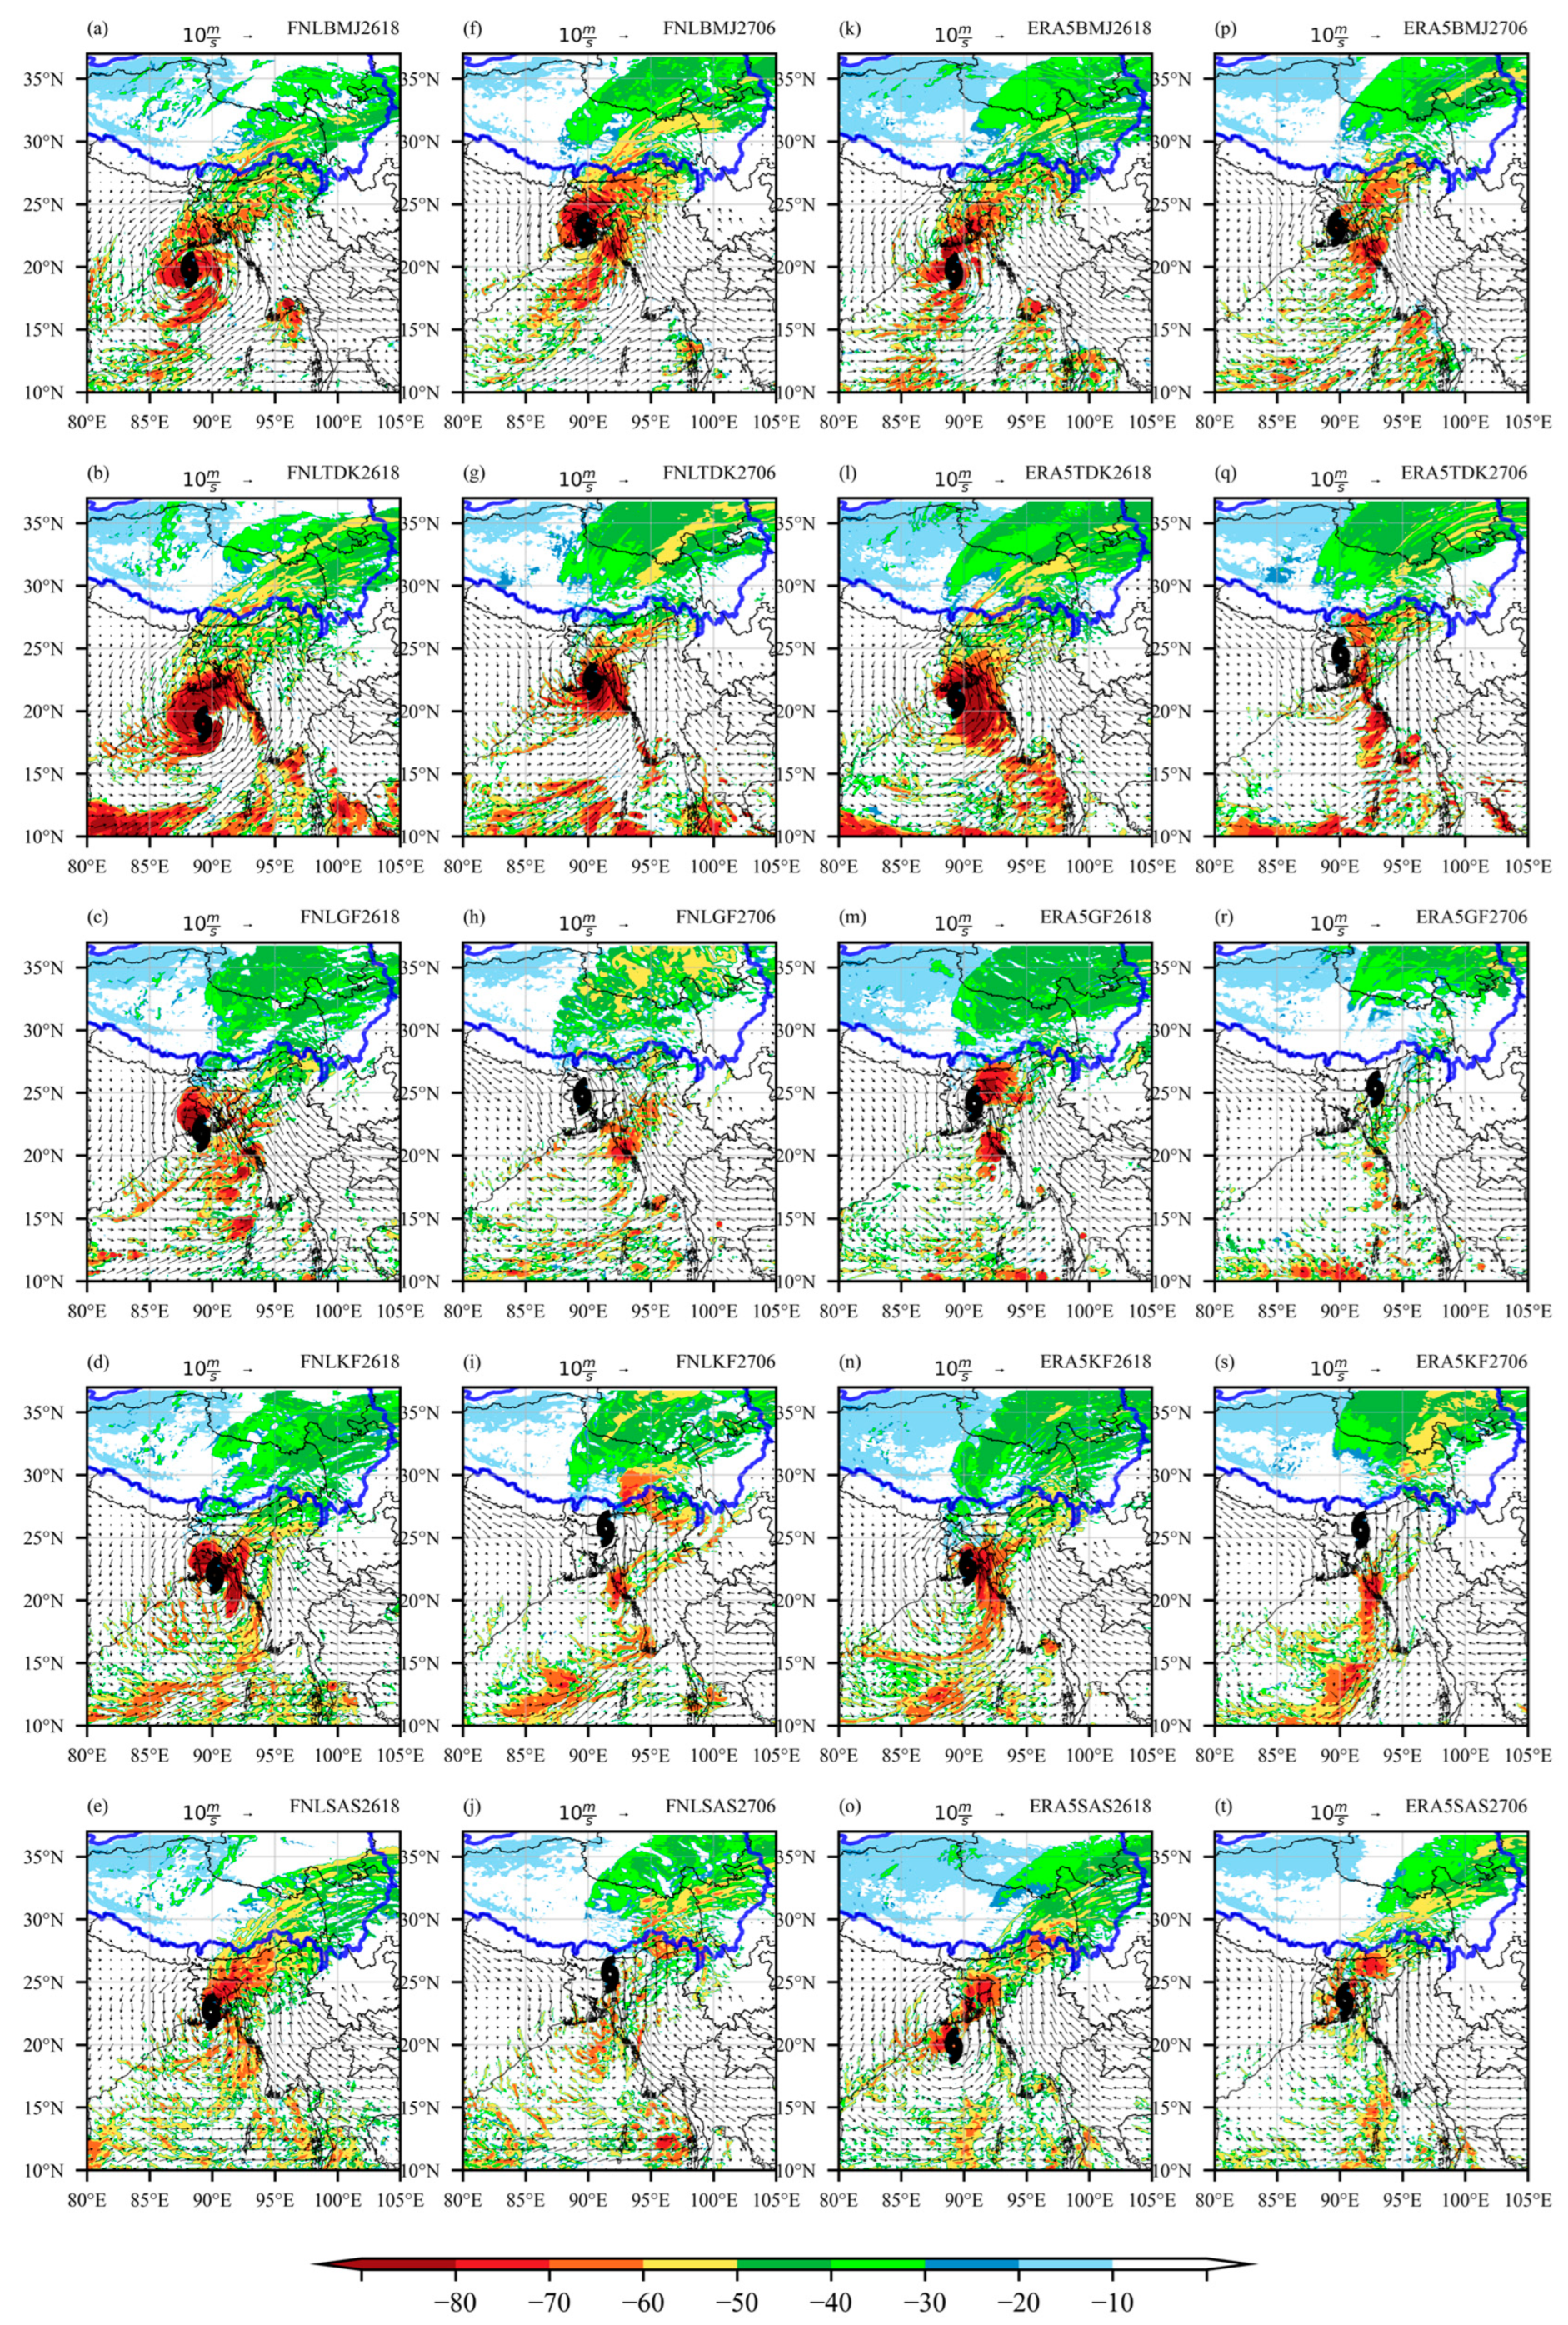
To examine the ability and variability of the cloud system simulation before and after Rashmi landfall, four moments are chosen to compare the cloud top bright temperature and wind field at 850 hPa distribution before Rashmi landfall at 18:00 UTC 26 October and after the TC landfall at 00:00 UTC 27 October, 06:00 UTC 27 October, and 12:00 UTC 27 October with the two moments of each experiment at 18:00 UCT 26 October and 06:00 UTC 26 October (Figure 4).
The simulation effects of each experiment at 18:00 UTC 26 October (Figure 4a–e,k–o) and 06:00 UTC 27 October (Figure 4f–j,p–t) were inspected; that is, the strongest and last moments of Rashmi’s life history recorded by JTWC. Overall, the centers of the simulated Rashmi are more pronounced for the majority of the schemes, but the cloudiness is less than that observed at the same time, and its structure simulated by the FNL experiments is more pronounced than that simulated by the ERA5 experiments, which was related to the overall strength of the simulated Rashmi being stronger in the FNL experiments than in the ERA5 experiments. In terms of the wind field at 850 hPa, the center of circulation and the center of Rashmi are largely coincident. The southerly wind component near 95° E and the northerly wind component formed on the south side of the TP after the cloud mass moved northward are also well reproduced.
The FNL BMJ scheme is slow to move and late in the strengthening process, with the center of Rashmi still offshore but more scattered and weaker at 18:00 UTC 26 October (Figure 4a). Rashmi did not weaken after intensification, resulting in a clear and widespread cloud-top bright temperature low center (<−80 °C) on land at 06:00 UTC 27 October (Figure 4f), with significant cloud build-up on the southern plains of the TP and a stronger cloud system on the northward TP, despite the southerly center of Rashmi relative to the TP. The ERA5 BMJ (Figure 4k,p) scheme is comparable, with the same slow-moving, late intensification and no weakening of Rashmi after intensification, as well as similar characteristics of the cloud-top bright temperature simulations for both, but with a weaker cloud system in the upper northern TP.
The FNL TDK (Figure 4b,g) and the ERA5 TDK schemes (Figure 4l,q) have the most resolved cloud systems and are the most similar to reality. Rashmi in the former does not weaken after strengthening, so the cloud system is still very visible at 06:00 UTC 27 October (Figure 4g), while the latter is most similar to the actual situation (Figure 2c) at 06:00 UTC 27 October (Figure 4q), with the cloud system mainly concentrated on the south-eastern side of the TP.
The ERA5 GF (Figure 4m,r) and ERA5 KF (Figure 4n,s) schemes are too fast-moving and the strengthening process is complete at 18:00 UTC 26 October, when Rashmi is weaker than observed and its clouds have begun to dissipate. At 06:00 UTC 27 October (Figure 4r,s), Rashmi’s center has disappeared, with just a few clouds remaining in the middle and upper TP. Hence, the MSLP estimates that Rashmi’s center is located to the east–northeast. We can consider that Rashmi has ended at this time in fact, but the position of SLP is still retained in the figures as the center for comparative study.
The strengthening and weakening processes of the FNL GF scheme and FNL KF scheme are similar, both showing advance strengthening. Although the GF schemes weaken more quickly than the KF, both are still stronger at 1800 UTC 26 October, so the core of Rashmi is clearer (Figure 4c,d). It is interesting to note that, despite the intensity, the cloud system of Rashmi on the TP is weak and inconspicuous, especially the south-western band of clouds extending north-west (Figure 5a), which is not represented in the simulation. This is because TCs primarily affect the TP via the northward expansion of the outer cloud system or the northward movement of detached cloud masses, whereas, as the higher center of Rashmi strengthens, the inner core is typically denser and the cloud system is more likely to be concentrated around the inner core rather than outward.
The FNL SAS scheme is weaker and the TC cloud system is less prominent at 18:00 UTC 26 October (Figure 4e), and, due to the easterly track after landfall, the TC cloud system is also easterly on the TP at 06:00 UTC 27 October (Figure 4j). In contrast, the ERA5 SAS scheme is stronger than the FNL at 06:00 UTC 27 October (Figure 4t), and the cloud system is clearly stacked on the southeast side of the TP.
Based on the above analysis, it is found that the difficulty in simulating Rashmi lies in the strengthening and weakening process between 12:00 UTC 26 October and 06:00 UTC 27 October. Both the GF and KF schemes could reproduce this process, but they are too strong for the TC simulation, and the strengthening and weakening process occurred too early. The BMJ, TDK, and SAS schemes do not exhibit a significant weakening and strengthening process. In the FNL and ERA5 experiments, the FNL SAS and the ERA5 TDK schemes, respectively, fare the best overall.

4.3. Simulation of Rashmi’s Background Circulation Field

The tracks of tropical cyclones are primarily influenced by environmental steering flow and β-effects [47], and northward-bound BoB TCs during the winter months are typically influenced by the SBT and the WPSH [48]. Cumulus convection systems indirectly modify the barometer and background circulation fields by modifying the atmospheric temperature and humidity fields, hence influencing the movement and course of tropical cyclones.
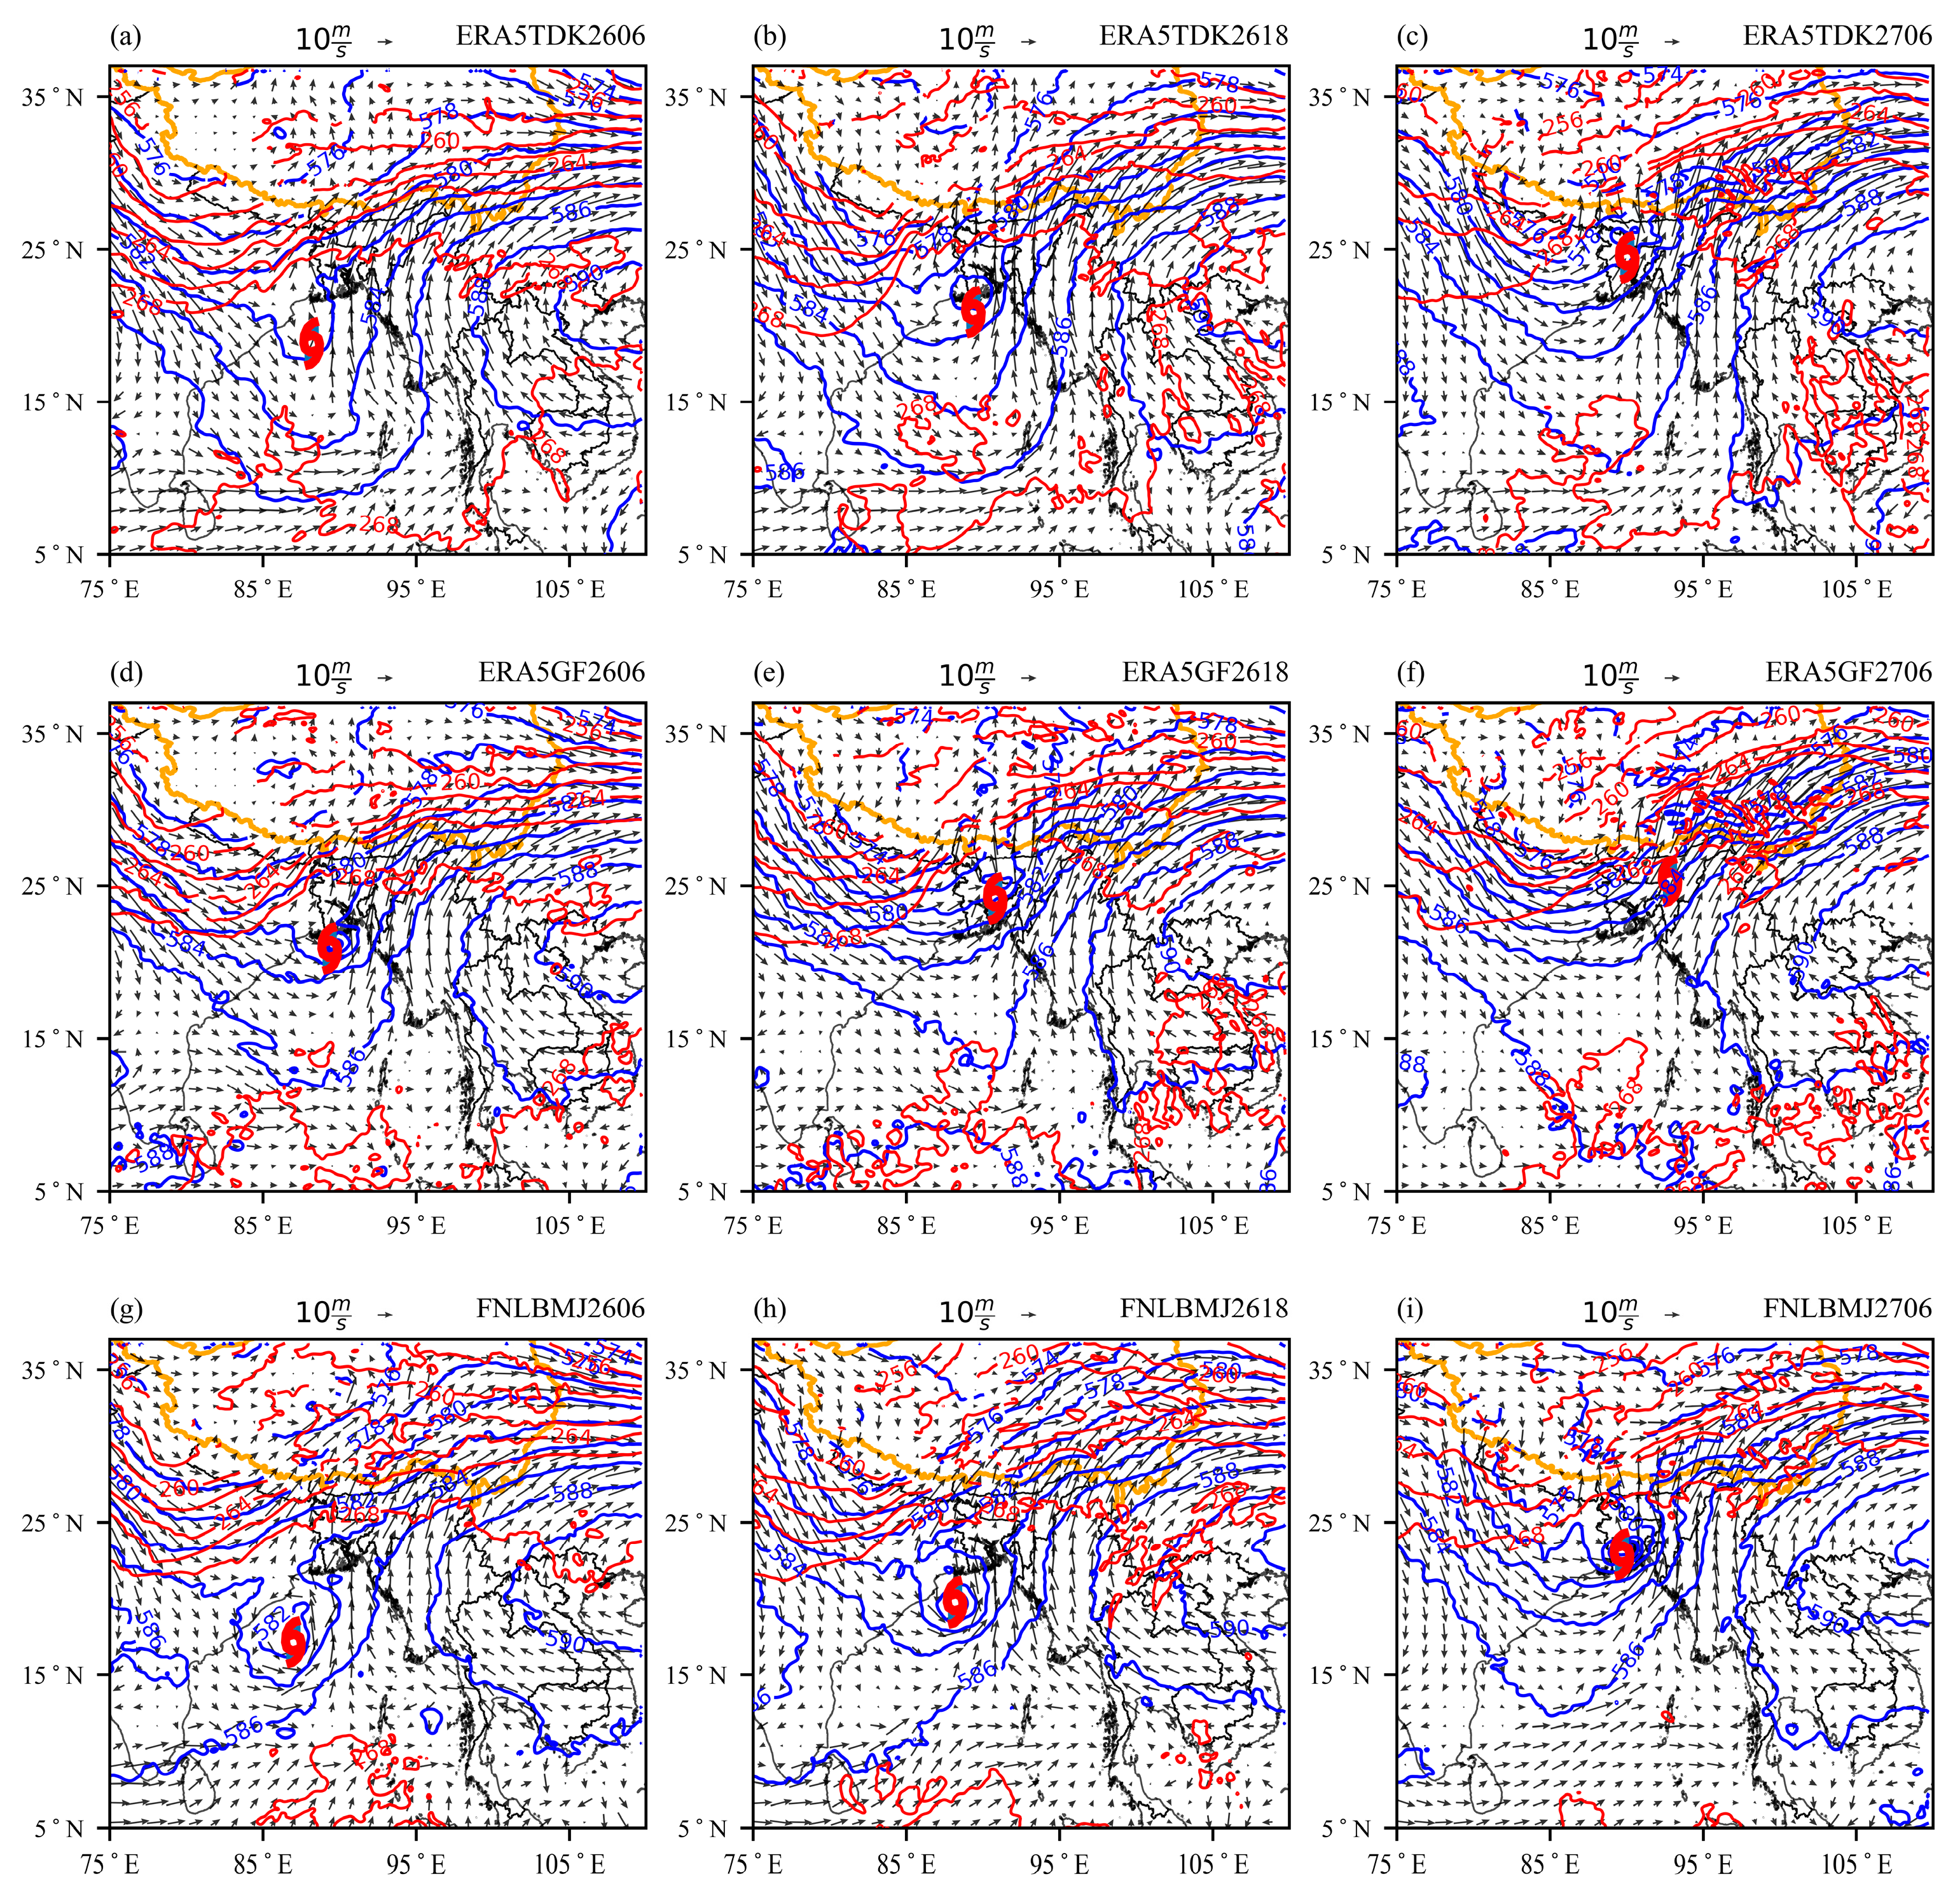
The FNL BMJ scheme (Figure 5a–c) and the ERA5 GF scheme (Figure 5d–f) represent the worst track simulations of the FNL experiments, with the former traveling more slowly and to the south, and the latter moving more quickly and to the east. This is compared to the closest observed ERA5 TDK scheme (Figure 5g–i).
The simulation results of the large-scale circulation field configuration show that although there are deviations in the tracks and velocities, the two main circulation systems, the SBT on the west side of Rashmi and the WPSH (588 geopotential height line) on the east side of Rashmi, are both simulated. The temperature trough lags behind the height trough, with warm and cold advection occurring in front of and behind the trough axis, respectively. In particular, the northbound air formed by the combination of the eastern side of Rashmi and WPSH and the westerly jet formed by the convergence of the westerly wind about 30° N are reflected. Warm and moist northward flow in front of the trough plays an important role in guiding the northward movement of the Rashmi, and helps to transport the tropical wet air northward to provide the necessary moisture conditions for precipitation on the TP [45]. In addition, the development of the Rashmi given in Figure 5g–i shows that as it moves northward and combines with the SBT, the southwesterly flow to the SBT and the southerly winds to the west of the WPSH combine to enhance the steady northward movement of Rashmi in the later stages.
Figure 5a–c,g–i reveal that the Rashmi simulated by the FNL BMJ scheme is stronger than the ERA5 TDK scheme, with the center contours at 500 hPa of the former being more pronounced and the SBT positioned to the west, which is not conducive to the northward movement of Rashmi. Comparing the ERA5 GF scheme (Figure 5d–f) with the ERA5 TDK scheme (Figure 5a–c), we think that a more intense wind field of the former causes Rashmi to move too fast. Moreover, the northerly–easterly SBT and the westerly–northerly WPSH combine to form a guided flow dominated by south-westerly wind vectors to cause it to move east–northwestward.
From the evolution of the environmental fields during the development of Rashmi simulated by the three typical schemes mentioned above, the model can reproduce the temperature and potential height fields as well as the large-scale circulation field patterns, and both the SBT and the WPSH are well described. However, there are slight variations in the location and intensity of the SBT and WPSH simulated by the different schemes, which has a great impact on the movement of Rashmi.

4.4. Variations in Rashmi’s Structure and Their Influence on Precipitation over TP

4.4.1. Thermal Structure

The structural evolution of Rashmi and its interaction with complex terrain are the important causes of extreme precipitation on the TP when Rashmi carries warm and humid air northward near the southern side of the TP.
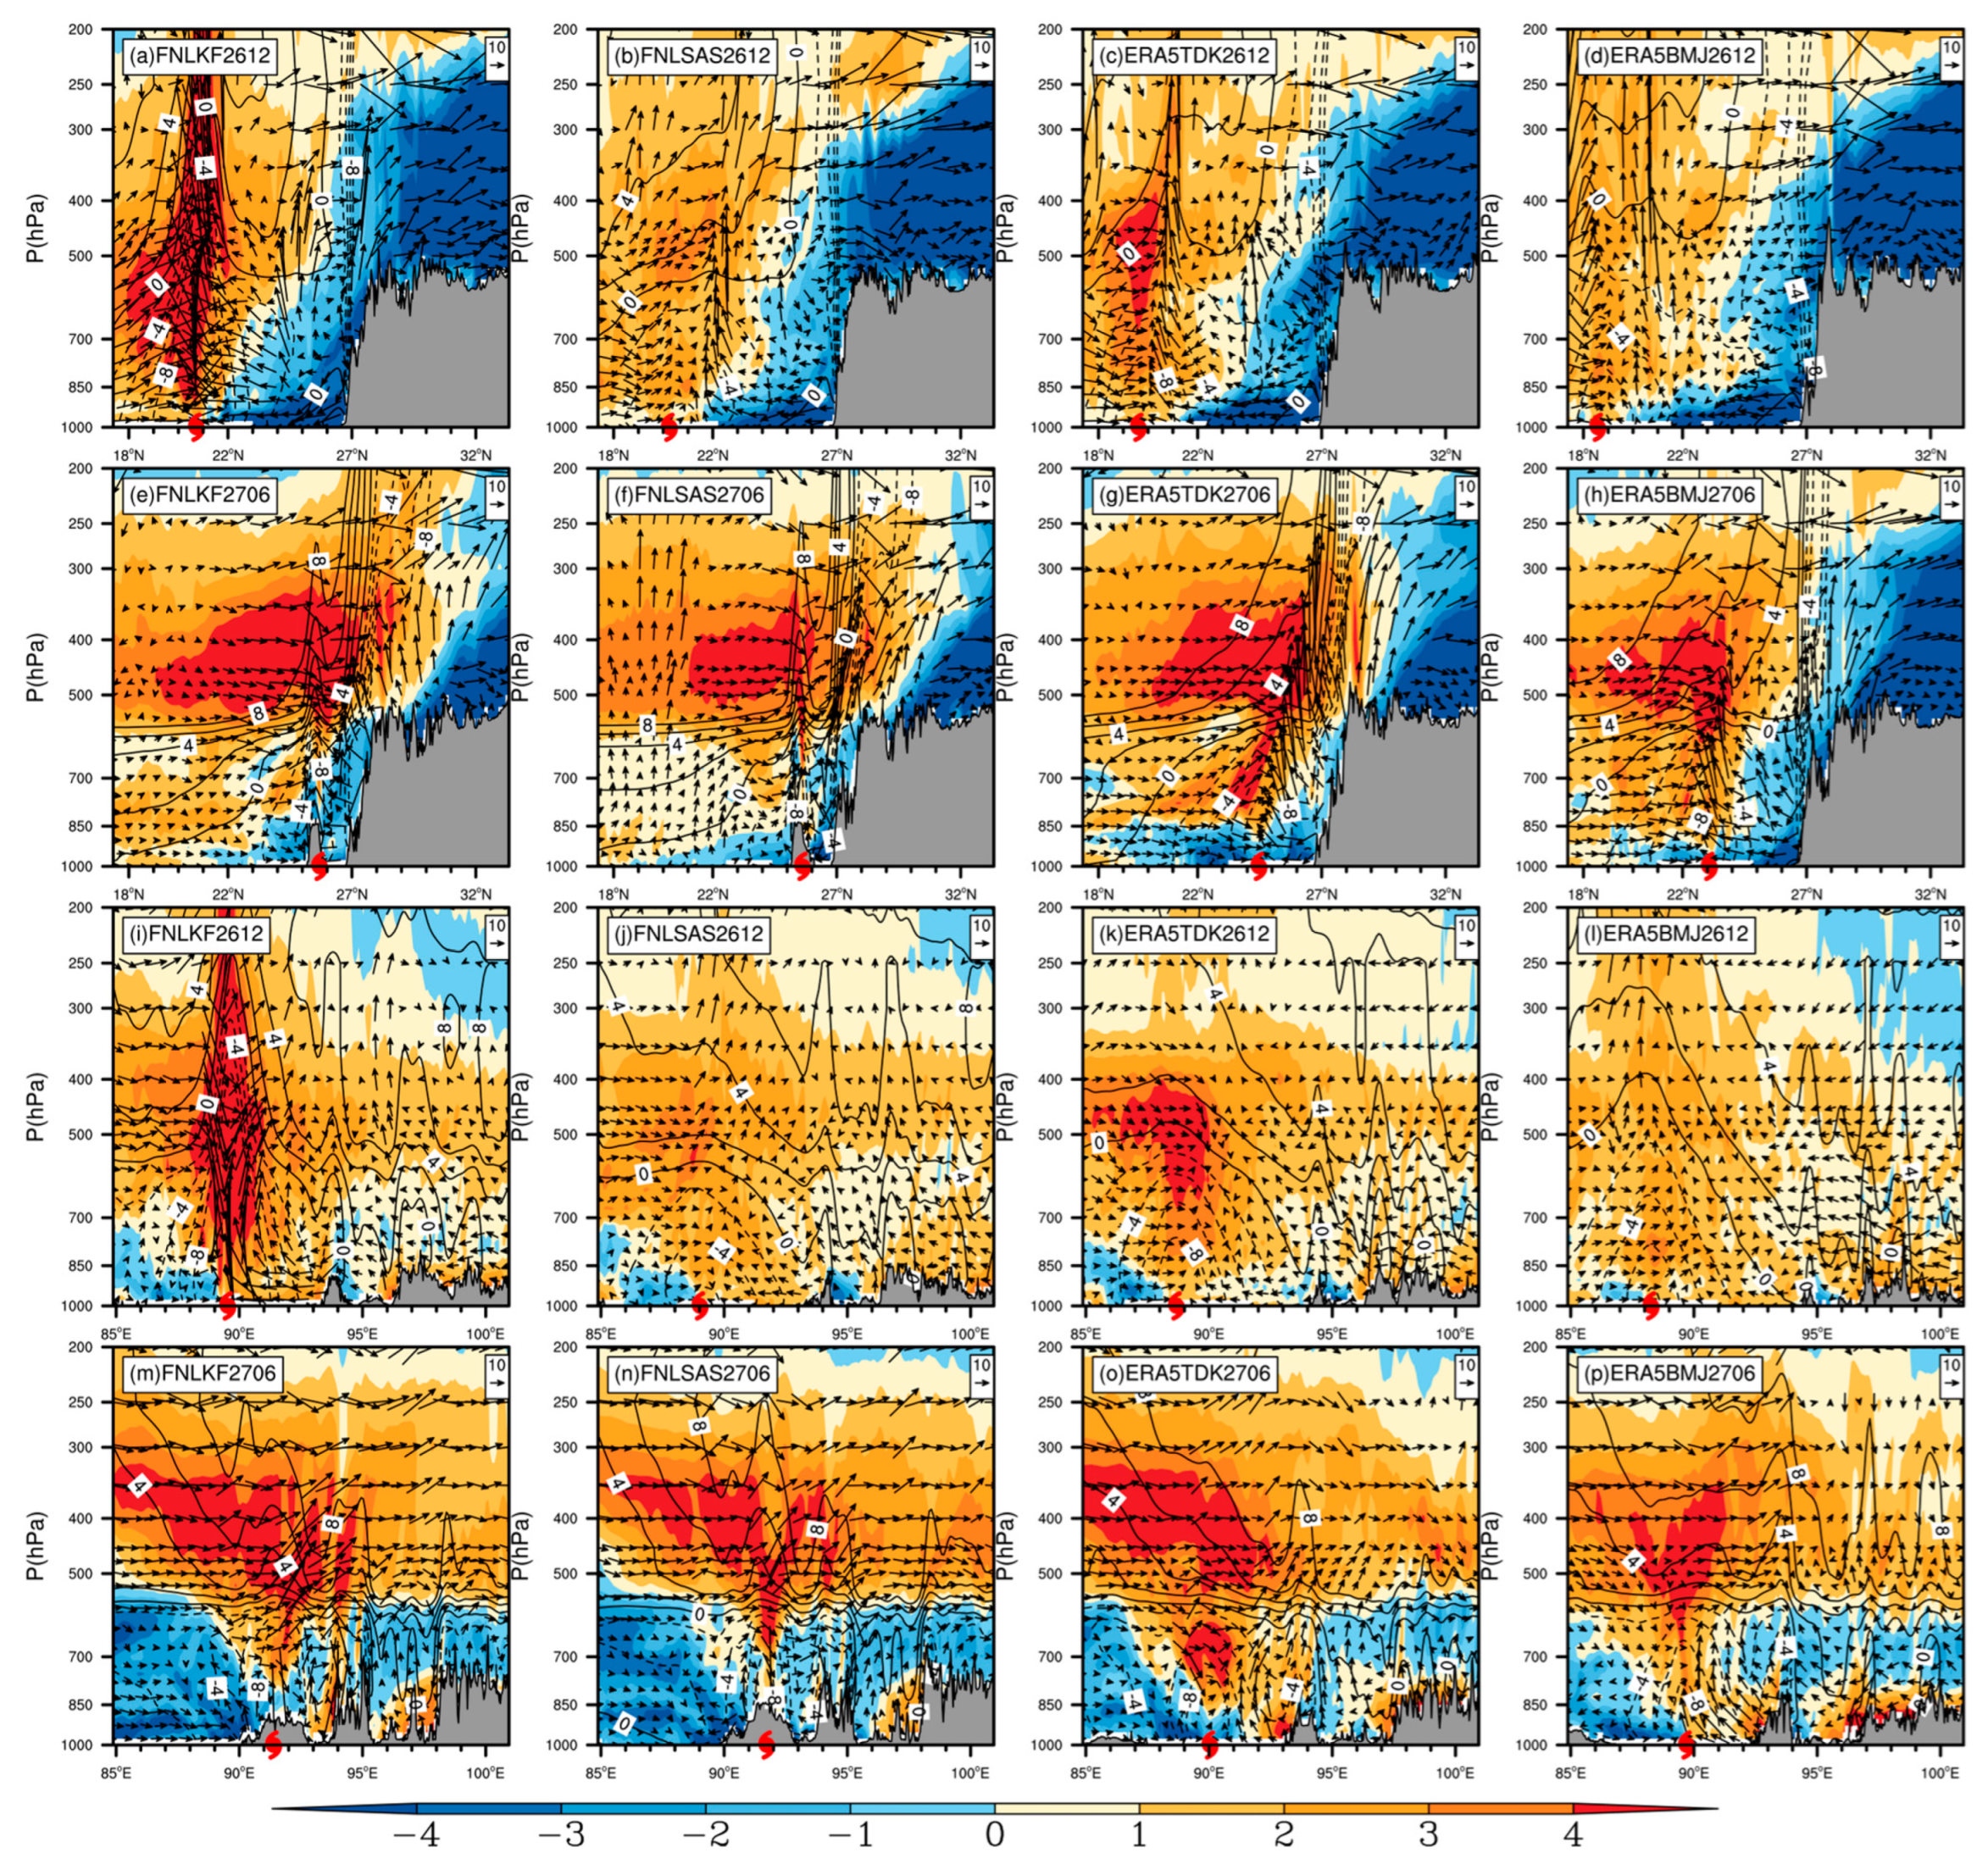
Figure 6 displays the simulated meridional and zonal cross-section profiles of the temperature and geopotential height distance levels of the Rashmi center before and after landfall, causing extreme precipitation on the TP during both phases. FNL KF and FNL SAS, the two worst and best schemes, are chosen for comparison of the vertical structure. Using the ERA5 initial-boundary conditions with the GF, KF, and SAS cumulus convection schemes, the simulated Rashmi moves too quickly and then, later, lands on the TP with essentially only residual cloud systems that lack typical TC characteristics. The two superior schemes, TDK and BMJ, are chosen for comparison.
The Rashmi simulated by the FNL KF (Figure 6a,e,i,m) scheme is located offshore at 12:00 UTC 26 October, and the MSLP of Rashmi exceeds the observed value. It could be found that the warm core is upright and deep, reaching a maximum of 200 hPa or more, and the negative potential height from the horizon is steep and dense, indicating its strong upwelling effect. Rashmi’s structure at 06:00 UTC 27 October (Figure 6e) shows that Rashmi tilted slightly to the north after landfall, and that the vertical convection weakened after the loss of offshore energy supply, but the warm core in the middle and upper levels of 550 hPa–350 hPa expanded, up to eight latitudes away. Most of the warm cloud system in the core of the TC piles up on the southern side of the TP, with a few overturning onto the TP. The cloud volume is not significantly different from the two weaker TC schemes in Figure 6f,g, indicating that Rashmi has difficulty in transporting more warm and humid clouds over the TP even if it strengthens. This is related to the tightness of the cloud system and the blocking effect of the TP. The dense distribution of the geopotential height distance horizon around 27° N and the excessive cold air in the low level of Rashmi resulting in its erosion to the east and west (Figure 6m) are inconsistent with Ye et al.’s [45] analysis based on ERA5 reanalysis data that the western and northern sides of Rashmi are surrounded by troughs and frontal systems, respectively.
The FNL SAS (Figure 6b,f,j,n) scheme features a weak TC center, but an upright and deeper vertical convection, and the convection intensity is closer to real data. Figure 6n demonstrates that cold air south of the trough erodes the western portion of Rashmi more clearly than in the FNL KF scheme. Note the existence of a narrow warm core of about 28.5° N in (Figure 6e–g), where more warm and humid airflow may be a significant factor in the TP’s increased precipitation. The ERA5 BMJ (Figure 6d,h,l,p) scheme is similar to the FNL SAS scheme. However, with a slower and more southerly center, Rashmi rises less over the TP and generates less precipitation than the FNL SAS scheme.
The ERA5 TDK (Figure 6c,g,k,o) scheme appears to be the closest to the Rashmi observations, with the warm core extending down to 850 hPa at 06:00 UTC 27 October (Figure 6o), while the convergence of the trough and the warm and cold flow of Rashmi occur at 850 hPa above the center (red symbols), both consistent with the actual conditions given by the ERA5 reanalysis data [45]. It is worth noting that Figure 6e–h all show that a front forms by the backflow of Rashmi when the cold air mass is blocked by the TP at the southern side of the TP below 500 hPa. The mass helps Rashmi climb the TP and is conducive to the invasion of Rashmi’s clouds over the TP, which is a unique system formed by Rashmi in conjunction with the specific topography of the TP.

4.4.2. The Process of Frontogenesis

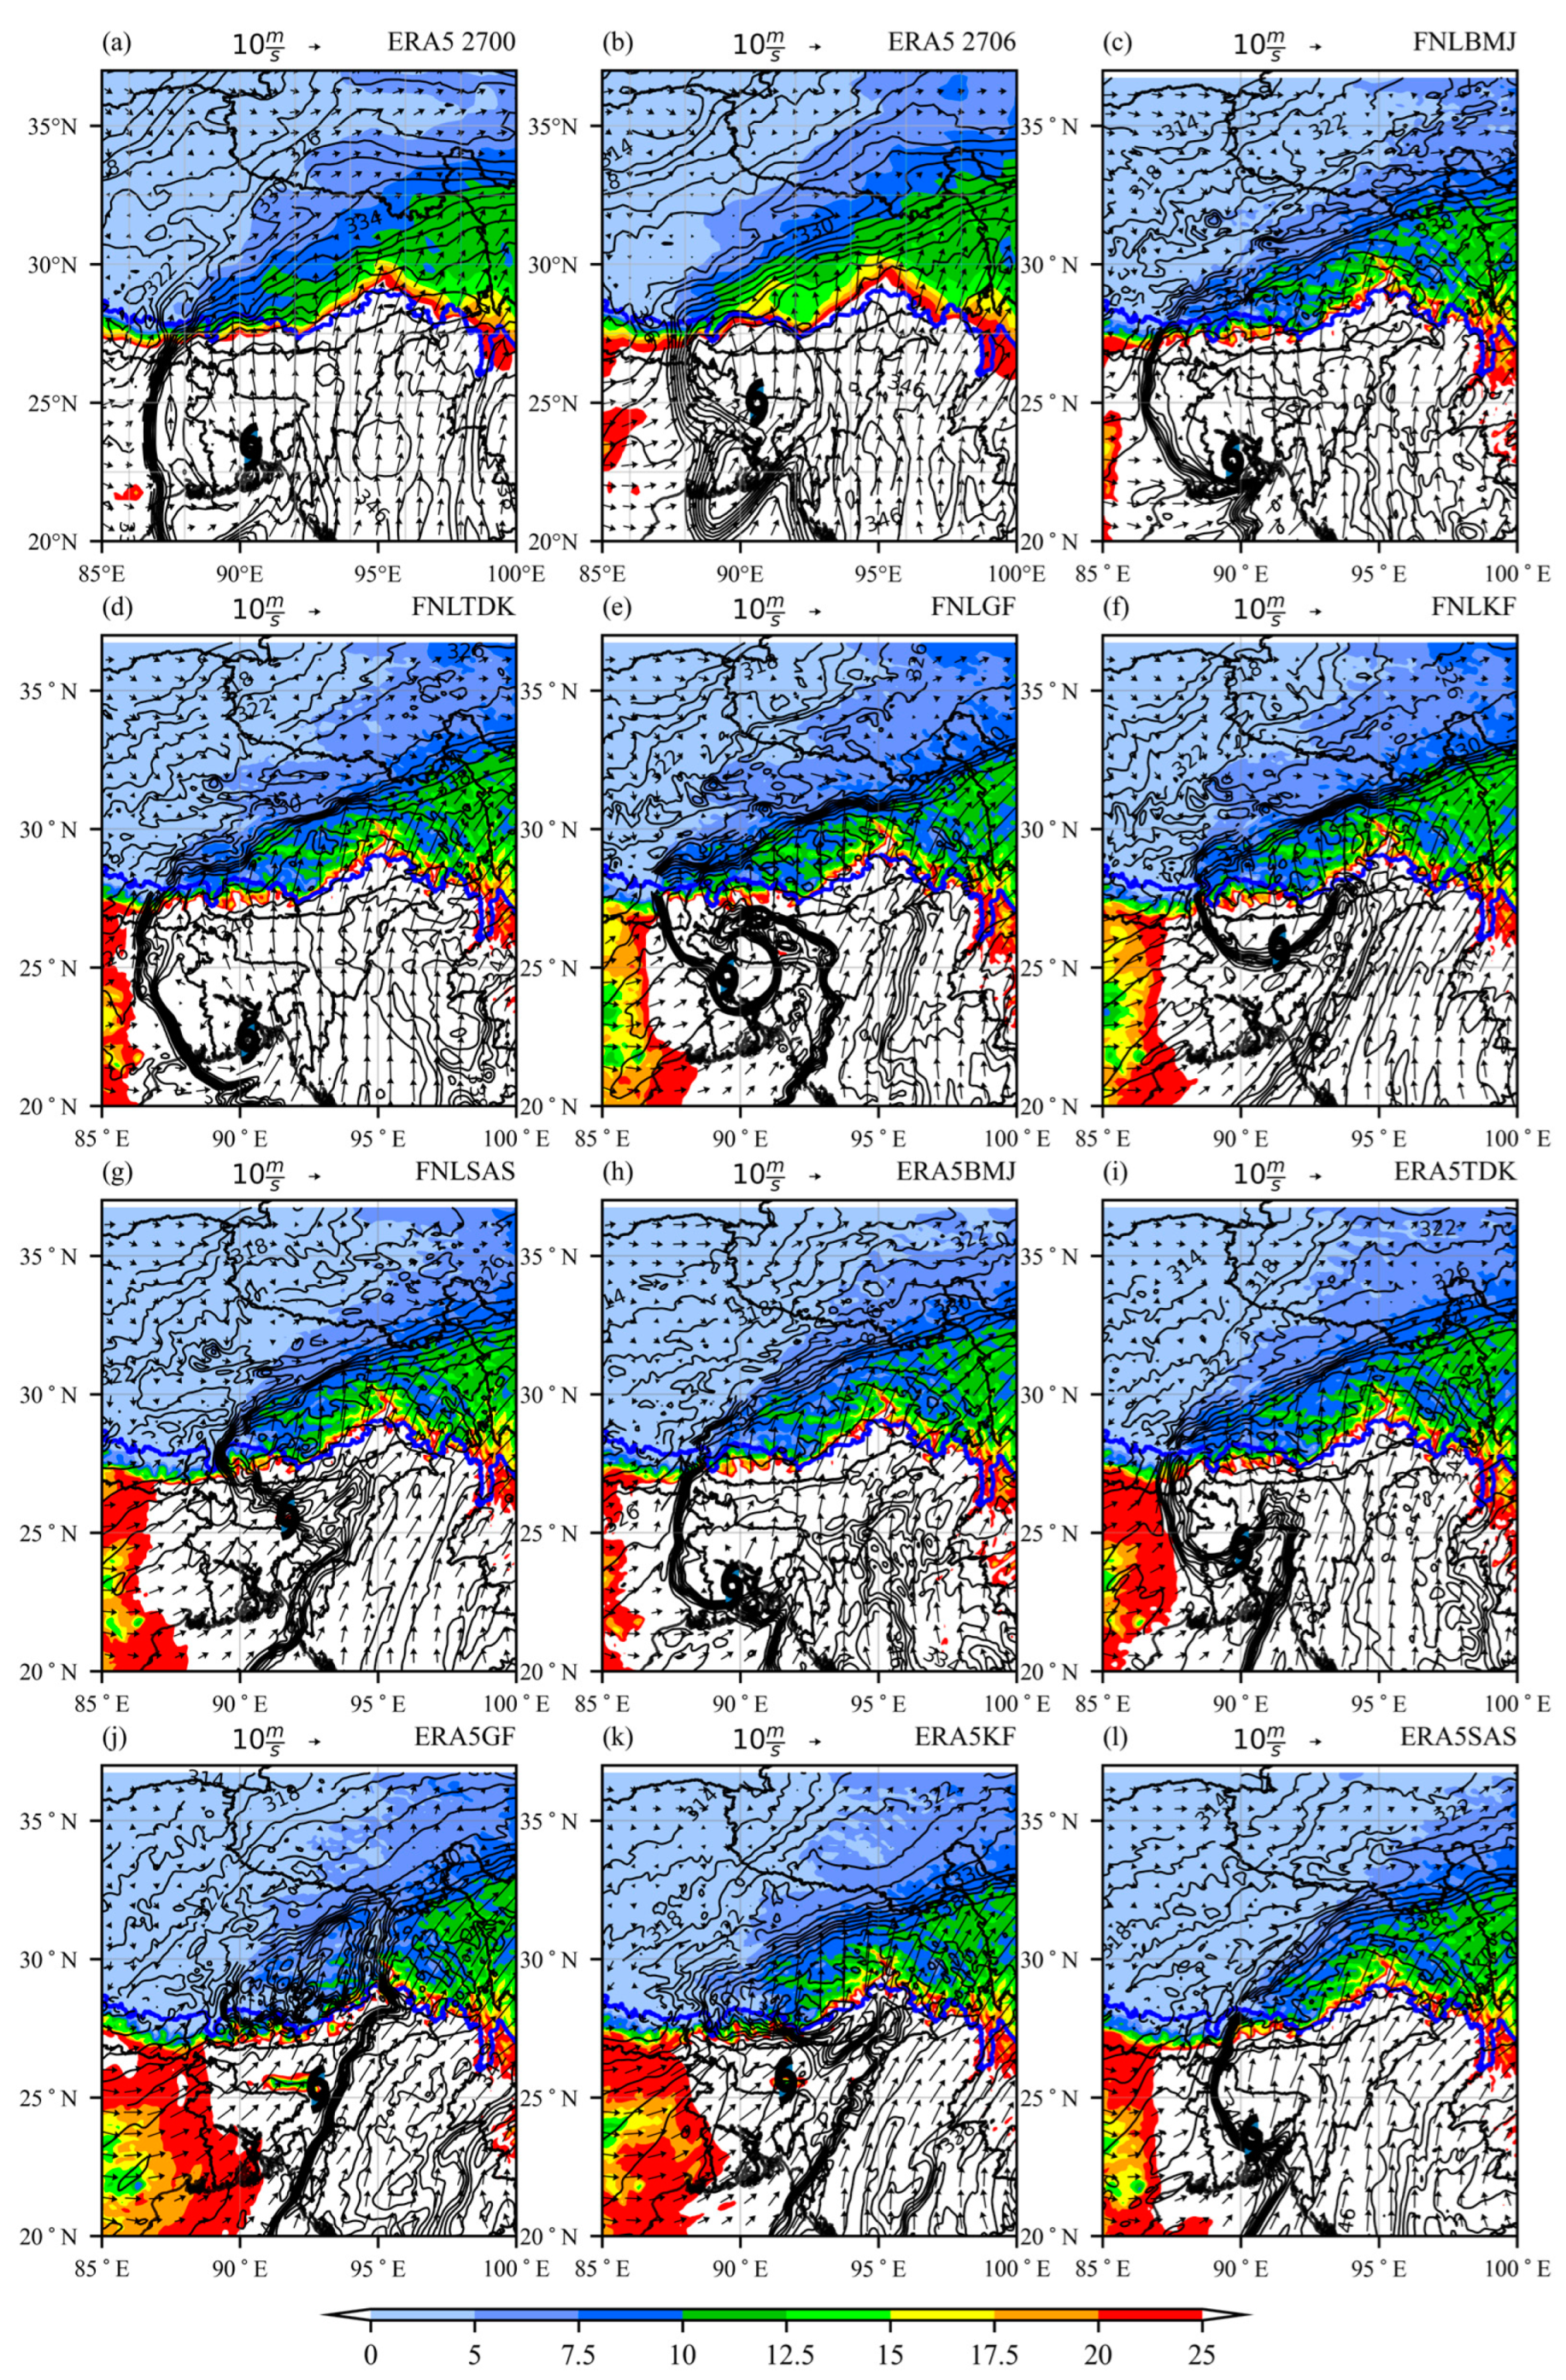
The northward flow affecting the southern side of the TP is dominated by a combination of Rashmi and WPSH. The southerly flow is stronger on the eastern side of Rashmi, while the west side of the WPSH is dominated by southwesterly winds, so the two combine to form a strong southerly wind. The south side of the TP is mainly affected by the south wind brought by Rashmi. The southeast side of the TP and the Yunnan–Guizhou Plateau, which were more affected by the subtropical high, prevailed by the southwest wind. The ten schemes all describe the characteristics of wind field at 500 hPa well.
In the central and southern portion of the TP, the warm and moist southwesterly winds brought by Rashmi and WPSH intersect with dry and cold northwesterly winds from the north to form a dense area of southwest-to-northeast-trending isopleths of equivalent potential temperature, suggesting strong frontogenesis there. As Rashmi moves northward, the isolines become denser (Figure 7a,b), and frontogenesis is strengthened. The location of the frontal zone is closely related to the velocity of the modelled Rashmi, with the three fast-moving schemes ERA5 GF (Figure 7j), ERA5 KF (Figure 7k), and ERA5 SAS (Figure 7l) having a northerly center and a significantly more northerly concentration of isopleths than their respective schemes. Clearly, the density of potential temperature contours in the frontal region is greater in the FNL experiments than in the ERA5 experiments, but the ERA5 experiments are more representative of the real situation (Figure 7b).
Influenced by the steep topography of the TP, the precipitable water value (PW) in the south margin of the TP presents a sharp gradient change, decreasing from south to north (Figure 7a,b). According to the simulation results, the PW distribution characteristics and step-type changes on the TP were simulated in all the ten schemes, and there is no significant difference between the schemes.
The FNL BMJ scheme (Figure 7c) and ERA5 TDK scheme (Figure 7i) are the optimal schemes for the simulation of PW, equivalent potential temperature, and 500 hPa wind fields in the two experiments, which can show the frontogenesis process on the southern slope of TP.

5. Evaluation of the Simulation Capabilities for Rashmi-Induced Severe Precipitation in the TP

5.1. Cumulative Precipitation Distribution

The accumulated precipitation from TRMM satellite observations over the three-day Rashmi process (Figure 1) shows that its influenced precipitation is widely distributed, with two rain bands running east–west from 10° N to 15° N and northeast–southwest from 15° N to 30° N. The former is associated with the influence of peripheral cloud bands (Figure 3a,b) and the latter largely overlaps with the northward track of the main body of Rashmi. The south-western side of Bangladesh over the ocean, the southern sea–land interface area of Bangladesh, and the southern edge of the TP are the three areas of heavy precipitation values, with precipitation centers of over 300 mm, 200 mm, and 120 mm, respectively. Combined with the accumulated precipitation observed by TRMM satellite from 12:00 UTC 26 October to 12:00 UTC 27 October (Figure 8a), we can easily find that precipitation at sea mainly occurred from 12:00 UTC 24 October to 12:00 UTC 26 October, while precipitation on land, especially on the TP, mainly occurred from 12:00 UTC 26 October to 12:00 UTC 27 October. Therefore, later, in Section 5.2, in conjunction with the precipitation ranges in Figure 8a, we select 102 stations (Figure 8b) within 25° N to 35° N and 85° E to 105° E from 12:00 UTC 26 October to 12:00 UTC 27 October to assess the accuracy of the precipitation simulation.
Figure 9’s first and second columns depict the three-day cumulative precipitation distributions for the FNL and ERA5 trials, respectively, corresponding to Figure 1’s and Figure 9’s third and fourth columns depicting the 24 h cumulative precipitation distribution, corresponding to Figure 9a.
By horizontal comparison, the range and amount of precipitation in the three main precipitation regions with the initial-boundary conditions (columns 2,4 of Figure 9) in ERA5 were higher than those in FNL (columns 1,3 of Figure 9). This may be due to the faster velocities of Rashmi in the ERA5 experiment and the fact that the ERA5 reanalysis data provide higher precipitation or more favorable ambient environmental conditions for precipitation in the initial-boundary conditions. Some research indicates that ERA5 reanalysis data have a tendency to overstate precipitation across complicated terrain [49,50].
A longitudinal comparison shows that the effect of different initial-boundary conditions on the simulation of cumulative precipitation patterns is much smaller than the effect of different cumulus convection schemes. All five cumulus convection schemes simulate two rainbands running east–west from 10 to 15° N and northeast–southwest from 15° to 30° N. The east–west rainbands over the BoB are located to the north in all schemes except the GF scheme (Figure 9i–l), which simulates a large dispersion of rainfall levels here without forming a block center. The TDK scheme (Figure 9e–h) does not simulate a precipitation center along the western coast of the Indo-China Peninsula. All schemes except the BMJ may slightly overestimate precipitation on the southeast side of the TP, while all schemes overestimate precipitation on the southwest side of the ocean, south of Bangladesh at the sea–land interface, where the area of the center of accumulated precipitation over 300 mm for 48 h (columns 1 and 2 of Figure 9) is significantly larger than in Figure 1.
The location of precipitation fallout areas on the southern plains of the TP is closely related to the speed of movement of Rashmi, with the three fast-moving experimental 24 h cumulative precipitation major areas of ERA5 KF (Figure 9l), ERA5 GF (Figure 9p), and FNL KF (Figure 9o) being significantly farther north; however, the precipitation fallout areas on the TP are less affected by the velocity of movement of Rashmi, which may be due to the blocking effect.
It can be observed that the fundamental distribution patterns of precipitation are simulated in all experiments, but the position, extent, and size of regions with high precipitation values are dependent on the Rashmi’s movement velocity and strength.

5.2. Simulation of Precipitation at and around Meteorological Stations on the TP

From the results of each scheme, the grid point closest to the station was picked, and a five-point average was calculated to represent the simulated precipitation at that station. The mean daily precipitation at the station is 11.73 mm; however, the mean precipitation for the 10 schemes is 13.2 mm, which is higher than the observed precipitation, showing that the model somewhat underestimated the daily precipitation on the TP. The average precipitation for the five schemes using FNL as the initial-boundary conditions is 13.12 mm, which is somewhat less than the 13.27 mm with the ERA5, but both are greater than the station’s reported precipitation. This may be attributable to the faster Rashmi’s moving velocity of the ERA5 initial-boundary conditions with the GF, KF, and SAS cumulus convection schemes (Figure 3b) or to the fact that the ERA5 reanalysis data provide greater precipitation or more favorable environmental conditions for precipitation in the initial-boundary conditions.
A Taylor diagram is drawn after standardization (Figure 8c). The ERA5 experiments have greater correlation coefficients than the FNL experiments, with correlation values for the ERA5 KF, ERA5 GF, and ERA5 EDK schemes all above 0.84. The sector centered on (0,0) indicates the model’s standard deviation after normalization using the observations’ standard deviation as the denominator. It can be found that the standard deviation of most schemes was greater than 1, indicating that the simulated daily precipitation of the model had higher dispersion and stronger fluctuation than the actual observed precipitation, and may have had a stronger embodiment ability of extreme precipitation. The ERA5 experiments have a greater standard deviation than the FNL, suggesting that ERA5 experiments simulated more discrete precipitation than the actual observed precipitation. The green dashed line in the graph represents the root mean square error of the standardized values for each scheme and observation, with lower values suggesting that the schemes are more closely aligned with the observations. The precipitation for the FNL experiments is greater than those for the ERA5, whose values are closer to the observed values, with the exception of the BMJ cumulus convection scheme.
In general, the performance of different cumulus convective schemes in different initial-boundary fields is quite different. The BMJ cumulus convective scheme shows a poor performance in both experiments, which is related to the slow movement of Rashmi. The precipitation of the TP is less related to the less northward intrusion of the cloud system. The average daily precipitation of the FNL BMJ scheme and ERA5 BMJ scheme is 10.683 mm and 12.180 mm, both of which are lower than the average. The performance of the SAS cumulus convective scheme is similar in the two experiments, both of which overestimate the dispersion of precipitation. The standard deviation of the FNL TDK scheme and ERA5 TDK scheme is slightly higher than 1, but the correlation coefficient and root mean square error of the latter scheme are better. The ERA5 KF scheme has the largest standard deviation among all schemes, but it also has the largest correlation coefficient, while the FNL KF scheme has better standard deviation. The ERA5 GF scheme has a bigger correlation coefficient than the FNL GF, but the ERA5 GF scheme has the least root mean square error and the closest standard deviation to 1, making it the best simulation in the Taylor diagram.
To further compare the graded simulation capability of each test for daily precipitation, seven meteorological scores, TS (Threat Score), ETS (Equitable Threat Score), BIAS (Bia Score), HSS (Heidke Skill Score), PDO (Probability of Detection), FAR (False Alarm Rate), and MAR (Missed Alarm Rate), are further calculated according to Table 3 and presented in Table 4 [51,52].
The PDO, FAR, and MAR are basic precipitation tests scores. The TS score is a widely used score in meteorological operations, and the ETS score introduces a penalty term D r   on top of the TS score for omission and false alarm in order to make grading fairer.
The BIAS measures the forecast bias of each test for graded precipitation. When it is greater than 1, we think the number of false alarms is greater than the number of misses (b > c), which is over-forecasting, and less than 1, on the contrary (b < c), represents under-forecasting. However, it should be noted that a BIAS of 1 when false alarm and miss reports are equal does not indicate a perfectly accurate forecast, which means false alarm and miss reports are not naturally 0. The HSS score is asymptotically fair by giving a score of 0 to the expectation of random prediction and constant prediction on the basis of the penalty for misses and false alarms [52]. In addition to the six scores for BIAS, the lower the MAR and FAR, the better, and, for others, the higher the better, with the caveat that ETS and HSS scores may be negative.
To evaluate the model’s general ability to discriminate between the presence and absence of precipitation, the precipitation classes were separated based on whether precipitation was created (>0.1 mm). Referring to the Chinese National Meteorological Administration’s precipitation intensity classification standard (inland version) and the characteristic of less precipitation on the TP, we divided the precipitation at stations with precipitation records into three classes: light rain (0.1–10 mm), moderate to heavy rain (10–25 mm), and heavy rain or more (>25 mm) to assess the model’s ability to simulate precipitation levels once more.
The efficacy of the modeling of sunniness or rain (>0.1 mm/d) indicates that each scheme has a better ability to distinguish them. Except for the ERA5 SAS scheme, the TS scores are above 0.9, the majority of ETS scores are around 0.4, the majority of HSS scores are above 0.5, and the BIAS scores for each scheme vary within 0.05, indicating that the bias of each scheme toward false alarm and miss reports is small. Nonetheless, it is observed that the ERA5 GF scheme had an ETS score of just 0.133 and an HSS score of only 0.234, which is a result of the scenario’s severe penalties for misses and false alarms.
From the graded simulation results, we can observe that the TS, ETS, HSS, and POD scores for moderate to heavy rainfall decreased sharply compared to those for light rainfall, and MAR and FAR increased; in particular, the ETS indicator was mostly around 0.1, almost close to losing its forecasting effect, indicating that the model may have overestimated and underestimated some data in the moderate to heavy rainfall magnitude of this precipitation. Taken together, there is no significant difference between several scores for each scheme at the light rainfall scale (moderate to heavy rain), indicating the stability of the model’s simulation of this precipitation process at the light rainfall scale (moderate to heavy rain), with limited effects of using different initial-boundary conditions and the cumulus convection scheme.
Nevertheless, the schemes performed considerably better for simulations with above heavy rainfall (>25 mm) than for moderate to heavy rainfall, with TS and ETS scores above heavy rainfall of around 0.3, most HSS scores greater than 0.4, hit rates (POD) up to 0.8 (ERA5 GF), and PODs above 0.5 for the other schemes, indicating that the model scenarios were able to capture to some extent the extremes of this precipitation. The highest scores for TS, ETS, and HSS scores (0.5, 0.453, 0.624) are about twice as high as the lowest scores (0.263, 0.206, 0.336), and the simulation above heavy precipitation is sensitive to the selection of scenarios. In addition, it is essential to highlight that the limited number of stations generating severe precipitation (OSN) (10) may inject some ambiguity into the corresponding rankings.
The three simulations (Table 5) chosen to produce extreme daily precipitation at Cona, Bomi, and Zayu demonstrate that the simulated precipitation for each scheme is generally capable of simulating the intensity of the extreme precipitation, with the best performing scheme at each of the three sites within 15% of the actual precipitation.
In view of all the scores, all the schemes have acceptable simulation effects for the precipitation. The FNL TDK scheme and the ERA5 GF scheme are the best schemes in the FNL and ERA5 tests, respectively. However, given that the ERA5 GF scheme has too many empty reports and omissions in the precipitation simulation and the ERA5 KF scheme has too much precipitation, the ERA5 TDK scheme is likely the better option of the ERA5 schemes.

6. Conclusions

The track, intensity, structure, background circulation field, water vapor conditions, and precipitation simulations of Rashmi in the BoB are highly sensitive to initial-boundary conditions and cumulus convection schemes. No schemes performed well in all respects, and no experiments performed well in all aspects, so different schemes can be chosen when focusing on different research objects. For instance, the GF or KF cumulus convection scheme can be used to study the intensification and weakening processes of TCs, and the ERA5 TDK scheme can be used to study both the Rashmi and the extreme precipitation that it causes on the TP. The following are the main conclusions:
(i)
Overall, the Rashmi’s track error, velocity, and precipitation on the TP simulated in ERA5 experiments are slightly higher than FNL, but the former simulates the intensity of Rashmi better than the latter. The GF and KF cumulus convection schemes tend to overestimate Rashmi’s intensity. The FNL SAS and ERA5 TDK schemes are the best of the two experiments, while FNL KF and ERA5 KF schemes perform the worst in both experiments, respectively.
(ii)
All schemes simulate to some extent the cloud characteristics of the Rashmi and the water vapor conveyor belt to the TP, with the FNL SAS and ERA5 TDK schemes simulating cloud patterns of Rashmi that most approach reality. The velocity and track of Rashmi are adjusted by the steering flow, which is affected by the simulated pattern of the SBT and WPSH. A northerly or easterly SBT and a westerly WPSH guide Rashmi to the northeast, and a westerly SBT is detrimental to the northward movement of Rashmi.
(iii)
The four representative schemes, FNL KF, FNL SAS, ERA5 TDK, and ERA5 BMJ, all reproduce the vertical deep convection at sea before landfall and the northerly cloud mass after landfall. Precipitation in the TP is closely related to the intensity of Rashmi and its warm moist air masses to the north of the TP, the ERA5 TDK scheme simulation results being closer to the actual situation.
(iv)
The comparison between the simulation results and daily precipitation at (extreme) stations shows that WRF can distinguish between sunniness and rain well and has some ability to identify extreme precipitation on the TP. The excellent combinations of parametric schemes, such as the ERA5 GF and ERA5 TDK with 24 h cumulative precipitation standard deviations, are generally consistent with reality, with correlation coefficients of 0.84 or more.
However, the sparseness of the stations on the TP (Figure 3c) introduces a large uncertainty in the evaluation of the results of our precipitation simulations, and poses difficulties for precipitation studies on the TP. The establishment of more dense meteorological observation stations is surely one of the best ways to improve the accuracy of precipitation observation on the TP, and meteorological fusion data with finer resolution (e.g., CMA Land Data Assimilation System, CLDAS) may be able to provide more accurate reference data for precipitation research and simulation over the TP. In particular, we emphasize that the selection of the location and size of the simulated area will greatly affect the track and intensity of Rashmi. This may be related to the sea and land combination of the BoB and the instability caused by the inclusion of the TP in the simulation region. Appropriately expanding the southern boundary of the simulation area and increasing the ocean area can often improve the accuracy of the simulation of Rashmi’s track. It is also worth noting that different TCs may have different sensitivities to initial-boundary conditions and cumulus convection schemes, and one should be careful in selecting the parameterization scheme on the basis of this study when the other TCs over the BoB are simulated.

Author Contributions

Conceptualization, P.A. and Y.L.; methodology, P.A. and Y.L.; software, P.A. and X.F.; validation, P.A. and W.Y.; formal analysis, P.A.; investigation, P.A. and W.Y.; data curation, P.A. and W.Y.; writing—original draft preparation, P.A. and Y.L.; writing—review and editing, P.A., W.Y., X.F. and Y.L.; funding acquisition, Y.L. All authors have read and agreed to the published version of the manuscript.

Funding

This research was funded by the National Natural Science Foundation of China (grant number 41930972), Fengyun Application Pioneering Project (2021) (grant number FY-APP-2021.0210), and the Science and Technology Development Foundation of CAMS (grant number 2023KJ034).

Institutional Review Board Statement

Not applicable.

Informed Consent Statement

Not applicable.

Data Availability Statement

The ECMWF global reanalysis data (i.e., ERA5) were downloaded from online archive system at https://www.ecmwf.int/en/forecasts/datasets/browse-reanalysis-datasets (accessed on 24 January 2023). Topographic maps in Figure 3 were open downloaded at https://www.naturalearthdata.com/downloads/ (accessed on 14 October 2022). Cloud top bright temperature in GMS satellite TBB was downloaded at http://weather.is.kochi-u.ac.jp/archive-e.html (accessed on 25 January 2023). The best track data from Joint Typhoon Warning Center (JTWC) were derived from http://www.metoc.navy.mil/jtwc/jtwc.html (accessed on 24 January 2023). The terrain elevation data are available online at https://www.ngdc.noaa.gov/mgg/global/etopo2.html (accessed on 14 October 2022). Due to confidentiality agreements, ground observation data can only be made available to bona fide researchers subject to a non-disclosure agreement. Details of the data and how to request access are available from [email protected] at the China Meteorological Administration.

Conflicts of Interest

The authors declare no conflict of interest.

Appendix A

For convenient application, we expand the formula H S S = 2 s 1 s H F s + s 1 2 s H + 1 s 1 2 s F with s = a + c n ,   H = a a + c ,   F = b b + d   in [52], resulting in 2 a d b c a + c c + d + a + b b + d .

References

  1. Gray, W. Global View of the Origin of Tropical Disturbances and Storms. Mon. Weather. Rev. 1968, 96, 669–700. [Google Scholar] [CrossRef]
  2. Chutia, L.; Pathak, B.; Parottil, A.; Bhuyan, P.K. Impact of Microphysics Parameterizations and Horizontal Resolutions on Simulation of “MORA” Tropical Cyclone over Bay of Bengal Using Numerical Weather Prediction Model. Meteorol. Atmos. Phys. 2019, 131, 1483–1495. [Google Scholar] [CrossRef]
  3. Lin, Z.; Biania, Z.; Wen, S.; Zhou, Z. Objective classification of the tracks of tropical storms in the bay of bengal. J. Trop. Meteorol. 2015, 21, 222–231. [Google Scholar]
  4. Fan, X.; Li, Y.; Lyu, A.; Liu, L. Statistical and Comparative Analysis of Tropical Cyclone Activity over the Arabian Sea and Bay of Bengal (1977–2018). J. Trop. Meteorol. 2020, 26, 441–452. [Google Scholar] [CrossRef]
  5. Xiao, Z.; Duan, A. Can the Tropical Storms Originated from the Bay of Bengal Impact the Precipitation and Soil Moisture over the Tibetan Plateau? Sci. China Earth Sci. 2015, 58, 915–928. [Google Scholar] [CrossRef]
  6. Liu, Y.; Zhang, D.-L.; Yau, M. A Multiscale Numerical Study of Hurricane Andrew (1992). Part I: Explicit Simulation and Verification. Mon. Weather Rev. 1997, 125, 3073–3093. [Google Scholar] [CrossRef]
  7. Li, X.; Pu, Z. Sensitivity of Numerical Simulation of Early Rapid Intensification of Hurricane Emily (2005) to Cloud Microphysical and Planetary Boundary Layer Parameterizations. Mon. Weather. Rev. 2008, 136, 4819–4838. [Google Scholar] [CrossRef]
  8. Zambon, J.; He, R.; Warner, J. Tropical to Extratropical: Marine Environmental Changes Associated with Superstorm Sandy Prior to Its Landfall. Geophys. Res. Lett. 2014, 41, 8935–8943. [Google Scholar] [CrossRef]
  9. Nasrollahi, N.; AghaKouchak, A.; Li, J.; Gao, X.; Hsu, K.; Sorooshian, S. Assessing the Impacts of Different WRF Precipitation Physics in Hurricane Simulations. Weather. Forecast. 2012, 27, 1003–1016. [Google Scholar] [CrossRef]
  10. Sun, Y.; Zhong, Z.; Lu, W.; Hu, Y. Why Are Tropical Cyclone Tracks over the Western North Pacific Sensitive to the Cumulus Parameterization Scheme in Regional Climate Modeling? A Case Study for Megi (2010). Mon. Weather. Rev. 2014, 142, 1240–1249. [Google Scholar] [CrossRef]
  11. Parker, C.; Lynch, A.; Mooney, P. Factors Affecting the Simulated Trajectory and Intensification of Tropical Cyclone Yasi (2011). Atmos. Res. 2017, 194, 27–42. [Google Scholar] [CrossRef]
  12. Islam, T.; Srivastava, P.; Rico-Ramirez, M.; Dai, Q.; Gupta, M.; Singh, S. Tracking a Tropical Cyclone through WRF-ARW Simulation and Sensitivity of Model Physics. Nat. Hazards 2015, 76, 1473–1495. [Google Scholar] [CrossRef]
  13. Delfino, R.; Bagtasa, G.; Hodges, K.; Vidale, P. Sensitivity of Simulating Typhoon Haiyan (2013) Using WRF: The Role of Cumulus Convection, Surface Flux Parameterizations, Spectral Nudging, and Initial and Boundary Conditions. Nat. Hazards Earth Syst. Sci. 2022, 22, 3285–3307. [Google Scholar] [CrossRef]
  14. Pattanayak, S.; Mohanty, U. A Comparative Study on Performance of MM5 and WRF Models in Simulation of Tropical Cyclones over Indian Seas. Curr. Sci. 2008, 95, 923–936. [Google Scholar]
  15. Xalxo, K.; Mahala, B.; Mohanty, P.; Routray, A.; Mishra, B. Performance Assessment of WRF Model Radiation Schemes in Simulating the Track and Intensity of the Super Cyclonic Storm “Amphan”. Nat. Hazards 2022, 114, 1741–1762. [Google Scholar] [CrossRef]
  16. Raju, P.V.S.; Potty, J.; Mohanty, U.C. Sensitivity of Physical Parameterizations on Prediction of Tropical Cyclone Nargis over the Bay of Bengal Using WRF Model. Meteorol. Atmos. Phys. 2011, 113, 125–137. [Google Scholar] [CrossRef]
  17. Mohan, P.R. Convection-Permitting WRF Simulations of Tropical Cyclones over the North Indian Ocean. Pure Appl. Geophys. 2022, 179, 31. [Google Scholar] [CrossRef]
  18. Li, Y.; Chen, L. Numerical Study on Impact of the Boundary Layer Fluxes over Wetland on Sustention and Rainfall of Landfalling Tropical Cyclones. Acta Meteorol. Sin. 2007, 21, 34–46. [Google Scholar]
  19. Nellipudi, N.; Ramakrishna, S.; Podeti, S.; Rao, B.; Yesubabu, V.; Rao, V. Impact of the Moisture and Land Surface Processes on the Sustenance of the Cyclonic Storm Yemyin over Land Using the WRF-ARW Model. Nat. Hazards 2022, 114, 495–519. [Google Scholar] [CrossRef]
  20. Mohanty, U.; Osuri, K.; Routray, A.; Mohapatra, M.; Pattanayak, S. Simulation of Bay of Bengal Tropical Cyclones with WRF Model: Impact of Initial and Boundary Conditions. Mar. Geod. 2010, 33, 294–314. [Google Scholar] [CrossRef]
  21. Mandal, M.; Singh, K.; Balaji, M.; Mohapatra, M. Performance of WRF-ARW Model in Real-Time Prediction of Bay of Bengal Cyclone “Phailin”. Pure Appl. Geophys. 2016, 173, 1783–1801. [Google Scholar] [CrossRef]
  22. Chandrasekar, R.; Balaji, C. Impact of Physics Parameterization and 3DVAR Data Assimilation on Prediction of Tropical Cyclones in the Bay of Bengal Region. Nat. Hazards 2016, 80, 223–247. [Google Scholar] [CrossRef]
  23. Rajeswari, J.; Srinivas, C.; Mohan, P.; Venkatraman, B. Impact of Boundary Layer Physics on Tropical Cyclone Simulations in the Bay of Bengal Using the WRF Model. Pure Appl. Geophys. 2020, 177, 5523–5550. [Google Scholar] [CrossRef]
  24. Mahala, B.; Mohanty, P.; Xalxo, K.; Routray, A.; Misra, S. Impact of WRF Parameterization Schemes on Track and Intensity of Extremely Severe Cyclonic Storm “Fani”. Pure Appl. Geophys. 2021, 178, 245–268. [Google Scholar] [CrossRef]
  25. Osuri, K.; Mohanty, U.; Routray, A.; Kulkarni, M.; Mohapatra, M. Customization of WRF-ARW Model with Physical Parameterization Schemes for the Simulation of Tropical Cyclones over North Indian Ocean. Nat. Hazards 2012, 63, 1337–1359. [Google Scholar] [CrossRef]
  26. Wu, S.; Liu, Q.; Zou, X.; Wu, G. The Simulation Analysis of the Precipitation over the Southern Slopes of the Tibetan Plateau Based on WRF Model. Acta Meteorol. Sin. 2016, 74, 744–756. (In Chinese) [Google Scholar]
  27. Mao, Z.; Zhu, Z.; Zhang, R.; Zhou, L. The Impact of Different Cloud Microphysics Parameterization Schemes on the Simulation of a Heavy Rainfall Event over the Tibetan Plateau. J. Trop. Meteorol. 2022, 38, 81–90. (In Chinese) [Google Scholar] [CrossRef]
  28. Shirai, T.; Enomoto, Y.; Watanabe, M.; Arikawa, T. Sensitivity Analysis of the Physics Options in the Weather Research and Forecasting Model for Typhoon Forecasting in Japan and Its Impacts on Storm Surge Simulations. Coast. Eng. J. 2022, 64, 506–532. [Google Scholar] [CrossRef]
  29. Singh, K.; Bhaskaran, P. Impact of PBL and Convection Parameterization Schemes for Prediction of Severe Land-Falling Bay of Bengal Cyclones Using WRF-ARW Model. J. Atmos. Sol. Terr. Phys. 2017, 165, 10–24. [Google Scholar] [CrossRef]
  30. Davis, C.; Bosart, L. Numerical Simulations of the Genesis of Hurricane Diana (1984). Part II: Sensitivity of Track and Intensity Prediction. Mon. Weather. Rev. 2002, 130, 1100–1124. [Google Scholar] [CrossRef]
  31. Srinivas, C.; Rao, D.; Yesubabu, V.; Baskaran, R.; Venkatraman, B. Tropical Cyclone Predictions over the Bay of Bengal Using the High-Resolution Advanced Research Weather Research and Forecasting (ARW) Model. Q. J. R. Meteorol. Soc. 2013, 139, 1810–1825. [Google Scholar] [CrossRef]
  32. Mohandas, S.; Ashrit, R. Sensitivity of Different Convective Parameterization Schemes on Tropical Cyclone Prediction Using a Mesoscale Model. Nat. Hazards 2014, 73, 213–235. [Google Scholar] [CrossRef]
  33. Skamarock, W.C.; Klemp, J.B.; Dudhia, J.; Gill, D.O.; Barker, D.M.; Duda, M.G.; Huang, X.-Y.; Wang, W.; Powers, J.G. A Description of the Advanced Research WRF Version 3. In NCAR Technical Note NCAR/TN-475+STR. June 2008; Mesoscale and Microscale Meteorology Division. National Center for Atmospheric Research: Boulder, CO, USA, 2008; Volume 475, p. 1. [Google Scholar] [CrossRef]
  34. Dudhia, J. Numerical Study of Convection Observed during the Winter Monsoon Experiment Using a Mesoscale Two-Dimensional Model. J. Atmos. Sci. 1989, 46, 3077–3107. [Google Scholar] [CrossRef]
  35. Mlawer, E.J.; Taubman, S.J.; Brown, P.D.; Iacono, M.J.; Clough, S.A. Radiative Transfer for Inhomogeneous Atmospheres: RRTM, a Validated Correlated-k Model for the Longwave. J. Geophys. Res. 1997, 102, 16663–16682. [Google Scholar] [CrossRef]
  36. Hong, S.-Y.; Noh, Y.; Dudhia, J. A New Vertical Diffusion Package with an Explicit Treatment of Entrainment Processes. Mon. Weather Rev. 2006, 134, 2318–2341. [Google Scholar] [CrossRef]
  37. Chen, F.; Dudhia, J. Coupling an Advanced Land Surface–Hydrology Model with the Penn State–NCAR MM5 Modeling System. Part I: Model Implementation and Sensitivity. Mon. Wea. Rev. 2001, 129, 569–585. [Google Scholar] [CrossRef]
  38. Janjic, Z. The Step-Mountain Eta Coordinate Model: Further Developments of the Convection, Viscous Sublayer, and Turbulence Closure Schemes. Mon. Weather Rev. 1994, 122, 927–945. [Google Scholar] [CrossRef]
  39. Zhang, C.; Wang, Y. Projected Future Changes of Tropical Cyclone Activity over the Western North and South Pacific in a 20-Km-Mesh Regional Climate Model. J. Clim. 2017, 30, 5923–5941. [Google Scholar] [CrossRef]
  40. Grell, G.; Freitas, S. A Scale and Aerosol Aware Stochastic Convective Parameterization for Weather and Air Quality Modeling. Atmos. Chem. Phys. 2014, 14, 5233–5250. [Google Scholar] [CrossRef]
  41. Kain, J. The Kain-Fritsch Convective Parameterization: An Update. J. Appl. Meteorol. 2004, 43, 170–181. [Google Scholar] [CrossRef]
  42. Han, J.; Pan, H. Revision of Convection and Vertical Diffusion Schemes in the NCEP Global Forecast System. Weather. Forecast. 2011, 26, 520–533. [Google Scholar] [CrossRef]
  43. Zhang, Y.; Li, B.; Zheng, D. Datasets of the Boundary and Area of the Tibetan Plateau. Digit. J. Glob. Chang. Data Repos. 2014, 69, 164–168. [Google Scholar] [CrossRef]
  44. Zheng, J. RASHMI Made Landfall in Bangladesh and Affected Areas Such as Tibet and Yunnan in China. 2008. Available online: http://news.sohu.com/20081027/n260269004.shtml (accessed on 24 August 2023). (In Chinese).
  45. Ye, W.; Li, Y.; Zhang, D. Generation of Extreme Precipitation over the Southeastern Tibetan Plateau Associated with TC Rashmi (2008). Weather. Forecast. 2022, 37, 2223–2238. [Google Scholar] [CrossRef]
  46. Ma, W.D.; Liu, F.G.; Zhou, Q.; Chen, Q.; Liu, F.; Chen, Y.P. Characteristics of Extreme Precipitation over the Tibetan Plateau during 1961–2017. J. Nat. Resour. 2019, 35, 3039–3050. (In Chinese) [Google Scholar]
  47. Holland, G.J. Tropical Cyclone Motion: Environmental Interaction Plus a Beta Effect. J. Atmos. Sci. 1983, 40, 328–342. [Google Scholar] [CrossRef]
  48. Suo, M. Formation, Propagation and Evolution Characteristics of Wintertime Southern Branch Trough in the Subtropical Westerlies and Its Impacts on the Weather and Climate in China. Ph.D. Thesis, Chinese Academy of Meteorological Sciences, Beijing, China, 2009. (In Chinese). [Google Scholar]
  49. Jiang, Q.; Li, W.; Fan, Z.; He, X.; Sun, W.; Chen, S.; Wen, J.; Gao, J.; Wang, J. Evaluation of the ERA5 Reanalysis Precipitation Dataset over Chinese Mainland. J. Hydrol. 2021, 595, 125660. [Google Scholar] [CrossRef]
  50. Nogueira, M. Inter-Comparison of ERA-5, ERA-Interim and GPCP Rainfall over the Last 40 Years: Process-Based Analysis of Systematic and Random Differences. J. Hydrol. 2020, 583, 124632. [Google Scholar] [CrossRef]
  51. Winterrath, T.; Rosenow, W. A New Module for the Tracking of Radar-Derived Precipitation with Model-Derived Winds. Adv. Geosci. 2007, 10, 77–83. [Google Scholar] [CrossRef]
  52. Jolliffe, I.T.; Stephenson, D.B. Forecast Verification: A Practitioner’s Guide in Atmospheric Science, 2nd ed.; John Wiley & Sons, Ltd.: Chichester, UK, 2012. [Google Scholar]
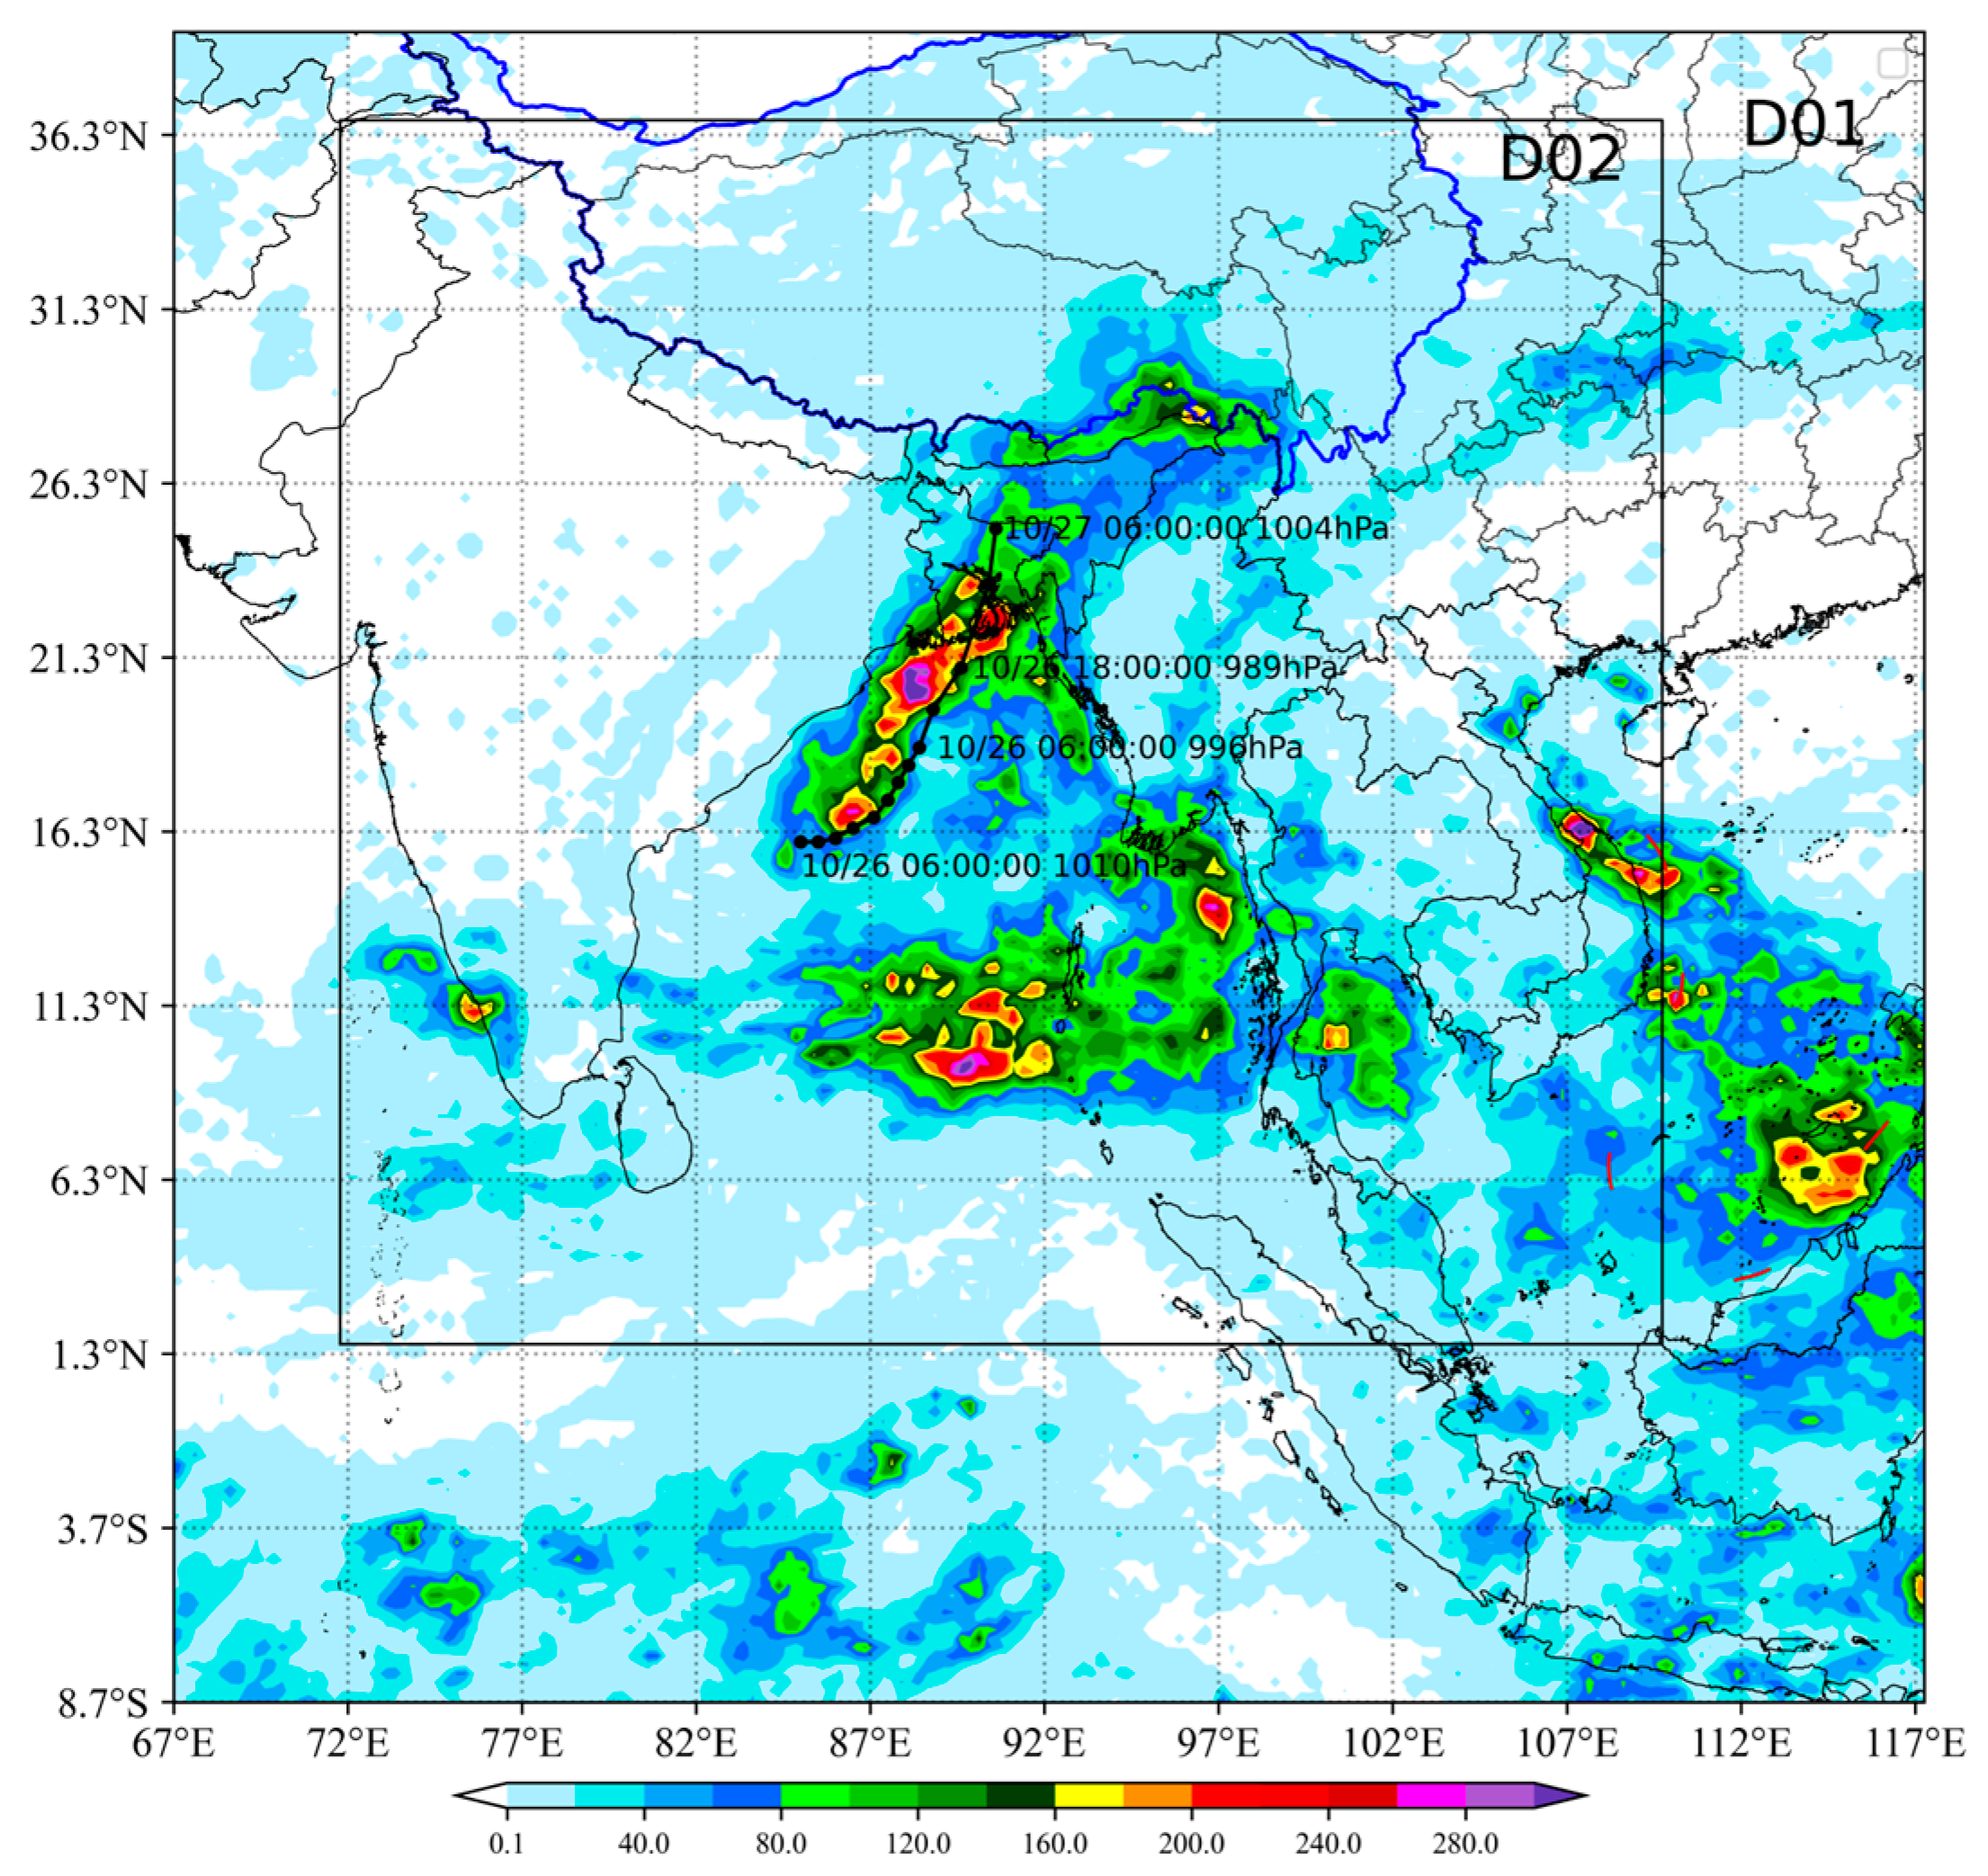
Figure 1. The simulation area, superimposed with the TC track and the precipitation. The color is the observed precipitation of TRMM from 12:00 UTC 24 to 12:00 UTC 27 October 2008.
Atmosphere 14 01479 g001
Figure 2. Distribution of cloud top bright temperature (shaded, unit: °C) and horizontal wind vector (arrows, unit: m/s) at 850 hPa during Rashmi landfall northward. (a) 18:00 UTC 26 October; (b) 00:00 UTC 27 October; (c) 06:00 UTC 27 October; (d) 12:00 UTC 27 October.
Atmosphere 14 01479 g002
Figure 3. The left column, respectively, shows the 6 h (a) tracks; (c) track errors; (e) MSLP; (g) MSLP errors; (i) 10 m MWS; (k) 10 m MWS errors with FNL data as the initial-boundary conditions. The right column (b,d,f,h,j,l) is the same as the left column, but the initial-boundary conditions are provided by the ERA5 data. The dotted line is the mean value of absolute error between each simulation result and the observed value. The x- axis labels in (cl) represent time (e.g., 24_06 means 06:00 UTC 24 October 2008).
Atmosphere 14 01479 g003
Figure 4. (ae) At 18:00 UTC 26, FNL adopted different cumulus convection schemes; (fj) cloud top brightness temperature (CTT) simulation results of FNL at 06:00 UTC 27th using different cumulus convection schemes. (kt) are the same as (aj) but are ERA5 tests. The typhoon symbol is the simulated position of the lowest sea level pressure, and the arrows is the simulated wind field at 850 hPa.
Atmosphere 14 01479 g004
Figure 5. (ai)The height field (solid blue line, gpm), temperature field (red line, K), and 500 hPa wind field (vector arrow) at 500 hPa at 06:00 UTC 26 October, 18:00 UTC 26 October, and 06:00 UTC 27 October, (ac) are ERA5 TDK, (df) are ERA5 GF, and (gi) are FNL BMJ schemes, respectively.
Atmosphere 14 01479 g005
Figure 6. (ad) are the meridional cross-section of FNL KF, FNL SAS, ERA5 TDK, and ERA5 BMJ schemes passing through Rashmi’s center at 12:00 UTC 26 October, respectively. (eh) are same as (ad) but at 06:00 UTC 27 October; (ip) are same as (ah) but for the zonal cross-section past the center of Rashmi, respectively. The vector is a composite wind field, and the vertical wind speed is amplified 100 times, in m/s. The color shaded is the temperature anomaly and the spacing is 2 K. The contour line is the potential height anomaly, where the solid line is positive and the dashed line is negative, and the interval is 2 dgm. The gray filling color is the terrain height, and the typhoon symbol is the simulated Rashmi’s center.
Atmosphere 14 01479 g006
Figure 7. Precipitated water (PW, shaded, spaced 2.5 mm) and equivalent potential temperature ( θ s e ) distribution (isoline, spaced 2 K) using different cumulus convective schemes. (a,b)’s data come from ERA5 reanalysis data. The typhoon symbols and arrows are Rashmi’s center position given by JTWC and the wind field at 500 hPa at 00:00 UTC 27 and 06:00 UTC 27. (cg) are FNL BMJ, FNL TDK, FNL GF, FNL KF, and FNL SAS schemes at 00:00 UTC 27, and (hl) are ERA5 BMJ, ERA5 TDK, ERA5 GF, ERA5 KF, and ERA5 SAS schemes at 00:00 UTC 27, respectively. The typhoon symbols and arrows are the simulated MSLP positions and simulated wind field at 500 hPa at 00:00 UTC 27.
Atmosphere 14 01479 g007
Figure 8. Precipitation from 12:00 UTC 26 October to 12:00 UTC 27 October. (a) TRMM cumulative precipitation; (b) station cumulative precipitation; (c) Taylor diagram after standardization of simulation and station observation values. The black circle indicate there is no precipitation in this station.
Atmosphere 14 01479 g008
Figure 9. In the first column, 72 h accumulated precipitation was simulated by combining FNL data with (a) BMJ, (e) TDK, (i) GF, (m) KF, and (q) SAS convective schemes from 12:00 UTC 24 October to 12:00 UTC 27 October, respectively. The second column is 72 h accumulated precipitation simulated by combination of ERA5 data (b) BMJ, (f) TDK, (j) GF, (n) KF, and (r) SAS cumulus convective schemes from 12:00 UTC 24 October to 12:00 UTC 27 October, respectively. The third (cs) and fourth columns (dt) are the same as the first and second columns, respectively, but they are accumulative precipitation for 24 h from 12:00 UTC 26 October to 12:00 UTC 27 October.
Atmosphere 14 01479 g009
Table 1. WRF model configuration.
DomainD01D02
Grid points (x,y)200 × 205451 × 451
Grid size (km)27 km9 km
Vertical layers6565
Initial-boundary conditionsFNL, ERA5 reanalysis data
Microphysics schemePurdue Lin
Cumulus parameterization schemeBetts–Miller–Janjic, New Tiedtke, Grell–Freitas, Kain–Fritsch, New SAS
Shortwave radiation schemeDudhia
Longwave radiation schemeRRTM
Boundary layer schemeYSU
Land surface schemeNoah
10 experimentsFNL BMJ, FNL TDK, FNL GF, FNL KF, FNL SAS
ERA5 BMJ, ERA5 TDK, ERA5 GF, ERA5 KF, ERA5 SAS
Table 2. The mean value of absolute errors between simulated results and observed values of different schemes.
FNL
BMJ
FNL
TDK
FNL
GF
FNL
KF
FNL
SAS
ERA5
BMJ
ERA5
TDK
ERA5
GF
ERA5
KF
ERA5
SAS
Track Errors (km)219.0160.3125.7100.791.9150.368.5183.1108.2108.7
SLP Errors (hPa)4.963.54.457.213.552.942.56.254.342.6
10 m-MWS Errors (m/s)5.324.004.715.363.192.441.836.283.32.1
Table 3. Contingency table of predictive and observed situations for a selected threshold.
SimulationObservationTotal
YesNo
YesHit (a)False alarm (b)a + b
NoMiss (c)Correct rejection (d)c + d
Totala + cb + da + b + c + d (n)
Table 4. Formulas for scores.
TS a a + b + c
ETS a D r a + b + c D r ,   D r = a + b a + c n
BIAS a + b a + c
HSS 2 a d b c a + c c + d + a + b b + d  (Appendix A)
POD a a + c
FAR b a + b
MAR c a + c
Table 5. Meteorological scores of 102 stations and precipitation of three extreme stations from different combinations of experimental simulation results.
FNL
BMJ
FNL
TDK
FNL
GF
FNL
KF
FNL
SAS
ERA5
BMJ
ERA5
TDK
ERA5
GF
ERA5
KF
ERA5
SAS
MEAN10.683 13.474 13.509 14.460 13.497 12.180 13.181 12.496 15.924 12.555
Cona98 mm69.60 80.18 128.83 82.85 70.41 62.01 112.99 70.05 117.65 58.46
Bomi87 mm47.65 74.17 93.05 110.72 67.31 55.03 100.53 109.14 132.68 69.08
Zayu57 mm31.06 37.38 22.41 24.06 49.48 34.59 29.66 42.46 41.78 44.32
>0.1TS0.9590.9490.9490.9590.9170.9270.9590.9000.9490.887
mm/dETS0.531 0.419 0.356 0.480 0.387 0.423 0.480 0.133 0.419 0.266
HSS0.694 0.591 0.525 0.648 0.558 0.595 0.648 0.234 0.591 0.420
OSNBIAS1.021 1.032 1.053 1.043 0.957 0.968 1.043 1.021 1.032 0.947
94POD0.989 0.989 1.000 1.000 0.936 0.947 1.000 0.957 0.989 0.915
FAR0.031 0.041 0.051 0.041 0.022 0.022 0.041 0.063 0.041 0.034
MAR0.011 0.011 0.000 0.000 0.064 0.053 0.000 0.043 0.011 0.085
0.1–10TS0.575 0.667 0.676 0.641 0.493 0.574 0.706 0.629 0.627 0.543
mm/dETS0.236 0.396 0.367 0.383 0.176 0.277 0.429 0.319 0.342 0.230
HSS0.382 0.567 0.537 0.554 0.300 0.434 0.600 0.483 0.510 0.374
OSNBIAS0.983 0.897 1.052 0.810 0.828 0.845 1.000 0.966 0.879 0.862
58POD0.724 0.759 0.828 0.707 0.603 0.672 0.828 0.759 0.724 0.655
FAR0.263 0.154 0.213 0.128 0.271 0.204 0.172 0.214 0.176 0.240
MAR0.276 0.241 0.172 0.293 0.397 0.328 0.172 0.241 0.276 0.345
10–25TS0.244 0.425 0.297 0.405 0.233 0.317 0.400 0.417 0.308 0.316
mm/dETS0.090 0.283 0.172 0.256 0.086 0.173 0.279 0.291 0.172 0.185
HSS0.165 0.442 0.293 0.407 0.159 0.295 0.437 0.451 0.294 0.312
OSNBIAS1.154 1.192 0.846 1.269 1.038 1.077 0.885 0.962 0.962 0.923
26POD0.423 0.654 0.423 0.654 0.385 0.500 0.538 0.577 0.462 0.462
FAR0.633 0.452 0.500 0.485 0.630 0.536 0.391 0.400 0.520 0.500
MAR0.577 0.346 0.577 0.346 0.615 0.500 0.462 0.423 0.538 0.538
>25TS0.357 0.353 0.316 0.350 0.263 0.278 0.389 0.500 0.318 0.333
mm/dETS0.314 0.300 0.258 0.291 0.206 0.223 0.335 0.453 0.255 0.278
HSS0.478 0.462 0.411 0.451 0.341 0.364 0.501 0.624 0.407 0.435
OSNBIAS0.900 1.300 1.500 1.700 1.400 1.300 1.500 1.400 1.900 1.400
10POD0.500 0.600 0.600 0.700 0.500 0.500 0.700 0.800 0.700 0.600
FAR0.444 0.538 0.600 0.588 0.643 0.615 0.533 0.429 0.632 0.571
MAR0.500 0.400 0.400 0.300 0.500 0.500 0.300 0.200 0.300 0.400
Disclaimer/Publisher’s Note: The statements, opinions and data contained in all publications are solely those of the individual author(s) and contributor(s) and not of MDPI and/or the editor(s). MDPI and/or the editor(s) disclaim responsibility for any injury to people or property resulting from any ideas, methods, instructions or products referred to in the content.