Abstract
In this study, we evaluated the performance of the Brazilian Global Atmospheric Model (BAM), in its version 2.2.1, in the representation of the surface variables solar radiation, temperature (maximum, minimum, and average), and wind speed. Three experiments were carried out for the period from 2016 to 2022 under three different aerosol conditions (constant (CTE), climatological (CLIM), and equal to zero (ZERO)), discarding the first year as a spin-up period. The observations came from a high-resolution gridded analysis that provides Brazil with robust data based on observations from surface stations on a daily scale from 1961 to 2020; therefore, combining the BAM outputs with the observations, our intercomparison period took place from 2017 to 2020, for three timescales: daily, 10-day average, and monthly, targeting different applications. In its different simulations, BAM overestimated solar radiation throughout Brazil, especially in the Amazon; underestimated temperature in most of the northeast, southeast, and south regions; and overestimated in parts of the north and mid-west; while wind speed was only not overestimated in the Amazon region. In relative terms, the simulations with constant aerosol showed better performance than the others, followed by climatological conditions and zero aerosol. The dexterity indices applied in the intercomparison between BAM and observations indicate that BAM needs adjustments and calibration to better represent these surface variables. Where model deficiencies have been identified, these can be used to drive model development and further improve the predictive capabilities.
1. Introduction
Society demands increasingly accurate numerical weather forecasts, given the current scenario of an increase in the number of occurrences of natural disasters of meteorological origin [1], as well as the need to better manage water resources for the consumption and generation of energy [2,3]. Moreover, a new area of the productive sector that uses more and more information from numerical models is that of renewable energies, mainly in relation to the variables wind speed and solar radiation [4,5].
For a country of continental dimensions such as Brazil, in addition to it being essential to have a wide network of surface meteorological observations, it is essential to have a well calibrated and parameterized numerical model according to its own characteristics of soils, vegetation, hydrography, etc. [6], to provide useful and reliable weather and climate products [7,8].
In view of the common challenges in the development of numerical weather and climate models (shortage of in situ observations, difficulties related to the use of remote sensing observations, and difficulty in interpreting microwave signals from clouds, with regard to the assimilation system data [9]; in addition to the complexity of surface boundary conditions due to variations in land use and occupation, vegetative dynamics, and fast-developing mesoscale systems [10]; as well as the complexity of processes’ sub-grid physics, boundary layer stability, mixed-phase clouds, and radiative transfer [11,12,13]), Brazil has a model entirely developed by the global modeling group of the Center for Weather Forecasting and Climatic Studies (CPTEC/INPE): the Brazilian Global Atmospheric Model (BAM).
The BAM was recently described and widely evaluated [6,14,15,16,17,18,19,20]. However, a performance analysis of the BAM in its latest version 2.2.1 is required. In this sense, according to the vertiginous growth of energy production from natural resources in Brazil (wind and solar), our objective is to evaluate the performance of the BAM for three surface variables: global solar radiation (MJ/m2), which we mention in this work only as solar radiation; wind speed (m·s−1); and temperature (maximum, minimum, and average (°C)), from 2017 to 2021, at three accumulation levels: daily, decennial, and monthly. The observed data compared to the BAM are from the grid analysis in [21].
This study uses the BAM model version 2.2.1, which is incorporated into the spectral dynamic core, with quadratic triangular truncation and a hybrid vertical coordinate (sigma/pressure). This version features a new dynamic core that incorporates a two-level monotonic semi-Lagrangian scheme. This grid point scheme calculates the three-dimensional moisture transport (specific humidity) of microphysics’ prognostic variables (liquid water, ice, etc.) and tracers (ozone, aerosols, CO2). In version 2.0.0, a horizontal diffusion parameterization was introduced in grid point, to replace the old horizontal diffusion parameterization performed in the spectral space. This new parameterization of diffusion allows controlling which region to apply more diffusion to in relation to other regions (without topography) that do not need this type of adjustment.
The physical parameterizations used by the BAM model are equivalent to those used in other weather and climate forecast models in other operational centers. However, to improve the BAM model for the tropical region and South America, it was necessary to develop more efficient processes and physical parameterizations. New physical processes such as fine root dynamics, change in soil heat capacity as a function of sand and clay percentage, and different soil layer thickness configurations, have been introduced into the IBIS surface scheme. In the radiation parameterization, a new formulation was introduced to calculate the cloudiness fraction.
The BAM model version 2.2.1 can use, as lower bound conditions (over the oceans), the prescribed time series of sea surface temperature (SST) obtained from the Optimal Interpolation SST of the National Oceanic and Atmospheric Administration (NOAA-OISST), and it can also be coupled to an ocean model.
2. Materials and Methods
2.1. Region of Study
The study area is related to the entire Brazilian territory, the largest country in South America and the fifth largest in the world in territorial extension with 8.51 × 10⁶ km2. Brazil has a complex territory, with 7491 km of coastline bathed by the Atlantic Ocean, where warm coastal ocean currents predominate, favoring a typical biome of this area, the Atlantic Forest. Other important biomes are the Amazon, whose highest percentage is found in the north region of Brazil; the Cerrado in the central portion of the country; the Caatinga that predominates in the interior of the northeast region; the Pantanal in part of the center-west; and the Pampa in the south region. Brazil has extensive hydrographic basins, including the Amazon basin whose largest river in the world in terms of length and volume, the Amazon, discharges 12.5 billion liters per minute into the ocean, which is the highest average flow of a freshwater river on the planet. There is diversity of vegetation types and topography, with plains, plateaus, and mountains. All of these features, among others, pose challenges to numerical weather forecasting.
Figure 1a shows the Brazilian territory and its topography, and Figure 1b shows the distribution of the 715 BAM grid points over Brazil used to evaluate the model’s performance for the variables solar radiation, wind speed, and temperature. Further details of the model and the analyzed variables can be found in this section.
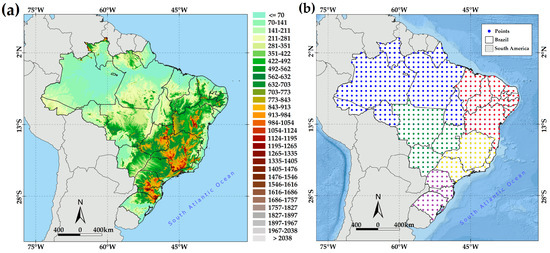
Figure 1.
(a) Geographical location of Brazil in South America, highlighting its topography, and (b) spatial distribution of grid points of data observed and simulated by BAM for intercomparison. In (b), the grid points inserted in each region that served as the basis for the sub-regional analyses are highlighted by color: north region (NO), blue; northeast region (NE), red; mid-west region (CO), green; southeast region (SE), yellow; south region (S), purple.
2.2. Observed Data
The authors of [21] updated and made available the most complete gridded analysis of surface meteorological variables in Brazil, based on all existing observation networks, from federal, state, municipal, and independent agencies. As described in their work, all precipitation, temperature, relative humidity, wind speed, and solar radiation data collected between 1961 and 2020 were exposed to strict quality control, and then the data were interpolated following the best results obtained via cross-validation between inverse distance weighting (IDW) and angular distance weighting (ADW) methods, to generate a high resolution 0.1° × 0.1° grid. To pay attention only to the variables of interest in our study, which were temperature, solar radiation, and wind speed, we briefly describe the methodology used in [21].
2.2.1. Temperature
Two grids were built, one for maximum temperature and another for minimum temperature. For the construction of these grids, an elevation adjustment was performed on the basis of the heights of each station point that provided data, according to a temperature lapse rate of 0.006 °C·m−1. To represent the topographic relief of Brazil, the Global Multiresolution Terrain Elevation Data 2010 (GMTED2010, [22]) were used, acquired with a spatial resolution of 30″ × 30″. The interpolation method that offered the best result for grid construction was IDW for maximum temperature and ADW for minimum temperature, both adjusted for elevation. Data from 1375 stations spatially distributed throughout Brazil contributed to the construction of the temperature grid. A grid for the average temperature was obtained simply by dividing the maximum and minimum values. The results of this new grid adjusted by the lapse rate showed greater correlation and smaller errors than those obtained by the grid built and detailed in [23], which did not have this altitude correction.
2.2.2. Solar Radiation and Wind Speed
Analogous to the construction of the temperature grid, high resolution grids of solar radiation and wind speed were built. For these variables, the interpolation method that proved to be the most efficient was the ADW. The lowest performance of solar radiation was observed in the Amazon basin with a correlation of 0.689, and the best performance was observed in the area of the Uruguay River basin and in the South Atlantic region, with correlations of 0.94 and 0.92, respectively. Wind speed presented similar results to solar radiation.
2.3. BAM v.2.2.1 Experimental Design
BAM-3D is currently used operationally to perform numerical weather, sub-seasonal, and seasonal forecasts, which is its main function as an important support for operational weather forecasting and associated decision making. BAM in its ocean-coupled version (BESM) is also used for climate change simulations, where the inclusion of aerosols is essential [6,7,8].
BAM version 2.2.1 has spectral, quadratic triangular truncation, with the maximum number of waves equal to 126, equivalent to approximately 1° of longitude by 1° of latitude of horizontal resolution. The vertical coordinate is a hybrid represented by 42 vertical levels, from 1000 to 2.0 hPa. The ERA5 reanalysis was used as the model’s initial condition [24,25], with a spatial resolution of 0.25° × 0.25°, and a temporal resolution of 1 h for the variables temperature, specific humidity, zonal and meridional wind speed, surface pressure, and orography. The lower boundary condition (SST data) over the oceans was from NCEP-NOAA with a horizontal resolution of 1.0° and monthly frequency [26]. The initial condition of soil moisture was from the climatology of [27]. The physical processes’ components of BAM used to perform the simulations evaluated in this study are shown in Table 1.

Table 1.
Components of physical processes of experiments.
Three experiments were performed for the period from 2016 to 2022 (with three hourly outputs) under three different aerosol conditions (a constant aerosol (CTE), a climatological aerosol varying monthly (CLIM), and an aerosol equal to zero (ZERO)). The first year was discarded as a spin-up period for the evaluations during the study. Due to the discarding of the year 2016 and the limitation of the observed data from the grid in [21] until 2020, the BAM outputs from the years 2017 to 2020 of temperature, solar radiation, and surface wind speed were used for comparison to the observed data, on three timescales: daily, 10-day average, and monthly. These three timescales are justified by the fact that [21] data are daily, and, as mentioned in [38], the daily scale is important for analyzing climate extreme indices [39,40,41,42,43,44,45]. On the other hand, the 10-day scale is important for application in agrometeorological studies, as this is the timestep used in many crop growth simulation models [46,47,48], whereas the monthly scale is essential for studies that involve analyses of the influence of modes of variability on climate dynamics, as well as for research in the area of seasonal and sub-seasonal climate forecasts [49,50,51,52,53,54].
2.4. Methodology for Intercomparison
The comparison between observations and simulations was based on extracting solar radiation, wind, and temperature time series from the 715 BAM grid points shown in Figure 1b. For these same points, the time series of observations from the grid analysis by [21] were extracted. BAM data were output every 3 h UTC. These times were converted to local time in order to match the synoptic times of observations from conventional and automatic stations that were the main pillar of construction of the gridded analysis in [21]. Thus, to compose the daily data of solar radiation and wind speed, the respective accumulations/averages referring to the 24 h period were obtained; for the maximum temperature, the time of 18 UTC was obtained (closer to the time the daily maximum temperature of a station was obtained), and, for the minimum temperature, the model value of 06 UTC was used (closest to the time where the minimum temperature of a station was obtained daily). The solar radiation data originally in the model in W/m2 and the temperature in K were converted to the observation units of MJ/m2 and °C, respectively, while the wind speed data from BAM were already in the same observation units (m·s−1).
After such adjustments in the databases, a qualitative verification was carried out, comparing the seasonal averages of each variable in the 4 years of observation/simulation, in order to highlight the basic premise that a model should basically represent the average annual cycle of any surface variable that is intended to be studied. Then, a quantitative verification was performed at daily, 10-day average, and monthly levels, using two measures of dexterity (Pearson’s correlation coefficient (r, Equation (1)) and the concordance index (CI, Equation (2)), proposed by [27]) and three error measures (the bias (BIAS, Equation (3)), the mean absolute error (MAE, Equation (4)), and the mean squared error (RMSE, Equation (5))). Models were compared to real observation grid points in many studies to attest the effectiveness of a model, a grid analysis, or a reanalysis [55,56,57]. Statistical analyses were performed using the free software R, version 4.0.3.
In addition to these metrics, the probability density function (PDF) (Equation (6)) was applied for a sub-regional evaluation comparing each of the five Brazilian regions: north, northeast, mid-west, southeast, and south; the average performance of the three experiments of BAM represented the monthly annual cycle of the observed variables.
where N is the total number of elements in the series, si is the variable extracted from each BAM time series at each time i of each point of the model grid, xi is the time series of the observations at each time i at each point of the gridded analysis, X is the average of the values observed, Cov(x, s) is the covariance between the data, σ(x, s) is the respective standard deviation, x is the climatological variable (solar radiation, wind velocity, and air temperature), σ is the standard deviation, and μ the mean of the dataset.
3. Results
3.1. Description of Present Climatology
One of the criteria commonly used in evaluating the performance of a model is whether or not the historical condition (observation) can be replicated [58]. Therefore, it is indispensable that the methods used to parameterize a numerical model of weather and climate are efficient to the point of allowing simulations of variables that demonstrate the same properties of the observations, resulting in a good correlation between both, and that present reliability in the characterization of the average observed in a reference period.
Figure 2 shows the BAM’s ability to represent the annual seasonal cycle of solar radiation in Brazil between 2017 and 2020. In the summer, DJF is presented in the upper panel in Figure 2a (observed mean), followed by the means obtained with the three different BAM aerosol conditions: climatological—CLIM in Figure 2b, constant—CTE in Figure 2c, and zero—ZERO in Figure 2d. The middle panels in the sequence show the same for autumn: MAM (Figure 2e–h), winter—JJA (Figure 2i–l), and spring—SON (Figure 2m–p).
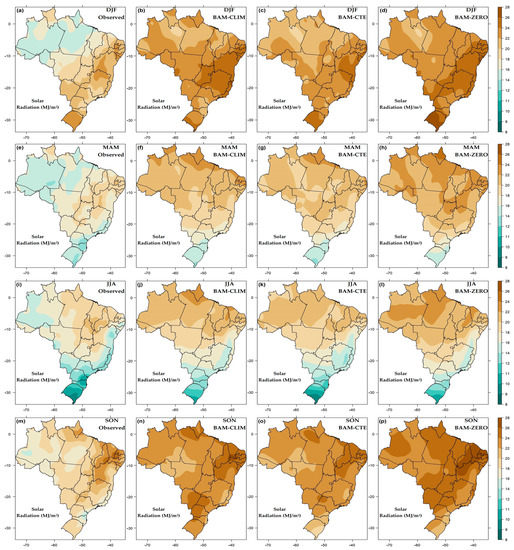
Figure 2.
Seasonal averages of solar radiation (MJ/m2). In the upper panel, values obtained for summer (DJF) from observations (a), BAM-CLIM (b), BAM-CTE (c), and BAM-ZERO (d). In the second panel, the same for autumn (MAM) from observations (e), BAM-CLIM (f), BAM-CTE (g), and BAM-ZERO (h). In the third panel, the same for winter (JJA) from observations (i), BAM-CLIM (j), BAM-CTE (k), and BAM-ZERO (l). In the last panel, the same for spring (SON) from observations (m), BAM-CLIM (n), BAM-CTE (o), and BAM-ZERO (p).
It can be seen from these images that the results of the three simulations with different aerosol conditions overestimated solar radiation, especially in the Amazon region in all seasons of the year, with an emphasis on summer (Figure 2b–d) and spring (Figure 2n–p). In autumn and winter, overestimation was still noticeable in the Amazon and north of the northeast, but simulated mean values were closer to the observation in the central and southern portions of Brazil, with the BAM-CTE condition demonstrating the greatest similarity.
Figure 3 shows the same results as Figure 2, but for wind speed. The BAM tended to subtly underestimate the wind speed in the Amazon region, whereas it considerably overestimated it in other areas, mainly in the coastal areas of the northeast and south regions of Brazil. These features were milder in summer (Figure 3b–d), increased in intensity in autumn (Figure 3f–h), and intensified especially in winter (Figure 3k–l) and spring (Figure 3n–p), according to observations of whether velocity values were much higher than those mainly propagating throughout the interior of the northeast region.
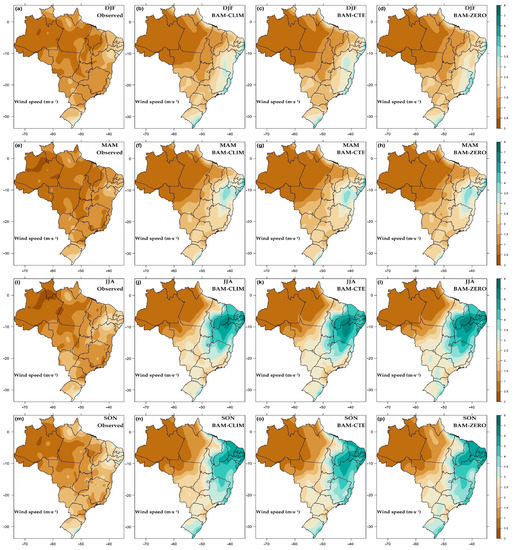
Figure 3.
Seasonal averages of wind speed (m·s−1). In the upper panel, values obtained for summer (DJF) from observations (a), BAM-CLIM (b), BAM-CTE (c), and BAM-ZERO (d). In the second panel, the same for autumn (MAM) from observations (e), BAM-CLIM (f), BAM-CTE (g), and BAM-ZERO (h). In the third panel, the same for winter (JJA) from observations (i), BAM-CLIM (j), BAM-CTE (k), and BAM-ZERO (l). In the last panel, the same for spring (SON) from observations (m), BAM-CLIM (n), BAM-CTE (o), and BAM-ZERO (p).
As for the average temperature (Figure 4), as a result of the average of maximums and minimums (panels not shown), lower values could be observed in all seasons of the year than those in the northeast and extreme north of the north region, while, in the center–west Amazon and mid-west region, there was a predominance of overestimation of the BAM, with no evident sign of under- or overestimation in the south region. These results are consistent with the characteristics observed for the maximum temperature, which was a slight underestimation in the north region, strong underestimation in the northeast region, and mild underestimation in the south region, but a slight overestimation in the mid-west; however, for the minimum temperatures, we observed an overestimation in almost all regions, stronger in the Amazonian south and mid-west region, with a slight underestimation only in the interior of the northeast region, a known semiarid area.
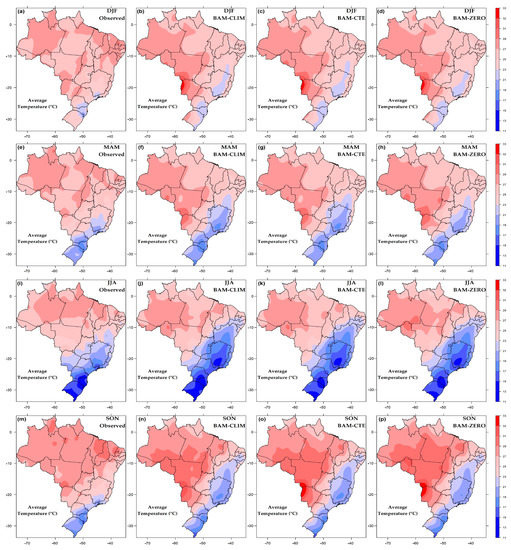
Figure 4.
Seasonal averages of mean temperature (°C). In the upper panel, values obtained for summer (DJF) from observations (a), BAM-CLIM (b), BAM-CTE (c), and BAM-ZERO (d). In the second panel, the same for autumn (MAM) from observations (e), BAM-CLIM (f), BAM-CTE (g), and BAM-ZERO (h). In the third panel, the same for winter (JJA) from observations (i), BAM-CLIM (j), BAM-CTE (k), and BAM-ZERO (l). In the last panel, the same for spring (SON) from observations (m), BAM-CLIM (n), BAM-CTE (o), and BAM-ZERO (p).
3.2. Comparison between Model and Observations on the Different Timescales
In a sub-regional analysis, we calculated the mean values of each variable and respective dexterity indices for each region of Brazil: north (NO), northeast (NE), mid-west (CO), southeast (SE), and south (S), according to the distribution of grid points arranged in Figure 1b, as well as for an average time series representative of all BAM grid points and observations. Moreover, we specialized each dexterity index commented on in Section 2.4 in order to better observe the distribution of areas with higher/lower correlations/errors. All analyses were carried out for three accumulation timescales: daily, 10-day average, and monthly.
Table 2 shows the average observed and simulated values of the variables in each region. It can be noted that the three BAM outputs with climatological, constant, and zero aerosol concentrations overestimated the radiation in all regions, with emphasis on the NO, with average differences around 5 MJ/m2, followed by the NE with 2.8 MJ/m2, CO with 2.6 MJ/m2, SE with 2.5 MJ/m2, and S with 2.2 MJ/m2. Among the simulations, the greatest differences from the observations were obtained with BAM-ZERO and the smallest were obtained with BAM-CTE. The average values of maximum temperature showed an average result of underestimation of the BAM with the three simulations. In this case, the smallest differences were obtained with BAM-ZERO for four regions, NO, NE, CO, and SE, and with BAM-CTE for S. The largest differences varied between BAM-CLIM and BAM-CTE, with the exception of the latter for the S region. With regard to minimum temperature, the results in terms of mean deviations were the opposite to those verified for the maximum temperatures, with all simulations overestimating, on average, the minimum temperature in each region, with the CO region showing the greatest positive differences >4 °C, followed by the NW and S regions >2.5 °C, Se with an average value of 1.7 °C, and NE with 1.5 °C; BAM-ZERO showed the largest deviations between the simulations. The combination of BAM underestimation for the maximums and underestimation for the minimums resulted in average temperatures with regional average values close to those observed, as in the specific cases of the NW and S regions, with an underestimation greater than −2 °C on average in the regions NE and SE, and an overestimation of 1 °C on average in the CO, as shown in Table 2. Lastly, we have the comparative results of the BAM simulations with the observation for wind speed. For this variable, simulated mean values were very close to those observed in the NW region and higher than those observed for CO (0.6 m·s−1 on average), S (0.7 m·s−1 on average), SE (1.5 m·s−1 on average), and NE with the highest simulated values in relation to observations (1.8 m·s−1 on average). Simulations with BAM-ZERO, on average, showed the greatest differences against observations, with BAM-CLIM and BAM-CTE showing very similar mean values.

Table 2.
Average values per region (north—NO, northeast—NE, mid-west—CO, southeast—SE, and south—S) of solar radiation (MJ/m2), temperature (°C), and wind speed (m·s−1) observed and with BAM for three different experiments of aerosol concentrations.
The results in Table 2 for solar radiation, summarized by region, were confirmed by the BIAS, MAE, RMSE, correlation, and CI spatial maps of each BAM experiment at daily, decennial, and monthly levels. Figure 5 shows the predominantly positive BIAS ranging up to 8 MJ/m2, with the lowest values associated with the BAM-CTE simulations and the highest values for the BAM-ZERO. The smallest BIAS extended across the NE, SE, and S regions in the three simulations, with the Amazon region showing the greatest positive biases. These results reflect the MAE and RMSE values in Figure 6 and Figure 7, showing the largest errors with BAM-ZERO and the smallest with BAM-CTE; however, unlike BIAS, a decrease in errors could be observed with longer periods of accumulation on the 10-day average and monthly scales. In agreement with these results, Figure 8 shows the highest correlations in eastern Brazil among NE, SE, and S, with values that exceeded 0.8 in areas of these regions, and the lowest in the NW and CO, especially for a border area along the NO, NE, and CO regions. All these results confirm what can be observed in Figure 9 of the CI, where the best performance of the simulations with BAM-CTE is clear, but with all the simulations being more efficient across the NE, SE, and S regions, and less efficient in NO and CO.
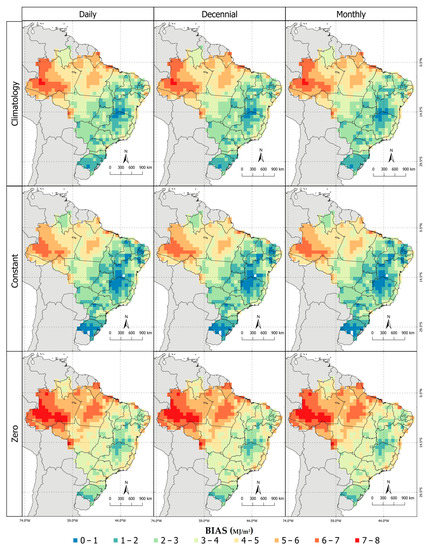
Figure 5.
Solar radiation BIAS (MJ/m2). The upper panel is derived from the BAM-CLIM simulations, the middle panel is derived from the BAM-CTE simulations, and the bottom panel is derived from the BAM-ZERO simulations. The left column shows BIAS on a daily scale, the middle column shows BIAS on a decennial scale, and the right column shows BIAS on a monthly scale.
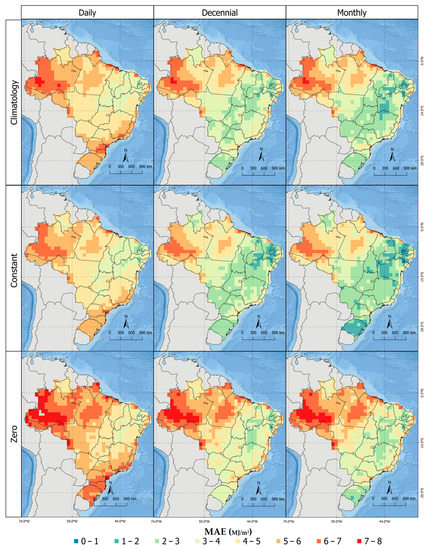
Figure 6.
MAE of solar radiation (MJ/m2). The upper panel is derived from the BAM-CLIM simulations, the middle panel is derived from the BAM-CTE simulations, and the bottom panel is derived from the BAM-ZERO simulations. The left column shows MAE on a daily scale, the middle column shows MAE on a decennial scale, and the right column shows MAE on a monthly scale.
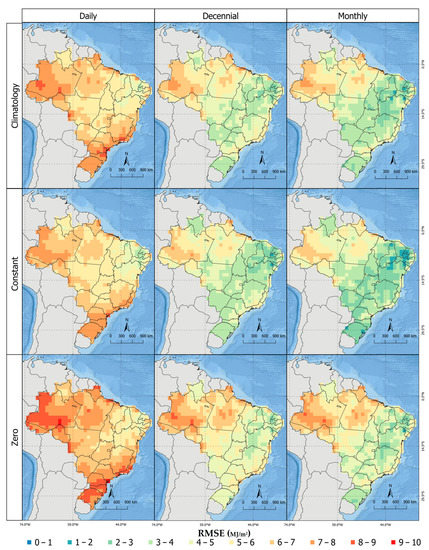
Figure 7.
RMSE of solar radiation (MJ/m2). The upper panel is derived from the BAM-CLIM simulations, the middle panel is derived from the BAM-CTE simulations, and the bottom panel is derived from the BAM-ZERO simulations. The left column shows RMSE on a daily scale, the middle column shows RMSE on a decennial scale, and the right column shows RMSE on a monthly scale.
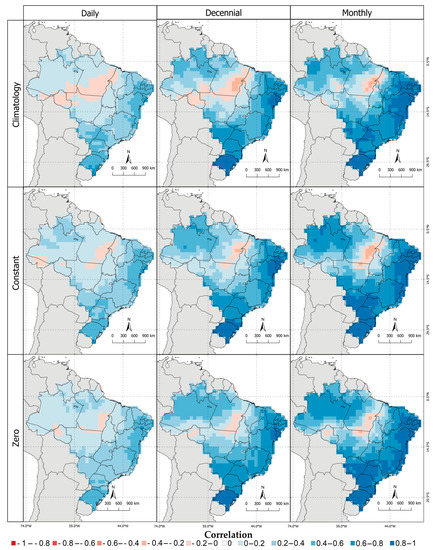
Figure 8.
Solar radiation correlation. The upper panel is derived from the BAM-CLIM simulations, the middle panel is derived from the BAM-CTE simulations, and the bottom panel is derived from the BAM-ZERO simulations. The left column shows correlation on a daily scale, the middle column shows correlation on a decennial scale, and the right column shows correlation on a monthly scale.
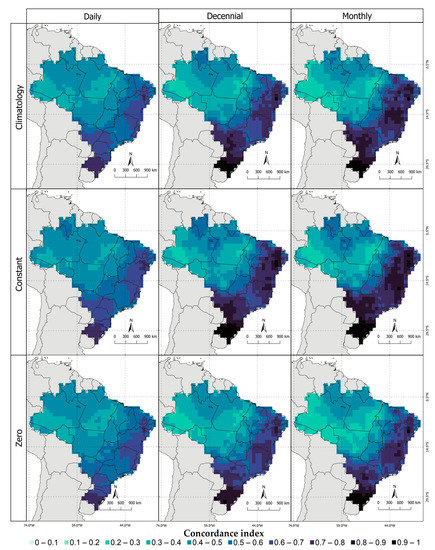
Figure 9.
Solar radiation CI. The upper panel is derived from the BAM-CLIM simulations, the middle panel is derived from the BAM-CTE simulations, and the bottom panel is derived from the BAM-ZERO simulations. The left column shows CI on a daily scale, the middle column shows CI on a decennial scale, and the right column shows CI on a monthly scale.
For maximum temperature, we observed a prevalence of negative BIAS in all three experiments, with positive BIAS restricted to parts of CO and NO. In NE and SE, there was negative BIAS down to −6 °C on average, from a daily to monthly scale, as can be seen in Figure S1 (Supplementary Materials). The MAE and RMSE (Figures S2 and S3, Supplementary Materials) showed the lowest errors associated with the BAM-CTE and BAM-ZERO experiments, and slightly higher errors in the BAM-CLIM. The better performance of the BAM-CTE was only confirmed by observing the correlation (Figure S4, Supplementary Materials), with an overall mean correlation of 0.644 versus 0.605 for the BAM-ZERO, compared to 0.584 for the BAM-CLIM. The CI proved that the areas with results closest to those observed in the three experiments were in the central–south Amazon region of the NO region and in southern Brazil with values close to 1 (Figure S5, Supplementary Materials).
The minimum temperature presented different results from the maximum temperature, with predominantly positive BIAS especially in the Amazonian south of the NW region and in CO, with negative areas in the interior of NE (Figure S6, Supplementary Materials). The high BIAS values in NO and CO led to the highest relative errors (Figures S7 and S8, Supplementary Materials), up to 7–8 °C on average across the three timescales. The correlation (Figure S9, Supplementary Materials) gradually increased with accumulation intervals exceeding 0.8 in much of the NE, SE, CO, and S, with the exception of low and negative values in the western NE and NO. The CI (Figure S10, Supplementary Materials) showed that it was in eastern Brazil where there was the best agreement between observed and simulated values. BAM-CLIM and BAM-CTE performed better than BAM-ZERO.
The average temperature, resulting from the average of the maximums and minimums, showed values closer to the observations, with a certain balance between areas that were underestimated in the simulated maximums and overestimated in the minimums. This junction resulted in an east–west gradient from negative to positive BIAS (Figure S11, Supplementary Materials), with extreme BIAS down to −6 °C in parts of the NO and SE and up to 5 °C in points in the NE and CO, excluding the S region where there was no prevalence of positive or negative BIAS. The errors decreased significantly with higher accumulation intervals, going from 2–3 °C to 0–1 °C on the daily to monthly scale (Figures S12 and S13, Supplementary Materials), highlighting S and the interior of NE with higher relative errors. The correlation was lowest only in the NW region, ranging from 0–0.2 to 0.4–0.6 on the daily to monthly scale, and from 0.2–0.4 to 0.8–1 in parts of the NE and CO, and throughout the SE and S (Figure S14, Supplementary Materials). The CI, in turn, showed the areas of greatest agreement in portions of the NO, CO, SE, S, and east of NE (Figure S15, Supplementary Materials). There was a similarity across the simulations, with a slight superiority of BAN-CTE in relation to BAM-ZERO and BAM-CLIM, with global correlations of 0.775, 0.759, and 0.751, respectively.
Lastly, we analyzed the spatial performance of the experiments with BAM for wind speed. The three simulations showed very similar results, overestimating the velocity in the eastern NE by up to 6 m/s. A wide band of positive BIAS extended across NE, SE, S, and parts of CO, with a predominance of negative BIAS in NO (Figure S16, Supplementary Materials). However, it was in NO where the MAE and RMSE values were lower, not due to better BAM performance in this region, but probably due to the low values normally observed for the variable in this region (Figures S17 and S18, Supplementary Materials), corroborated by the low correlation values, with the largest being observed in the interior of the NE and in parts of the SE and S, with greater accumulation intervals (Figure S19, Supplementary Materials). CI (Figure S20, Supplementary Materials) presented moderate values in relation to the other variables, and this fact can be attributed to the equally moderate performance of the simulations in relation to the observations, with global average correlations of 0.499, 0.490, and 0.487 for BAM-CLIM, BAM-CTE, and BAM-ZERO.
3.3. PDF Analysis
We observed in the previous sections that BAM was efficient in simulating the observed seasonal averages (Figure 2, Figure 3 and Figure 4), with a similarity between the simulations of each experiment for each region analyzed (Table 2), although the analyses of the dexterity indices demonstrated that it was possible to identify which simulations had greater efficiency among themselves for certain variables and regions when comparing the observations.
To complement these verifications and denote a more particular characteristic of the BAM simulations as a whole, we generated an ensemble of the three experiments and extracted a representative time series of all grid points located in each region, which were compared to a series with the same characteristics extracted from the observations. With these series, we made graphs with the probability density of each observed variable and the ensemble, in order to assess whether the BAM captures the basic climatic characteristics of each variable to support the model that can be used as a representation tool.
Figure 10 shows the solar radiation PDF, with the observed data on the left and the BAM data on the right. It can be noted that the temporal distribution of the variable in all regions was highly seasonal, a characteristic well captured by the BAM, albeit clearly overestimated in all months of the year. For the maximum temperature, Figure 11 shows that the model underestimated the observations more, as well as their amplitude, in the winter months in all regions, with an emphasis on NE (Figure 11c,d) and SE (Figure 11g,h). As for the minimum temperatures, the PDFs in Figure 12 show that the model captured the seasonality well in the NE (Figure 12c,d) and S (Figure 12i,j) regions, accentuating it in CO (Figure 12e,f) and SE (Figure 12g,h), in addition to imposing bimodal distributions on NO (Figure 12a,b) and reducing its amplitude by overestimating its values, which was also observed in the S region. There was close agreement between observations and the BAM, resulting in more similar PDFs, with emphasis on NE (Figure 13c,d), SE (Figure 13g,h), and S (Figure 13i,j), while maintaining bimodal distributions with greater amplitude in NO (Figure 13a,b) in the hottest months of the year, in addition to the BAM increasing seasonality in CO (Figure 13e,f). The wind speed PDFs exhibited the most interesting configurations, with the BAM managing to capture distributions that were often trimodal in NO, albeit out of phase with the observed distribution (Figure 14a,b). The BAM, in addition to overestimating the velocities in NE, SE, CO, and S, strongly increased the seasonality in NE (Figure 14c,d), CO (Figure 14e,f), and SE (Figure 14g,h), with lighter seasonality in S (Figure 14i,j).
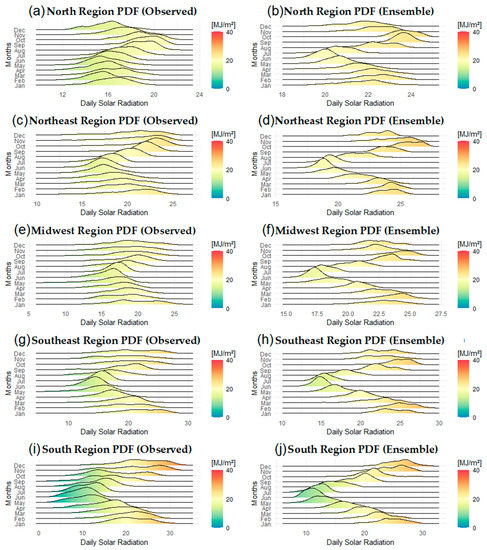
Figure 10.
Solar radiation probability density (MJ/m2), with observed data on the left and BAM data on the right, for each Brazilian region: NO (a,b), NE (c,d), CO (e,f), SE (g,h), and S (i,j).
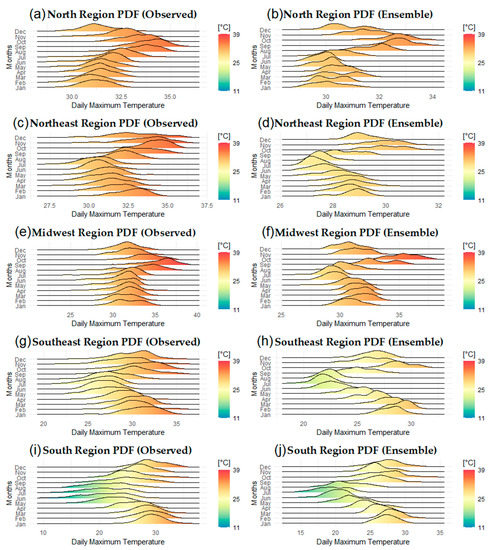
Figure 11.
Maximum temperature probability density (°C), with observed data on the left and BAM data on the right, for each Brazilian region: NO (a,b), NE (c,d), CO (e,f), SE (g,h), and S (i,j).
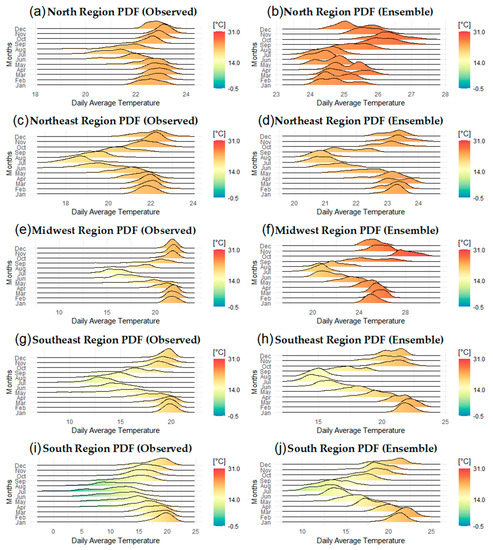
Figure 12.
Minimum temperature probability density (°C), with observed data on the left and BAM data on the right, for each Brazilian region: NO (a,b), NE (c,d), CO (e,f), SE (g,h), and S (i,j).
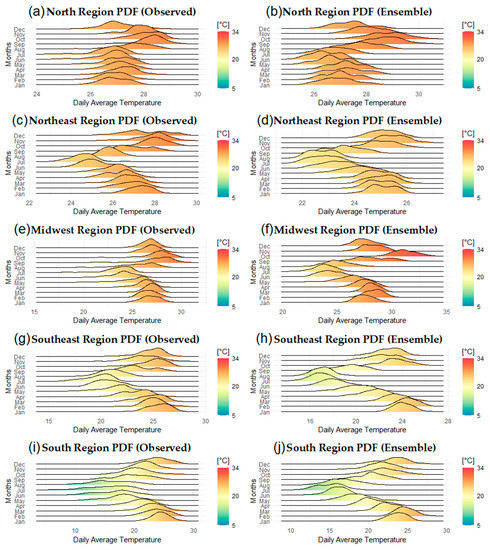
Figure 13.
Mean temperature probability density (°C), with observed data on the left and BAM data on the right, for each Brazilian region: NO (a,b), NE (c,d), CO (e,f), SE (g,h), and S (i,j).
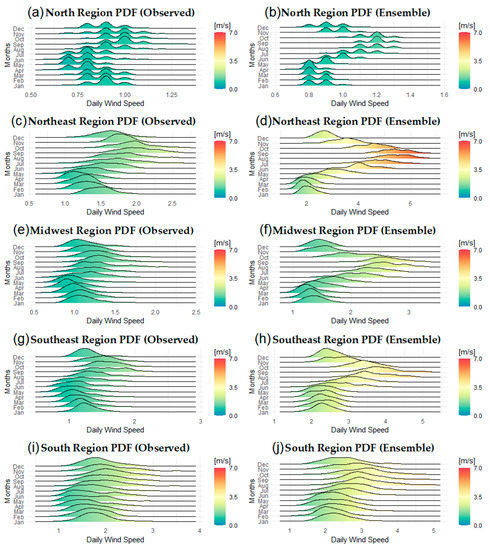
Figure 14.
Probability density of wind speed (m/s), with observed data on the left and BAM data on the right, for each Brazilian region: NW (a,b), NE (c,d), CO (e,f), SE (g,h), and S (i,j).
4. Discussion
This study aimed to evaluate the ability of the Brazilian Climate Model (BAM-2.2.1) to reproduce three surface variables, solar radiation, temperature, and wind speed, under three different configurations of aerosol concentration. Previous versions of the BAM have been the subject of studies in order to evaluate their performance in simulating different surface variables and in climate simulations [6,7,8,17,59].
The results showed that the three simulations with climatological, constant, and aerosol-free aerosol concentrations were similar, overestimating solar radiation throughout Brazil, especially in the Amazon, with the BAM-CTE simulations presenting the best dexterity indices and the BAM-ZERO simulations presenting the worst. Regardless of the simulation, the overestimation of radiation was identified by [17] for a previous version of the BAM, which reported an excessive loss of long-wave radiation by the model under cloudy conditions, associated with an insufficient absorption of radiation from long waves from lower and warmer atmospheric layers, i.e., the model atmosphere would be more transparent, with an optical depth of cloudiness smaller than the observed one, leading to errors in the cloud–radiation interaction. With this more transparent atmosphere, the retention of heat by short waves on the surface increased, leading to a greater balance of radiation by the model, precisely in regions with a predominance of convective clouds as in the case of the Amazon region, which were underestimated by the model [15,17]. These results influence the temperature, which, on average, was overestimated in much of the Amazon region, as reported by [59], who, among other analyses, found that evapotranspiration tended to be overestimated by the BAM in this region in the rainy season and underestimated in the dry season. Wind speed was overestimated in most of Brazil and underestimated in the Amazon, in agreement with what was verified and discussed by [20], when studying the representation of monsoons in the northern and southern hemispheres by BAM1.2 and HadGEM3, where they identified biases of the divergence of flows in the two models [60].
5. Conclusions
The BAM overestimated the solar radiation observed in the three aerosol experiments, with the greatest differences observed in the condition without aerosol, and the smallest observed in the condition with constant aerosol. This result demonstrates the importance of implementing parameterizations that adequately represent the concentration and characteristics of aerosols, because, even with less overestimation of the observed radiation values, they were still, on average, higher than 4 MJ/m2 in the north region; 2 MJ/m2 in the northeast, mid-west, and southeast regions; and 1.5 MJ/m2 in the south region. The BAM underestimated the maximum temperatures throughout Brazil, especially in the northeast and southeast, at an average of 3.5 °C lower than the observations, with average values very similar across the three experiments. A similar condition was observed for the minimum temperature, except that the observations were overestimated, with emphasis on the center–west where, on average, the minimum temperatures were 4 °C above those observed, and in the north and south that, on average, exceeded the observations by 2.5 °C. Since the average temperature of the model was the average of maximums and minimums, this balance of underestimation of maximums and overestimation of minimums had the effect of making the average daily temperatures simulated by the BAM more similar to those observed, with an underestimation greater than 2 °C in the northeast and southeast regions, an overestimation of more than 1 °C in the mid-west, and little variation in the north and south of the country. The winds simulated by the BAM, in average terms, had values close to those observed in the north region and higher than the observations in the other regions, exceeding 1.5 m·s−1 on average in the northeast and southeast regions and around 0.7 m·s−1 in the mid-west and south.
In terms of the calculated statistical dexterity indices, a better performance of the results obtained from the experiments with climatological and constant aerosol was noticed in relation to the experiment without aerosol. BAM-CTE had better performances in the simulations of solar radiation and average temperature, while BAM-CLIM had better performances in the simulations of wind and maximum and minimum temperatures. The PDFs demonstrated that the BAM, in general, efficiently reproduced the annual cycle of the analyzed variables, albeit with shifts in the probability density curves typical of cases where there was overestimation/underestimation by the model in relation to the observations.
Our results showed that BAM-2.2.1, under different aerosol conditions, was able to successfully simulate the daily, decennial, and monthly variability of solar radiation, temperature, and surface wind speed, despite the identified biases and associated errors, which can serve as a reference to better identify model parameters that need to be improved, such as the issue of associated cloud–radiation interactions. Where model deficiencies have been identified, these can be used to drive model development and further improve the predictive capabilities.
Supplementary Materials
The following supporting information can be downloaded at https://www.mdpi.com/article/10.3390/atmos14010125/s1: Figure S1. Maximum temperature BIAS (°C). The upper panel is derived from the BAM-CLIM simulations, the middle panel is derived from the BAM-CTE simulations, and the bottom panel is derived from the BAM-ZERO simulations. The left column shows BIAS on a daily scale, the middle column shows BIAS on a decennial scale, and the right column shows BIAS on a monthly scale; Figure S2. MAE of the maximum temperature (°C). The upper panel is derived from the BAM-CLIM simulations, the middle panel is derived from the BAM-CTE simulations, and the bottom panel is derived from the BAM-ZERO simulations. The left column shows MAE on a daily scale, the middle column shows MAE on a decennial scale, and the right column shows MAE on a monthly scale; Figure S3. Maximum temperature RMSE (°C). The upper panel is derived from the BAM-CLIM simulations, the middle panel is derived from the BAM-CTE simulations, and the bottom panel is derived from the BAM-ZERO simulations. The left column shows RMSE on a daily scale, the middle column shows RMSE on a decennial scale, and the right column shows RMSE on a monthly scale; Figure S4. Maximum temperature correlation. The upper panel is derived from the BAM-CLIM simulations, the middle panel is derived from the BAM-CTE simulations, and the bottom panel is derived from the BAM-ZERO simulations. The left column shows correlation on a daily scale, the middle column shows correlation on a decennial scale, and the right column shows correlation on a monthly scale; Figure S5. Maximum temperature CI. The upper panel is derived from the BAM-CLIM simulations, the middle panel is derived from the BAM-CTE simulations, and the bottom panel is derived from the BAM-ZERO simulations. The left column shows CI on a daily scale, the middle column shows CI on a decennial scale, and the right column shows CI on a monthly scale; Figure S6. Minimum temperature BIAS (°C). The upper panel is derived from the BAM-CLIM simulations, the middle panel is derived from the BAM-CTE simulations, and the bottom panel is derived from the BAM-ZERO simulations. The left column shows BIAS on a daily scale, the middle column shows BIAS on a decennial scale, and the right column shows BIAS on a monthly scale; Figure S7. MAE of the minimum temperature (°C). The upper panel is derived from the BAM-CLIM simulations, the middle panel is derived from the BAM-CTE simulations, and the bottom panel is derived from the BAM-ZERO simulations. The left column shows MAE on a daily scale, the middle column shows MAE on a decennial scale, and the right column shows MAE on a monthly scale; Figure S8. Minimum temperature RMSE (°C). The upper panel is derived from the BAM-CLIM simulations, the middle panel is derived from the BAM-CTE simulations, and the bottom panel is derived from the BAM-ZERO simulations. The left column shows RMSE on a daily scale, the middle column shows RMSE on a decennial scale, and the right column shows RMSE on a monthly scale; Figure S9. Minimum temperature correlation. The upper panel is derived from the BAM-CLIM simulations, the middle panel is derived from the BAM-CTE simulations, and the bottom panel is derived from the BAM-ZERO simulations. The left column shows correlation on a daily scale, the middle column shows correlation on a decennial scale, and the right column shows correlation on a monthly scale; Figure S10. Minimum temperature CI. The upper panel is derived from the BAM-CLIM simulations, the middle panel is derived from the BAM-CTE simulations, and the bottom panel is derived from the BAM-ZERO simulations. The left column shows CI on a daily scale, the middle column shows CI on a decennial scale, and the right column shows CI on a monthly scale; Figure S11. Average temperature BIAS (°C). The upper panel is derived from the BAM-CLIM simulations, the middle panel is derived from the BAM-CTE simulations, and the bottom panel is derived from the BAM-ZERO simulations. The left column shows BIAS on a daily scale, the middle column shows BIAS on a decennial scale, and the right column shows BIAS on a monthly scale; Figure S12. MAE of mean temperature (°C). The upper panel is derived from the BAM-CLIM simulations, the middle panel is derived from the BAM-CTE simulations, and the bottom panel is derived from the BAM-ZERO simulations. The left column shows MAE on a daily scale, the middle column shows MAE on a decennial scale, and the right column shows MAE on a monthly scale; Figure S13. RMSE of mean temperature (°C). The upper panel is derived from the BAM-CLIM simulations, the middle panel is derived from the BAM-CTE simulations, and the bottom panel is derived from the BAM-ZERO simulations. The left column shows RMSE on a daily scale, the middle column shows RMSE on a decennial scale, and the right column shows RMSE on a monthly scale; Figure S14. Correlation of mean temperature. The upper panel is derived from the BAM-CLIM simulations, the middle panel is derived from the BAM-CTE simulations, and the bottom panel is derived from the BAM-ZERO simulations. The left column shows correlation on a daily scale, the middle column shows correlation on a decennial scale, and the right column shows correlation on a monthly scale; Figure S15. Average temperature CI. The upper panel is derived from the BAM-CLIM simulations, the middle panel is derived from the BAM-CTE simulations, and the bottom panel is derived from the BAM-ZERO simulations. The left column shows CI on a daily scale, the middle column shows CI on a decennial scale, and the right column shows CI on a monthly scale; Figure S16. Wind speed BIAS (m·s−1). The upper panel is derived from the BAM-CLIM simulations, the middle panel is derived from the BAM-CTE simulations, and the bottom panel is derived from the BAM-ZERO simulations. The left column shows BIAS on a daily scale, the middle column shows BIAS on a decennial scale, and the right column shows BIAS on a monthly scale; Figure S17. MAE of wind speed (m·s−1). The upper panel is derived from the BAM-CLIM simulations, the middle panel is derived from the BAM-CTE simulations, and the bottom panel is derived from the BAM-ZERO simulations. The left column shows MAE on a daily scale, the middle column shows MAE on a decennial scale, and the right column shows MAE on a monthly scale; Figure S18. RMSE of wind speed (m·s−1). The upper panel is derived from the BAM-CLIM simulations, the middle panel is derived from the BAM-CTE simulations, and the bottom panel is derived from the BAM-ZERO simulations. The left column shows RMSE on a daily scale, the middle column shows RMSE on a decennial scale, and the right column shows RMSE on a monthly scale; Figure S19. Correlation of wind speed. The upper panel is derived from the BAM-CLIM simulations, the middle panel is derived from the BAM-CTE simulations, and the bottom panel is derived from the BAM-ZERO simulations. The left column shows correlation on a daily scale, the middle column shows correlation on a decennial scale, and the right column shows correlation on a monthly scale; Figure S20. Wind speed CI. The upper panel is derived from the BAM-CLIM simulations, the middle panel is derived from the BAM-CTE simulations, and the bottom panel is derived from the BAM-ZERO simulations. The left column shows CI on a daily scale, the middle column shows CI on a decennial scale, and the right column shows CI on a monthly scale.
Author Contributions
Conceptualization, D.L.H. and F.D.d.S.S.; methodology, D.L.H., F.D.d.S.S., H.B.G. (Helber Barros Gomes)., M.C.L.d.S. and H.B.G. (Heliofábio Barros Gomes); software, F.D.d.S.S., P.Y.K., D.C.d.S. and M.C.C.L.; validation, R.L.C., M.L.D.d.M. and G.L.M.; formal analysis, D.L.H. and F.D.d.S.S.; data curation, F.D.d.S.S., H.B.G. (Helber Barros Gomes), M.C.C.L., J.S.d.R., P.Y.K. and D.C.d.S.; writing—original draft preparation, D.L.H. and F.D.d.S.S.; writing—review and editing, D.L.H., F.D.d.S.S., H.B.G. (Helber Barros Gomes), M.C.L.d.S., H.B.G. (Heliofábio Barros Gomes), R.L.C., M.C.C.L., J.S.d.R., P.Y.K., D.C.d.S., M.L.D.d.M. and G.L.M.; visualization, D.L.H., F.D.d.S.S., H.B.G. (Helber Barros Gomes), M.C.L.d.S., H.B.G. (Heliofábio Barros Gomes), R.L.C., M.C.C.L., J.S.d.R., P.Y.K., D.C.d.S., M.L.D.d.M. and G.L.M.; funding acquisition, D.L.H. All authors have read and agreed to the published version of the manuscript.
Funding
The APC was funded in part by Coordination for the Improvement of Higher-Education Personnel (CAPES) by the following project of the CAPES: CAPES/Modelagem#88881.148662/2017-01.
Institutional Review Board Statement
Not applicable.
Informed Consent Statement
Not applicable.
Data Availability Statement
The data used in this manuscript are available by writing to the corresponding authors.
Acknowledgments
The authors would like to thank the institutions INPE and UFAL for the support given to this research.
Conflicts of Interest
The authors declare no conflict of interest.
References
- Marchezini, V.; Londe, L.R.; Loose, E.B.; Saito, S.M.; Marengo, J.A. Perceptions About Climate Change in the Brazilian Civil Defense Sector. Int. J. Disaster Risk Sci. 2022, 13, 664–674. [Google Scholar] [CrossRef]
- Pes, M.P.; Pereira, E.B.; Marengo, J.A.; Martins, F.R.; Heinemann, D.; Schmidt, M. Climate trends on the extreme winds in Brazil. Renew. Energy 2017, 109, 110–120. [Google Scholar] [CrossRef]
- Lucas, E.W.M.; dos Santos Silva, F.D.; de Souza, F.d.A.S.; Pinto, D.D.C.; Gomes, H.B.; Gomes, H.B.; Lins, M.C.C.; Herdies, D.L. Regionalization of Climate Change Simulations for the Assessment of Impacts on Precipitation, Flow Rate and Electricity Generation in the Xingu River Basin in the Brazilian Amazon. Energies 2022, 15, 7698. [Google Scholar] [CrossRef]
- Freitas, A.A.; Drumond, A.; Carvalho, V.S.B.; Reboita, M.S.; Silva, B.C.; Uvo, C.B. Drought Assessment in São Francisco River Basin, Brazil: Characterization through SPI and Associated Anomalous Climate Patterns. Atmosphere 2022, 13, 41. [Google Scholar] [CrossRef]
- Porfirio, A.C.S.; Ceballos, J.C.; Britto, J.M.S.; Costa, S.M.S. Evaluation of Global Solar Irradiance Estimates from GL1.2 Satellite-Based Model over Brazil Using an Extended Radiometric Network. Remote Sens. 2020, 12, 1331. [Google Scholar] [CrossRef]
- Figueroa, S.N.; Bonatti, J.P.; Kubota, P.Y.; Grell, G.A.; Morrison, H.; Barros, S.R.M.; Fernandez, J.P.R.; Ramirez, E.; Siqueira, L.; Luzia, G.; et al. The Brazilian Global Atmospheric Model (BAM): Performance for Tropical Precipitation Forecasting and Sen-sitivity to Convective Scheme and Horizontal Resolution. Weather Forecast. 2016, 31, 1547–1572. [Google Scholar] [CrossRef]
- Escada, P.; Coelho, C.A.S.; Taddei, R.; Dessai, S.; Cavalcanti, I.F.A.; Donato, R.; Kayano, M.T.; Martins, E.S.P.R.; Miguel, J.C.H.; Monteiro, M.; et al. Climate services in Brazil: Past, present, and future perspectives. Clim. Serv. 2021, 24, 100276. [Google Scholar] [CrossRef]
- Coelho, C.A.S.; Souza, D.C.; Kubota, P.Y.; Costa, S.M.S.; Menezes, L.; Guimarães, B.S.; Figueroa, S.N.; Bonatti, J.P.; Cavalcanti, I.F.A.; Sampaio, G.; et al. Evaluation of climate simulations produced with the Brazilian global atmospheric model version 1.2. Clim. Dyn. 2021, 56, 873–898. [Google Scholar] [CrossRef]
- Schultz, M.G.; Stadler, S.; Schröder, S.; Taraborrelli, D.; Franco, B.; Krefting, J.; Henrot, A.; Ferrachat, S.; Lohmann, U.; Neubauer, D.; et al. The chemistry–climate model ECHAM6.3-HAM2.3-MOZ1.0. Geosci. Model Dev. 2018, 11, 1695–1723. [Google Scholar] [CrossRef]
- Pezza, A.; Sadler, K.; Uotila, P.; Vihma, T.; Mesquita, M.D.S.; Reid, P. Southern Hemisphere strong polar mesoscale cyclones in high-resolution datasets. Clim. Dyn. 2016, 47, 1647–1660. [Google Scholar] [CrossRef]
- Nigro, M.A.; Cassano, J.J.; Wille, J.; Bromwich, D.H.; Lazzara, M.A. A self-organizing-map-based evaluation of the Antarctic mesoscale prediction system using observations from a 30-m instrumented tower on the Ross Ice Shelf, Antarctica. Weather Forecast. 2017, 32, 223–242. [Google Scholar] [CrossRef]
- Hines, K.M.; Bromwich, D.H.; Wang, S.-H.; Silber, I.; Verlinde, J.; Lubin, D. Microphysics of summer clouds in central West Antarctica simulated by the Polar Weather Research and Forecasting Model (WRF) and the Antarctic Mesoscale Prediction System (AMPS). Atmos. Chem. Phys. 2019, 19, 12431–12454. [Google Scholar] [CrossRef]
- Bromwich, D.H.; Otieno, F.O.; Hines, K.M.; Manning, K.W.; Shilo, E. Comprehensive evaluation of polar weather research and forecasting model performance in the Antarctic. J. Geophys. Res. Atmos. 2013, 118, 274–292. [Google Scholar] [CrossRef]
- Cavalcanti, I.F.A.; Raia, A. Lifecycle of South American monsoon system simulated by CPTEC/INPE AGCM. Int. J. Climatol. 2017, 37, 878–896. [Google Scholar] [CrossRef]
- Cavalcanti, I.F.A.; Silveira, V.P.; Figueroa, S.N.; Kubota, P.Y.; Bonatti, J.P.; de Souza, D.C. Climate variability over South America—Regional and large scale features simulated by the Brazilian Atmospheric Model (BAM-v0). Int. J. Climatol. 2020, 40, 2845–2869. [Google Scholar] [CrossRef]
- Guimarães, B.S.; Coelho, C.A.S.; Woolnough, S.J.; Kubota, P.Y.; Bastarz, C.F.; Figueroa, S.N.; Bonatti, J.P.; de Souza, D.C. Configuration and hindcast quality assessment of a Brazilian global sub-seasonal prediction system. Q. J. R. Meteorol. Soc. 2020, 146, 1067–1084. [Google Scholar] [CrossRef]
- Coelho, C.A.S.; de Souza, D.C.; Kubota, P.Y.; Cavalcanti, I.F.A.; Baker, J.C.A.; Figueroa, S.N.; Firpo, M.A.F.; Guimaraes, B.S.; Costa, S.M.S.; Gonçalves, L.J.M.; et al. Assessing the representation of South American monsoon features in Brazil and UK climate model simulations. Clim. Resil. Sustain. 2021, 1, e27. [Google Scholar]
- Guimarães, B.S.; Coelho, C.A.S.; Woolnough, S.J.; Kubota, P.Y.; Bastarz, C.F.; Figueroa, S.N.; Bonatti, J.P.; de Souza, D.C. An inter-comparison performance assessment of a Brazilian global sub-seasonal prediction model against four sub-seasonal to seasonal (S2S) prediction project models. Clim. Dyn. 2021, 56, 2359–2375. [Google Scholar] [CrossRef]
- Baker, J.C.A.; de Souza, D.C.; Kubota, P.Y.; Buermann, W.; Coelho, C.A.S.; Andrews, M.B.; Gloor, M.; Garcia-Carreras, L.; Figueroa, S.N.; Spracklen, D.V. An assessment of land–atmosphere interactions over South America using satellites, reanalysis, and two global climate models. J. Hydrometeorol. 2021, 22, 905–922. [Google Scholar] [CrossRef]
- Cavalcanti, I.F.A.; Souza, D.C.; Kubota, P.Y.; Coelho, C.A.S.; Figueroa, S.N.; Baker, J.C.A. The global monsoon system representation in BAM-v1.2 and HadGEM3 climate simulations. Int. J. Climatol. 2022, 42, 8089–8111. [Google Scholar] [CrossRef]
- Xavier, A.C.; Scanlon, B.R.; King, C.W.; Alves, A.I. New improved Brazilian daily weather gridded data (1961–2020). Int. J. Climatol. 2022, 42, 8390–8404. [Google Scholar] [CrossRef]
- Danielsom, J.; Gesch, D. Global Multi-Resolution Terrain Elevation Data 2010 (GMTED2010). USGS 2011. Available online: https://pubs.usgs.gov/of/2011/1073/pdf/of2011-1073.pdf (accessed on 20 November 2022).
- Xavier, A.C.; King, C.W.; Scanlon, B.R. Daily gridded meteorological variables in brazil (1980–2013). Int. J. Climatol. 2016, 36, 2644–2659. [Google Scholar] [CrossRef]
- Hersbach, H.; de Rosnay, P.; Bell, B.; Schepers, D.; Simmons, A.; Soci, C.; Abdalla, S.; Balmaseda, M.A.; Balsamo, G.; Bechtold, P.; et al. Operational Global Reanalysis: Progress, Future Directions and Synergies with NWP. ERA Rep. Ser. 2018, 27, 1–65. Available online: https://www.ecmwf.int/node/18765 (accessed on 20 November 2022).
- Hersbach, H.; Bell, W.; Berrisford, P.; Horányi, A.; Muñoz-Sabater, J.; Nicolas, J.; Radu, R.; Schepers, D.; Simmons, A.; Soci, C.; et al. Global reanalysis: Goodbye ERA-Interim, hello ERA5. ECMWF Newsl. 2019, 159, 17–24. [Google Scholar]
- Reynolds, R.W.; Rayner, N.A.; Smith, T.M.; Stokes, D.C.; Wang, W. An improved in situ and satellite SST analysis for climate. J. Clim. 2002, 15, 1609–1625. [Google Scholar] [CrossRef]
- Willmott, C.J.; Ackleson, S.G.; Davis, R.E.; Feddema, J.J.; Klink, K.M.; Legates, D.R.; O’Donnell, J.; Rowe, C.M. Statistics for the evaluation and comparison of models. J. Geophys. Res. 1985, 90, 8995–9005. [Google Scholar] [CrossRef]
- Morrison, H.; Pinto, J.O. Mesoscale modeling of springtime arctic mixed-phase clouds using a new two-moment bulk microphysics scheme. J. Atmos. Sci. 2005, 62, 3683–3704. [Google Scholar] [CrossRef]
- Morrison, H.; Thompson, G.; Tatarskii, V. Impact of cloud microphysics on the development of trailing stratiform precipitation in a simulated squall line: Comparison of one-and two-moment schemes. Mon. Weather Rev. 2009, 137, 991–1007. [Google Scholar] [CrossRef]
- Chou, M.; Suarez, M.J. A Solar Radiation Parameterization (CLIRAD-SW) for Atmospheric Studies; NASA Technical Memorandum, v. 10460; NASA: Washington, DC, USA, 1999.
- Tarasova, T.A.; Fomin, B.A. Solar radiation absorption due to water vapor: Advanced broadband parameterizations. J. Appl. Meteorol. 2000, 39, 1947–1951. [Google Scholar] [CrossRef]
- Chou, M.D.; Suarez, M.J.; Liang, X.Z.; Yan, M.M.; Cote, C. A Thermal Infrared Radiation Parameterization for Atmospheric Studies. NASA/TM-2001-104606 2001, Volume 19. Available online: https://ntrs.nasa.gov/citations/20010072848 (accessed on 20 November 2022).
- Bretherton, C.S.; Park, S. A new moist turbulence parameterization in the Community Atmosphere Model. J. Clim. 2009, 22, 3422–3448. [Google Scholar] [CrossRef]
- Han, J.; Pan, H. Revision of convection and vertical diffusion schemes in the NCEP global forecast system. Weather Forecast. 2011, 26, 520–533. [Google Scholar] [CrossRef]
- Yu, H.; Kaufman, Y.J.; Chin, M.; Feingold, G.; Remer, L.A.; Anderson, T.L.; Balkanski, Y.; Bellouin, N.; Boucher, O.; Christopher, S.; et al. A review of measurement-based assessments of the aerosol direct radiative effect and forcing. Atmos. Chem. Phys. 2006, 6, 613–666. [Google Scholar] [CrossRef]
- Rio, C.; Hourdin, F. A thermal plume model for the convective boundary layer: Representation of cumulus clouds. J. Atmos. Sci. 2008, 65, 407–425. [Google Scholar] [CrossRef]
- Webster, S.; Brown, A.R.; Cameron, D.R.; Jones, C.P. Improvements to the representation of orography in the Met Office Unified Model. Q. J. R. Meteorol. Soc. 2003, 129, 1989–2010. [Google Scholar] [CrossRef]
- Costa, R.L.; Gomes, H.B.; Pinto, D.D.C.; da Rocha Júnior, R.L.; dos Santos Silva, F.D.; Gomes, H.B.; da Silva, M.C.L.; Herdies, D.L. Gap Filling and Quality Control Applied to Meteorological Variables Measured in the Northeast Region of Brazil. Atmosphere 2021, 12, 1278. [Google Scholar] [CrossRef]
- Aguilar, E.; Peterson, T.C.; Obando, P.R.; Frutos, R.; Retana, J.A.; Solera, M.; Soley, J.; Garcıa, I.G.; Araujo, R.M.; Santos, A.R.; et al. Changes in precipitation and temperature extremes in Central America and northern South America, 1961–2003. J. Geophys. Res. 2005, 110, D2310. [Google Scholar] [CrossRef]
- Vincent, L.A.; Peterson, T.C.; Barros, V.R.; Marino, M.B.; Rusticucci, M.; Carrasco, G.; Ramirez, E.; Alves, L.M.; Ambrizzi, T.; Berlato, M.A.; et al. Observed trends in indices of daily temperature extremes in South America 1960–2000. J. Clim. 2005, 18, 5011–5023. [Google Scholar] [CrossRef]
- Alexander, L.V.; Zhang, X.; Peterson, T.C.; Caesar, J.; Gleason, B.; Tank, A.M.G.K.; Haylock, M.; Collins, D.; Trewin, B.; Rahimzadeh, F.; et al. Global observed changes in daily climate extremes of temperature and precipitation. J. Geophys. Res 2006, 111, D05109. [Google Scholar] [CrossRef]
- Haylock, M.R.; Peterson, T.C.; Alves, L.M.; Ambrizzi, T.; Anunciaçao, Y.M.T.; Baez, J.; Barros, V.R.; Berlato, M.A.; Bidegain, M.; Coronel, G.; et al. Trends in total and extreme South American rainfall in 1960–2000 and links with sea surface temperature. J. Clim 2006, 19, 1490–1512. [Google Scholar] [CrossRef]
- Skansi, M.; Brunet, M.; Sigro, J.; Aguilar, E.; Groening, J.A.A.; Bentancur, O.J.; Geier, Y.R.C.; Amaya, R.L.C.; Jacome, H.; Ramos, A.M.; et al. Warming and wetting signals emerging from analysis of changes in climate extreme indices over South America. Glob. Planet. Chang. 2013, 100, 295–307. [Google Scholar] [CrossRef]
- Bezerra, B.G.; Silva, L.L.; e Silva, C.M.S.; Carvalho, G.G. Changes of precipitation extremes indices in Sao Francisco River basin, Brazil from 1947 to 2012. Theor. Appl. Climatol. 2019, 135, 565–576. [Google Scholar] [CrossRef]
- Costa, R.L.; Baptista, G.M.M.; Gomes, H.B.; Silva, F.D.S.; da Rocha Júnior, R.L.; Salvador, M.A.; Herdies, D.L. Analysis of climate extremes indices over northeast Brazil from 1961 to 2014. Weather Clim. Extrem. 2020, 28, 100254. [Google Scholar] [CrossRef]
- Lima, C.I.S.; dos Santos Silva, F.D.; Freitas, I.G.F.; Pinto, D.D.C.; Costa, R.L.; Gomes, H.B.; Silva, E.H.L.; Silva, L.L.; Silva, V.P.R.; Silva, B.K.N. Método Alternativo de Zoneamento Agroclimático do Milho para o Estado de Alagoas. Rev. Bras. Meteorol. 2021, 35, 1057–1067. [Google Scholar] [CrossRef]
- Dos Santos Silva, F.D.; Costa, R.L.; da Rocha Júnior, R.L.; Gomes, H.B.; de Azevedo, P.V.; da Silva, V.d.P.R.; Monteiro, L.A. Cenários Climáticos e Produtividade do Algodão no Nordeste do Brasil. Parte II: Simulação Para 2020 a 2080. Rev. Bras. Meteorol. 2020, 35, 913–929. [Google Scholar] [CrossRef]
- Oliveira, L.P.M.; dos Santos Silva, F.D.; Costa, R.L.; da Rocha Júnior, R.L.; Barros Gomes, H.; Pereira, M.P.S.; Monteiro, L.A.; Rodrigues da Silva, V.d.P. Impacto das Mudanças Climáticas na Produtividade da Cana de Açúcar em Maceió. Rev. Bras. Meteorol. 2020, 35, 969–980. [Google Scholar] [CrossRef]
- Kane, R.P. Prediction of droughts in Northeast Brazil: Role of ENSO and use of periodicities. Int. J. Climatol. 1997, 17, 655–665. [Google Scholar] [CrossRef]
- Hastenrath, S. Circulation and teleconnection mechanisms of Northeast Brazil droughts. Prog. Oceanogr. 2006, 70, 407–415. [Google Scholar] [CrossRef]
- Shimizu, M.H.; Ambrizzi, T.; Liebmann, B. Extreme precipitation events and their relationship with ENSO and MJO phases over northern South America. Int. J. Climatol. 2017, 37, 2977–2989. [Google Scholar] [CrossRef]
- Marengo, J.A.; Alves, L.M.; Alvalá, R.C.; Cunha, A.P.; Brito, S.; Moraes, O.L. Climatic characteristics of the 2010–2016 drought in the semiarid Northeast Brazil region. An. Acad. Bras. Cienc. 2017, 90, 1973–1985. [Google Scholar] [CrossRef]
- Da Rocha Júnior, R.L.; Pinto, D.D.C.; dos Santos Silva, F.D.; Gomes, H.B.; Gomes, H.B.; Costa, R.L.; Pereira, M.P.S.; Peña, M.; dos Santos Coelho, C.A.; Herdies, D.L. An Empirical Seasonal Rainfall Forecasting Model for the Northeast Region of Brazil. Water 2021, 13, 1613. [Google Scholar] [CrossRef]
- Gomes, H.B.; da Silva, M.C.L.; Barbosa, H.d.M.J.; Ambrizzi, T.; Baltaci, H.; Gomes, H.B.; Silva, F.D.d.S.; Costa, R.L.; Figueroa, S.N.; Herdies, D.L.; et al. WRF Sensitivity for Seasonal Climate Simulations of Precipitation Fields on the CORDEX South America Domain. Atmosphere 2022, 13, 107. [Google Scholar] [CrossRef]
- Michot, V.; Vila, D.; Arvor, D.; Corpetti, T.; Ronchail, J.; Funatsu, B.M.; Dubreuil, V. Performance of TRMM TMPA 3B42 V7 in Replicating Daily Precipitation and Regional Precipitation Regimes in the Amazon Basin (1998–2013). Remote Sens. 2018, 10, 1879. [Google Scholar] [CrossRef]
- Demirtas, M.; Nance, L.; Barnardet, L.; Lin, Y.; Chuang, H.-Y.; Loughe, A.; Mahoney, J.; Gall, R.; Koch, S. The Developmental Testbed Center Verification System; WRF/MM5 Users’ Workshop; NCAR: Boulder, CO, USA, 2005.
- Rodrigues, D.T.; Silva, C.M.S.; Reis, J.S.; Palharini, R.S.A.; Júnior, J.B.C.; Silva, H.J.F.; Mutti, P.R.; Bezerra, B.G.; Gonçalves, W.A. Evaluation of the Integrated Multi-SatellitE Retrievals for the Global Precipitation Measurement (IMERG) Product in the São Francisco Basin (Brazil). Water 2021, 13, 2714. [Google Scholar] [CrossRef]
- Costa, R.L.; Gomes, H.B.; Silva, F.D.S.; Baptista, G.M.M.; da Rocha Júnior, R.L.; Herdies, R.L.; da Silva, V.P.R. Climate Change Scenarios for the Northeast Region of Brazil through the Statistical Downscaling Technique. Rev. Bras. Meteorol. 2020, 35, 785–801. [Google Scholar] [CrossRef]
- Moura, R.G.; Correia, F.W.S.; Veiga, J.A.P.; Capistrano, V.B.; Kubota, P.Y. Avaliação do Brazilian Global Atmospheric Model na Simulação dos Componentes do Balanço de Água na Bacia Amazônica. Rev. Bras. Meteorol. 2021, 36, 23–37. [Google Scholar]
- Baker, J.C.A.; Spracklen, D.V. Divergent representation of precipitation recycling in the Amazon and Congo in CMIP6 models. Geophys. Res. Lett. 2022, 49, e2021GL095136. [Google Scholar] [CrossRef] [PubMed]
Disclaimer/Publisher’s Note: The statements, opinions and data contained in all publications are solely those of the individual author(s) and contributor(s) and not of MDPI and/or the editor(s). MDPI and/or the editor(s) disclaim responsibility for any injury to people or property resulting from any ideas, methods, instructions or products referred to in the content. |
© 2023 by the authors. Licensee MDPI, Basel, Switzerland. This article is an open access article distributed under the terms and conditions of the Creative Commons Attribution (CC BY) license (https://creativecommons.org/licenses/by/4.0/).