Abstract
The aim of this research is to compare daily sunshine duration data measured using a Campbell–Stokes sunshine recorder (CS) and a CSD3 sunshine duration sensor. This was undertaken because in recent decades automatic sunshine duration sensors have been systematically replacing traditional sunshine recorder. This replacement created a problem with the data quality, and the continuity of homogeneous series. The study material consisted of the daily sunshine duration sums derived from synchronous manual and automated measurements at the Borucino station (northern Poland) for the years 2015–2021. Comparison covered the daily and monthly sums and their statistical distributions. In most cases, the daily sum recorded by the sensor CSD3 was higher than that measured by the CS. On average, higher values of sums were obtained from CSD3 for all months of the year, with the exception of June. This can be explained by the higher sensitivity threshold of the CS, as well as by the difference in height of both instruments above the station’s level. Higher daily totals recorded by the CS than by the CSD3 occurred not only in June. The cause was most likely the so-called “overburning effect”. Monthly regression equations were determined, allowing for substitution of the CS measurement results with the values recorded automatically.
1. Introduction
One of the most important physical components of the climate of a given area is solar radiation because it is one of the factors shaping the heat balance. In meteorology, it has been described for a century or even more in terms of sunshine duration [1]. In general terms, sunshine duration means the amount of time when the disk of the sun is not obscured by clouds and direct solar radiation reaches the surface of the ground. At the same time, the intensity of direct solar radiation is sufficient to cast distinct shadows as well as to activate the instrument to record a mentioned time [2,3].
Due to the effects of solar radiation, sunshine duration data is one of the main indicators for characterizing the climate of a given location [4,5,6], which is useful in various sectors, such as including health resorts [7,8], tourism [9,10,11], public health [12,13,14], and agriculture [15,16,17]. It also provides information in terms of past and present climate variability and change [18,19,20]. It can be valuable for estimating the total radiation flux at a place where no pyranometric data is available [2].
According to the World Meteorological Organization (WMO, Geneva, Switzerland), sunshine duration during a given period is defined as the time during which the direct solar radiation exceeds 120 W m−2 [5]. This definition follows from the fact that in the past it was difficult to define a precise lower limit of direct radiant flux to cause a start of measurement. It was suggested that the threshold can vary between 70 and 280 W m−2 depending on meteorological conditions. Finally, in 1981, the Commission for Instruments and Method of Observation (CIMO) of the WMO recommended a value of 120 W m−2 as the threshold [5]. The first sunshine duration recording began in Great Britain and Northern Ireland in 1880 [21,22,23]. Since then, measurements have been made at many meteorological stations using different measurement methods including manual measurement with a sunshine recorder (“burn method”), the pyrheliometric method based on the detection of the transition of direct solar radiation by pyrheliometer, and pyranometric measurements of global solar irradiance to derive the direct solar irradiance from a pyranometer [5].
Until the beginning of the 21st century, the traditional “burn method” was dominant. The Campbell–Stokes (CS) sunshine recorder has been used to provide a measurement of the duration of direct solar radiation by making a burn mark on a piece of specially treated dark card. Daily sunshine duration is read from the total burn length for a given card [4,5]. Meanwhile, another sunshine recorder, named the Jordan sunshine recorder, was introduced [6,24]. The rays of sunlight pass directly through two small apertures in the cylinder and are received onto the sensitized surface of a photographic paper placed inside. The photochemical effect of sunshine on the paper makes sunshine duration observable.
The Royal Meteorological Society (Reading, UK) conducted a comprehensive investigation and determined that the Campbell–Stokes recorder was the best instrument for measuring sunshine duration [20]. This instrument was widely adopted around the world. In 1962, the World Meteorological Organization (WMO) recommended a specific design of the Campbell-Stokes recorder, called the Interim Reference Sunshine Recorder (IRSR), as the standard for measuring sunshine duration in order to ensure consistency in data from different locations worldwide [5,25].
Since then, much progress has been made in meteorological instrumentation, especially in different types of automatic sensors, including sunshine duration measurement instruments. Moreover, because electrical power is available in an increasing number of places, automatic sunshine duration sensors have been systematically replacing Campbell–Stokes sunshine recorders [25,26]. The advantage of a traditional recorder of being self-sufficient is of decreasing importance because automated measurements do not require the daily involvement of staff to replace the card every day and to read it out. The key advantage of automated measurement procedures is to obtain more precise results on data carriers permitting direct computerized data processing [25]. On the other hand, the replacement of Campbell–Stokes recorders with automatic instruments created a problem with the data quality, comparability, and the continuity of heliographic series [26]. For any measurements, every change of instruments and measurement methods results in factors that may cause misinterpretation of the series.
Changing the measurement method of sunshine duration has a large influence on the homogeneity of the series and can lead to an inaccurate interpretation of study results; hence, may lead to the wrong conclusions about the long-term variability of a particular climate element [20,26,27]. So, because the changes in measurement methods were made, the comparison of data obtained with different instruments has received increasing attention. According to WMO requirements, there should be a long verification period of parallel measurements of at least 1 year [5]. The implementation of automated measurements did not take place simultaneously in all countries, nor in different regions of a given country. In the United Kingdom, preliminary automated measurements began to be introduced even before the year 2000. In Poland, sunshine duration measurements using automated sensors began at meteorological stations on 1 January 2014. Later, sensors were also installed at climatological stations and stations which were not a part of the Hydrological and Meteorological Measurement and Observation Network (e.g., university stations). Additionally, various types of sensors manufactured by different producers, e.g., Kipp & Zonen CHP1 Pyrheliometer [24,28], CMP11 Pyranometer [24,29], CSD1 Sunshine Duration Meter [30], CSD3 Sunshine Duration Sensor [31,32]; and Delta-T Devices SPN1 Sunshine Pyranometer [33], Huayun Sounding Meterorological Technology DFC2 [6,24], Vaisala DSU12 [6,34], Haenni Solar 111 [20,35] are used.
Given the need to maintain consistency of sunshine duration data from multiple years, and thereby the reliability of studies of the climate and its variability, since the beginning of the 21st century, work has been conducted to compare the results of measurements using the Campbell–Stokes sunshine recorder and automated sensors. These concerned various spatial and temporal ranges. In the United Kingdom, comparative measurements were performed even before the introduction of automated measurements using CSD1 automated sensors (Kipp & Zonen); however, only data from 18 selected months of 2000–2003 were used [36]. Differences have been observed, which were interpreted by the irregular operation of a traditional sunshine recorder; however, the difference in sensitivity of both types of devices was not considered. The authors showed that the CS recorder overestimated the measurement results by about 20% in the summer months and by about 7% in winter. As for the reasons, they pointed to seasonal changes in sun elevation and time with broken cloud, when the spreading of the burn on the CS recorder card can occur. Additionally, they underlined the necessity to use a large series of comparative data, which takes into account different meteorological conditions. After 2003, the number of synchronously conducted measurements increased more than twofold, and the mentioned analysis was repeated and updated based the on measurement results of daily sunshine duration at 24 British stations until 2007 [37], and then until to 2008 [38]. The first of this updated analysis showed lower differences between the two sets of results, e.g., overestimations of measurements by the CS recorder in the summer were reduced to 14%. The conversion of results of automatic measurements to traditional equivalents was further slightly improved by using daily relationships than monthly ones, a proportion of the actual sunshine duration varied from 1.5% to 3% and r-squared values for daily and monthly equations were 0.959 and 0.945, respectively. The results were implemented in a software program that automatically converted the sums of sunshine duration measured using a CSD1 sensor to their equivalent values according to traditional measurements. It was emphasized that the daily sunshine duration measurements using a Campbell–Stokes sunshine recorder were perceivably higher than the measurements made by an electronic sensor on days with variable cloud cover, especially with high intensity of solar radiation related to a high sun altitude. On the other hand, during cloudy days or with unbroken sunshine, the difference in results between the two measurements was minor.
From the early years of the 21st century, Poland’s first comparisons of sunshine duration measurements using traditional and automated methods were taken [39] the results of sunshine duration measurements conducted synchronously in 2002 using a Campbell–Stokes sunshine recorder and a DSU12 sensor (from manufacturer Vaisala, Vantaa, Finland) at the Koniczynka station located in the Chełmno–Dobrzyn Lakeland (north Poland) were compared. Significant differences in the readings of both instruments were observed (e.g., in July on average 1.9 h per day) due to an excessively high sensitivity of the automatic sensor; therefore, the settings of this device were adjusted and analogous tests were conducted in relation to a five-year period of 2006–2010 [34]. Differences in results were still found, although they became smaller (e.g., in July 0.76 h per day on average).
As the data became available, comparisons were made of the results of increasingly longer synchronous measurement series in various locations. Based on results at the Hradec Kralove station in the Czech Republic in 2001–2006, a breach of the uniformity in the series of sunshine duration measurements was observed after the implementation of automated sensors [40]. The studies of [26,41] have also shown that replacing traditional sunshine recorders with electronic sensors without conducting comparative studies may suggest an increase in sunshine duration and lead to an erroneous interpretation of temporal and spatial analyses results. At some meteorological stations in Poland, replacing the traditional recorder with electronic sensor could lead to an overestimation of annual sunshine duration by about 600 to 855 h. Difficulties were observed in interpreting the differences between values of sunshine duration measured using a sunshine recorder and a CSD3 sensor, which are a result of different measurement methods and a faster reaction of the electronic sensor to the inflow of solar radiation, especially several minutes after sunrise and before sunset, and in momentary exposure of the solar disk by clouds on overcast days [26]. A comparison of sunshine recorder and CSD1 sensor measurements from a regional perspective at seven stations in south-west Poland in the years 2009–2010 has shown both positive (of 3 to 26 h depending on station) and negative (of 1 to 35 h, respectively) differences in the monthly and yearly sunshine duration sums, without a specific pattern of occurrence [42]. The highest correspondence of measurements there was revealed in winter months. Both positive and negative differences were revealed by the comparison of 10-year synchronous measurement results using a Campbell–Stokes sunshine recorder and two automated sensors (the Kipp & Zonen CSD2 and Haenni Solar 111b from manufacturer Kroneis, Austria) conducted in the years 2007–2016 at the Kanzelhöhe Observatory (Austria) [20]. A study conducted by [27] compared measurements of sunshine duration taken using a CS sunshine recorder with those taken using two automated sensors, SONIe and its improved version, SCAPP (manufactured by Siggelkow, Offenburg, Germany), at 13 stations representing all of Germany’s climate regions. Similarly, to prior works, summer months showed higher (up to 1.4 h) daily values of sunshine duration measured with the sunshine recorder compared to those registered by sensors, which was caused by the so-called “overburning effect” which occurs during the temporary concealment of the sun by a cloud.
All hitherto works comparing the results of sunshine recorder and automated measurements underline the differences in results. However, taking into account that since the beginning of the 21st century, the only sunshine duration data are the results of traditional measurements, such comparisons nevertheless allow the use of long series of data for the purpose of climate variability studies. The number of such studies seems inconsiderable compared to the potential demand, both in a temporal perspective, and in relation to the variety of regions. Additionally, only several years ago attention was drawn to the fact that not all databases provide accurate information concerning changes in sunshine duration measurement methods [26]. This study aims to compare the sunshine duration measured using a Campbell–Stokes sunshine recorder and the CSD3 automated sensor (Kipp & Zonen) at the Limnological Station of the University of Gdańsk in Borucino, located in Cassubian Lakeland (north-western Poland) during the years 2015–2021. It will allow the use of over 60-year-long series of sunshine duration data.
2. Materials and Methods
The station from which the measurement data originated is located in northern Poland, in the central part of the Cassubian Lakeland, the highest area of the Pomeranian Lakeland, at an altitude of 163 m above mean sea level. The geographical coordinates of the station are latitude 54°15′ N, longitude 17°59′ E (Figure 1).
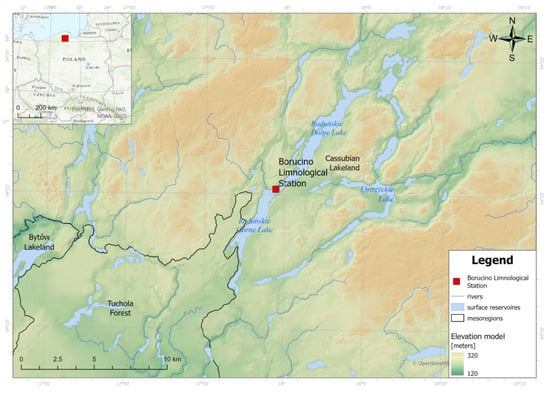
Figure 1.
Location of Borucino Limnological Station.
It represents a young glacial area with a varied topographical relief, whose characteristic forms are to a significant extent covered with forests. A distinctive feature of the area is the presence of numerous lakes and significant forestation. The measurement station is located directly by the ribbon of Lake Raduńskie Górne, which runs from the northeast to southwest, and is surrounded by forests reaching heights of up to 20 m above the lake’s surface. There is a road, residential buildings, and solitary trees at the station’s direct vicinity. The station was established in 1960 and sunshine duration measurements have been conducted there since 1 January 1961, according to standards applicable at the state measurement and observation network of Institute of Meteorology and Water Management National Research Institute (IMWM NRI, Warsaw, Poland). Since 2004, the station has also featured a meteorological climatological station. Until August 2014, the station conducted sunshine duration measurements only through the traditional method using a Campbell–Stokes sunshine recorder located at a height of 3.63 m from the ground (Figure 2).
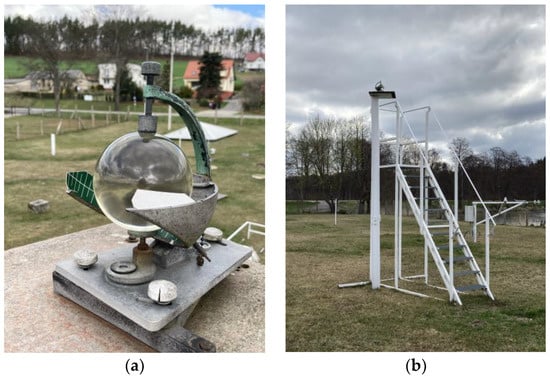
Figure 2.
Campbell–Stokes sunshine recorder (a) and its tower (b) at the Borucino Limnological Station.
From September 2014 until the end of 2021, the station has also conducted parallel measurements using the sunshine recorder and a CSD3 sensor (Kipp & Zonen) which was installed on a tower at a height of 15 m from the ground (Figure 3).
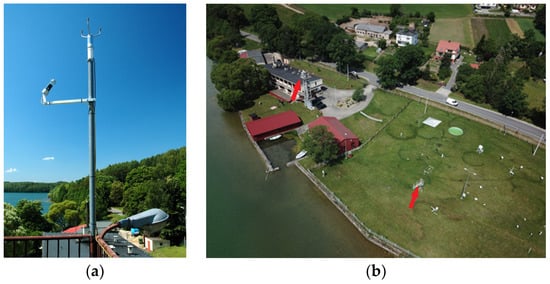
Figure 3.
CSD3 sensor (a) and location of both measurement instruments (b) at the Borucino Limnological Station.
Both of these instruments were 10 m away from one another. The technical parameters of both instruments are described in detail in the relevant literature e.g., [5,6,20,22,23,31,32,41]. The Campbell–Stokes recorder, in accordance with WMO requirements, consisted of a 10 cm diameter sphere made of transparent glass with a metal levelling frame placed behind the sphere, card holder, and recording card of a good quality paper. CSD3 sunshine duration sensor measures sunshine duration through a high-quality glass tube and uses three photo-diodes with a spectral response range from 400 to 1100 nm. One measures the total radiation while the other two measure scattered radiation. The device needs a few microseconds response time, the operational temperature range is from −40 °C to +70 °C and it is equipped with built-in heating to dissipate rain, snow, and frost. The fundamental difference is the sensitivity threshold of both instruments, that being 279.2 W m−2 for the Campbell–Stokes sunshine recorder and 120 W m−2 for the CSD3 automated sensor. The Campbell–Stokes recorder was actuated by the thermal energy of solar radiation but the whole process of obtaining results relied on manual operation. Results of sunshine duration measurements were affected by a high subjectivity during analyzing the card and digitalization of measurements results. The CSD3 sensor has a measurement uncertainty of less than 10%. During a 60-year period of measurements in Borucino, the CS recorder was used with the measurement standards required by the WMO and was operated by two experienced and meticulous observers. The sphere of the recorder was cleaned every day just after sunset. However, there might have been cases related to errors in the use of the device, especially due to the absence of a constant, highly experienced observer. Rare cases of incorrect maintenance of the recorder and individual errors during data digitization cannot be ruled out either. However, it is impossible to identify such errors because they were not recorded in the database. The CSD3 device was usually inspected and cleaned weekly.
One of the factors modifying the sunshine duration at the measurement location is the topographical relief and the vicinity of forests that obscure the horizon at low solar elevations. Apart from natural environmental elements, the horizon is also obscured by man-made objects. In the case of both instruments, this was the brick and mortar station building, and for the CS sunshine recorder, also the meteorological tower. Throughout most of the year, the time of covering the horizon at the place of installation of the CS is longer by several minutes than in the case of CSD3. In December, on the shortest days of the year, the possible sunshine duration differs by about 10 min between these places. In March and September, on the days of the equinoxes, the difference is about 25 min. On the longest days in June, possible sunshine duration at the CS recorder site is about 2 min longer than at the place of installation of CSD3. However, the longest periods of obscuring the horizon for the CS sunshine recorder did not exceed 1 h 47 min (March 21 and September 23) and for the CSD3 sensor 1 h 32 min (June 22).
The study material consisted of the daily sunshine duration sums derived from manual and automated measurements for the years 2015–2021. During the analyzed period, there were data shortages from automated measurements, in total, encompassing 6.6% of all days. For that reason, the comparative analysis only includes synchronous data from both instruments.
Comparison covered the daily and monthly sums and their statistical distributions. Based on the daily sums from manual measurements during the synchronous period, a regression equations were determined, allowing to correlate the sunshine recorder measurement results with the values recorded automatically. The equations served as a basis for reconstructing a series of sunshine duration measurements for the thirty-year period of 1991–2020.
3. Results
3.1. Comparison of Measurement Results of Actual Sunshine Duration Measured Using a Campbell–Stokes Sunshine Recorder and a CSD3 Sensor
A difference has been determined between the daily sums measured using the CSD3 sensor and the Campbell–Stokes sunshine recorder. The average daily difference between automated and manual measurements determined based on synchronous data from the years 2015–2020 is 0.28 h, which is approximately 17 min. In the time-runs of differences, a characteristic variability emerges: positive differences are characteristic for the cold half-year, from September to March, whereas in the warm half-year, the actual sunlight duration value measured manually is in many cases higher than the one measured automatically (Figure 4). The maximum positive difference reached a value of 10.4 h (9 August 2017), whereas the lowest difference reached −4.1 h (24 September 2021).
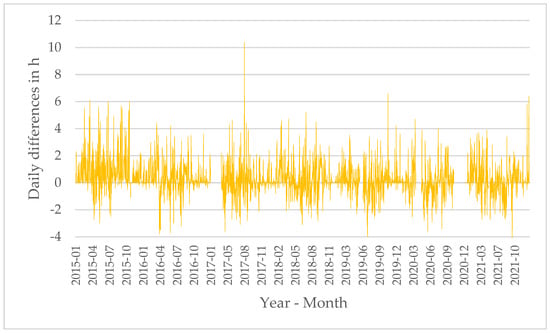
Figure 4.
Differences in daily sunshine duration (automatic minus manual measurements) in Borucino, 2015–2021.
The higher average daily actual sunshine duration values measured automatically are reflected in the difference distribution, characterized by left-handed (negative) asymmetry (Figure 5). Approximately 24% of all automated and manual measurements show exactly the same values whereas approximately 55% of differences were not higher than 0.5 h. The frequencies of positive differences are higher than the frequencies of negative differences in all four analyzed ranges of daily actual sunshine duration sums.
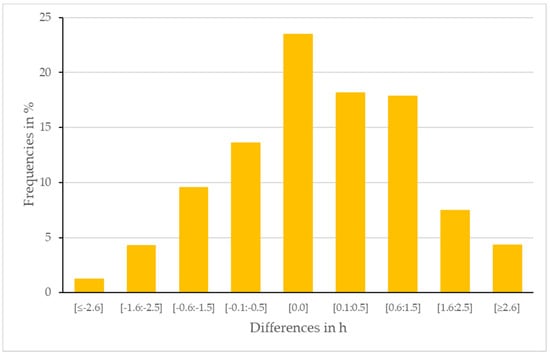
Figure 5.
The distribution of differences in daily sunshine duration (automatic minus manual observations) in hours in Borucino, 2015–2021.
From October to February, over 50% of differences were those not exceeding 0.5 h. The largest number of such instances of differences occurred in November, December, and January, respectively, 83.0, 86.0, and 83.0% (Table 1).

Table 1.
Monthly frequency of daily differences in sunshine duration from manual and automatic measurements in Borucino, 2015–2021.
The average daily sums of actual sunshine duration measured automatically are higher than those measured manually (5.0 and 4.7 h, respectively), and are characterized by a slightly lower dispersion of values (standard deviation of 4.5 and 4.6 h, respectively) (Table 2). The maximum daily sum of sunshine duration recorded using the CSD3 sensor reached the value of 15.3 h and was 0.3 h lower than the one measured using the Campbell–Stokes sunshine recorder. Both distributions are characterized by moderate, right-handed (positive) asymmetry and flattening (negative kurtosis values). Despite the listed differences in primary distribution characteristics, an analysis of both distributions using the Kolmogorov–Smirnov test has shown their correspondence is at the significance level of 0.05.

Table 2.
Selected statistics of daily sunshine duration in Borucino, 2015–2021.
The average annual actual sunshine duration sum determined based on synchronous CS recorder measurement data reached a value of 1571.4 h and was lower than the one measured using the CSD3 sensor by 233.2 h (Table 3). There is a difference in average daily sunshine duration sums by 0.3 h (4.3 h according to CS recorder measurements against 4.6 h according to CSD3 sensor measurements).

Table 3.
Comparison of average monthly and annual sunshine duration recorded with the Campbell–Stokes recorder (CS) and the CSD3 sensor in Borucino, 2015–2021 (based on synchronous data).
The average higher value of sums was obtained from CSD3 sensor measurements in all months of the year, except June, when the actual monthly sunshine duration sum measured using that sensor was 1 h higher than the one measured using the CS recorder. Especially high differences between sunshine duration measured using both instruments occurred at the end of winter and in early spring, as well as autumn months. In the average actual daily sunshine duration sums, these differences reached 0.7 h in February and March and 0.5 h in September and October, respectively. Expressed as a percentage, the relation of differences between actual monthly sunshine duration sums measured using the CSD3 sensor and CS recorder to the average actual daily sunshine duration sum measured using the sunshine recorder is especially high during the period from October to March, reaching a value of 17.8% in October and up to 38.0% in December. Therefore, in the cold half-year, the CS recorder sunshine duration measurements are clearly understated. The biggest positive difference between results of both measurements reached a value of 10.4 h and was identified on 9 August 2017. In addition to the influence of the sensitivity threshold of the instruments, there must have been another factor; probably an error during data digitization was the reason of such huge difference. On the day preceding this case and on the following day, there were no such large differences despite similar cloud cover at 06:00, 12:00 and 18:00 UTC. This may suggest the aforementioned error in the recording of results, perhaps an incorrect maintenance of the CS recorder.
3.2. Reconstruction of Sunshine Duration in Borucino for the Period 1991–2020
The CS recorder sunshine duration measurements in Borucino concluded with the end of 2021. Considering the definition of sunshine duration by WMO, it was decided to reconstruct the sunshine duration values measured using a Campbell–Stokes sunshine recorder to values measured using a modern CSD3 sensor. For that purpose, monthly regression equations were constructed to determine the CSD3 daily sunshine duration sums for the period 1991–2020 based on the values recorded by the CS recorder (Table 4, Figure 6).

Table 4.
Regression equations to reconstruct a multi-year sunshine duration for CSD3 (y) on the base of CS measurements (x) in Borucino, 2015–2021.
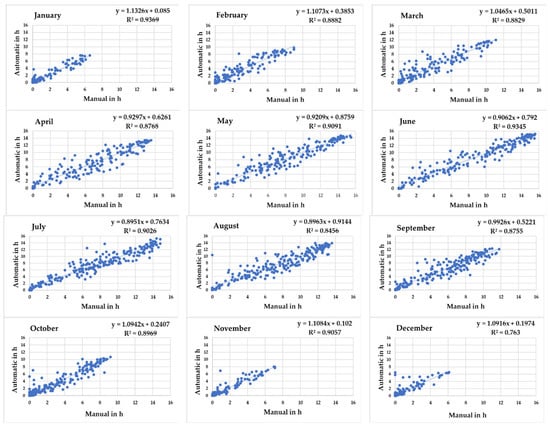
Figure 6.
Scatterplots of relationship between manual and reconstructed measurements of daily sunshine duration in Borucino, 2015–2021.
The determination ratios from 0.85 to 0.94 indicate a high correlation between actual sunshine duration measured using the CS recorder and CSD3. The developed regression models allow for satisfactory substitution of a series of manual measurements with a reconstructed series. The best results of regression model matching were obtained for January, May, June, July, August, and November. It should be noted that the application of regression equations to reconstruct a multi-year measurement session in the case of the lowest sunshine duration values (0.0 to 1.0 h) may lead to its overstatement in situations of complete cloud cover when the CSD3 sensor in reality does not register any incoming direct radiation.
The reconstructed multi-year series of annual sunshine duration sums in the years 1991–2020 is characterized by an average value 110.6 h higher than the one determined based on CS sunshine recorder measurements, but the nature of the multi-year variability of both series is consistent (Figure 7). Both series are characterized by a positive trend at the level of 50 h per decade, which is not statistically significant.
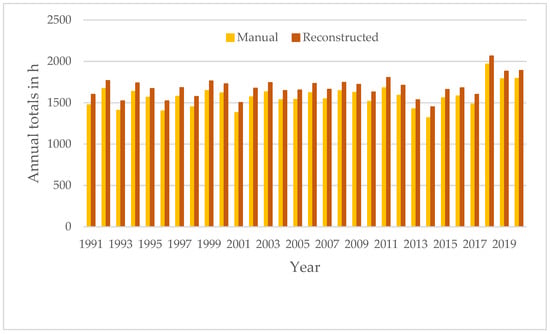
Figure 7.
Manual and reconstructed multi-year series of annual sunshine duration sums in Borucino, 1991–2020.
Comparison of mean monthly sunshine duration totals measured by CS and reconstructed reveals higher monthly sums reconstructed in the period from August to May (Figure 8). These differences vary from 6 h in April and August to 20 h in March. In June and July, the measured and reconstructed totals of sunshine have a very similar value, with the difference of 0.2 h in July. The annual course of these values clearly reflects differences in average monthly totals of sunshine duration between previously analyzed synchronous series for the years 2015–2021.
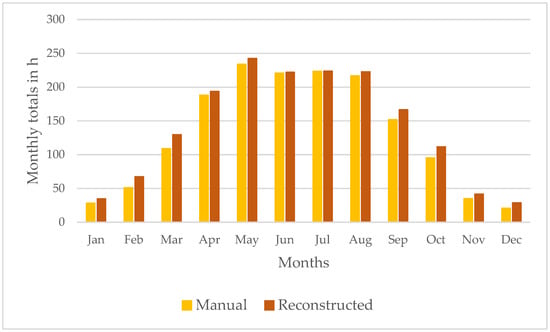
Figure 8.
Measured and reconstructed monthly totals of sunshine duration in Borucino, 1991–2020.
3.3. Comparison of Measurement Results of Actual Sunshine Duration Measured Using a Campbell–Stokes Sunshine Recorder and a CSD3 Sensor under Various Cloud Cover
All cases of sunshine duration measures over the analyzed period were classified into four categories of cloud cover, inspired by the scheme used by [24]. Categories were defined on the base of the criteria of WMO, European Climate Assessment and Dataset (ECA & C), and National Weather Service (NWS): clear sky (N = 0 oct.), mostly sunny, incl. clear sky (N ≤ 2), partly cloudy (2 < N ≤ 5), cloudy (5 < N ≤ 7), and overcast (N = 8). Statistical characteristics were selected to compare the differences between the daily sums measured using the CSD3 sensor and the Campbell–Stokes sunshine recorder under various class of daily cloud cover, namely: mean difference (MD) between daily sunshine duration recorded with both instruments, the root-mean-square deviation (RMSD) acc. to formula given below, and correlation coefficient (r).
where:
- CSDi: the ith sunshine duration recorded with the CSD sensor;
- CSi: the ith sunshine duration recorded with the Campbell–Stokes recorder;
- n: number of cases.
The average daily sums of actual sunshine duration are higher when cloud cover is lower. The values recorded by CS recorder were 10.3 h under the clear sky conditions, 6.9 h when there was “partly cloudy” category and only 0.2 h when the sky was overcast. The values recorded by CSD sensor were 11.2 h, 7.2 h, and 0.3 h, respectively (Table 5). In general, the average daily sums of actual sunshine duration measured automatically are higher than those measured by CS recorder. It confirms the influence of a lower sensitivity threshold of the CS recorder than automatic sensor. The mean difference varied from 0.1 under overcast sky to 0.9 h under the clear sky. The RMSD equaled 0.5 h and 1.4 h, respectively. The correlation coefficients ratios from 0.81 to 0.97 indicate a high correlation between actual sunshine duration measured using the CS recorder and CSD3 under a various observed cloud cover category. The mean difference is the same for “mostly sunny” and “cloudy” conditions, but the series are better correlated in the case of “mostly sunny” category.

Table 5.
Comparison of sunshine duration recorded with the Campbell–Stokes recorder (CS) and the CSD3 sensor in Borucino under various cloud cover, 2015–2021 (based on synchronous data).
On both instruments, the closest sunshine duration values are measured in “sky clear” and “mostly sunny” conditions (Figure 9). The coefficients of determination for the regression function in these cases reach the values of 0.93 and 0.86, respectively. An increase in cloud cover causes an increase in the sunshine duration differences recorded by both devices. The coefficients of determination for the regression equations in “partly cloudy” and “cloudy” conditions are 0.80 and 0.74, respectively. The greatest discrepancies in the measurements of both devices are recorded when the sky is completely covered by clouds (“overcast” conditions). The coefficient of determination in this case is 0.66, and the sunshine duration measured by the CSD3 sensor is almost half lower than that indicated by the CS recorder. Similar differences in sunshine duration measurements under different cloud cover conditions were obtained by [24].
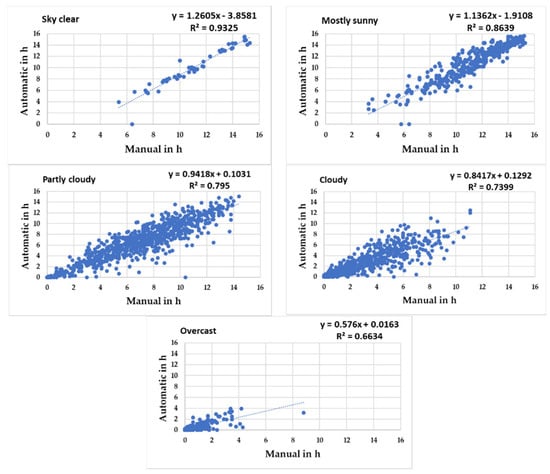
Figure 9.
Scatterplots of daily sunshine duration recorded by the Campbell–Stokes recorder and by CSD3 sensor in Borucino under various cloud cover, 2015–2021.
The largest frequency of negative differences was under “partly cloudy” conditions, approximately 41% (Table 6). Under “mostly sunny”, “cloudy” and “overcast” conditions were approximately 35, 31, and 6%, respectively. This could be caused by the influence of the presence of clouds which cover and expose the solar disk in quick succession, so the cloud cover is broken. A Campbell–Stokes sunshine recorder will continue the burning of a trace on the card and overestimates the sunshine duration. This occurs mostly when the sun elevation is high [36]. Negative differences occur, as were noticed, mostly in summer months, when the sun elevation is high. This effect does not occur under “clear sky” conditions as well when sky is overcast. The negative daily difference frequency under these conditions was 12 and 6%, respectively.

Table 6.
Frequency [%] of daily differences in sunshine duration from manual and automatic measurements in various under various cloud cover in Borucino, 2015–2021.
The highest negative differences in daily sunshine duration measured by both instruments exceeded the value of 3 h. The analysis of selected cases confirms the possibility of “overburning effect” due to changing clouds. On 3 July 2019 the difference between measurements was 4.0 h. Cloud cover on this day noticed at 06:00, 12:00, and 18:00 UTC was 6, 6, and 2 oct., respectively. Additionally, relatively high air temperature (daily mean 14.5 °C) and low air humidity (daily mean relative humidity 55%) were favorable to this effect. During such conditions, the process of burning begins easier than in wetter surrounding air. A similar case occurred on 6 June 2020 when the negative difference was 3.6 h, cloud cover at 06:00, 12:00, and 18:00 UTC, was 3, 6, and 1 oct., respectively, and mean daily air temperature reached 13.5 °C and mean daily relative humidity was 58%.
An attempt was made to check the influence of several factors, other than cloudiness. Correlations between differences in daily sums measured using automatic sensor and the Campbell–Stokes sunshine recorder (the dependent variable) and the independent variables of mean daily air temperature, mean daily relative humidity, and the solar elevation at noon were analyzed. The obtained results indicate that the difference in daily sunshine duration decreases with increasing solar elevation at noon; however, the correlation coefficient was 0.10. Probably, this correlation would be higher if only the sunshine duration from noon hours were taken into account. Low negative correlations between analyzed differences and mean daily air temperature were shown (correlation coefficient was −0.08). It can only suggest that the difference in daily sunshine duration increases with decreasing of air temperature. No relationship between differences in daily sunshine duration and mean daily relative humidity were detected. The multiple correlation coefficient between the dependent variable and independent meteorological variables was 0.10, so these relationships are weak. Nonetheless, it was mentioned in the literature that in cold and damp conditions, more energy is required to burn a trace in the card of the CS recorder than when it is warm and dry [36]. Under conditions favorable to the occurrence of dew or hoarfrost, there may be instances of covering of the sunshine recorder’s sphere, which may contribute to the reduction or temporary cessation of radiation recording by this instrument. In addition, the change of the heliograph strap took place after sunset, so even cleaning the sphere when changing the card would not eliminate the impact of possible sediment on the sphere. Therefore, the results of sunshine recorder readings are underestimated in relation to automated recording. Such a case could have occurred on 27 December 2021, when the positive difference was 6.4 h, the average daily air temperature was −7 °C and the average daily relative humidity was 79%. There could then be a deposit on the Campbell–Stokes recorder’s sphere.
4. Discussion and Conclusions
The study compares the sunshine duration values obtained from the measurements conducted synchronously with the Campbell–Stokes sunshine recorder and the automatic CSD3 sensor in the period 2015–2021. It has been shown that there are differences between the sunshine duration values recorded by both instruments, which can be positive or negative. Similar differences were demonstrated in previous comparative studies performed by measuring stations at different locations.
In most cases, the daily sum recorded by the sensor was higher than that measured by the sunshine recorder. The cause usually is a lower sensitivity threshold of the automated sensor, which records direct solar radiation at low sun altitudes (e.g., just after sunrise or before sunset) and even when the solar disk is temporarily covered by fast-moving clouds. This effect was described in the literature [26,41], and occurs particularly in the spring and summer months in clear weather, whereas in late autumn and winter in layered cloud cover, with the sun at a low altitude, the sunshine recorder may not register the inflow of radiation at all. In addition, there may be instances of frosting of the sunshine recorder’s sphere, which may contribute to the reduction or temporary cessation of radiation recording by this instrument. Temporary soiling of both instruments is also possible due to the presence of pollutants in the air, especially in winter, when there are increased emissions due to combustion in the municipal sector. However, the station is located in an extremely sparsely populated area with only two small farms (less than ten residents altogether) located north of the station, while the dominant wind direction is south-west. In the case of the analyzed station in Borucino, another significant factor is the difference in height of both instruments above the station’s level, which was about 11 m, resulting in a longer time of obscuring the horizon of the CS sunshine recorder. Another factor that cannot be ruled out is a different method of handling and interpreting the sunshine recorder readings by different observers.
Despite the proven overall predominance of the sunshine duration value measured automatically over the traditional recording results, the situation was reversed in at least several percent of the cases in each month. This occurred primarily in the summer, most often in June. The cause was most likely the so-called “overburning effect” [22,26,36,38], which consists of the fact that the burning of a trace on the sunshine recorder strip also takes place when the solar disk suddenly becomes obscured by a rapidly moving cloud. It was found that this effect is at its highest intensity in the presence of Cumulus congestus clouds, which cover and expose the solar disk in quick succession [26]. At the same time, automated sensors have a quick reaction to any change in the radiation inflow caused by obscuring and exposing of the solar disk by clouds. In effect, the results of sunshine recorder readings are overstated in relation to automated recording. Sunshine duration recording by the CSD3 automatic sensor can also be stopped by a significant reduction in the inflow of direct radiation and the intensity of diffuse radiation by Altostratus and Cirrostratus clouds [26]. The sunshine recorder, unlike the CSD3 sensor, then reacts to diffuse radiation, which results in sunshine duration registration. Interestingly, cases of higher daily sunshine duration values recorded by the sunshine recorder constituted the majority of results described in Germany from the comparison of sunshine recorders and automated measurements carried out at 13 stations [27].
The distribution of daily differences indicates that in 55% of all analyzed cases, the daily totals did not differ by more than 0.5 h. This is only 3% less than was demonstrated in previous comparative studies carried out in the vicinity of Torun, in the northern part of central Poland, in the lowland area [34], and 1% less compared with Krakow in southern Poland, at a station located within the city [26]. An even higher (60–64%) share of differences in this range of values was demonstrated at five synoptic stations located in southern Poland [42]. For comparison, the results of other studies from southern Austria indicate that the share of such differences was 42%, whereas in Germany, at 13 stations over, 30% of all synchronous daily sunshine duration measurements showed no differences [27].
Autumn and winter months were the most consistent during that period, with differences occurring in over 85% of cases. A similar consistency was demonstrated in the aforementioned studies [34], although a different type of automated sensor was used in the vicinity of Torun. This confirms the effect of significant cloud cover on sunshine duration recorded during this period of the year. For example, at the nearest synoptic station in Chojnice (number according to WMO: 12235) in December, there are 21 cloudy days on average, i.e., with at least 6.4 oct. (IMWM NRI climatic standards 1991–2020). High cloud cover inhibits the inflow of solar radiation, which affects the interruption of both traditional and automated recording of sunlight, and thus, the readings of both instruments show no differences. In turn, the lack of these differences in the summer months can be explained by more frequent cloudless conditions, favoring direct, high-intensity radiation inflow and undisturbed recording of sunshine duration by both instruments. The annual course of the largest differences, exceeding 2.5 h, is closer to the results obtained in Kraków than in Torun, which may arise from the use of a different automated device type. It should also be noted that the comparability of various analyses is also impacted by different measurement point locations and the time range of comparative studies. Most of the earlier studies covered a period from around the mid-2000s, whereas for this study, the research period started in 2015.
In the analyzed period (2015–2021), the average annual sunshine duration sum recorded by the CSD3 sensor was 15% higher than that recorded by the daily sunshine recorder. This difference is greater in relation to previous results, closer to the difference shown in Krakow of 10.4% [26] than in the vicinity of Torun, where it was only about 3% [34]. However, in the latter study, as already mentioned, a different automated sensor than CSD3 was used. Considering the differences in the compared monthly averages in relation to sunshine recorder-based results, the results are consistent with the ones obtained in Krakow using the same instrument [26], because in all months the results of CSD3 sensor records were higher than those obtained with the sunshine recorder, and the largest differences occurred in late autumn and winter (by more than 20%). Moreso, in the vicinity of Torun, the absolute differences were greatest during this period [34], but there were greater values obtained from measurements using a traditional sunshine recorder. The variability on a monthly scale can be explained by different absolute sunshine duration values in individual months, conditioned astronomically, and by the cloud cover variability on individual days of a given month, which may differ regionally and locally. The station in Borucino is located on an area with a wide range of local climate factors, primarily terrain, which means that the results of sunshine duration measurements will never fully reflect the actual local diversity of this element.
The analysis of the differences in the sunshine duration measurements made by CS-recorder and CSD3 sensor under different cloud cover conditions showed that the most similar results were obtained in “sky clear” or “mostly sunny” conditions, with the sunshine duration measured with the CSD3 sensor being higher than with the CS recorder. This is mainly due to the lower sensitivity threshold of this device. The increase in cloudiness meant that the Campbell–Stokes recorder more often than the CSD3 sensor showed a higher daily sunshine duration. Similar differences in sunshine duration measurements under different cloud cover conditions were obtained by [24,43].
An attempt to explain the differences in sunshine duration measurements between the two devices by atmospheric factors was unsuccessful. The relationships between the differences in measurements and mean daily air temperature, mean daily relative humidity, and the solar elevation at noon turned out to be weak and statistically insignificant, except for mean daily relative humidity. In this case, the increase in air humidity causes a decrease in the differences, which results from delays in starting the recording of the trace on the CS recorder strip due to the moisturizing of the heliograph card. Such cases were described by [24]. The regression equations constructed separately for each month were used to compare the sunshine duration values recorded by the CS sunshine recorder to the values registered by the CSD3 sensor. Except December, the determination coefficients are greater than 0.8 and correspond to the results from the analogous procedure conducted in Krakow. The highest simultaneous correspondence in both locations were shown by the series in May, June, July, and November, with the lowest in December. Unfortunately, they have limitations because of the absence of sunshine duration recording by both instruments, most often taking place with complete cloud cover by Altostratus, Stratocumulus, or Stratus opacus [26]; therefore, the daily sums of sunlight will be overstated. In the case of the Borucino station, the dates of such meteorological conditions cannot be determined due to the lack of observation of component cloud cover or the form of clouds. Therefore, we can only cite valuable interpretations of the results of prior research.
Revealed long-term changes of annual sunshine duration totals are consistent with findings concerning the long-term variability of the Polish climate. Sunshine duration is an element of the climate that exhibits positive trends over many years [18]. From the late 1980’s a trend rising at a rate of 30 to 130 h per 10 years has been observed, depending on the region, whereas at the synoptic station in Chojnice, this trend was estimated at 78 h per decade [19]. Considering that in the period before 2015 there is no data from the research area other than those from records using traditional methods, it is possible, bearing in mind the demonstrated differences, to use the reconstructed series to study the climate variability of northern Poland.
Currently, the development of satellite techniques makes it possible to compare ground measurement values of most meteorological elements, including sunshine duration [44,45,46]. This significantly broadens the scope of climate variability analyses. Nevertheless, in our opinion, comparative analyses carried out at as many measuring stations as possible are still needed.
Author Contributions
Conceptualization. M.O. and M.M.; methodology. M.O.; software. M.O.; validation. M.O. and M.M.; formal analysis. M.O.; investigation. M.O. and M.M.; resources M.O.; data curation M.O. and M.M.; writing—original draft preparation M.O. and M.M.; writing—review and editing M.O. and M.M.; visualization M.M.; supervision. M.O. All authors have read and agreed to the published version of the manuscript.
Funding
This research received no external funding.
Institutional Review Board Statement
Not applicable.
Informed Consent Statement
Not applicable.
Data Availability Statement
The data used in this paper come from the Meteorological Data Base of the Department of Meteorology and Climatology, University of Gdansk and are not publicly available.
Acknowledgments
The authors would like to thank Alicja Olszewska for sharing her own drone photo of Borucino Limnological Station.
Conflicts of Interest
The authors declare no conflict of interest.
References
- World Meteorological Organization. Instruments and observing methods report 16. In Comparison of Pyranometers and Electronic Sunshine Duration Recorders of RA VI, Budapest, July–December 1984; WMO/TD No.146; WMO: Geneva, Switzerland, 1986; pp. 1–4. Available online: https://library.wmo.int/index.php?lvl=notice_display&id=15513#.Y5jG54SZOMq (accessed on 30 November 2022).
- Ikeda, H.; Aoshima, T.; Miyake, Y. Development of a new sunshine-duration meter. J. Meteorol. Soc. Jpn. Ser. II 1986, 64, 987–992. [Google Scholar] [CrossRef]
- World Meteorological Organization. International Meteorological Vocabulary; WMO/OMM/BMO-No.182; WMO: Geneva, Switzerland, 1992; p. 296. Available online: https://library.wmo.int/?lvl=notice_display&id=220#.Y5jQJoSZOMo (accessed on 30 November 2022).
- Sanchez-Romero, A.; Gonzalez, J.A.; Calbó, J.; Sánchez-Lorenzo, A. Using digital image processing to characterize the Campbell-Stokes sunshine recorder and to derive high-temporal resolution direct solar irradiance. Atmos. Meas. Tech. 2015, 8, 183–194. [Google Scholar] [CrossRef]
- World Meteorological Organization. Guide to Instruments and Methods of Observation. Volume I Measurements of Meteorological Variables; WMO-No 8; WMO: Geneva, Switzerland, 2021; pp. 308–323. Available online: https://library.wmo.int/index.php?id=12407&lvl=notice_display#.Y5js8YSZOMo (accessed on 30 November 2022).
- Wang, Y.; Zhang, G.; Sun, G.; Liu, S.; Xu, D.; Yang, S.; Wu, L. A review on sunshine recorders: Evolution of operation principle and construction. Measurement 2021, 186, 110138. [Google Scholar] [CrossRef]
- Kuchcik, M.; Błażejczyk, K.; Szmyd, J.; Milewski, P.; Błażejczyk, A.; Baranowski, J. Potencjał Leczniczy Klimatu Polski (The Therapeutic Potential of Polish Climate); Wydawnictwo Akademickie SEDNO; Instytut Geografii i Przestrzennego Zagospodarowania PAN: Warsaw, Poland, 2013; pp. 1–272. Available online: https://www.rcin.org.pl/igipz/dlibra/publication/edition/56052?id=56052 (accessed on 5 December 2022). (In Polish)
- Szatten, D.; Więcław, M. Solar climate features taking into account the morphometric conditions of the area and the possibility of using them in heliotherapy on the example of the Cieplice and Kołobrzeg health resorts (Poland). Atmosphere 2021, 12, 383. [Google Scholar] [CrossRef]
- Mieczkowski, Z. The tourism climatic index: A method of evaluating world climates for tourism. Can. Geogr. 1985, 29, 220–233. [Google Scholar] [CrossRef]
- de Freitas, C.R.; Scott, D.; McBoyle, G. A second-generation climate index for tourism (CIT): Specification and verification. Int. J. Biometeorol. 2008, 52, 399–407. [Google Scholar] [CrossRef]
- Bae, J.; Nam, S. An analysis of the effect of climate indicators on tourism demand: A case study of Jeju Island. J. Policy Res. Tour. Leis. Events 2020, 12, 185–196. [Google Scholar] [CrossRef]
- Min, C.-Y.; Yoo, D.-M.; Choi, H.-G. Associations between physical activity, sunshine duration and osteoporosis according to obesity and other lifestyle factors: A nested case–control study. Int. J. Environ. Res. Public Health 2021, 18, 4437. [Google Scholar] [CrossRef]
- Thangariyal, S.; Rastogi, A.; Tomar, A.; Bhadoria, A.S.; Baweja, S. Impact of temperature and sunshine duration on daily new cases and death due to COVID-19. J. Fam. Med. Prim. Care 2020, 9, 6091–6101. [Google Scholar]
- Ji, Y.; Chen, C.; Xu, G.; Song, J.; Su, H.; Wang, H. Effects of sunshine duration on daily outpatient visits for depression in Suzhou, Anhui Province, China. Environ. Sci. Pollut. Res. 2023, 30, 2075–2085. [Google Scholar] [CrossRef] [PubMed]
- Nishio, Z.; Uchikawa, O.; Hideshima, Y.; Nishioka, H.; Mihara, M.; Nakamura, K.; Matsunaka, H.; Yamaguchi, K. Influence of precipitations and sunshine hours on yield of paddy field grown wheat (Triticum aestivum L.) in Northern Kyushu, Japan. Plant Prod. Sci. 2019, 22, 479–489. [Google Scholar] [CrossRef]
- Guo, C.; Dai, H.; Liu, X.; Wu, Y.; Liu, X.; Liu, Y. Impacts of climate change mitigation on agriculture water use: A provincial analysis in China. Geogr. Sustain. 2020, 1, 189–199. [Google Scholar] [CrossRef]
- Song, L.; Jin, J. Effects of Sunshine hours and daily maximum temperature declines and cultivar replacements on maize growth and yields. Agronomy 2020, 10, 1862. [Google Scholar] [CrossRef]
- Bartoszek, K.; Matuszko, D.; Węglarczyk, S. Trends in sunshine duration in Poland (1971–2018). Int. J. Climatol. 2021, 41, 73–91. [Google Scholar] [CrossRef]
- Marsz, A.A.; Styszyńska, A. Zmiany usłonecznienia rzeczywistego w Polsce i ich przyczyny (1966–2018), Changes in sunshine duration in Poland and their causes (1966–2018). Pol. Pr. Geogr. 2021, 165, 23–52. [Google Scholar] [CrossRef]
- Baumgartner, D.J.; Pötzi, W.; Freislich, H.; Strutzmann, H.; Veronig, A.M.; Foelshche, U.; Rieder, H.E. A comparison of long-term parallel measurements of sunshine duration obtained with a Campbell-Stokes sunshine recorder and two automated sunshine sensors. Theor. Appl. Climatol. 2018, 133, 263–275. [Google Scholar] [CrossRef]
- Pallé, E.; Butler, C.J. Comparison of sunshine records and synoptic cloud observations: A case study for Ireland. Phys. Chem. Earth 2002, 27, 405–414. [Google Scholar] [CrossRef]
- Stanhill, G. Through a glass brightly: Some new light on the Campbell–Stokes sunshine recorder. Weather 2003, 58, 3–11. [Google Scholar] [CrossRef]
- Sanchez-Lorenzo, A.; Calbó, J.; Wild, M.; Azorin-Molina, C.; Sanchez-Romero, A. New insights into the history of the Campbell-Stokes sunshine recorder. Weather 2013, 68, 327–331. [Google Scholar] [CrossRef]
- Zhou, H.; Quan, W.; Wang, Z.; Li, X.; Li, Y.; Zhao, H. Comparison of sunshine duration measurements between a Jordan sunshine recorder and three automatic sensors at Shangdianzi GAW station. J. Meteorol. Res. 2021, 35, 716–728. [Google Scholar] [CrossRef]
- World Meteorological Organization. Abridged Final Report of the Third Session of the Commission for Instruments and Methods of Observation, New Delhi 1962; WMO-No. 116, R.P. 48; WMO: Geneva, Switzerland, 1962; pp. 25–77. Available online: https://library.wmo.int/index.php?lvl=notice_display&id=9847#.Y5j5kISZOMp (accessed on 30 November 2022).
- Matuszko, D. A comparison of sunshine duration records from the Campbell-Stokes sunshine recorder and CSD3 sunshine duration sensor. Theor. Appl. Climatol. 2015, 119, 401–406. [Google Scholar] [CrossRef]
- Hannak, L.; Friedrich, K.; Imbery, F.; Kaspar, F. Comparison of manual and automatic daily sunshine duration measurements at German climate reference stations. Adv. Sci. Res. 2019, 16, 175–183. [Google Scholar] [CrossRef]
- Kipp & Zonen. CHP1 Pyrheliometer Instruction Manual; Ver. 0811; Kipp & Zonen B.V.: Delft, The Netherlands, 2008; pp. 1–23. Available online: https://www.kippzonen.com/Download/202/CHP-1-Pyrheliometer-Manual (accessed on 7 January 2023).
- Kipp & Zonen. Instruction Manual for CMP Series Pyranometer; Doc. No. V1610; Kipp & Zonen B.V.: Delft, The Netherlands, 2016; pp. 1–46. Available online: https://www.kippzonen.com/Download/72/Manual-Pyranometers-CMP-series (accessed on 7 January 2023).
- Kipp & Zonen. CSD1 Sunshine Duration Meter Instruction Manual; Ver. 0804; Kipp & Zonen B.V.: Delft, The Netherlands, 2003; pp. 1–41. Available online: https://www.kippzonen.com/Download/90/CSD-1-Manual (accessed on 7 January 2023).
- Kipp & Zonen. CSD3 Sunshine Duration Sensor Instruction Sheet; Kipp & Zonen B.V.: Delft, The Netherlands, 2018; p. 1. Available online: https://www.kippzonen.com/Product/35/CSD3-Sunshine-Duration-Sensor#.Y73pI4SZOMo (accessed on 7 January 2023).
- Kipp & Zonen. The Kipp & Zonnen Products Catalogue; Kipp & Zonen B.V.: Delft, The Netherlands, 2016; pp. 1–92. Available online: https://www.kippzonen.com/Download/576/Kipp-Zonen-Product-Catalogue (accessed on 7 January 2023).
- Delta-T. SPN1 Sunshine Pyranometer; User Manual Ver. 4.2; Delta-T Devices Ltd.: Cambridge, UK, 2019; pp. 1–64. Available online: https://delta-t.co.uk/product/spn1/ (accessed on 7 January 2023).
- Kejna, M.; Uscka-Kowalkowska, J. Porównanie wyników rejestracji usłonecznienia heliografem Campbella-Stokesa i czujnikiem świecenia Słońca DSU12 w Koniczynce k. Torunia w latach 2006–2010 (Comparison of the results of sunshine duration recording by a Campbell-Stokes heliograph and a sunshine duration DSU12 at Koniczynka near Toruń in the years 2006–2010; in Polish). Prz. Geof. 2012, 57, 11–20. Available online: http://ptgeof.imgw.pl/zalaczniki/download.php?plik=PG%201%202012%20Kejna.pdf (accessed on 30 November 2022).
- Kroneis GmbH. Kroneis Solar 111 Sunshine Duration Sensor Product Information; Kroneis GmbH: Vienna, Austria, 2018; p. 1. Available online: https://www.kroneis.at/meteorologische-sensoren/strahlung (accessed on 7 January 2023).
- Kerr, A.; Tabony, R. Comparison of sunshine recorded by Campbell–Stokes and automatic sensors. Weather 2004, 59, 90–99. [Google Scholar] [CrossRef]
- Perry, M. Updated Comparison of Sunshine Duration Recorded by Campbell-Stokes and Automatic Sensors; National Climate Information Centre Climate Memorandum, 27; Met Office: Exeter, UK, 2011; pp. 1–20. Available online: https://library.metoffice.gov.uk/Portal/Default/en-GB/RecordView/Index/252478 (accessed on 5 December 2022).
- Legg, T. Comparison of daily sunshine duration recorded by Campbell–Stokes and Kipp and Zonen sensors. Weather 2014, 69, 264–267. [Google Scholar] [CrossRef]
- Kejna, M.; Uscka-Kowalkowska, J. Porównanie wyników pomiarów meteorologicznych w Stacji ZMŚP w Koniczynce (Pojezierze Chełmińskie) wykonanych metodą tradycyjną i automatyczną w roku hydrologicznym 2002 (A comparison of traditional and automatic measurements at the Koniczynka monitoring station (Chełmińskie Lakeland, Northern Poland), during the hydrological year 2002. Ann. Univ. Mariae Curie-Skłodowska Sec. B 2006, 61, 208–217. (In Polish) [Google Scholar]
- Pokorný, J.; Vaníček, K. Automatizace měření slunečního svitu na stanicích Českého hydrometeorologického ústavupomocí elektronických slunoměrů (Automation of measurements of sunshine duration at stations of the Czech Hydrometeorological Institute by electronic sensors. Meteorol. Zprávy 2007, 60, 106–116. Available online: http://www.cmes.cz/sites/default/files/MZ_2007_4_slunom%C4%9Bry.pdf (accessed on 5 December 2022). (In Czech).
- Matuszko, D. Porównanie wartości usłonecznienia mierzonego heliografem Campbella-Stokesa i czujnikiem elektronicznym CSD3 (Comparison of sunshine duration measured by a Campbell-Stokes heliograph and a CSD3 electronic sensor. Prz. Geofiz. 2012, 57, 4–10. Available online: http://ptgeof.imgw.pl/zalaczniki/download.php?plik=PG%201%202012%20Matuszko.pdf (accessed on 5 December 2022). (In Polish).
- Urban, G.; Zając, I. Comparison of sunshine duration measurements from Campbell-Stokes sunshine recorder and CSD1 sensor. Theor. Appl. Climatol. 2017, 129, 77–87. [Google Scholar] [CrossRef]
- Matuszko, D. Influence of cloudiness on sunshine duration. Int. J. Climatol. 2012, 32, 1527–1536. [Google Scholar] [CrossRef]
- Kothe, S.; Pfeifroth, U.; Cremer, R.; Trentmann, J.; Hollmann, R. A satellite-based sunshine duration climate data record for Europe and Africa. Remote Sens. 2017, 9, 429. [Google Scholar] [CrossRef]
- Bartoszek, K. Actual sunshine duration in Poland—Comparison of satellite and ground-based measurements. Prz. Geof. 2018, 63, 329–338. Available online: http://ptgeof.imgw.pl/?strona=5,20,3 (accessed on 5 December 2022).
- Matuszko, D.; Bartoszek, K.; Soroka, J.; Węglarczyk, K. Sunshine duration in Poland from ground-and satellite-based data. Int. J. Clim. 2020, 40, 4259–4271. [Google Scholar] [CrossRef]
Disclaimer/Publisher’s Note: The statements, opinions and data contained in all publications are solely those of the individual author(s) and contributor(s) and not of MDPI and/or the editor(s). MDPI and/or the editor(s) disclaim responsibility for any injury to people or property resulting from any ideas, methods, instructions or products referred to in the content. |
© 2023 by the authors. Licensee MDPI, Basel, Switzerland. This article is an open access article distributed under the terms and conditions of the Creative Commons Attribution (CC BY) license (https://creativecommons.org/licenses/by/4.0/).