Article

Impacts of Multi-Source Microwave Satellite Radiance Data Assimilation on the Forecast of Typhoon Ampil

Collaborative Innovation Center on Forecast and Evaluation of Meteorological Disasters, Nanjing University of Information Science & Technology, Nanjing 210044, China
*
Author to whom correspondence should be addressed.
Atmosphere 2022, 13(9), 1427; https://doi.org/10.3390/atmos13091427
Submission received: 24 July 2022 / Revised: 26 August 2022 / Accepted: 29 August 2022 / Published: 2 September 2022

Abstract

:
This study investigates the impacts of the joint assimilation of microware temperature sensor, Advanced Microwave Sounding Unit-A (AMSUA), and microware humidity sensors, Microwave Humidity Sounder (MHS) and Microwave Humidity Sounder-2 (MWHS2), on the analyses and forecasts for the tropical cyclone (TC) system. Experiments are conducted using a three-dimensional variation (3DVAR) algorithm in the framework of the weather research and forecasting data assimilation (WRFDA) system for the forecasting of Typhoon Ampil (2018). The results show that the assimilation of MWHS2 radiance data improves the analyses better in terms of TC’s structure and moisture conditions than those of the MHS experiment. To some extent, the experiment with only AMSUA radiance delivers some positive impacts of the precipitation, track, and intensity forecast than the other two experiments do. In addition, the skill of the precipitation forecast is notably enhanced with higher equitable threat score (ETS) by the simultaneous assimilation of the MHS, MWHS2, and AMSUA radiance. Generally, assimilation of radiance from all sources of MHS, MWHS2, and AMSUA could combine the advantages of assimilating each type of sensors rather than individually. The consistent improvement is also confirmed for the TC’s track forecast with reduced error on average, whereas the improvement of intensity forecast is not obvious.

1. Introduction

Typhoons and hurricanes belong to a kind of deep and powerful low-pressure system named a tropical cyclone (TC), which are often accompanied by heavy rainstorms, causing serious disasters. With the continuous progress of atmospheric observation techniques, various observations play very important roles in improving the initial condition for TC forecasting. With regard to satellite observations, the accuracy of radiance data is becoming higher and higher with large coverage, high spatio-temporal resolution, and high spectral resolution. Satellite observations also make up for the lack of observation data in areas such as oceans and plateaus affected by topographic factors [1,2,3].
Satellite microwave observation, which is a common kind of satellite observation, has been widely used in numerical weather prediction (NWP) [4,5,6,7,8,9,10]. The temperature and humidity sensitive satellite microwave sensors, such as the NOAA-18 and MetOp-A Microwave Humidity Sounder (MHS), the FengYun (FY)-3A and FY-3B Microwave Humidity Sounder (MWHS), the FY-3C and FY-3D Microwave Humidity Sounder-2 (MWHS2), the Advanced Microwave Sounding Unit-A (AMSUA) and the Advanced Technology Microwave Sounder (ATMS), are widely used in NWP centers [11,12]. To be specific, the MHS and MWHS are designed to detect atmospheric water vapor, whereas the AMSUA is mainly used for temperature sounding. They are essential for tropical convection and TCs. It is well known that FY-3 series has played a notable role in providing radiance data for the detection of atmospheric circulation. The first four satellites, FY-3A (2008), FY-3B (2010), FY-3C (2013), and FY-3D (2017), were successfully launched. Higher instrument noise is found in the MWHS on the FY-3A/B satellites compared to the MHS [13,14]. As the advanced polar-orbit meteorological satellites in China, FY-3C and FY-3D, are equipped with the MWHS2 advanced atmospheric microwave vertical detector compared to the MWHS onboard the previous two satellites. FY-3C works as the morning detector while FY-3D provides afternoon observations, which reduces observation intervals in the same region [15]. It is proved by the Met Office that the quality of the MWHS2 data is comparable to the similar channel of ATMS from the 183-GHz channels [16], and it is reflected by an error reduction of 0.6% in 24-h forecast in the Met Office global model [17].
In the studies of the satellite data assimilation, the assimilation of microwave radiance has been widely proven to be beneficial in enhancing TC forecasts. For example, the microwave radiance is explored onboard the multiple satellites for cases of typhoons (Schwartz et al. (2012) [8]). Newman et al. [9] (2015) examined the impacts of assimilating MHS radiance in a limited-area ensemble Kalman filter (EnKF) data assimilation system and found improved track forecasts for five hurricanes during the experimental period. Xu et al. [18] (2016) investigated the impacts of MWHS onboard FY-3B based on binary typhoons with improvements in terms of the track and the precipitation skill. Furthermore, the effects of adding FY-3D MWHS2 is also studied on top of the conventional data for a typhoon case with promising track and precipitation forecast in Xu et al. [19] (2021). Sun and Xu [20] (2021) found that the performance of assimilating MWHS2 radiance is comparable to (sometimes outperforms) that of ATMS radiance for a typhoon case. Considering the features of different satellite microwave humidity detectors, this study further investigates the influence of the joint assimilation of satellite humidity-sensitive microwave sensors of MHS and MWHS2 on the TC’s analysis and forecast on top of the widely applied AMSUA data in the typhoon structure, typhoon track, as well as the typhoon intensity. AMSUA data are applied since they have the longest history and have become the most influential microwave-sounding observations in most operational centers [21]. As two of the main humidity detectors, it should be noted that the characteristics and properties of MHS and MWHS2 are different. Similar to MWHS2, MHS is also a cross-track microwave radiometer with the same nadir spatial resolution. MHS has smaller swath width (2250 km) than MWHS2 (2700 km) with fewer fields of view [22]. In our study, a comparison of the separate and combined values of the widely applied microwave radiances of AMSUA and MHS as well as the advanced MWHS2 radiances are also assessed, which distinguishes the current paper from similar studies. The results of this study will serve as a good reference for radiance data assimilation for TC cases.
This paper is organized as follows. The satellite observations and weather research and forecasting data assimilation (WRFDA) system are described in Section 2. Section 3 shows the experimental setup while the results of the experiments are discussed in Section 4. Conclusions and further discussions are included in Section 5.

2. Satellite Observations and WRFDA System

2.1. AMSUA, MHS and MWHS2 Radiance

The microwave humidity sounder (MHS) has replaced the Advanced Microwave Sounding Unit-B (AMSU-B) instrument, which is one of the main core components in European–U.S. operational polar meteorological satellite systems together with AMSUA [23]. Regarding AMSUA, it has 15 channels, among which channels 1–3, and 15 mainly detect surface and precipitation information, and channels 4–14 are able to obtain vertical profile information of the atmospheric temperature [24]. With respect to the predecessor, AMSU-B, the MHS instrument allows for full continuity in the data processing, with the improvement in terms of the calibration accuracy and radiometric sensitivity [25]. MWHS2, a new microwave humidity sensor developed from the previous MWHS detector, is the second-generation humidity sounder onboard China’s polar-orbit meteorological satellite FY-3D. It has a total of 15 channels. Among them, channels 2–9 are sensitive to atmospheric temperature and channels 11–15 are sensitive to atmospheric humidity. Channels 1 and 10 are used for background microwave radiation detection and precipitation detection [26]. Based on the characteristics of each sensor, AMSUA radiance for channels 5–7 and 9, MHS radiance for channels 4 and 5, and MWHS2/FY-3D radiance for channels 11–15 are used in this study.

2.2. WRFDA System

The WRFDA system is the data assimilation module supplied by the weather research and forecasting (WRF) model, which is able to assimilate conventional observations and unconventional observations, such as those from radars and satellites [27]. This study applies the WRF model version 4.3, that is capable of assimilating AMSUA, MHS, and MWHS2 radiance. All experiments use the three-dimensional variational analysis method to obtain optimal analysis of the atmospheric state at the current moment by establishing a cost function in an iterative manner. The cost function of the three-dimensional variation can be expressed as:
J ( x ) = ( x x b ) T B 1 ( x x b ) + [ y 0 H ( x ) ] T R 1 [ y 0 H ( x ) ] ,  
where x is the analytical field, x b is the background field, B is the background error covariance matrix; y 0 is the observation field, R is the observation error covariance matrix, H is the nonlinear observation operator, while the superscripts T and –1 denote the transpose and inverse of the matrix. The radiative transfer model used in this study is radiative transfer for TOVS (RTTOV). It should be noted that the National Meteorological Center (NMC) method [28] is adopted with one-month forecasts to obtain the background error covariance matrix. In this paper, the CV5 scheme is used with stream function (ψ), potential function (φ), unbalanced temperature (Tu), pseudo relative humidity (RHs), and unbalanced surface pressure (Ps,u) as control variables [29]. The deficiency of radiances assimilation is largely influenced by the systematic bias, which cannot be handled in the data assimilation system. Additional steps of bias correction with a variational approach (VarBC) will be carried out before the assimilation with the constant 1000–300 hPa and 200–50 hPa layer thicknesses, surface skin temperature, total column precipitable vapor, and the satellite zenith angle as the predictors. The correction coefficients, β , are generally obtained from offline statistics and are then further updated within each analysis. The bias values are derived by combing the predictors with their correction coefficients, as β 0 + i = 1 N P β i p i . β 0 is the constant part of the total deviation, while p i and β i are the i-th prediction factor and deviation correction coefficient. The standard deviation of the difference between the observation and the simulated brightness temperature based on the Global Forecast System (GFS) analysis is calculated for each channel, which serves as the observation errors for the radiance data assimilation [3]. In this study, no observation error correlation is considered for the inter-channel error correlation, the spatial correlation, and the temporal correlations.

3. Experimental Setup

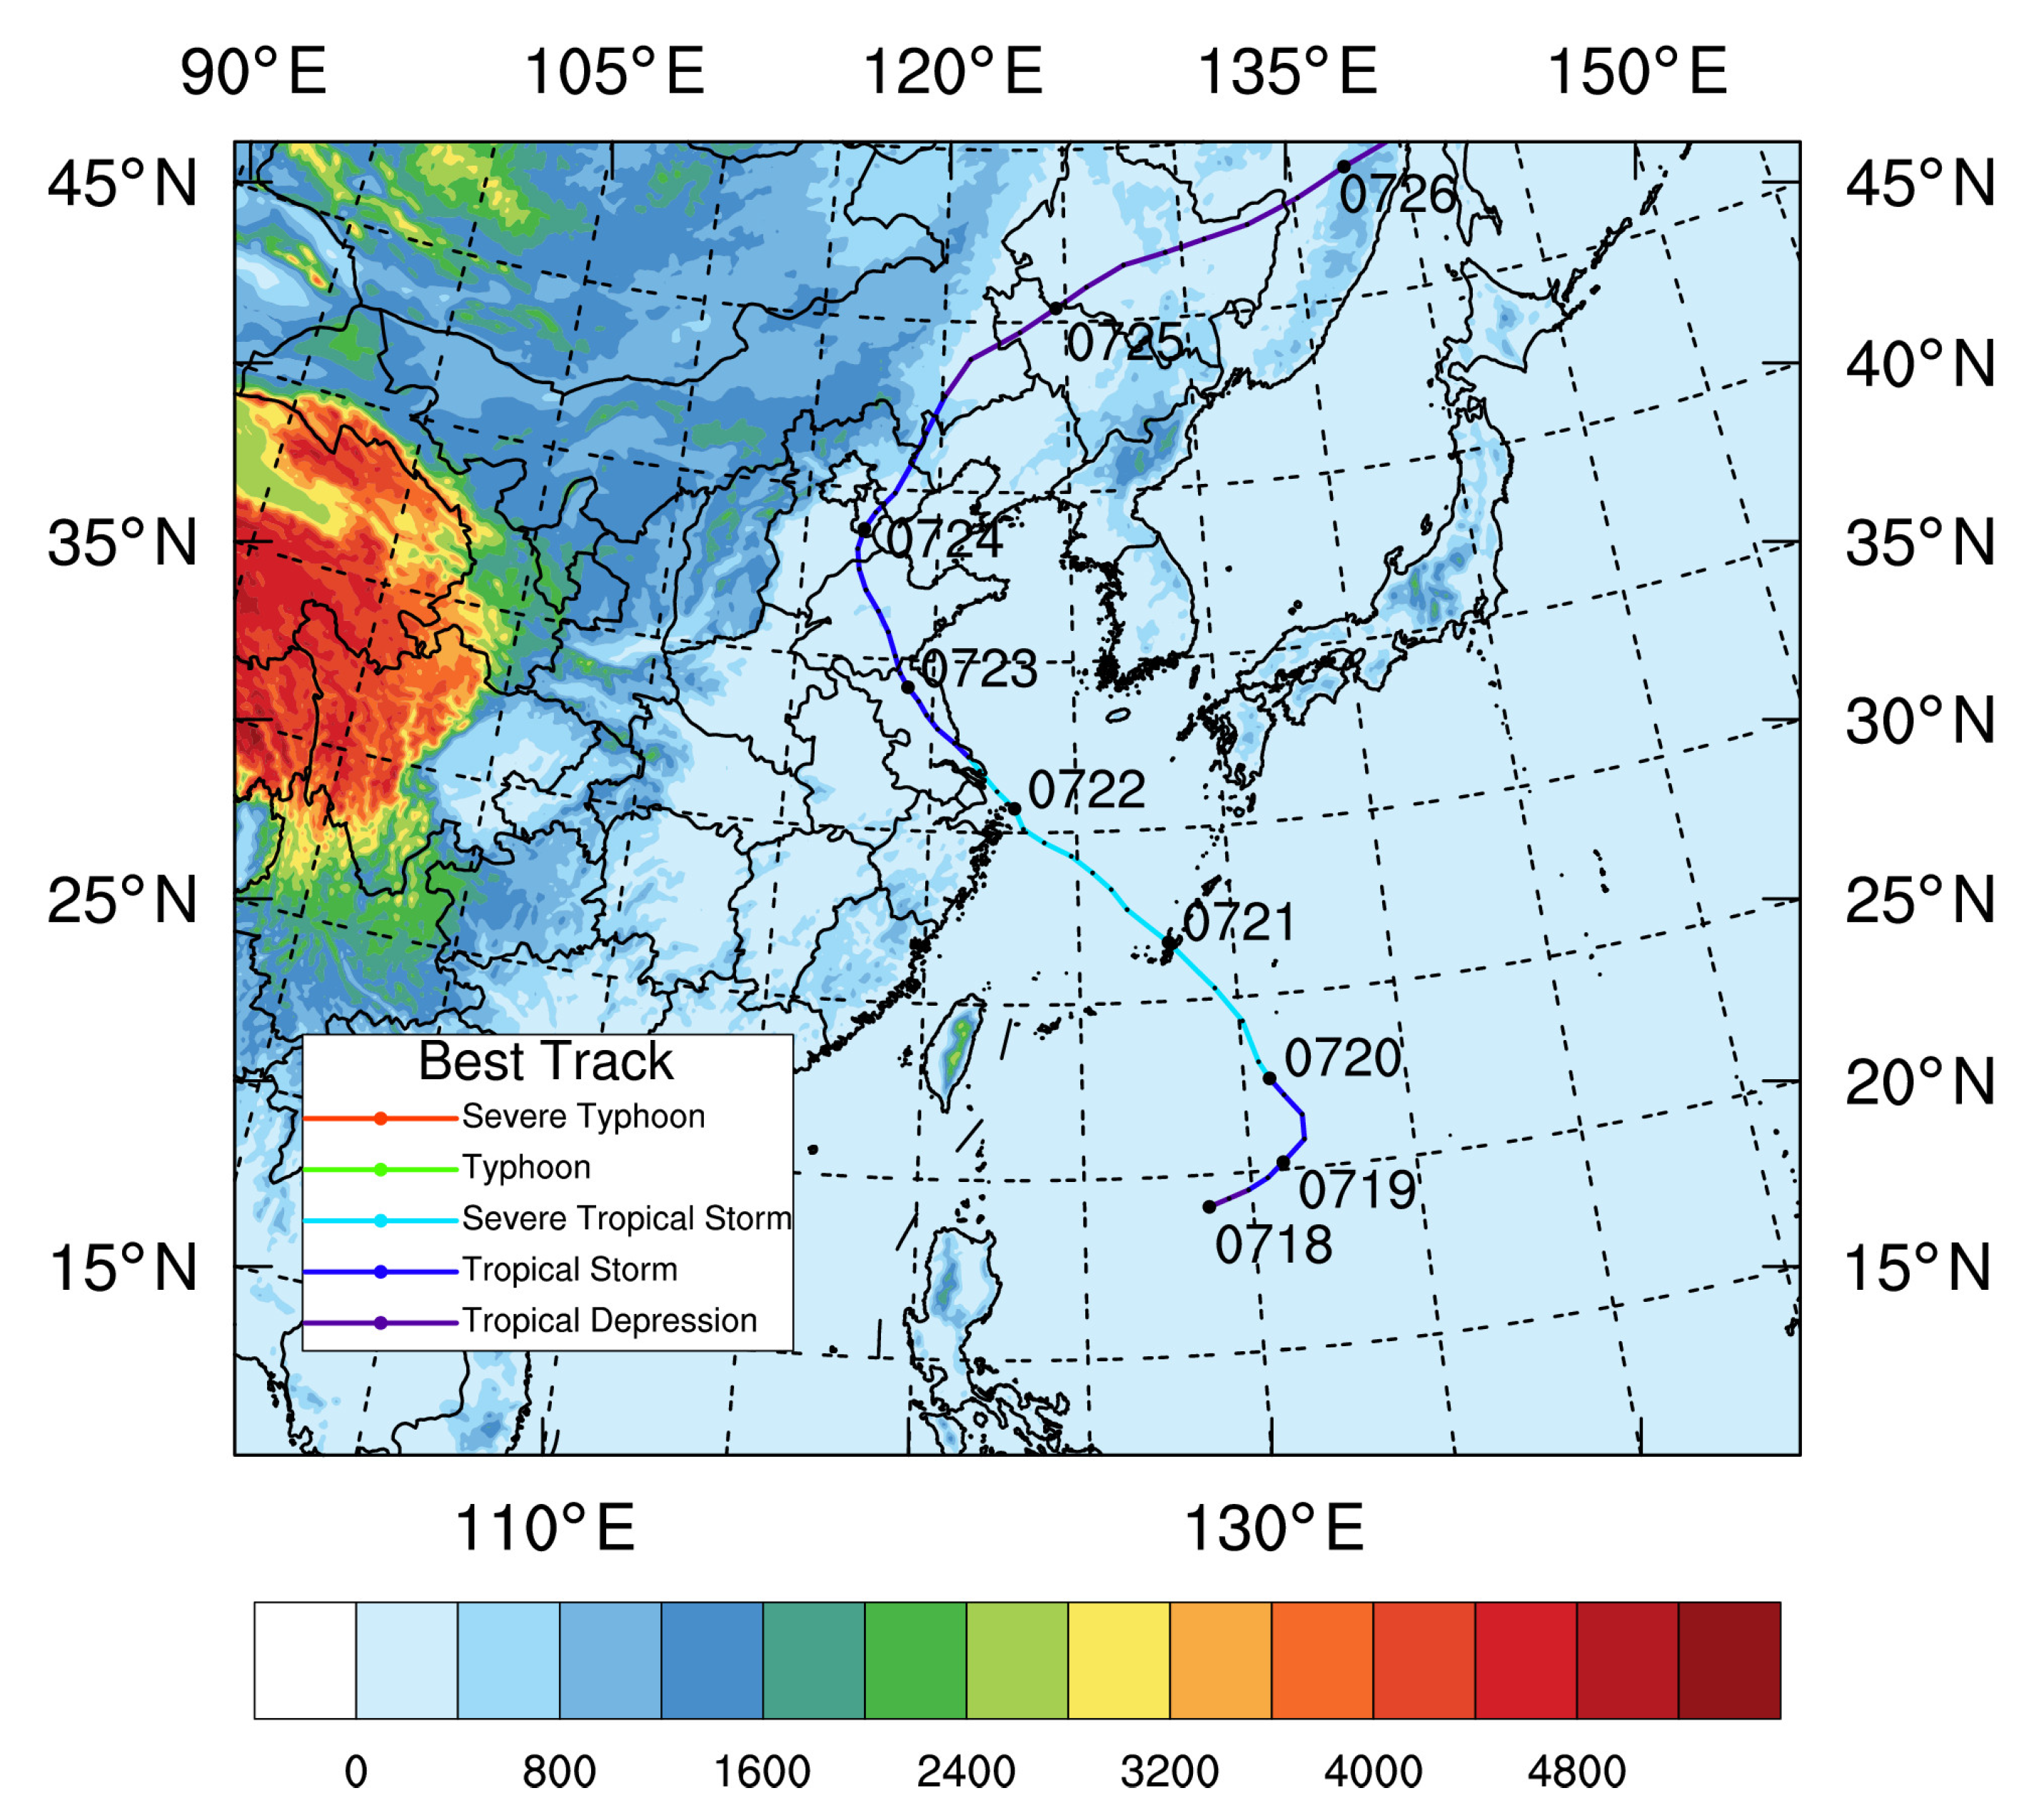
3.1. Typhoon Ampil Case

Typhoon Ampil was the 10th typhoon of the 2018 Pacific typhoon season. Figure 1 shows the typhoon track with the model domain overlaid with the topography, where the best track dataset, including location, minimum sea level pressure (MSLP), and maximum surface wind (MSW), is from the Shanghai Typhoon Research Institute of the China Meteorological Administration [30]. Typhoon Ampil generated in the northeast of the Philippine Islands at 1200 UTC on 18 July with central pressure of 998 hPa. At 0800 UTC on 20 July, Ampil was upgraded to a strong tropical storm, and landed on Chongming Island in Shanghai at 0400 UTC on 22 July with central minimum sea level pressure of 982 hPa. After landfall, it continued to hit several provinces in East China, North China, and Northeast China until its extinction. According to the official record, Ampil caused one casualty and direct economic losses of CNY 990 million [19].

3.2. Experimental Design

In this study, numerical experiments were performed using the WRF model version 4.3 and its data assimilation system with the simulation domain shown in Figure 1. The model center is set at (31° N, 123° E) with a horizontal resolution of 9 km. The horizontal grid numbers are set to 559 × 469, while there are 57 layers vertically with the model top pressure at 10 hPa. The initial and boundary conditions are obtained from GFS data with the resolution of 0.25° × 0.25°. The parameterization schemes used in this study include the Thompson microphysical scheme [31], the YSU boundary layer scheme [32], the Goddard short-wave radiation scheme [33], the RRTM long-wave radiation scheme [34], the Noah land surface model, and the Grell–Freitas cumulus parameterization scheme [35]. The specific experimental scheme was configured as follows. First, a warm start was conducted at 0000 UTC on 22 July 2018 by a 6-h short forecast to spin up the model. Afterwards, four numerical experiments were set up by assimilating multi-source clear-sky satellite observations at 0600 UTC on 22 July to examine their impacts on landfall typhoon forecasts. Apart from the GTS (Global Telecommunications System) conventional data, the used satellite radiance data include AMSUA from NOAA-19, MHS from NOAA-19, and MWHS2 from FY-3D. Each type of radiance data was individually assimilated in the first three sets of experiments, while the fourth set of experiment assimilated them jointly. When the assimilation is conducted, the time window is set as 3 h. The detailed information of each experiment is listed in Table 1. After the assimilation, final 48-h deterministic forecasts were carried out based on the analysis fields from each group of experiments. It is emphasized that a thinning scheme with 6 times the grid distance was performed during the assimilation to avoid potential correlations between adjacent satellite observations [36].

4. Results

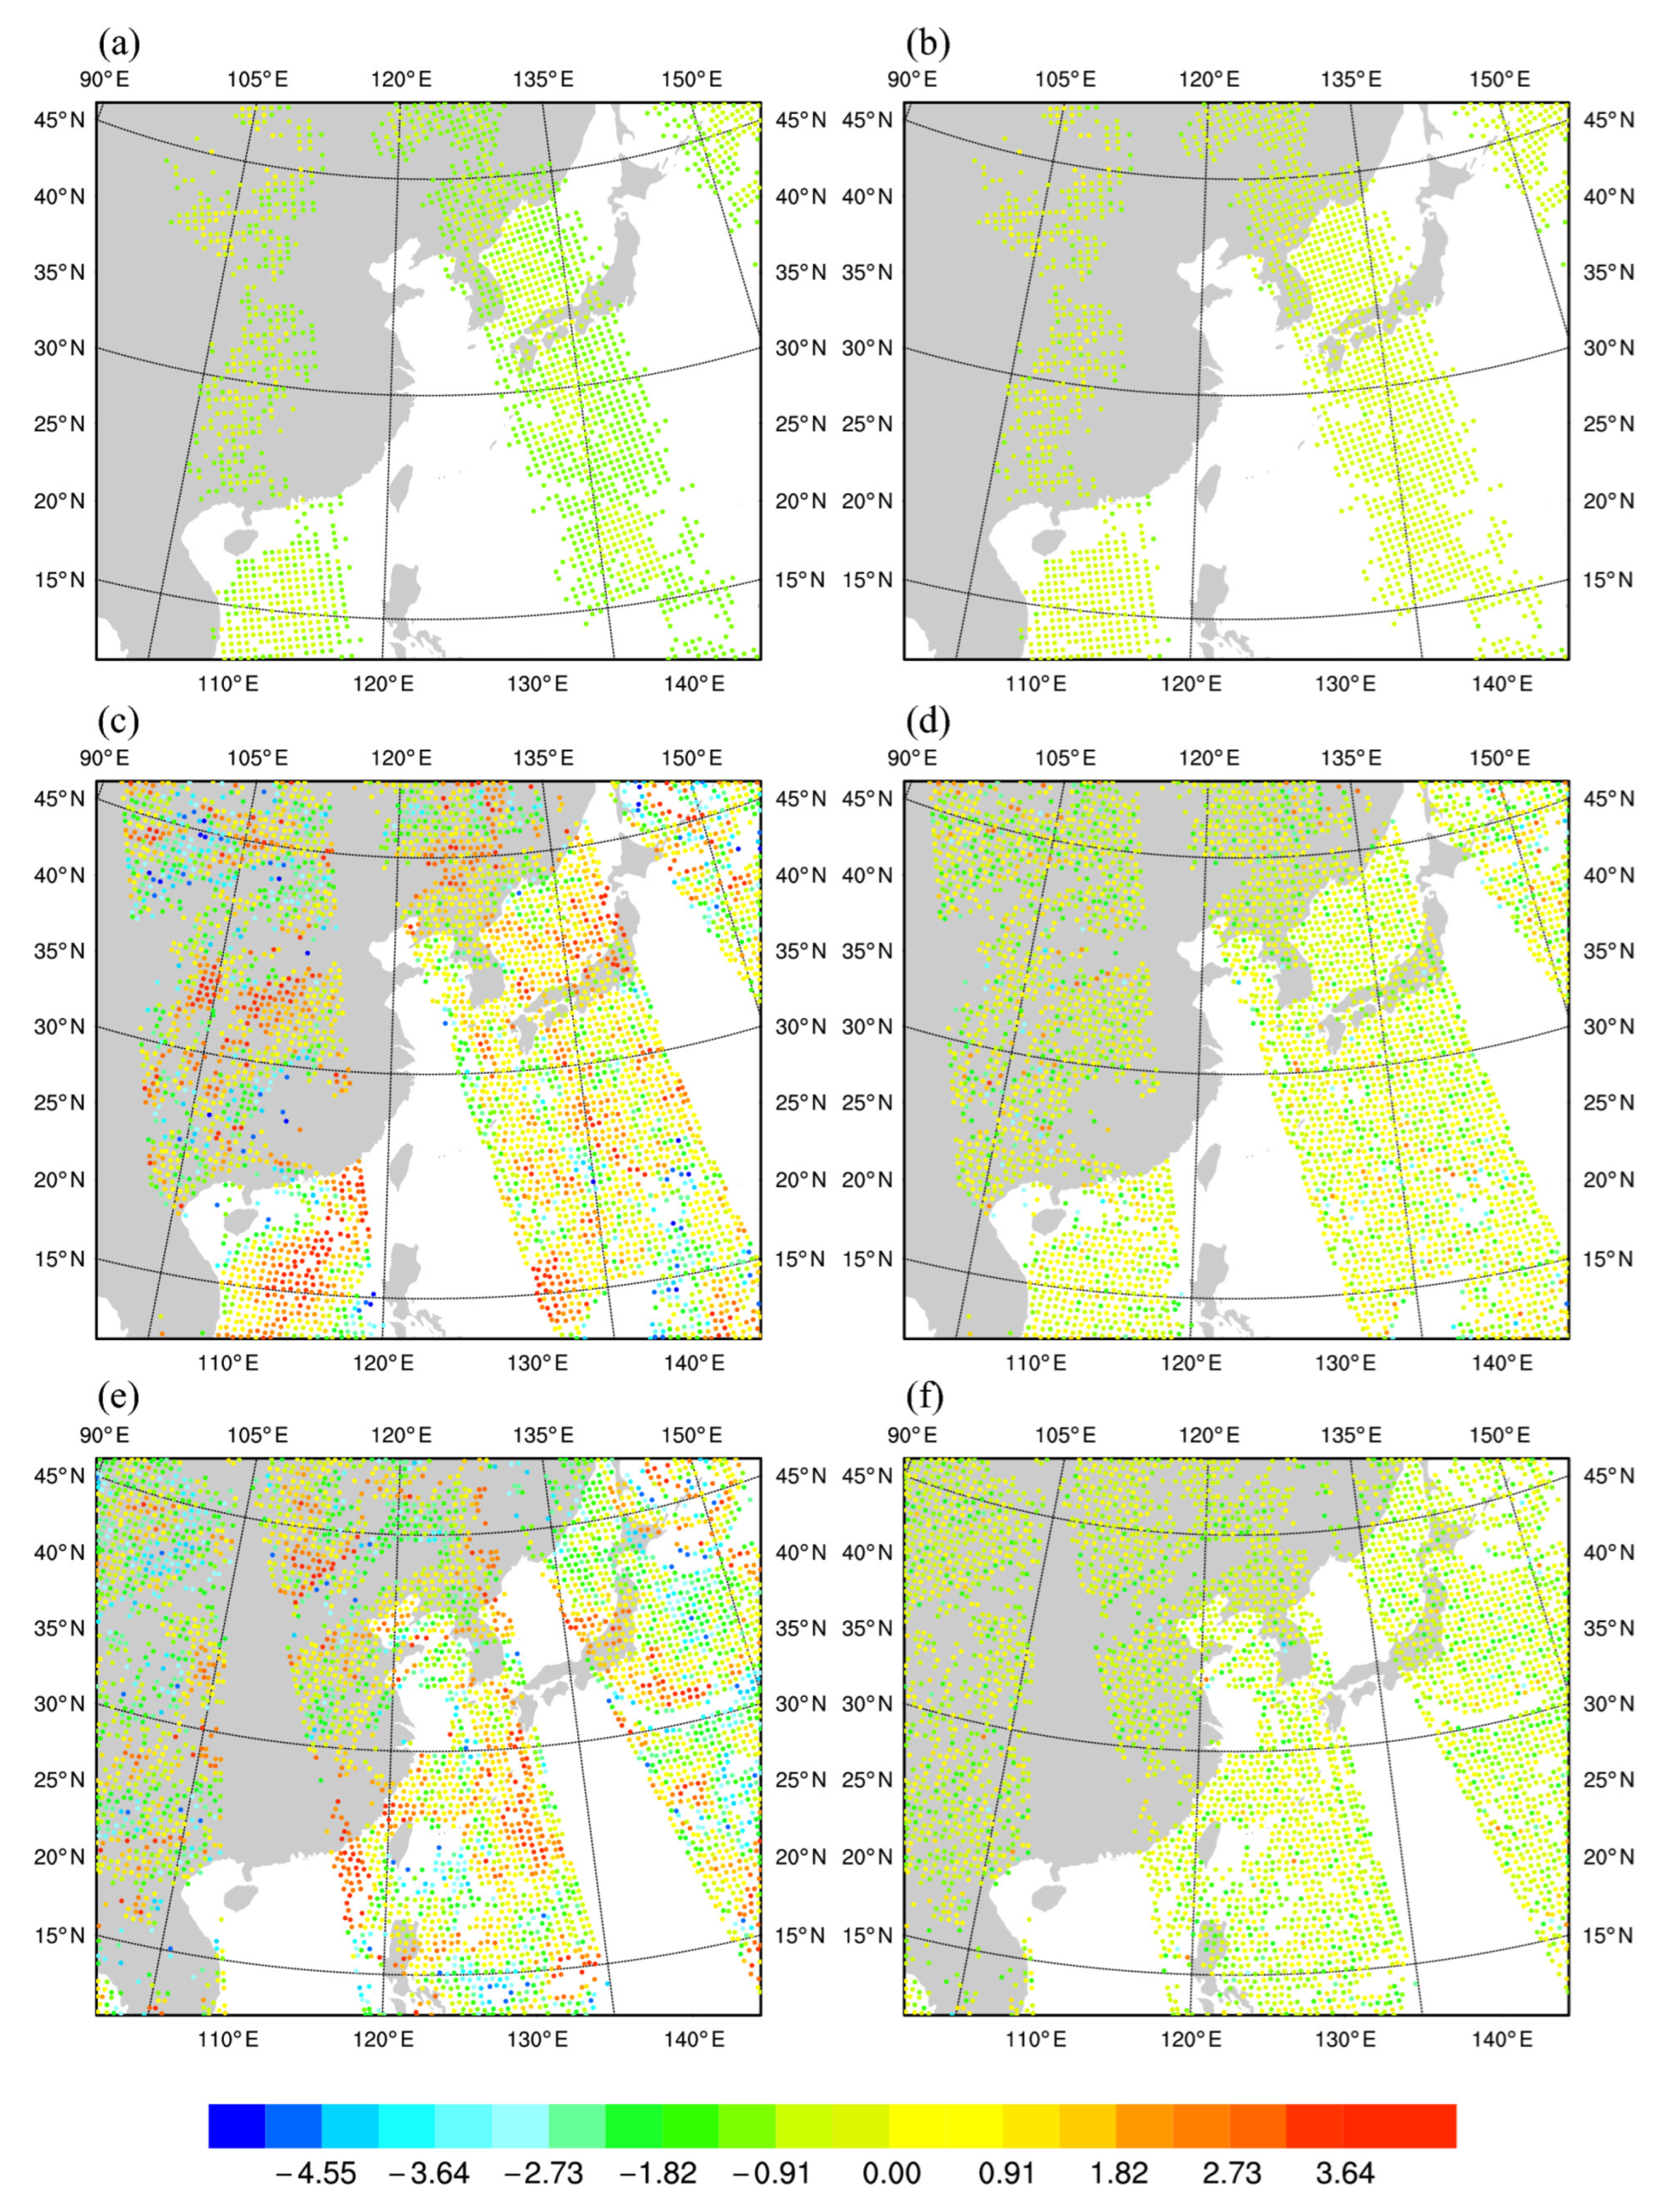
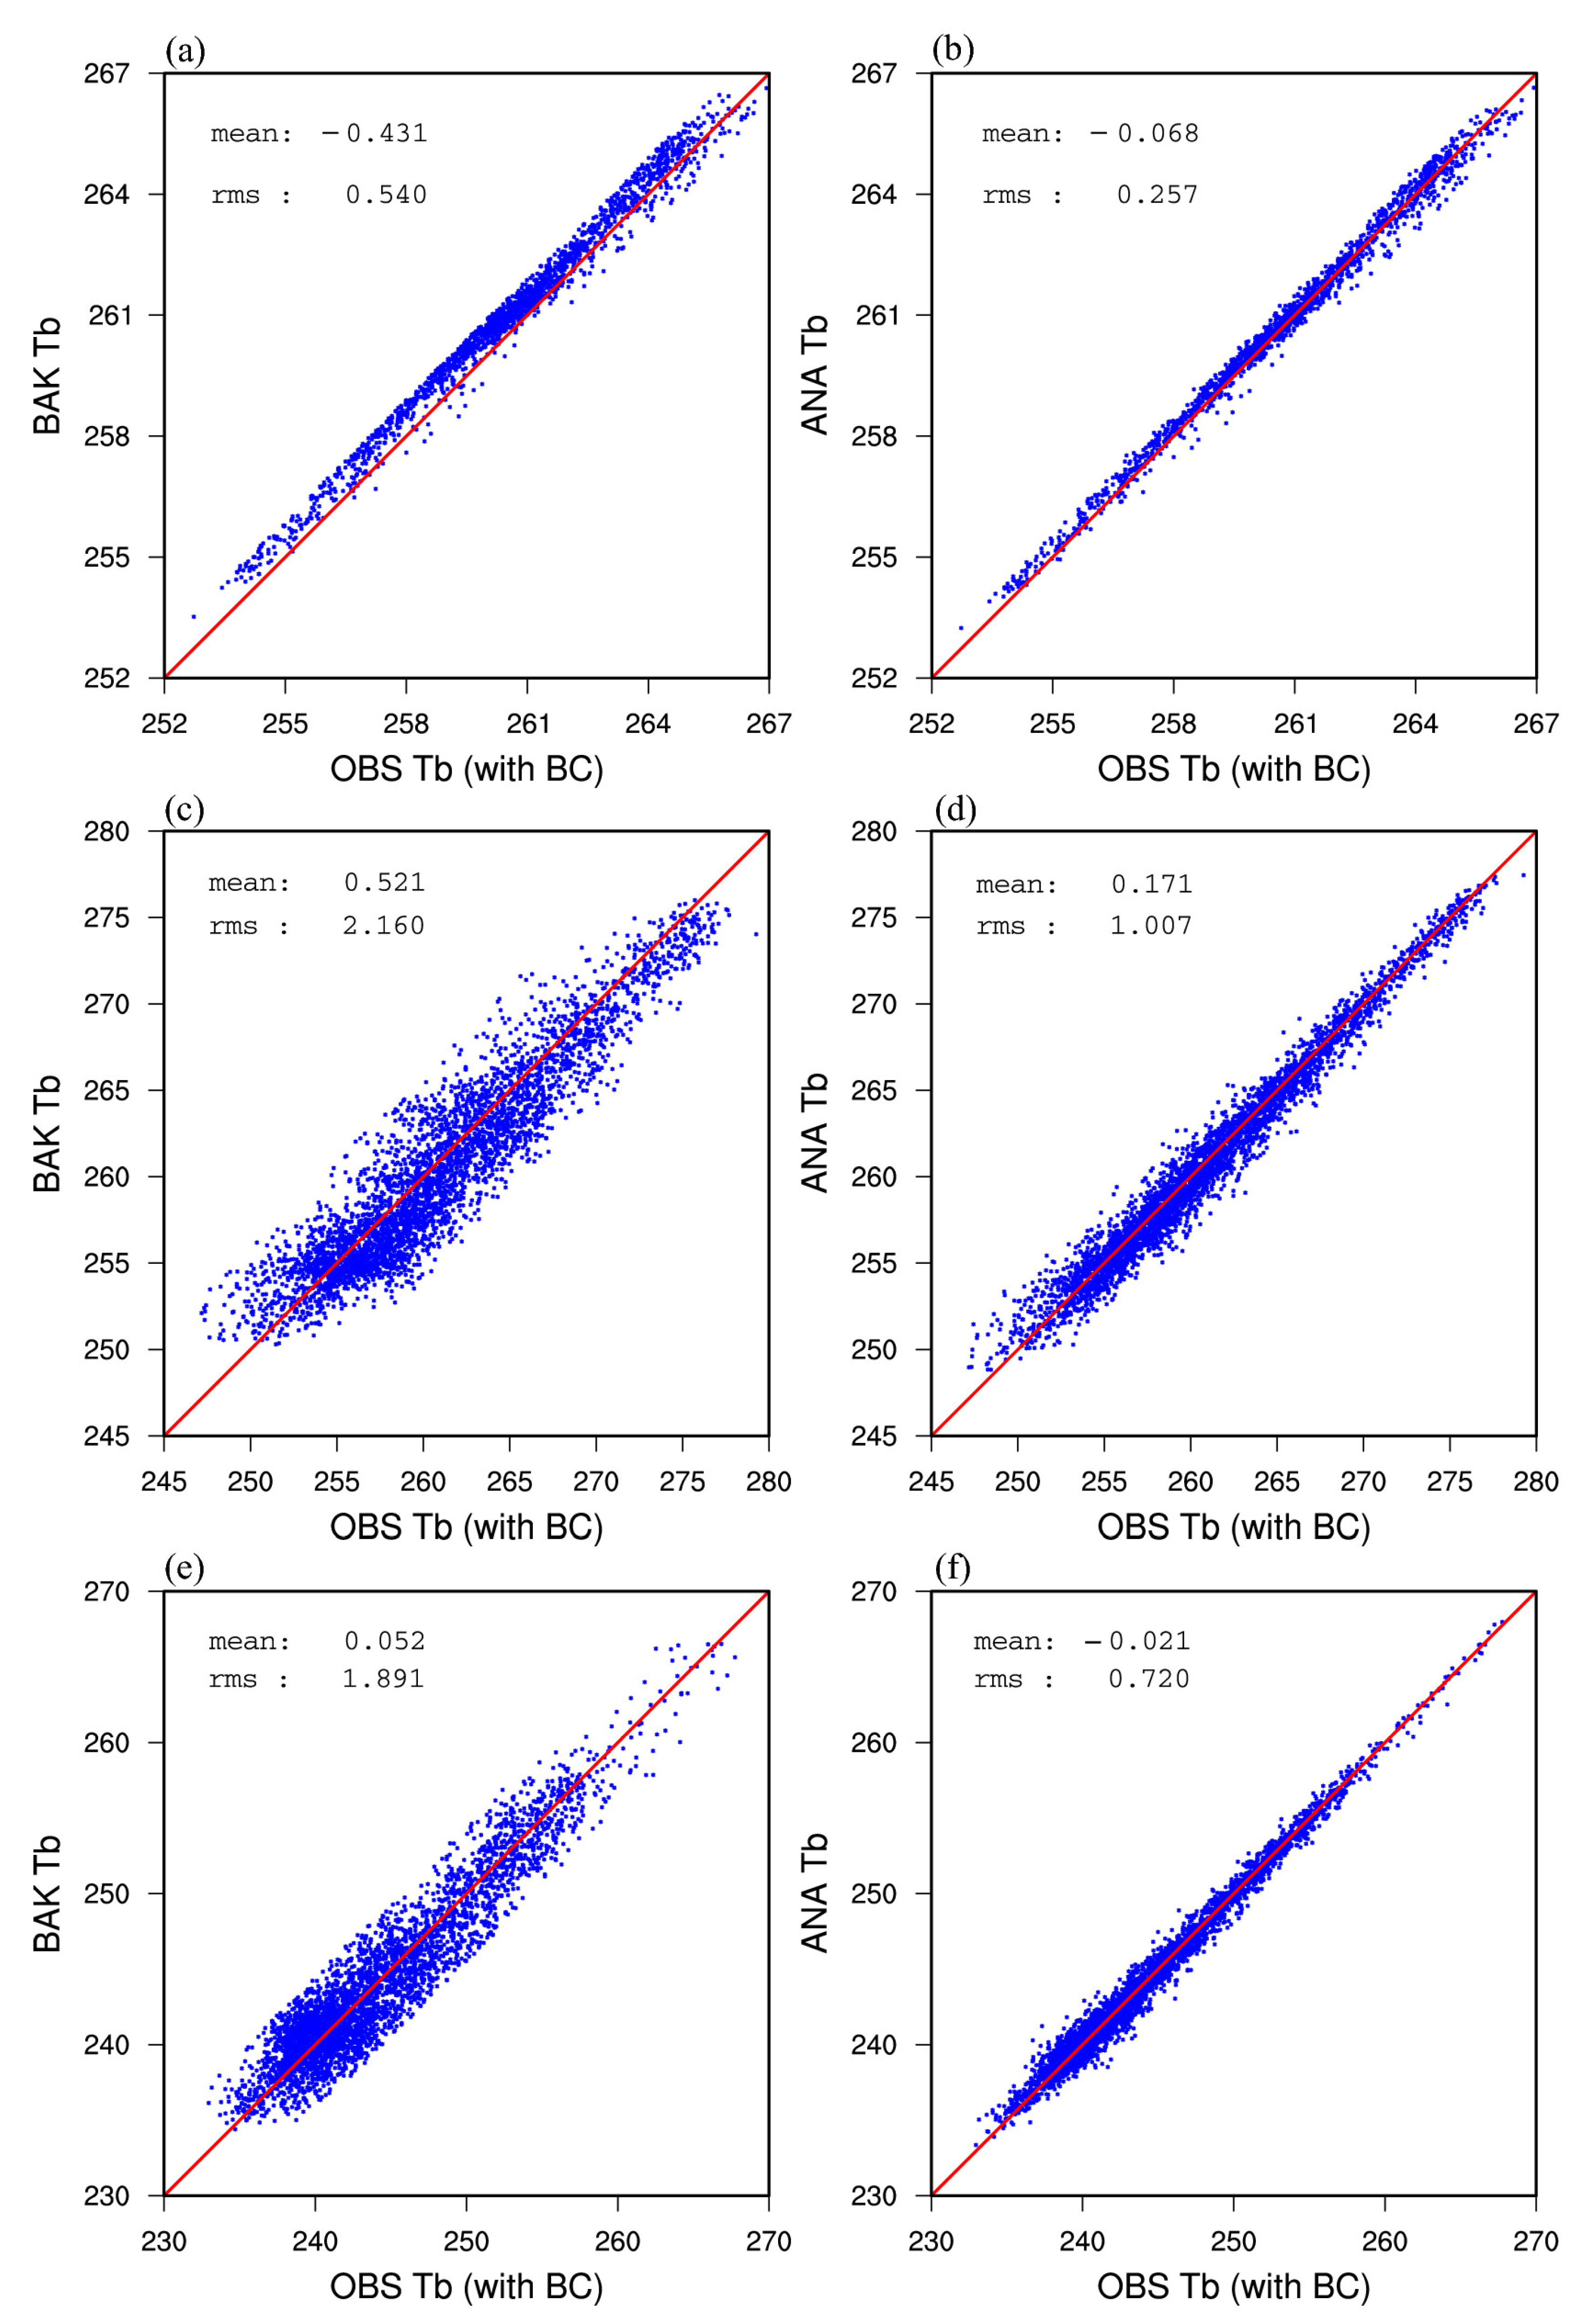
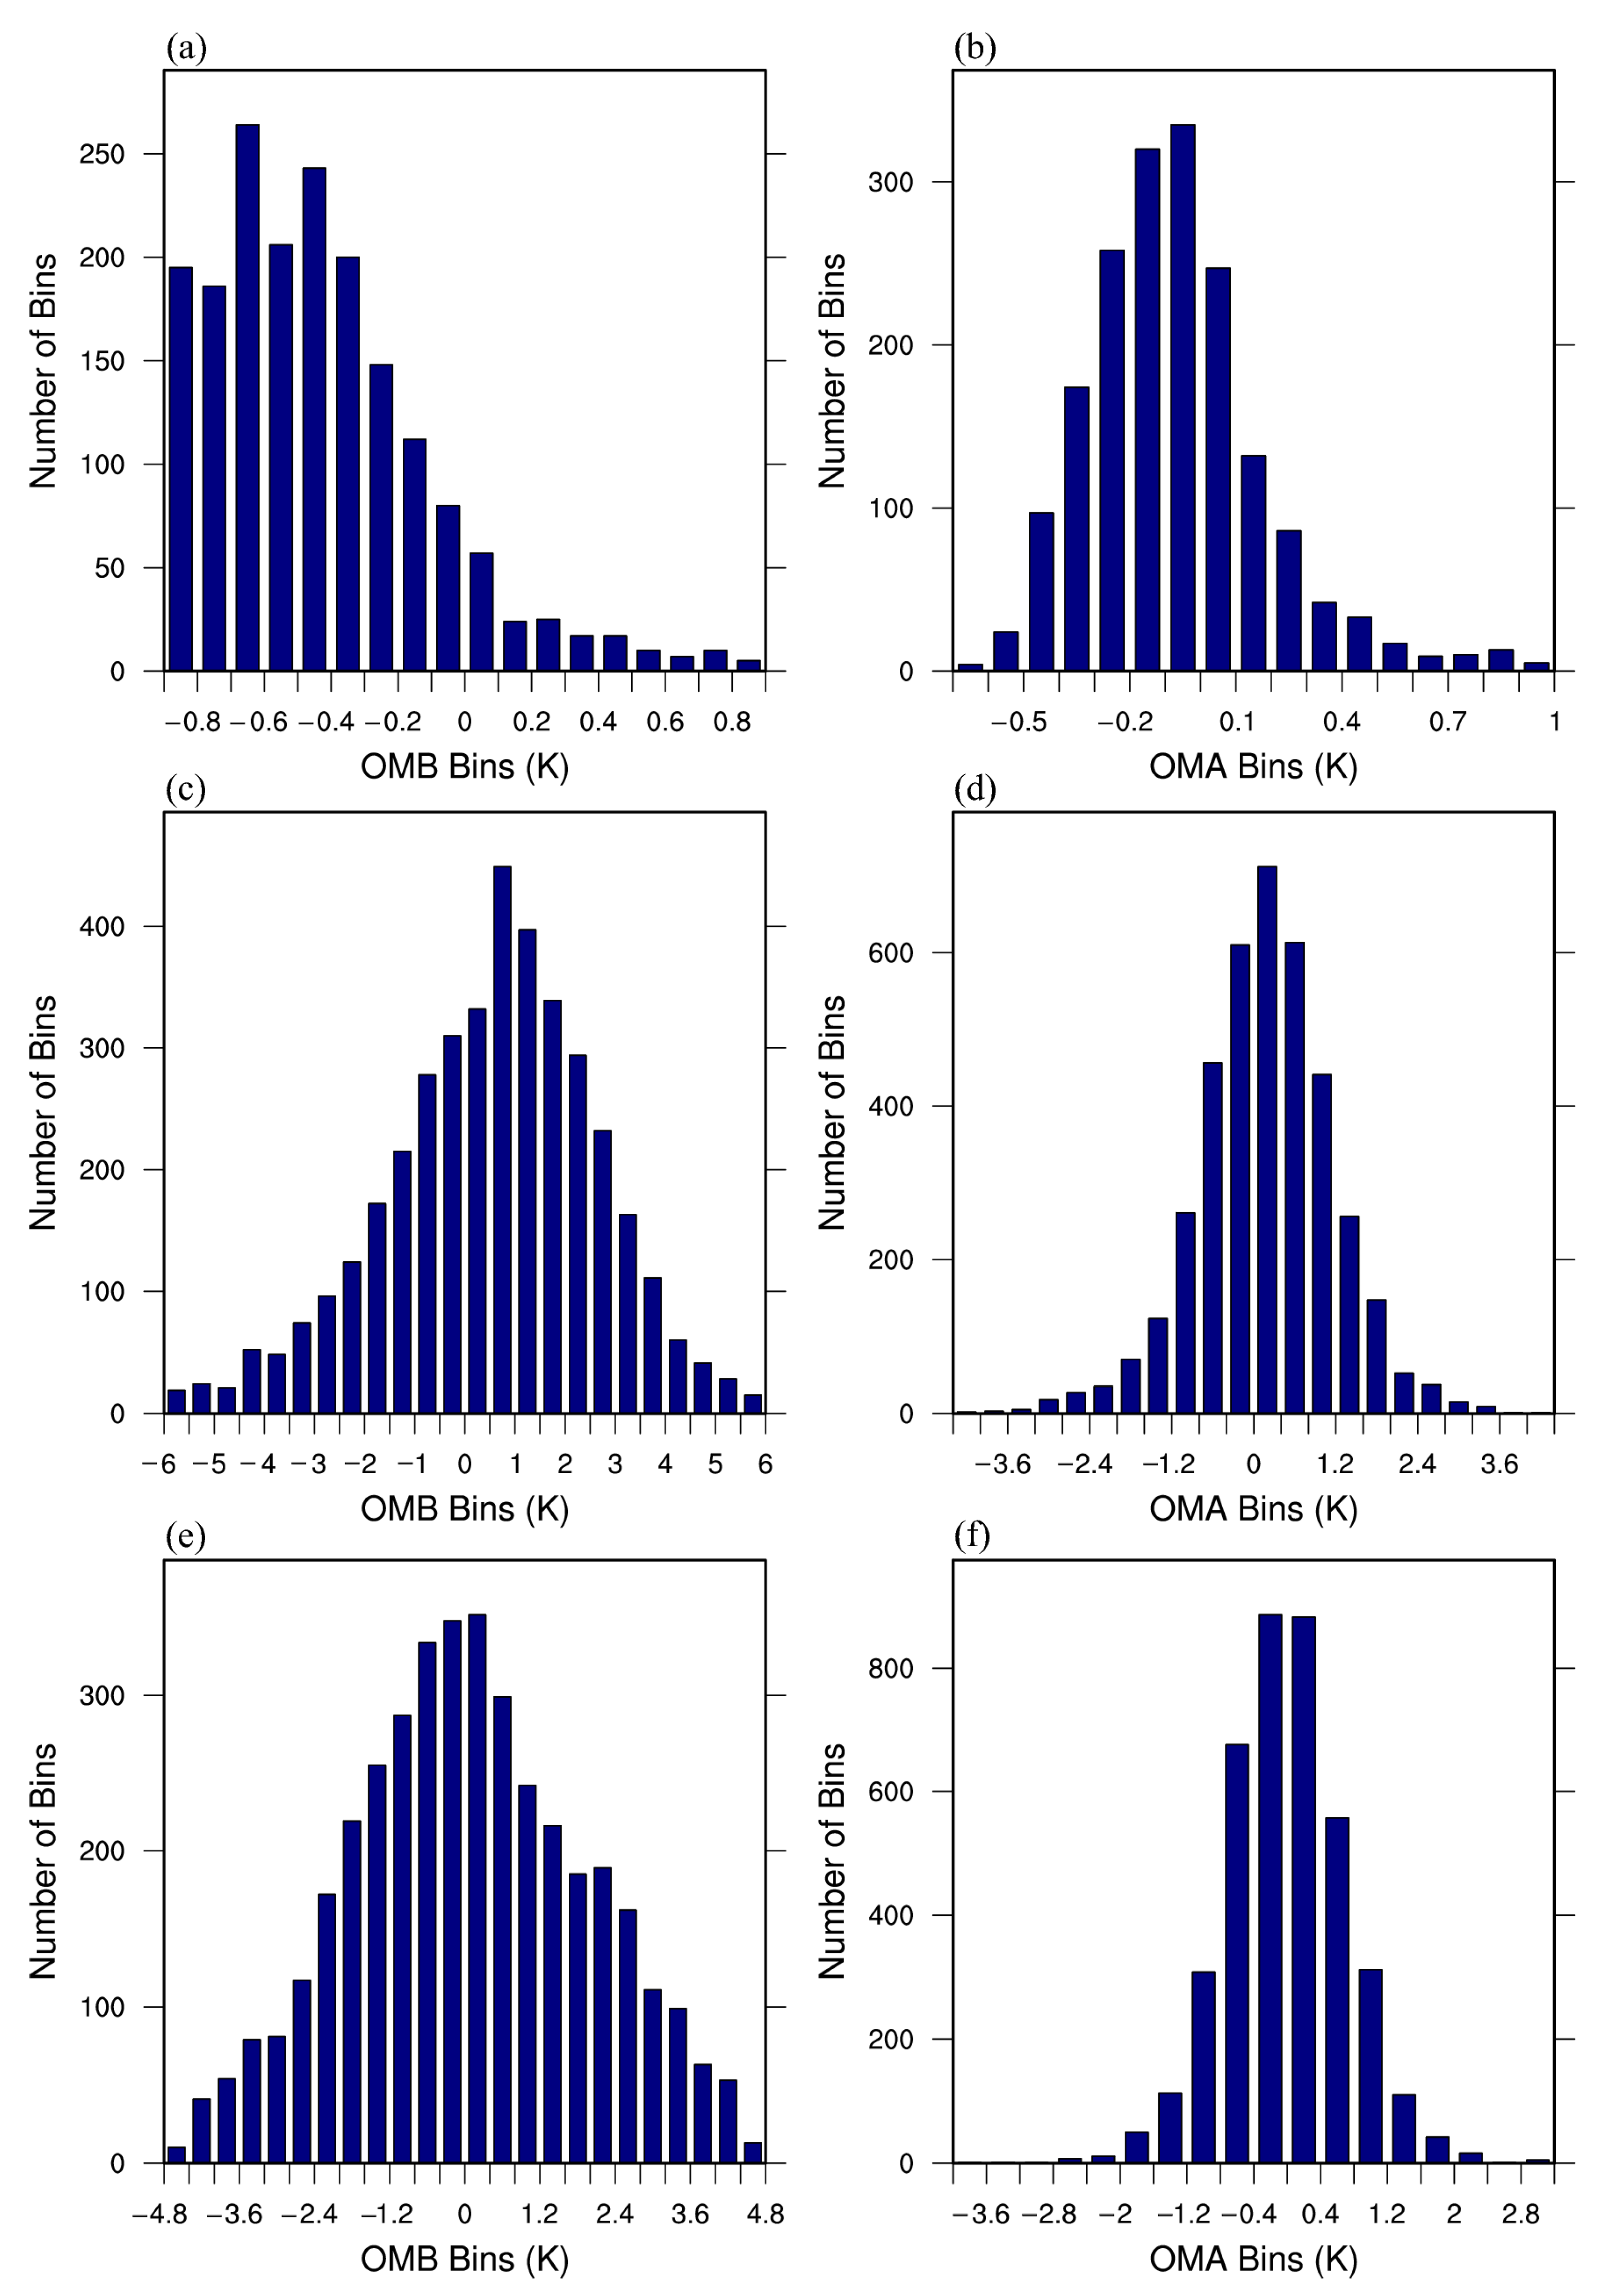
4.1. Radiance Simulation
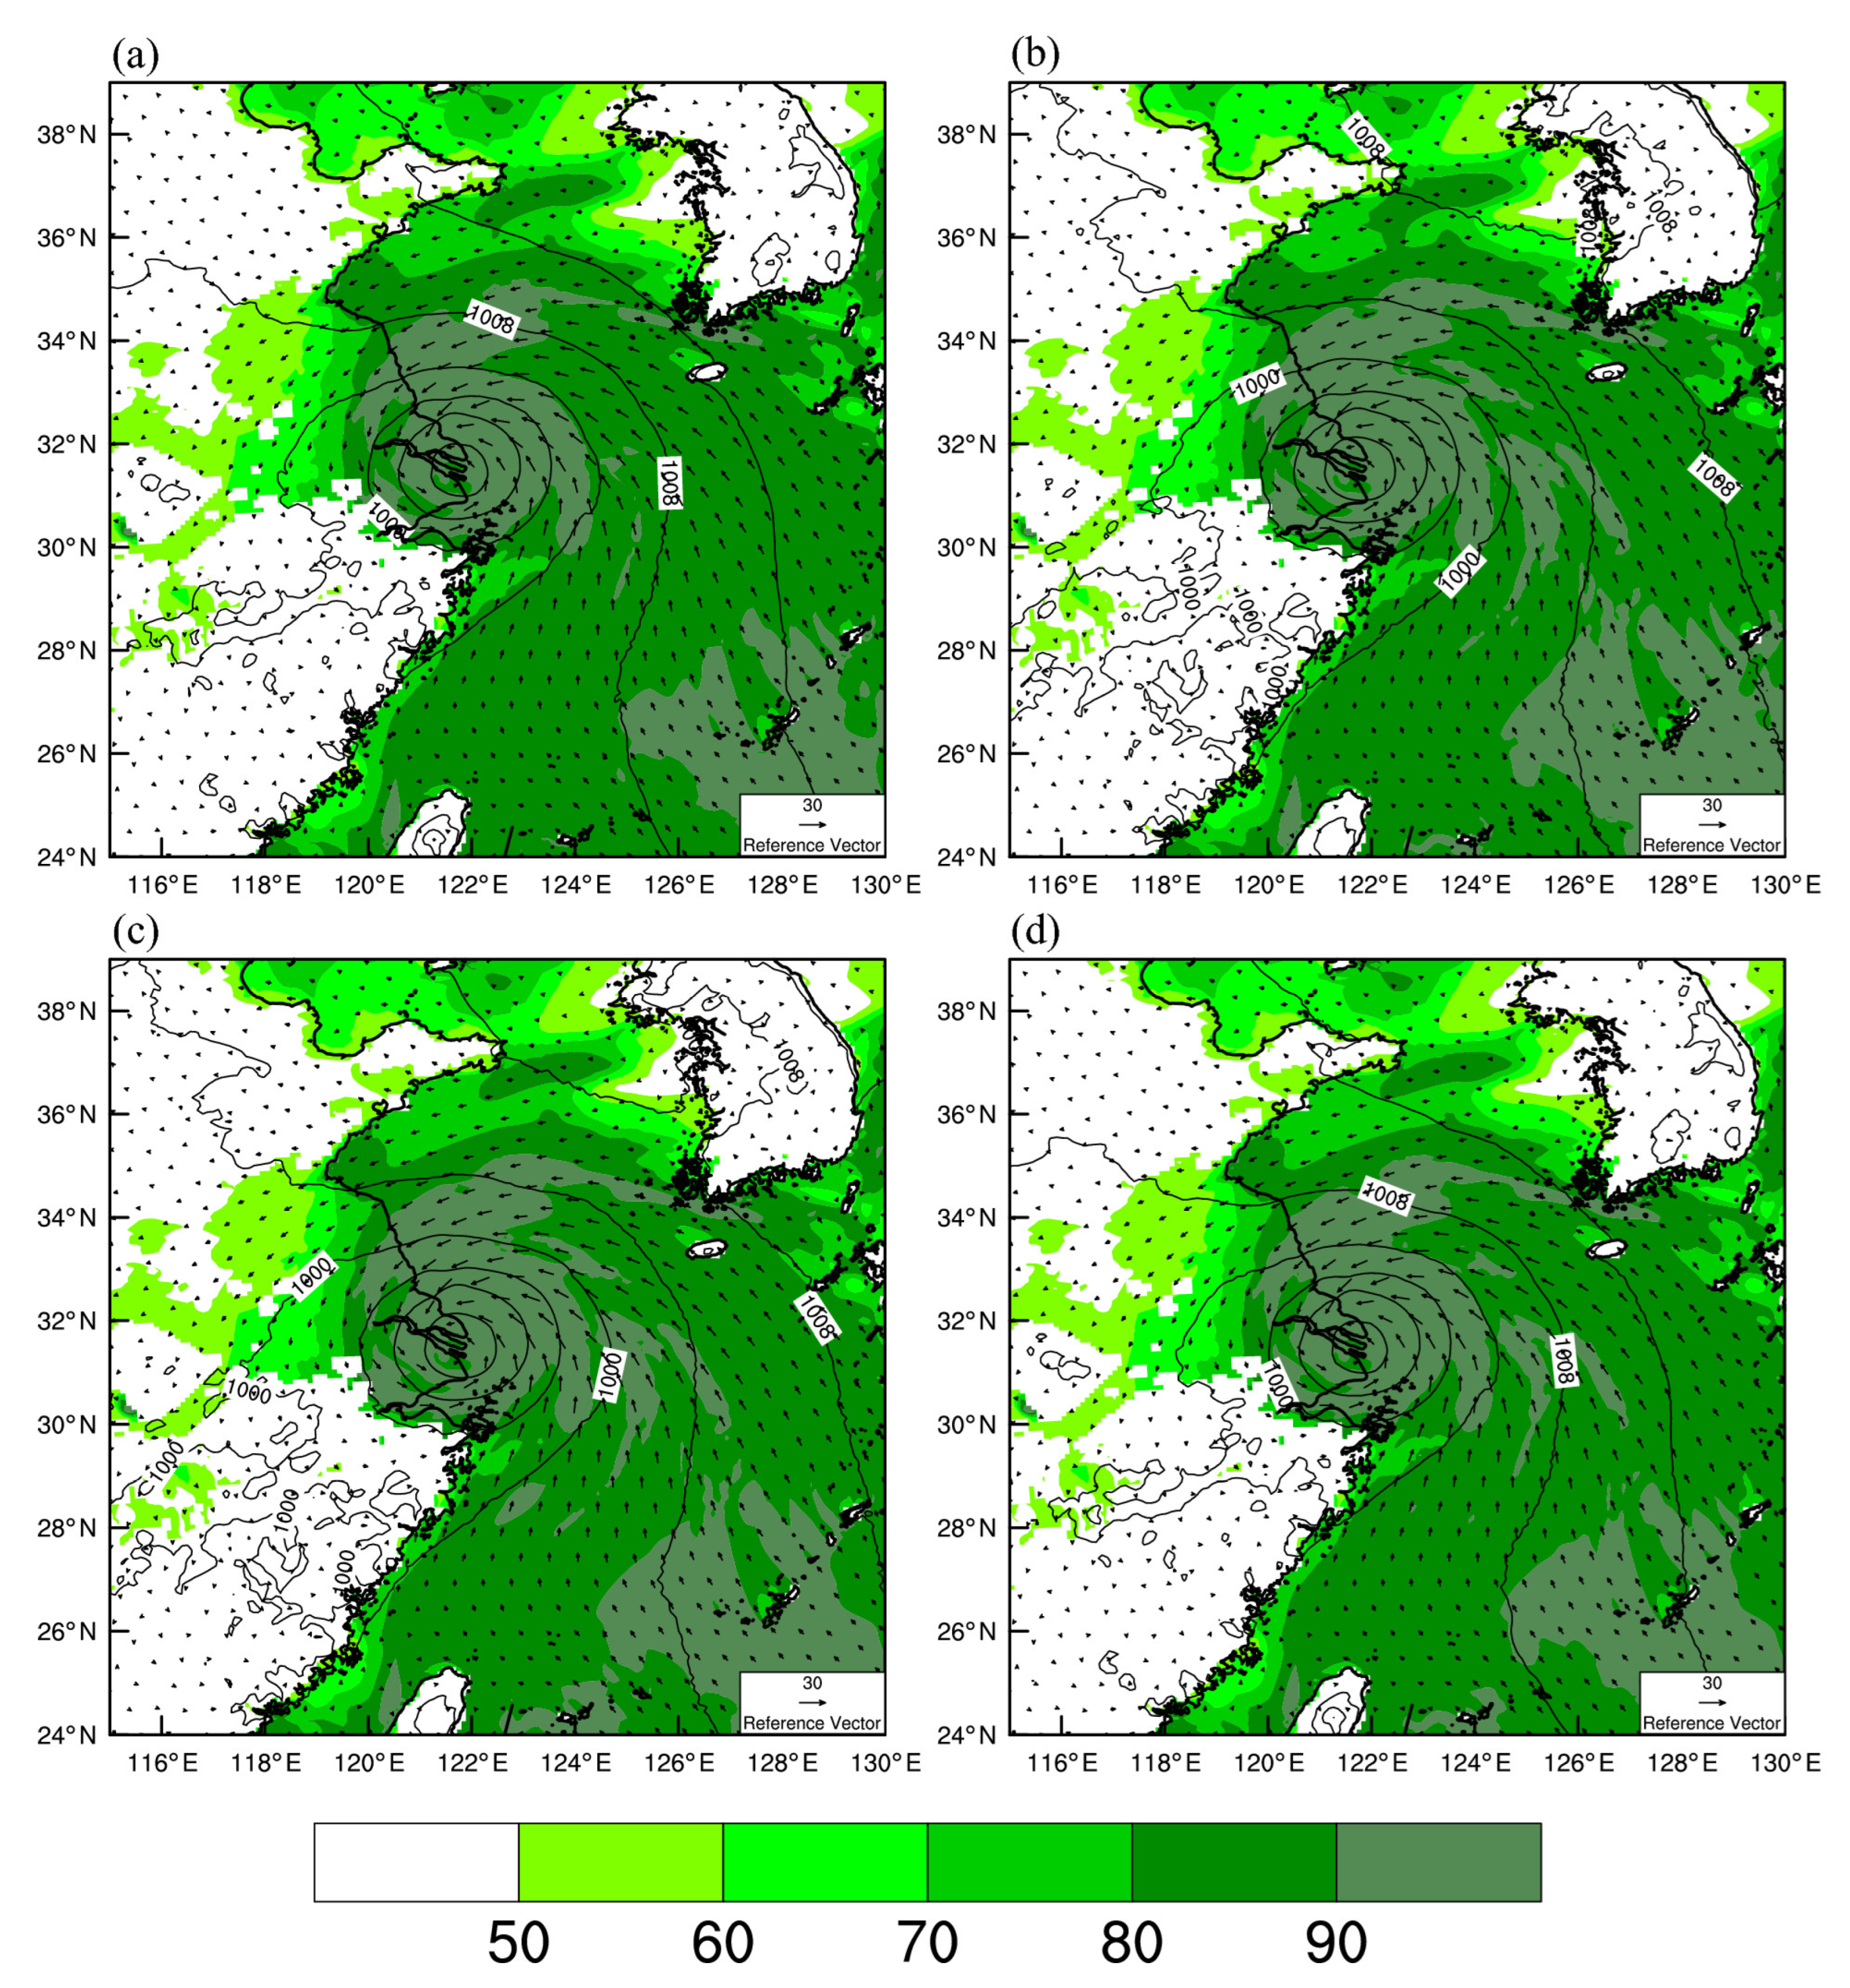
Figure 2 shows the observed brightness temperature (BT) minus the simulated BT based on the background (observation minus background, OMB) and the observed BT minus the simulated BT from the analysis field (observation minus analysis, OMA) for AMSUA, MHS, and MWHS2 after the bias correction at 0600UTC on 22 July 2018. From Figure 2a,c,e, it can be seen that there are large differences between the observed BT and the simulated BT in the background for all sensors. Compared with the humidity sensors, the deviation of the simulated radiance from the observation of AMSUA is smaller, which is reflected by the less anomalous values of the OMB. After assimilating the satellite radiance data, it can be seen from Figure 2b,d,f that the BT in the analyses is closer to the observation than that of the background field, while the values of OMA are notably close to 0 K. This indicates that the information from the observations is efficiently introduced to the analytical field by assimilating the radiance data from the microwave channels.
Figure 3 shows the bias corrected scatter plots of simulated BT with the RTTOV radiative transfer model and observed BT for AMSUA, MHS, and MWHS2 at 0600UTC on 22 July 2018. For the AMSUA data, the scatter points of the background field (Figure 3a) are mostly located above the diagonal, indicating that the overall BT of the scanned points in the background field is higher than the observed BT. In contrast, the scatter points of the analysis field (Figure 3b) are almost uniformly distributed on both sides of the diagonal. The root-mean-square error is also reduced from 0.540 to 0.257 K. For the MHS and MWHS2 radiance data, the scatter points in the background field (Figure 3c,e) are more discrete. It is noted that the root-mean-square errors of the scatter points of the analysis field (Figure 3d,f) are significantly reduced by more than 1 K compared to those of the background field.
Figure 4 shows the frequency distributions of OMB and OMA for AMSUA, MHS, and MWHS2 after the bias correction at 0600UTC on 22 July 2018. Before assimilating the satellite radiance data, the OMB of AMSUA peaks near −0.6 K, indicating that in general the BT of the scanned points in the background field is higher than the observed BT (Figure 4a). The peak of MHS is around 0.5 K, and the BT of the scanned points in the background field is low (Figure 4c). It is found that the peak of MWHS2 is near 0 K, which means its background matches best with the observation (Figure 4e). For all the radiance data, the overall distribution of the OMA in the analysis field approximately conforms to a normal distribution with the peak shifted to near 0 K (Figure 4b,d,f). These characteristics correspond well to the means and standard deviations of the scattered points in Figure 3.

4.2. TC Structure

Figure 5 shows the results of sea level pressure, 10 m wind speed, and the relative humidity at 100 m for the four assimilation experiments of AMSU, MHS, MWHS, and ALL at 0600UTC on 22 July 2018. The central pressure of the MHS (Figure 5b) and MWHS (Figure 5c) experiments is less than 988 hPa, which is lower than the central pressure of the AMSU experiment (Figure 5a) with stronger typhoon intensity. The typhoon intensity from the ALL experiment (Figure 5d) is similar to that of the AMSU experiment. Their results of the sea level pressure are rather consistent in terms of the TC’s intensity. For the moisture in the analyses, it is noted that the relative humidity exceeding 90% extends largely to the east side of the TC’s center in both the MHS and MWHS experiments. The increase of moisture to the east side is also found in the ALL experiment with intensity comparable to that of the AMSU experiment.

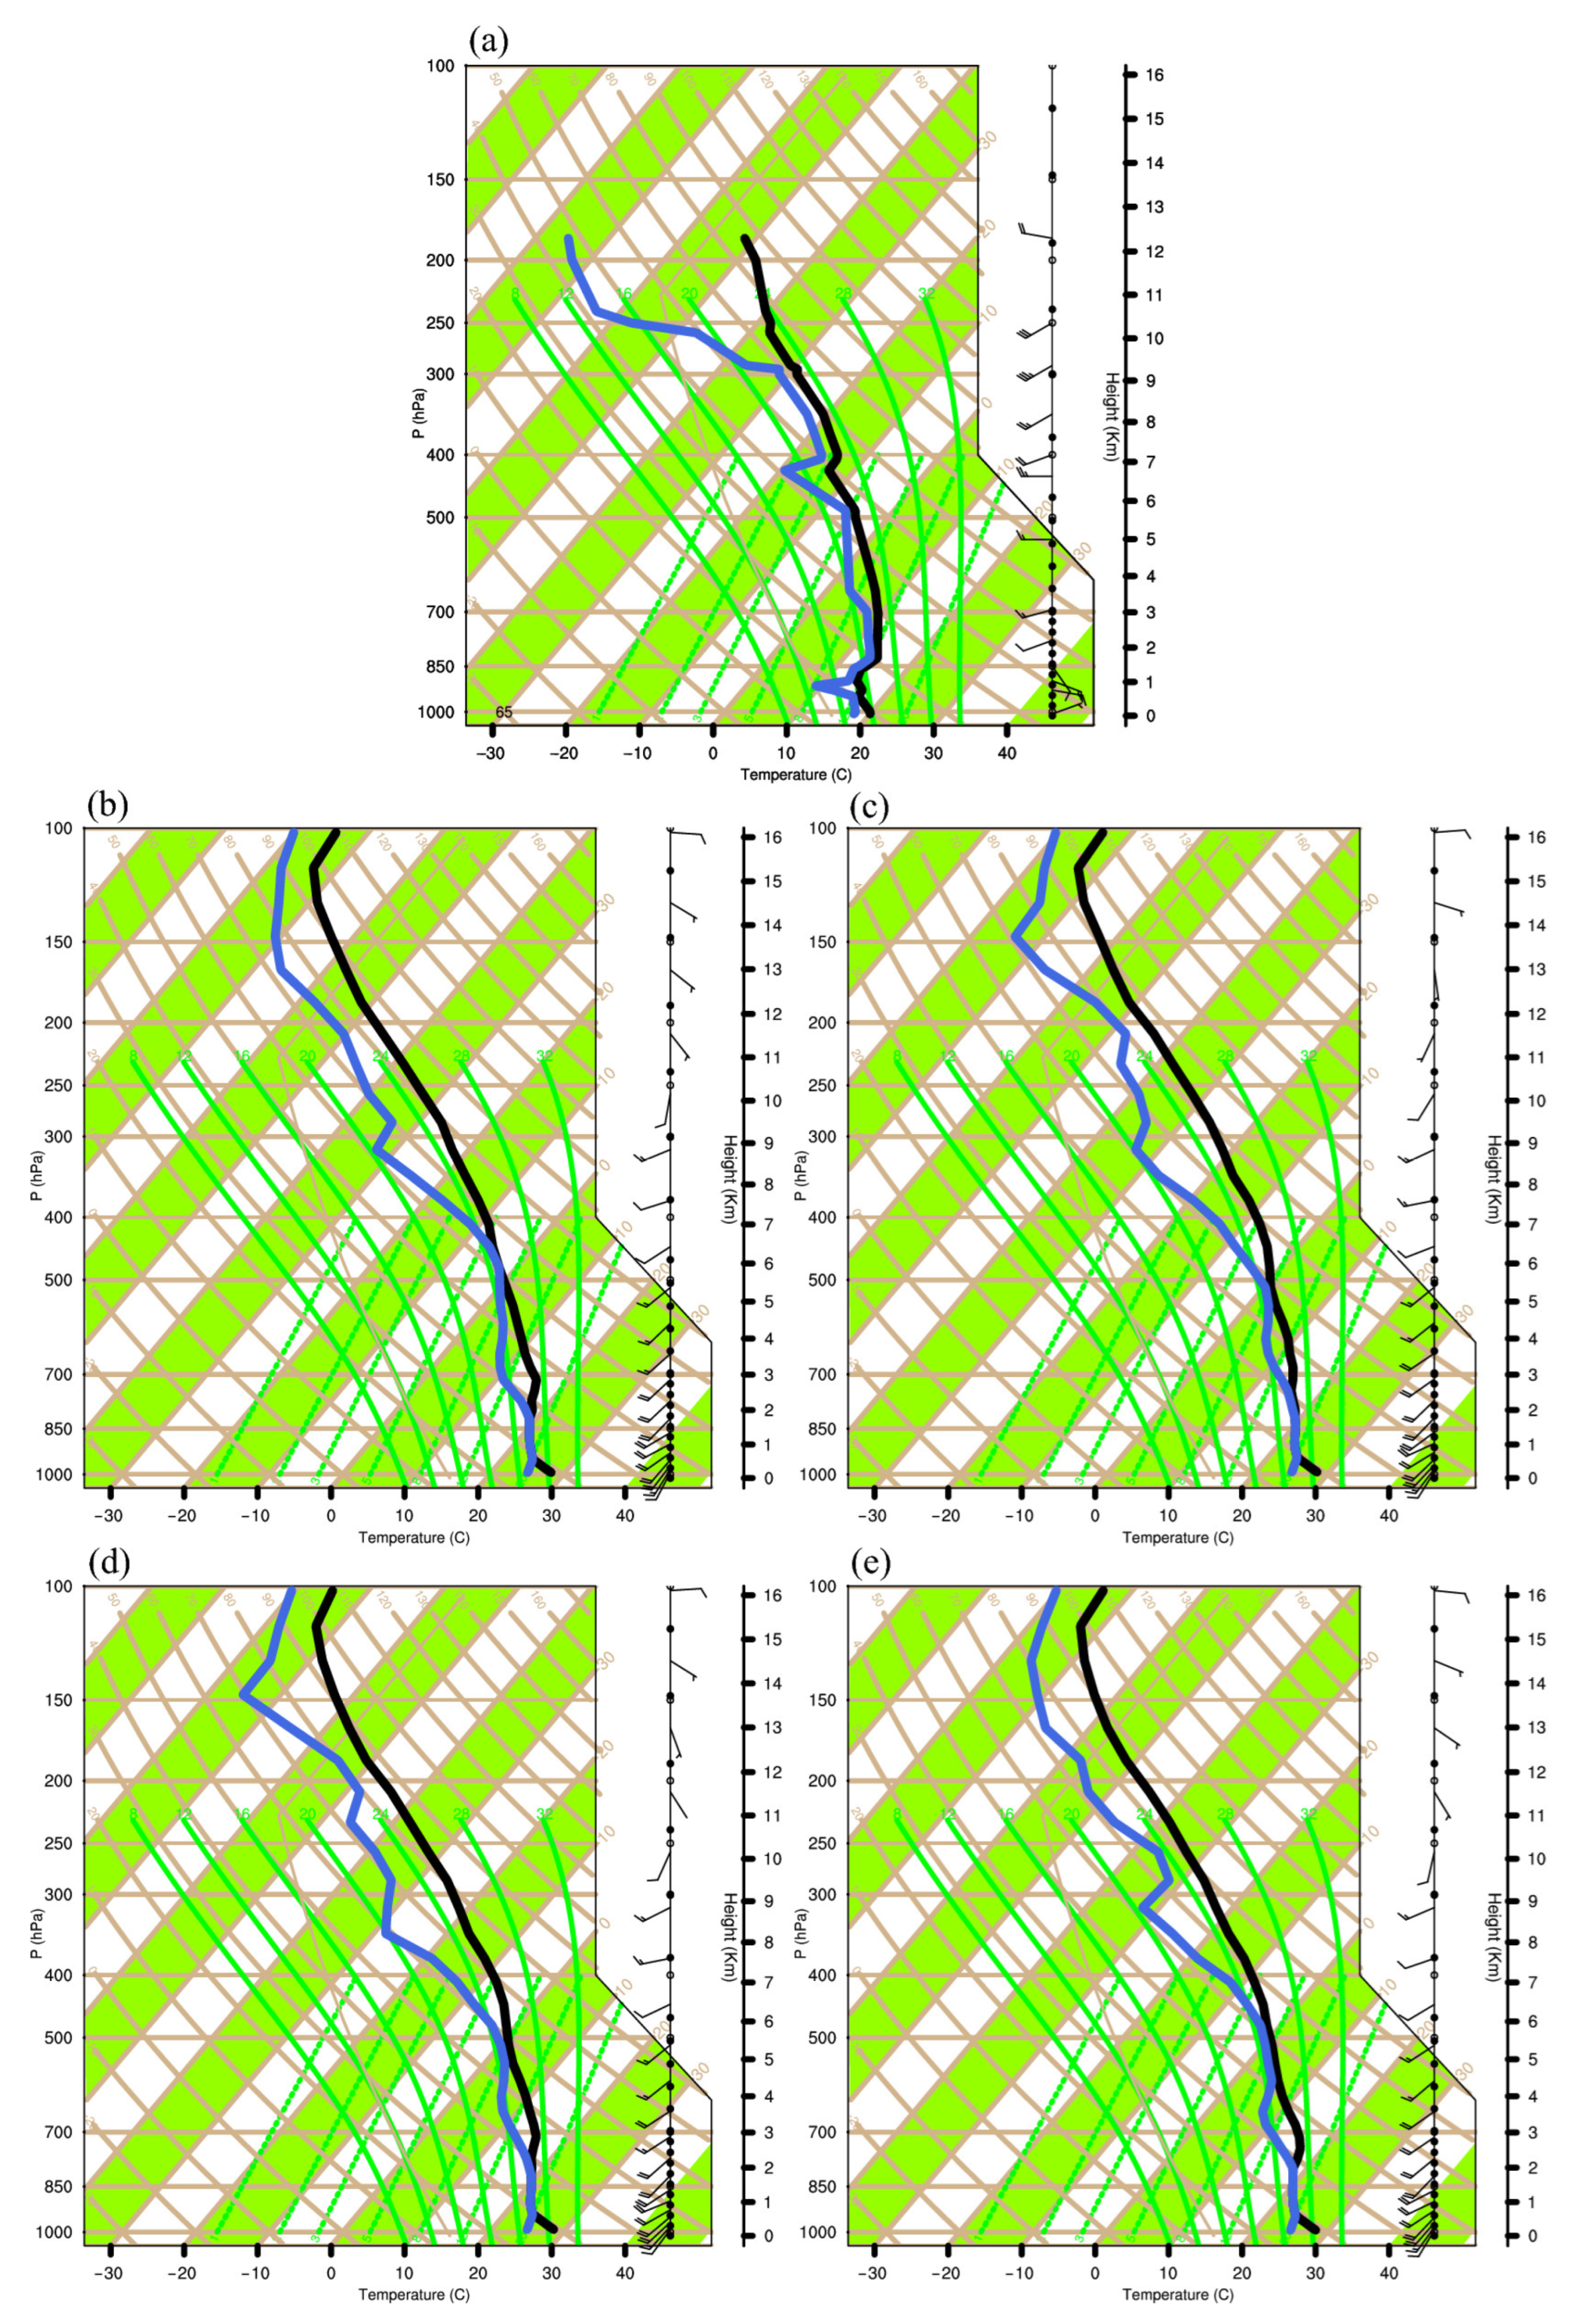
4.3. Skew-T Plot Analysis

Figure 6 shows the skew-T plots obtained from the 6-h forecast valid at 1200UTC on 22 July 2018 for the AMSU experiment (Figure 6b), the MHS experiment (Figure 6c), the MWHS experiment (Figure 6d), and the ALL experiment (Figure 6e) at Shanghai station (31.4° N, 121.46° E). The actual sounding data are from the China Meteorological Data Service Centre. The saturated layers in the AMSU, MHS, and MWHS experiments are around 500 hPa and 850 hPa. For the ALL experiment, the saturated layer at 850 hPa is not much different from the rest of the experiments. However, another section of the saturated layer in the ALL experiment starts at about 500 hPa and extends to about 650 hPa, which is deeper compared to the saturated layer obtained in the other experiments. This indicates that the humidity condition simulated by the ALL experiment has been changed to some extent and it becomes more saturated than other experiments especially from 500 to 600 hPa.

4.4. Root-Mean-Square Error of Forecast Fields

Figure 7 shows the results of the comparison between the forecast fields and the 0.25° FNL reanalysis data at 1800 UTC on 23 July. The RMSE of the horizontal winds (U, V) for the four experiments is shown in Figure 7a,b, respectively, in which the highest RMSE of each experiment is near the troposphere at 200 hPa. For U, the ALL experiment performs well at lower and upper layers with the lowest RMSE. In terms of V, apart from the lower and upper layers, the ALL experiment also has the lowest RMSE in the middle layer. For the temperature field (Figure 7c), the lowest RMSE for the ALL experiment is found from 200 to 1000 hPa, which is particularly evident from 250 to 700 hPa. Besides, there are large differences between the results of the AMSU experiment and the MHS experiment, while Xie et al. (2016) [37] found that the differences of vertical profiles of forecasted temperature are small between the AMSUA and the AMSUB, which is the predecessor of MHS. Figure 7d shows the RMSE of the specific humidity. It can be seen that the errors of both the ALL experiment and the MHS experiment are rather small. However, the lowest RMSE for the ALL experiment can be witnessed more clearly from 700 to 925 hPa. Overall, the RMSE of some forecast variables for the ALL experiment are significantly lower than that of the remaining three experiments.
In addition, the mean RMSE, bias, and correlation coefficient of all experiments at 1800 UTC on 23 July 2018 are listed in Table 2. It can be found that the performance of the ALL experiment for the three metrics is the best with the lowest mean RMSE and absolute bias, along with the highest correlation coefficient. The ALL experiment combines the advantages of all sensors with generally the highest forecast skill.

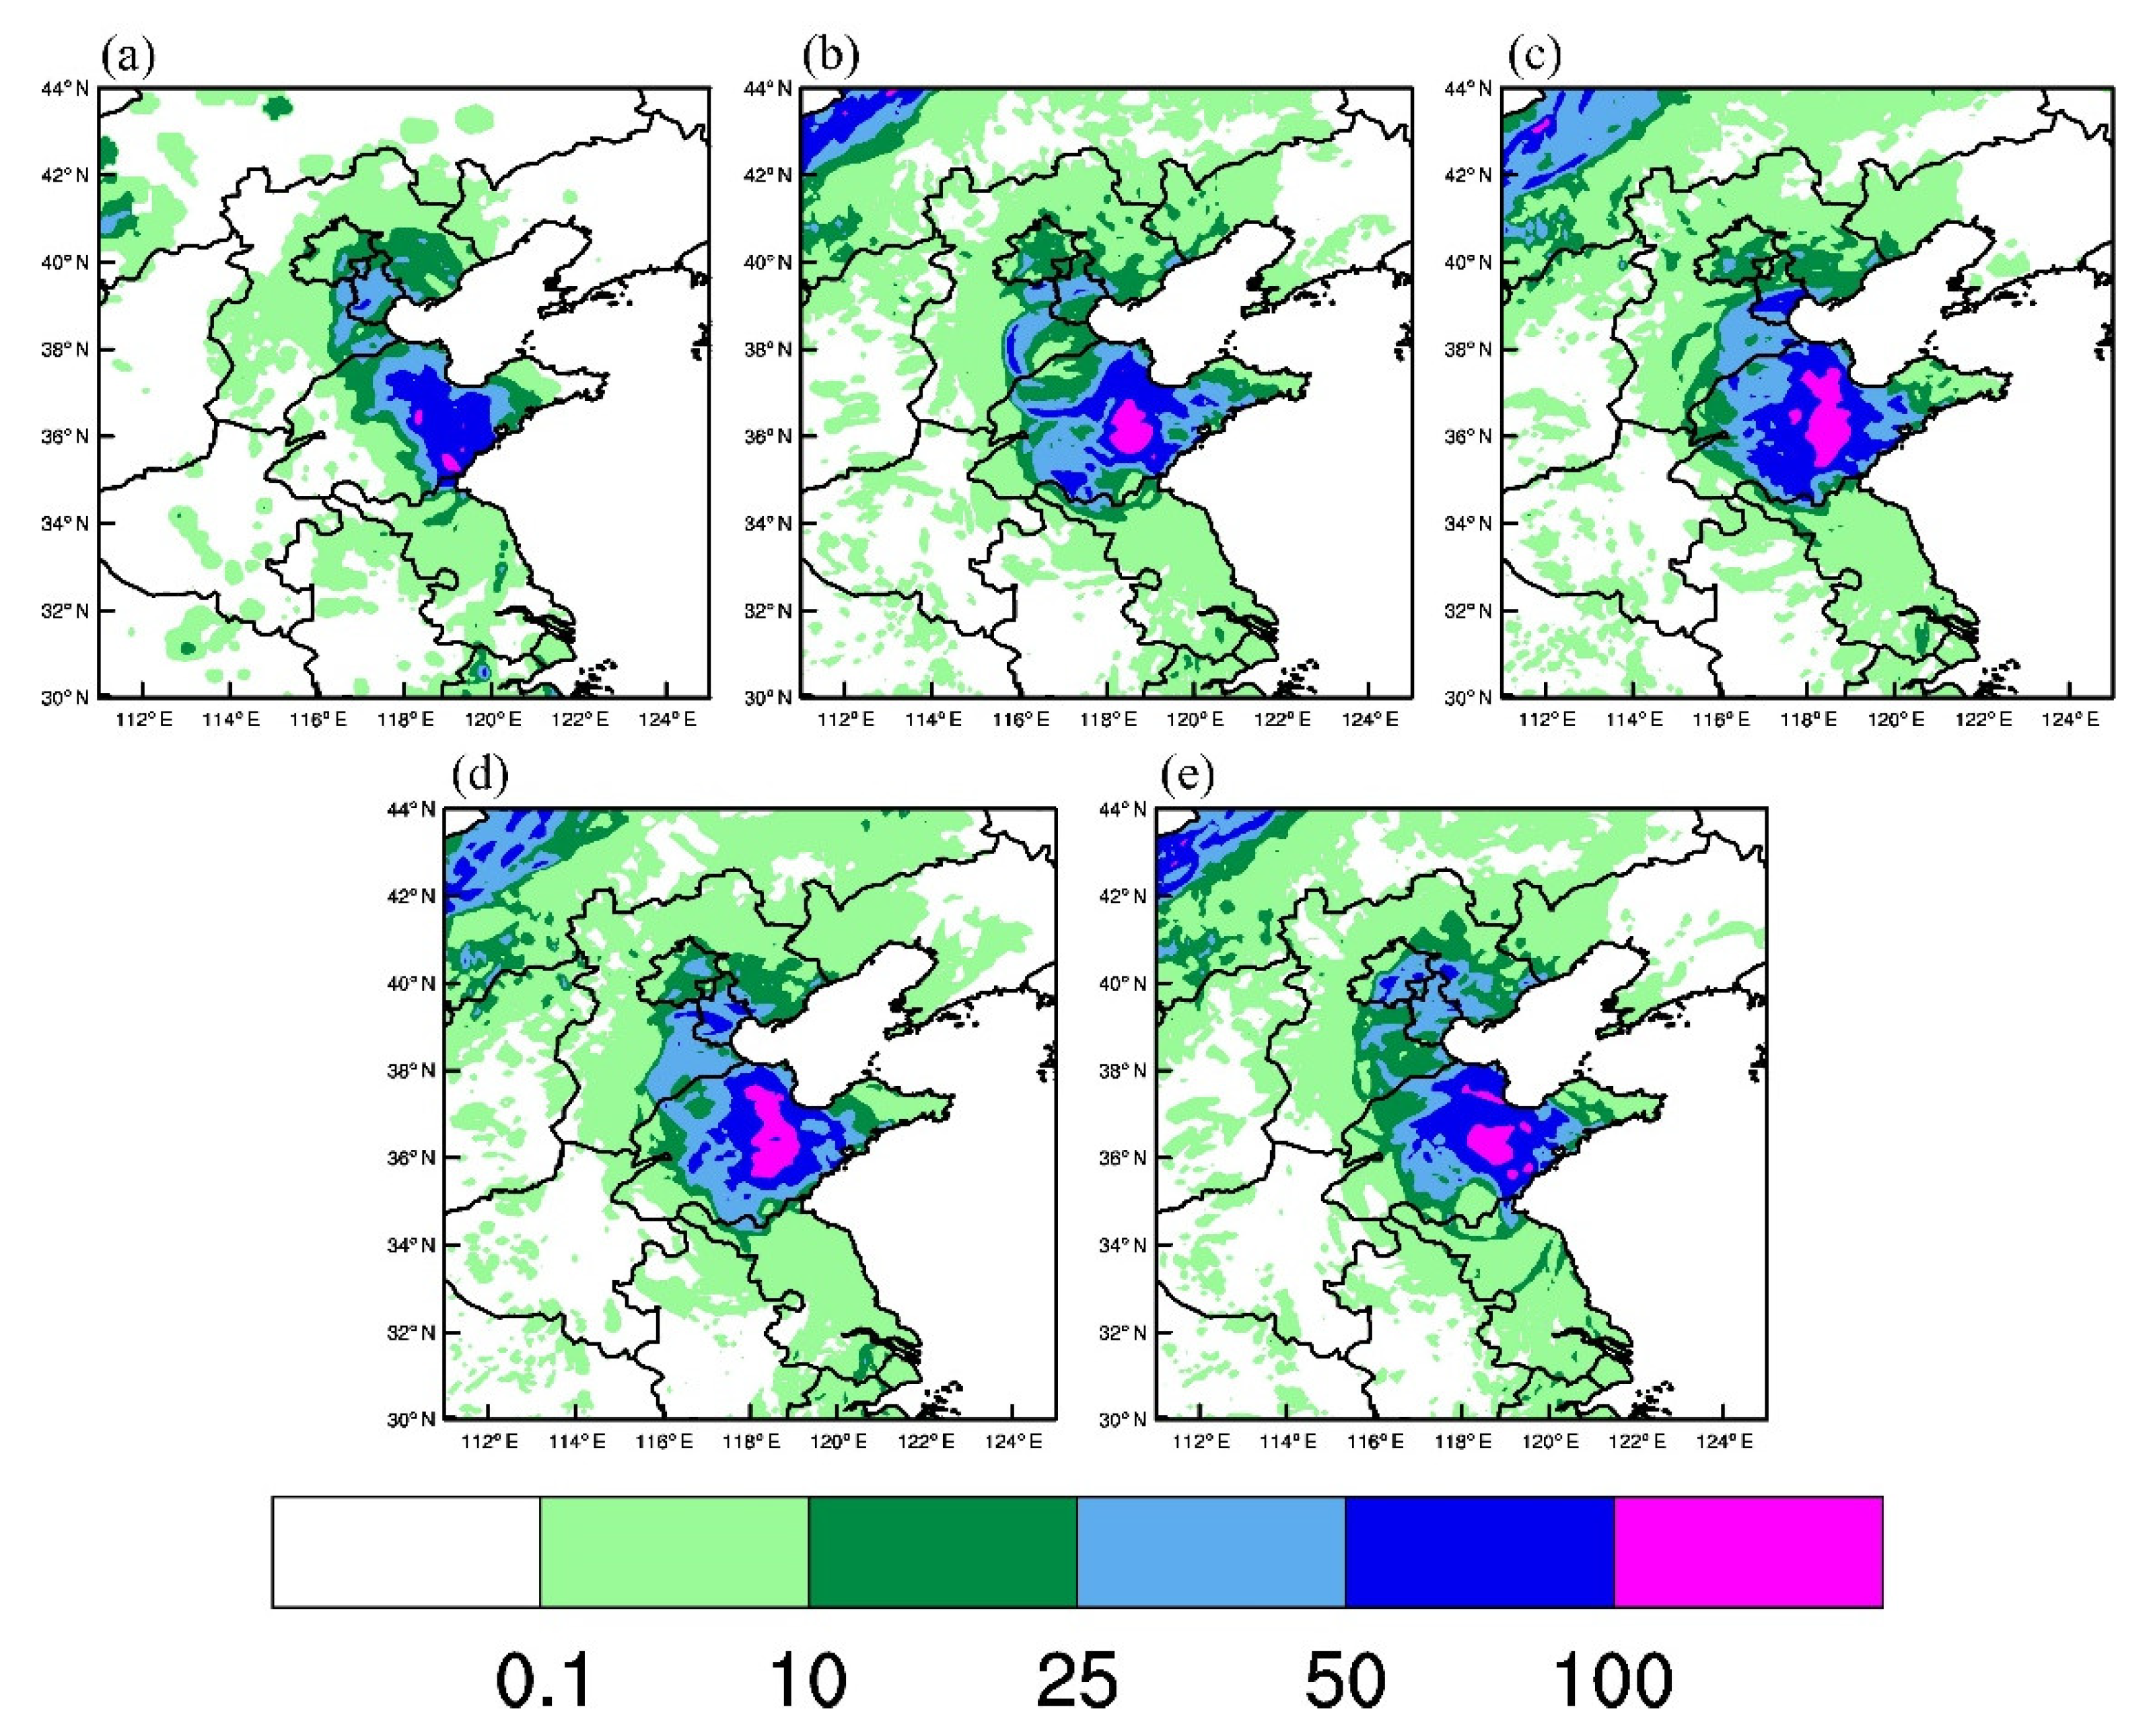
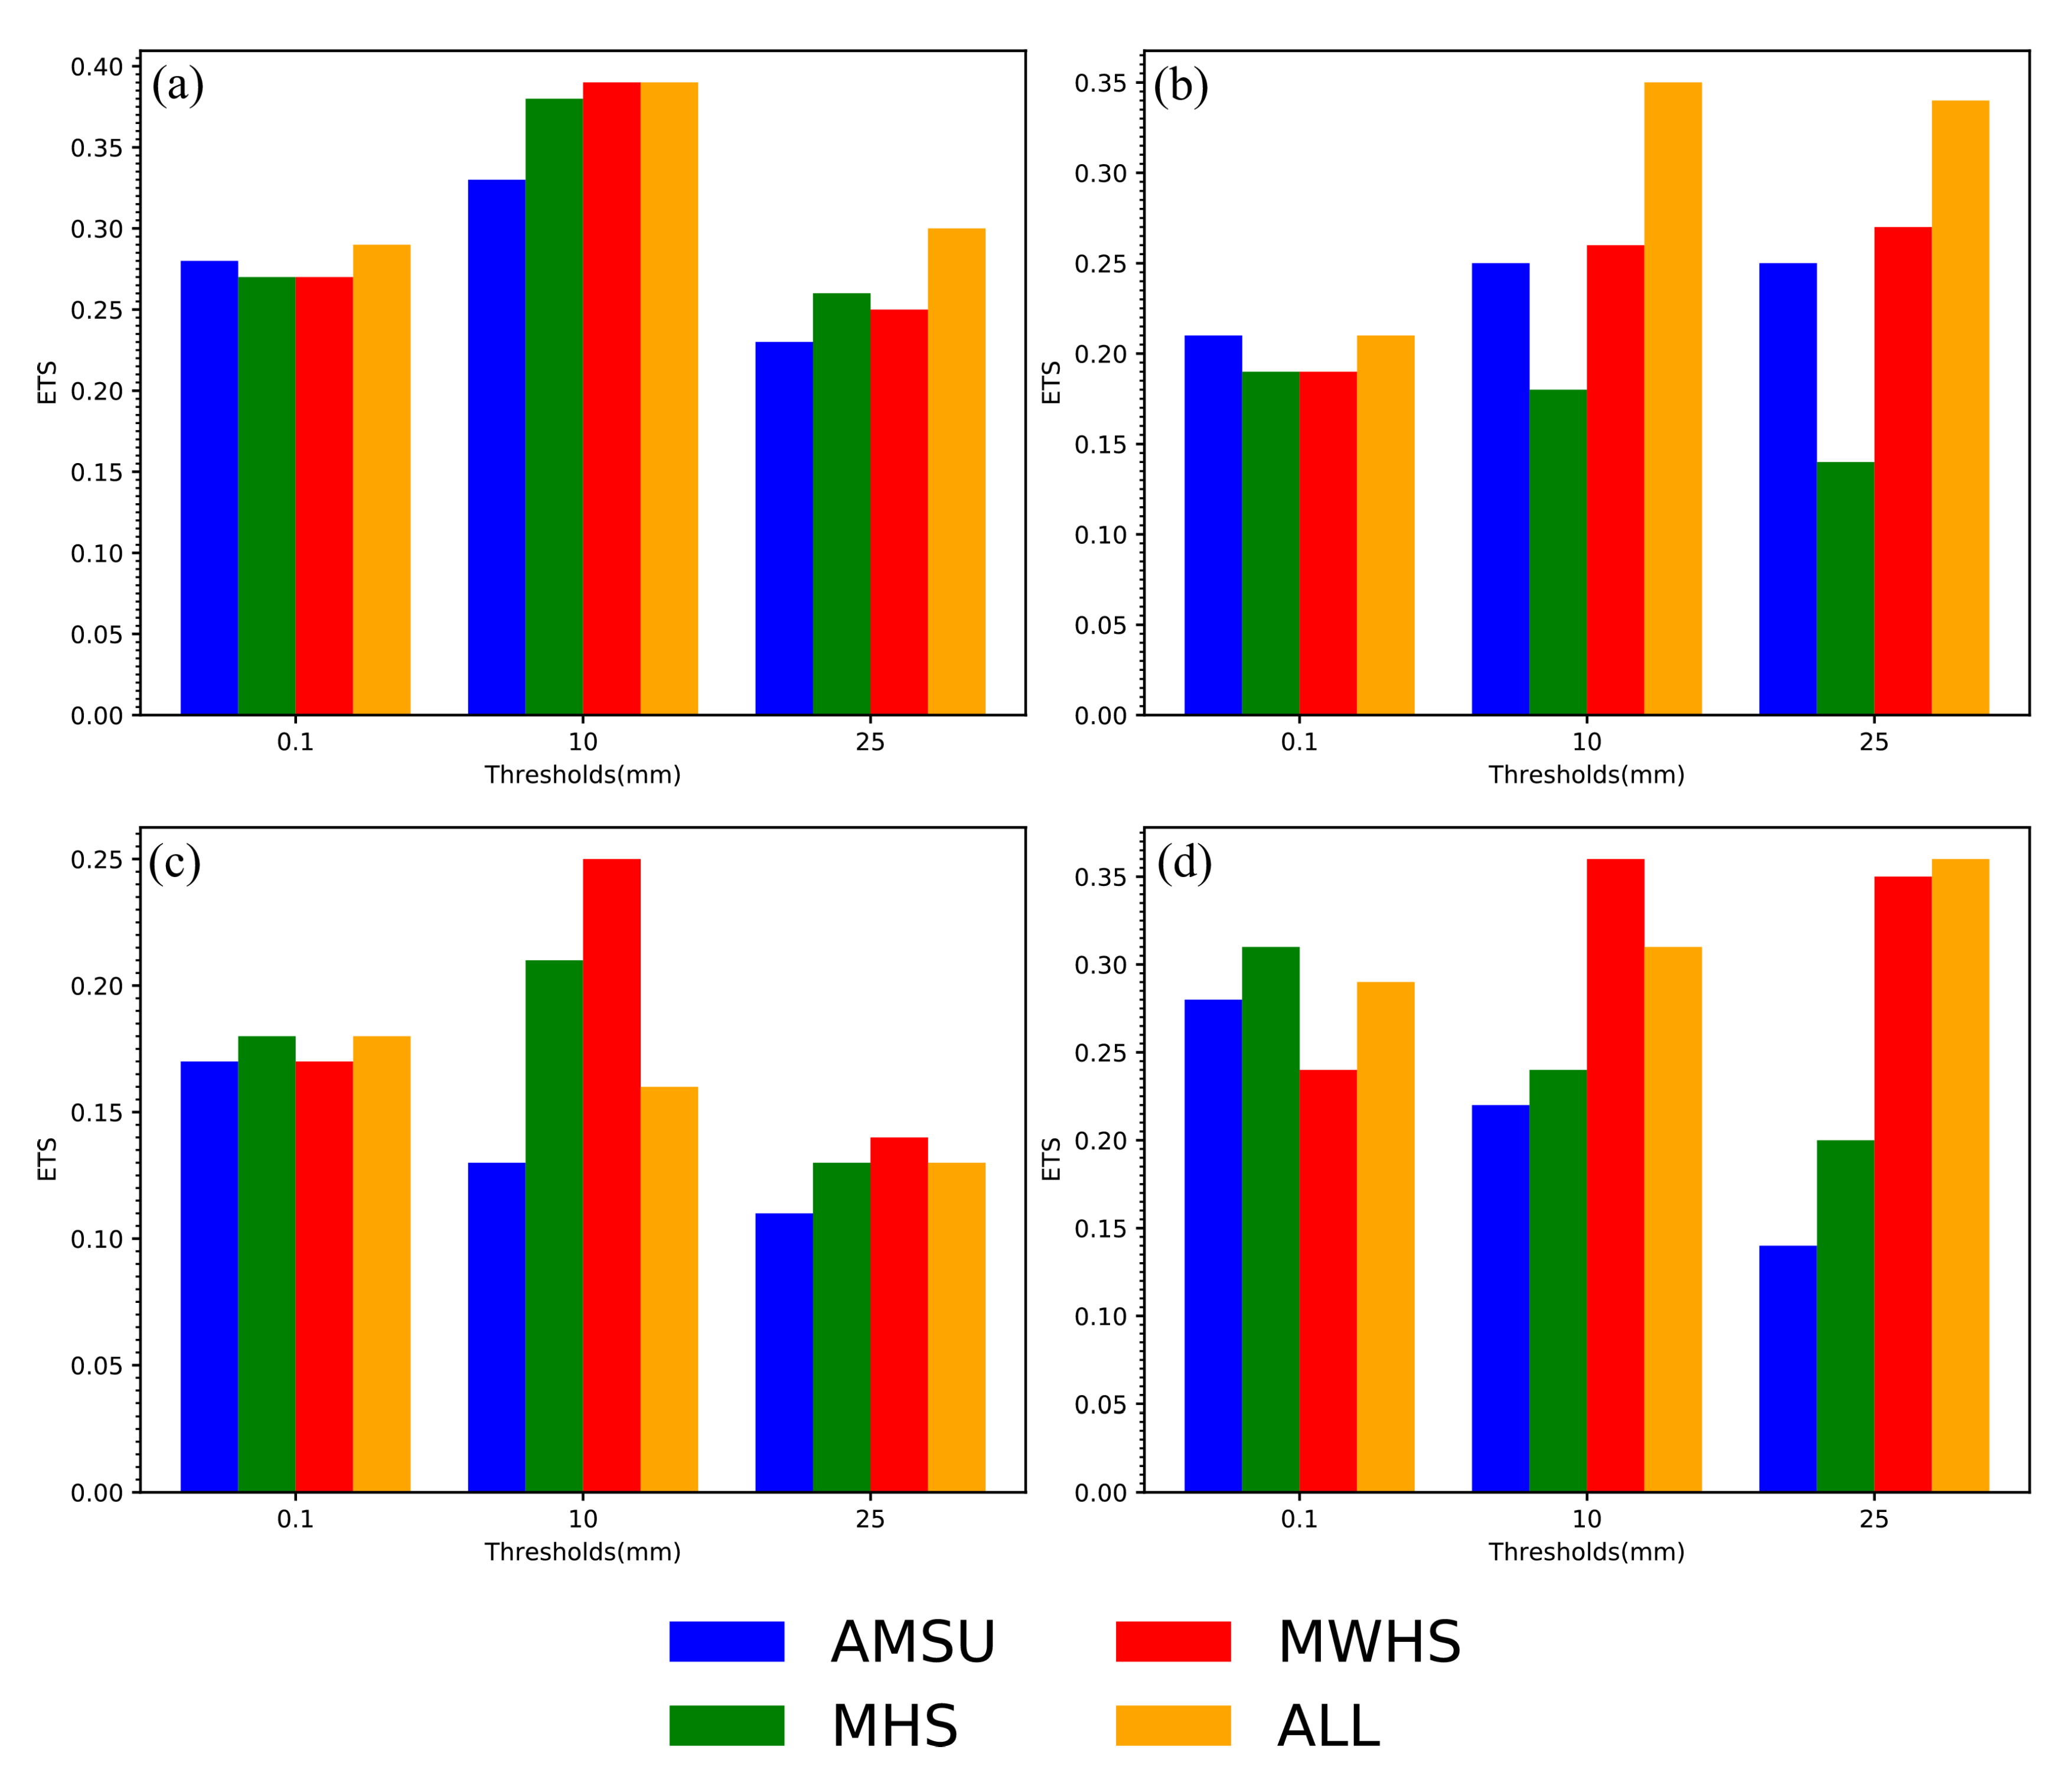
4.5. Precipitation Forecasts

Figure 8 shows the 24-h accumulated rainfall results obtained from the observation and all experiments from 0000UTC on 23 July to 0000UTC on 24 July 2018. Precipitation data are acquired from the China Meteorological Data Service Centre. The results obtained from the MHS experiment (Figure 8c) and MWHS experiment (Figure 8d) have a large difference to the observation (Figure 8a) at the typhoon center near Shandong, as well as a large degree of misrepresentation. The results obtained from the ALL experiment (Figure 8e) match better with the observation by reflecting the characteristic of discontinuous precipitation along the typhoon track with magnitude above 100 mm. The distribution of rainbands in the typhoon center is to the east, and the distribution characteristics of rainbands are better represented in the ALL experiment. Both the MHS and MWHS experiments obtain 24-h accumulated precipitations stronger than the observation, while the ALL experiment better depicts the location and intensity of precipitation than other experiments do. It should be mentioned that the AMSU experiment yields lower precipitation magnitude that is the most consistent with the observation. This result indicated that the improved precipitation in the ALL experiment can be largely accredited to the AMSUA data.
Figure 9 shows the equitable threat score (ETS) for the accumulated 24-h rainfall of the four experiments from 0000UTC on 23 July to 0000UTC on 24 July 2018. The score objectively reflects the forecast performance of the four experiments with quantitative metrics. Generally, the MHS experiment shows degraded results compared to that of the AMSU experiment. On the other hand, consistent improvement of precipitation forecast skill is found from the MWHS experiment. The highest scores for the ALL experiment can be found in Figure 8 for all precipitation thresholds except for the threshold of 100 mm. To be specific, the ALL experiment has much higher scores for the thresholds of 10 to 50 mm than the MWHS experiment does.
To further evaluate the precipitation results, ETSs with a shorter time window, 6 h, are presented in Figure 10. From 0000UTC to 0600UTC (Figure 10a), the ALL experiment achieves the highest score for all thresholds, especially for the 25 mm threshold. From 0600UTC to 1200UTC (Figure 10b), it can be found that the scores of the ALL experiments are much higher than the rest of the experiments except for the 0.1 mm threshold. Specifically, the score of the ALL experiment is equal to that of the AMSU experiment and they are higher than the remaining experiments at 0.1 mm threshold. From 1200UTC to 1800UTC (Figure 10c), the score of the MWHS experiment is relatively higher, while the score of the ALL experiment performs badly at 10 mm threshold. From 1800UTC to 2400UTC (Figure 10d), it can be seen that the score of the ALL experiment is at a comparatively high level, especially at the 25 mm threshold. The results in the four phases show that, although in some cases the ALL experiment is of poor performance, the ETSs of the ALL experiment in general are superior to those of other three experiments. Therefore, the assimilation of multi-source satellite radiance has the ability to improve the rainfall forecast skill by taking advantage of all sensors. The positive effects of MWHS2 over MHS are likely provided by the temperature channels (also sensitive to low-level humidity) centered at 118 GHz.

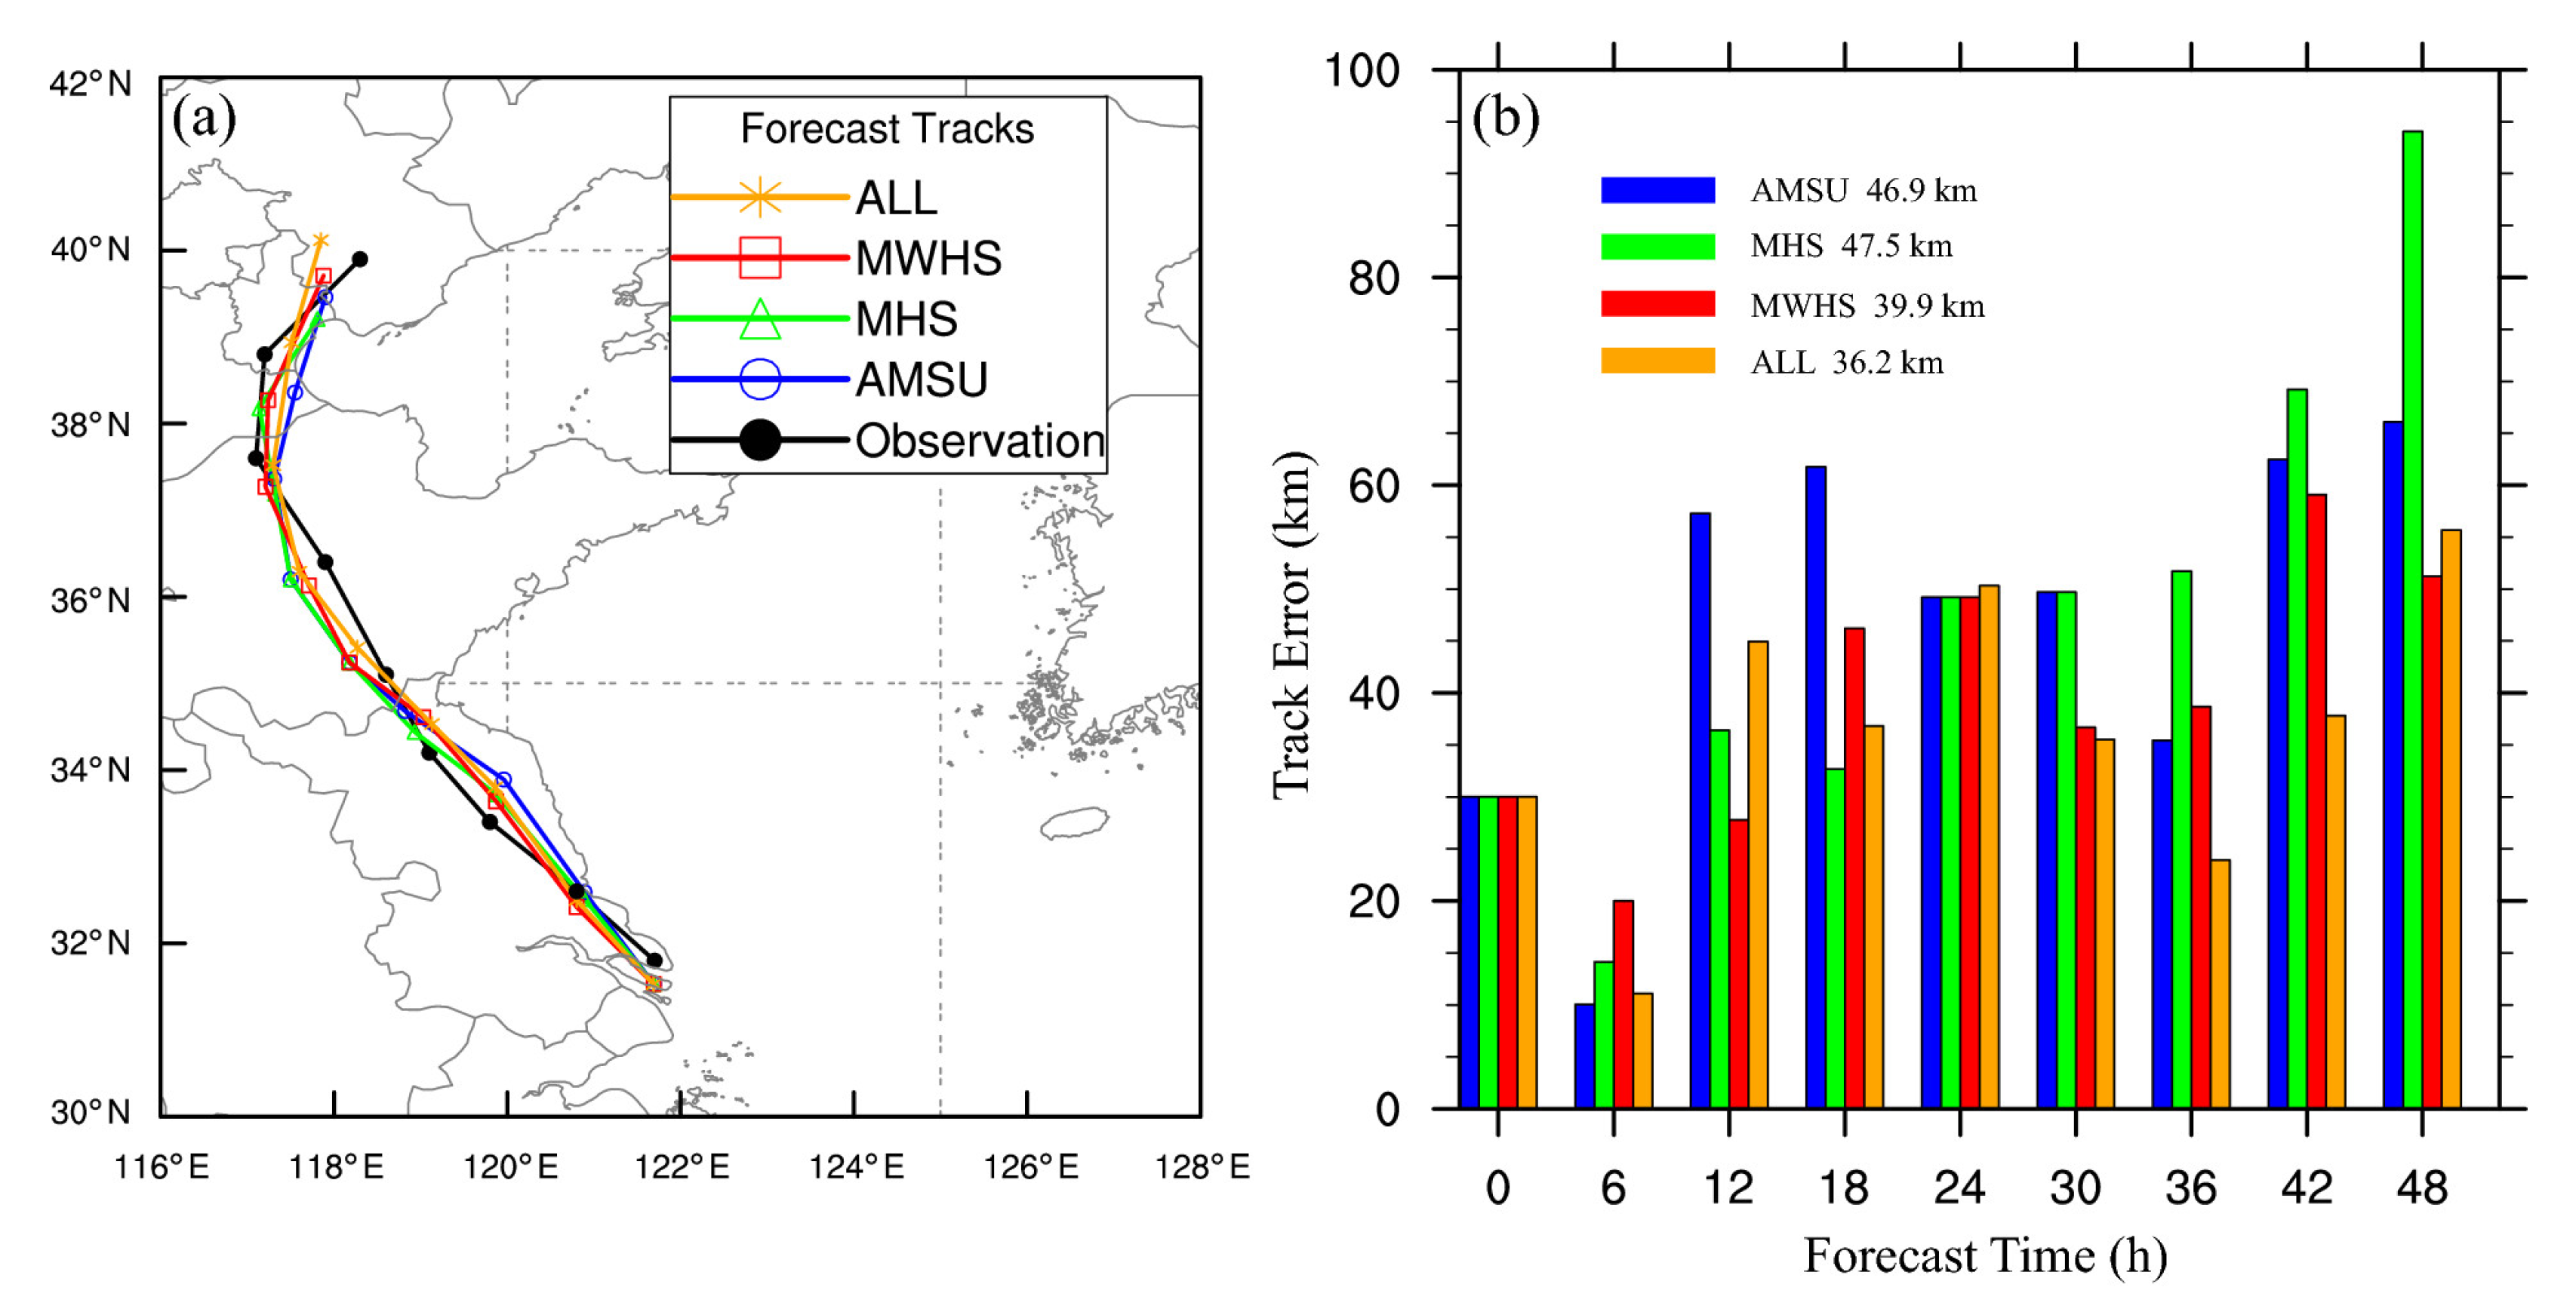
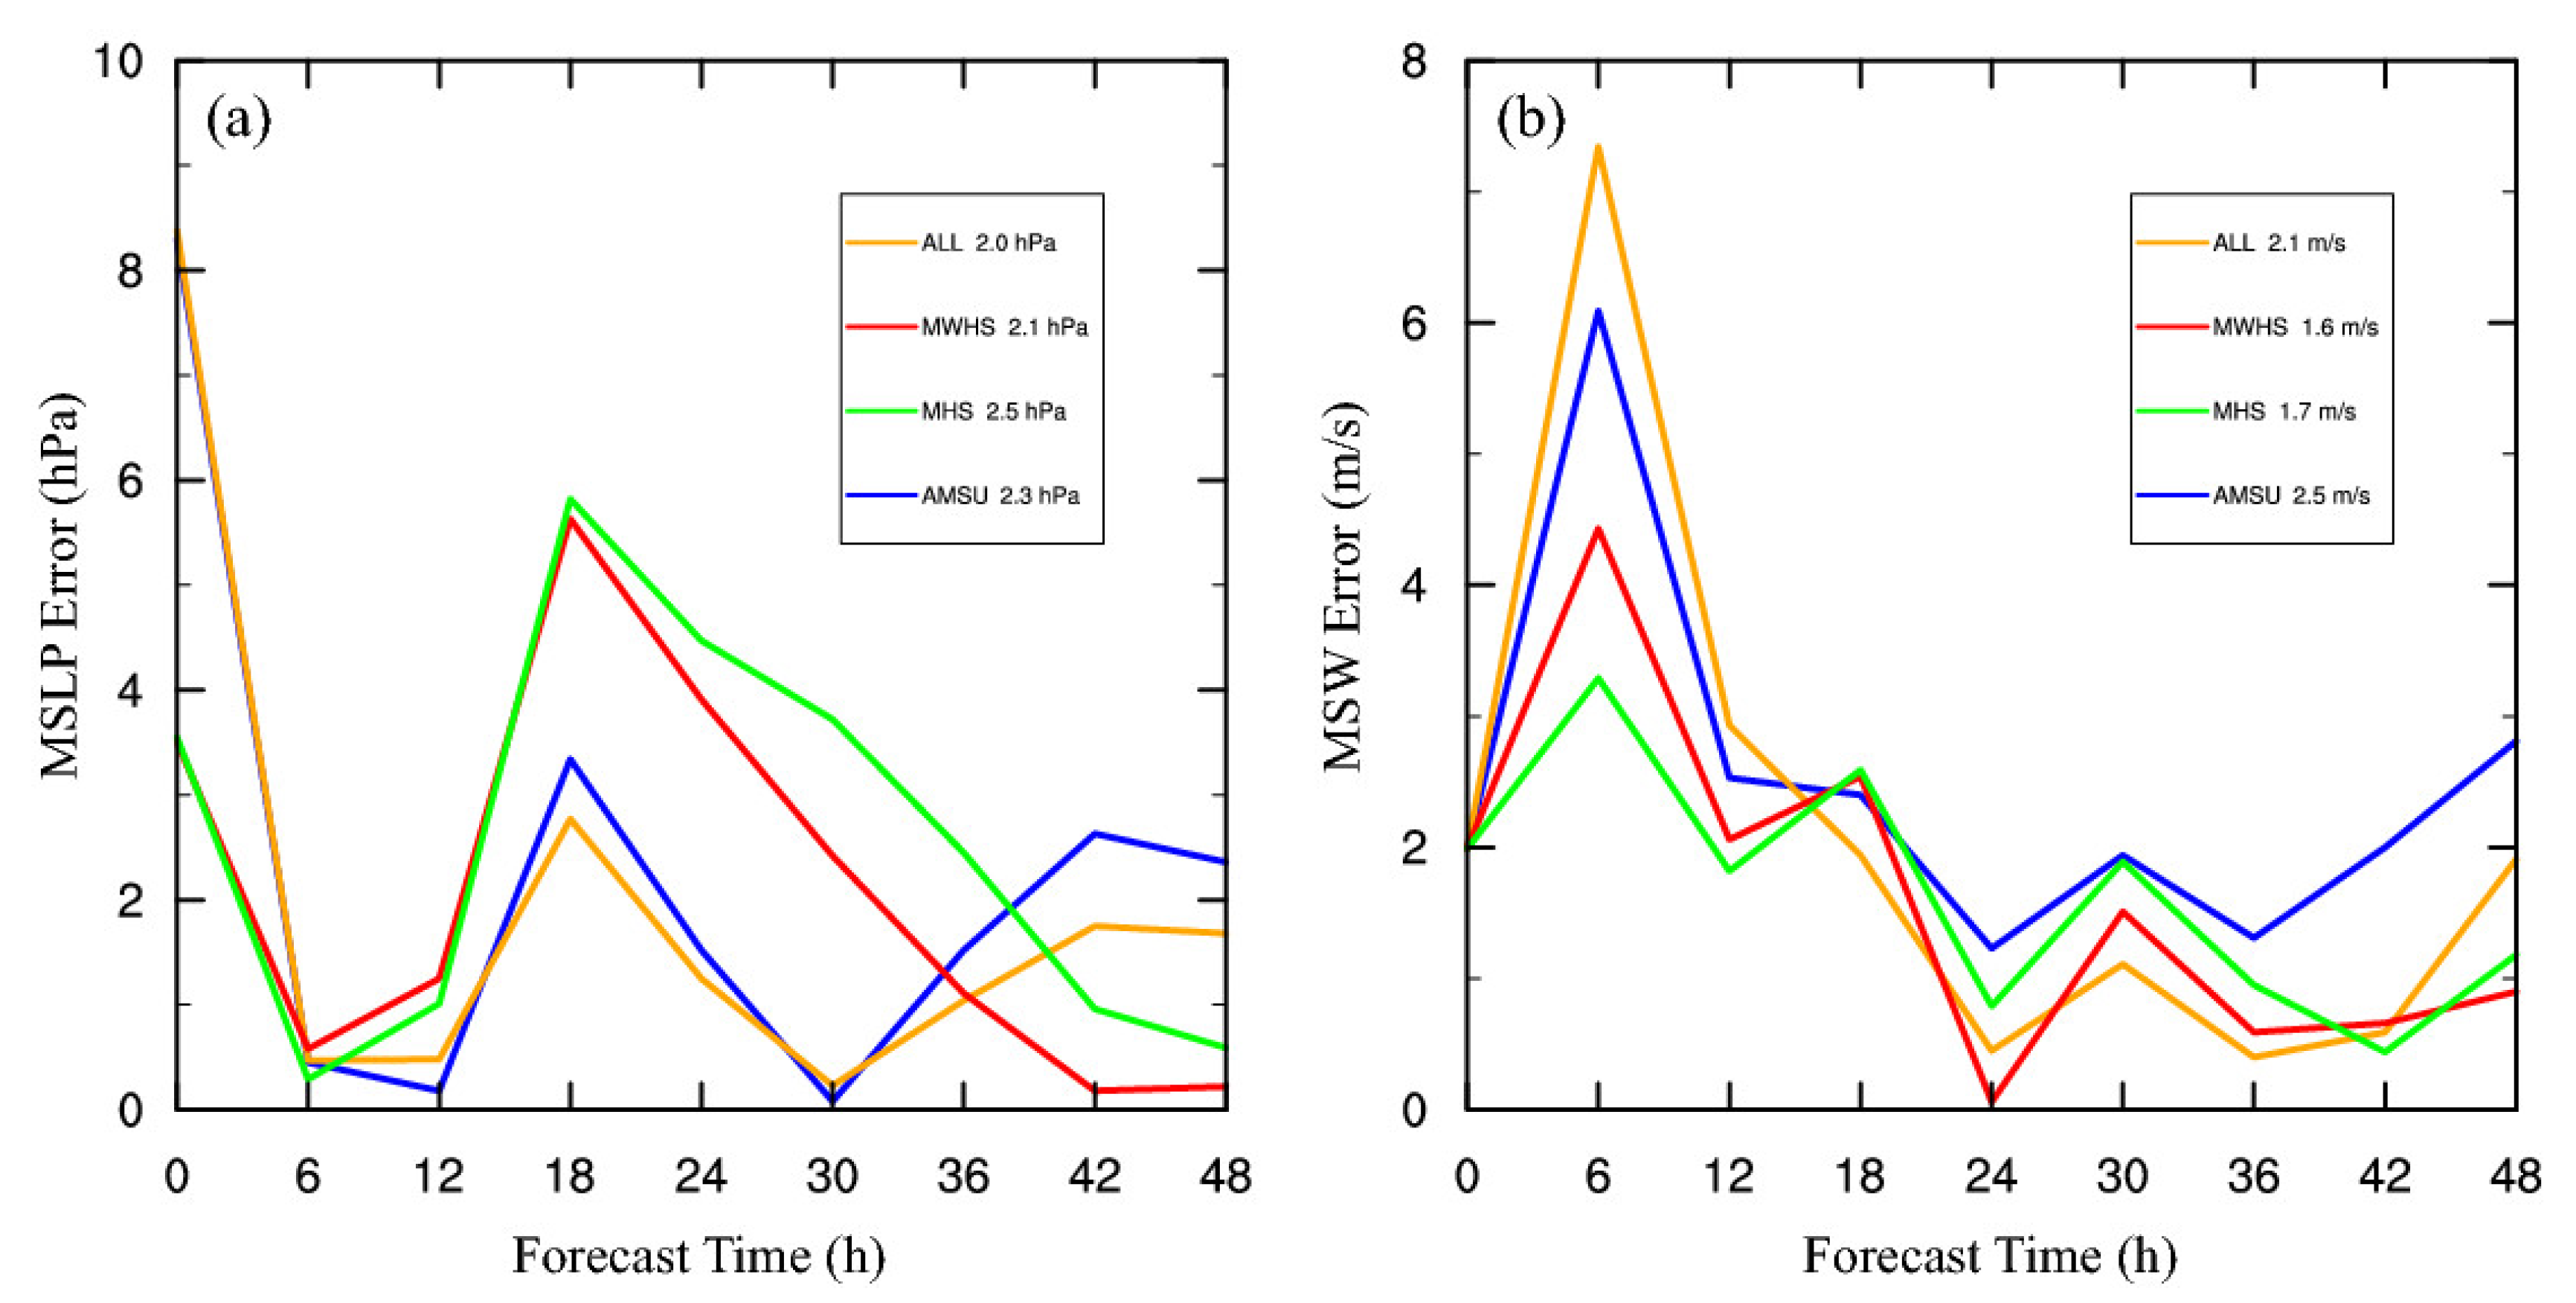
4.6. The Track and Intensity

Figure 11 shows the 48-h track forecast of Typhoon Ampil from the experiments initialized at 0600UTC on July 22 and the best track data along with the track error with different leading times. In the track of Typhoon Ampil (Figure 11a), it can be found that the track of the typhoon obtained from the ALL experiment is the most consistent with the actual observed track. The results of the track error (Figure 11b) show that the ALL experiment provides lower track error than the other three experiments for most of the time. Specially, notable reduced track errors are witnessed in the final 12 h from the ALL experiment when compared to the AMSU and MHS experiments. The maximum of the track error for the ALL experiment is less than 57 km, which is obviously smaller than those from other experiments. The average track errors for the various experiments are also indicated in Figure 11b. It can be seen that the averaged track error is reduced in the MWHS experiment by roughly 10 km compared with those from the AMUS and MHS experiments. The averaged track error further decreased in the ALL experiment by more than 3 km compared with that of the MWHS experiment.
Figure 12 shows the results of the 48-h absolute MSLP error initialized at 0600UTC on July 22 as well as the absolute MSW error for the four experiments. In Figure 12a it can be seen that the ALL experiment and AMSUA experiment yield generally lower MSLP errors after 6-h forecast, possibly accredited to the balanced model variables after model integration. To be specific, the MSLP error of the ALL experiment is the lowest, especially at 18, 24, and 36 h. For the MSW, there are overall higher errors from the AMSU experiment, especially for the latter 18 h in Figure 12b. The MWHS and MHS experiments are able to outperform the AMSU experiment except for the 18-h result. It is found that the MSW error of the ALL experiment is the lowest of the four experiments when the model integration time is 18 h, 30 h, and 36 h. The mean value of the MSLP error in Figure 12a shows that the ALL experiment has the lowest averaged mean error of 2.0 hPa, while the MWHS experiment yields the lowest MSW error of 1.6 m/s. It is noted that the ALL experiment yields a high MSLP error at the beginning of the forecast, which is likely caused by the incompatible thermodynamic field after the multi-source data assimilation. This imbalance will be alleviated after numerical weather-prediction model integrations.

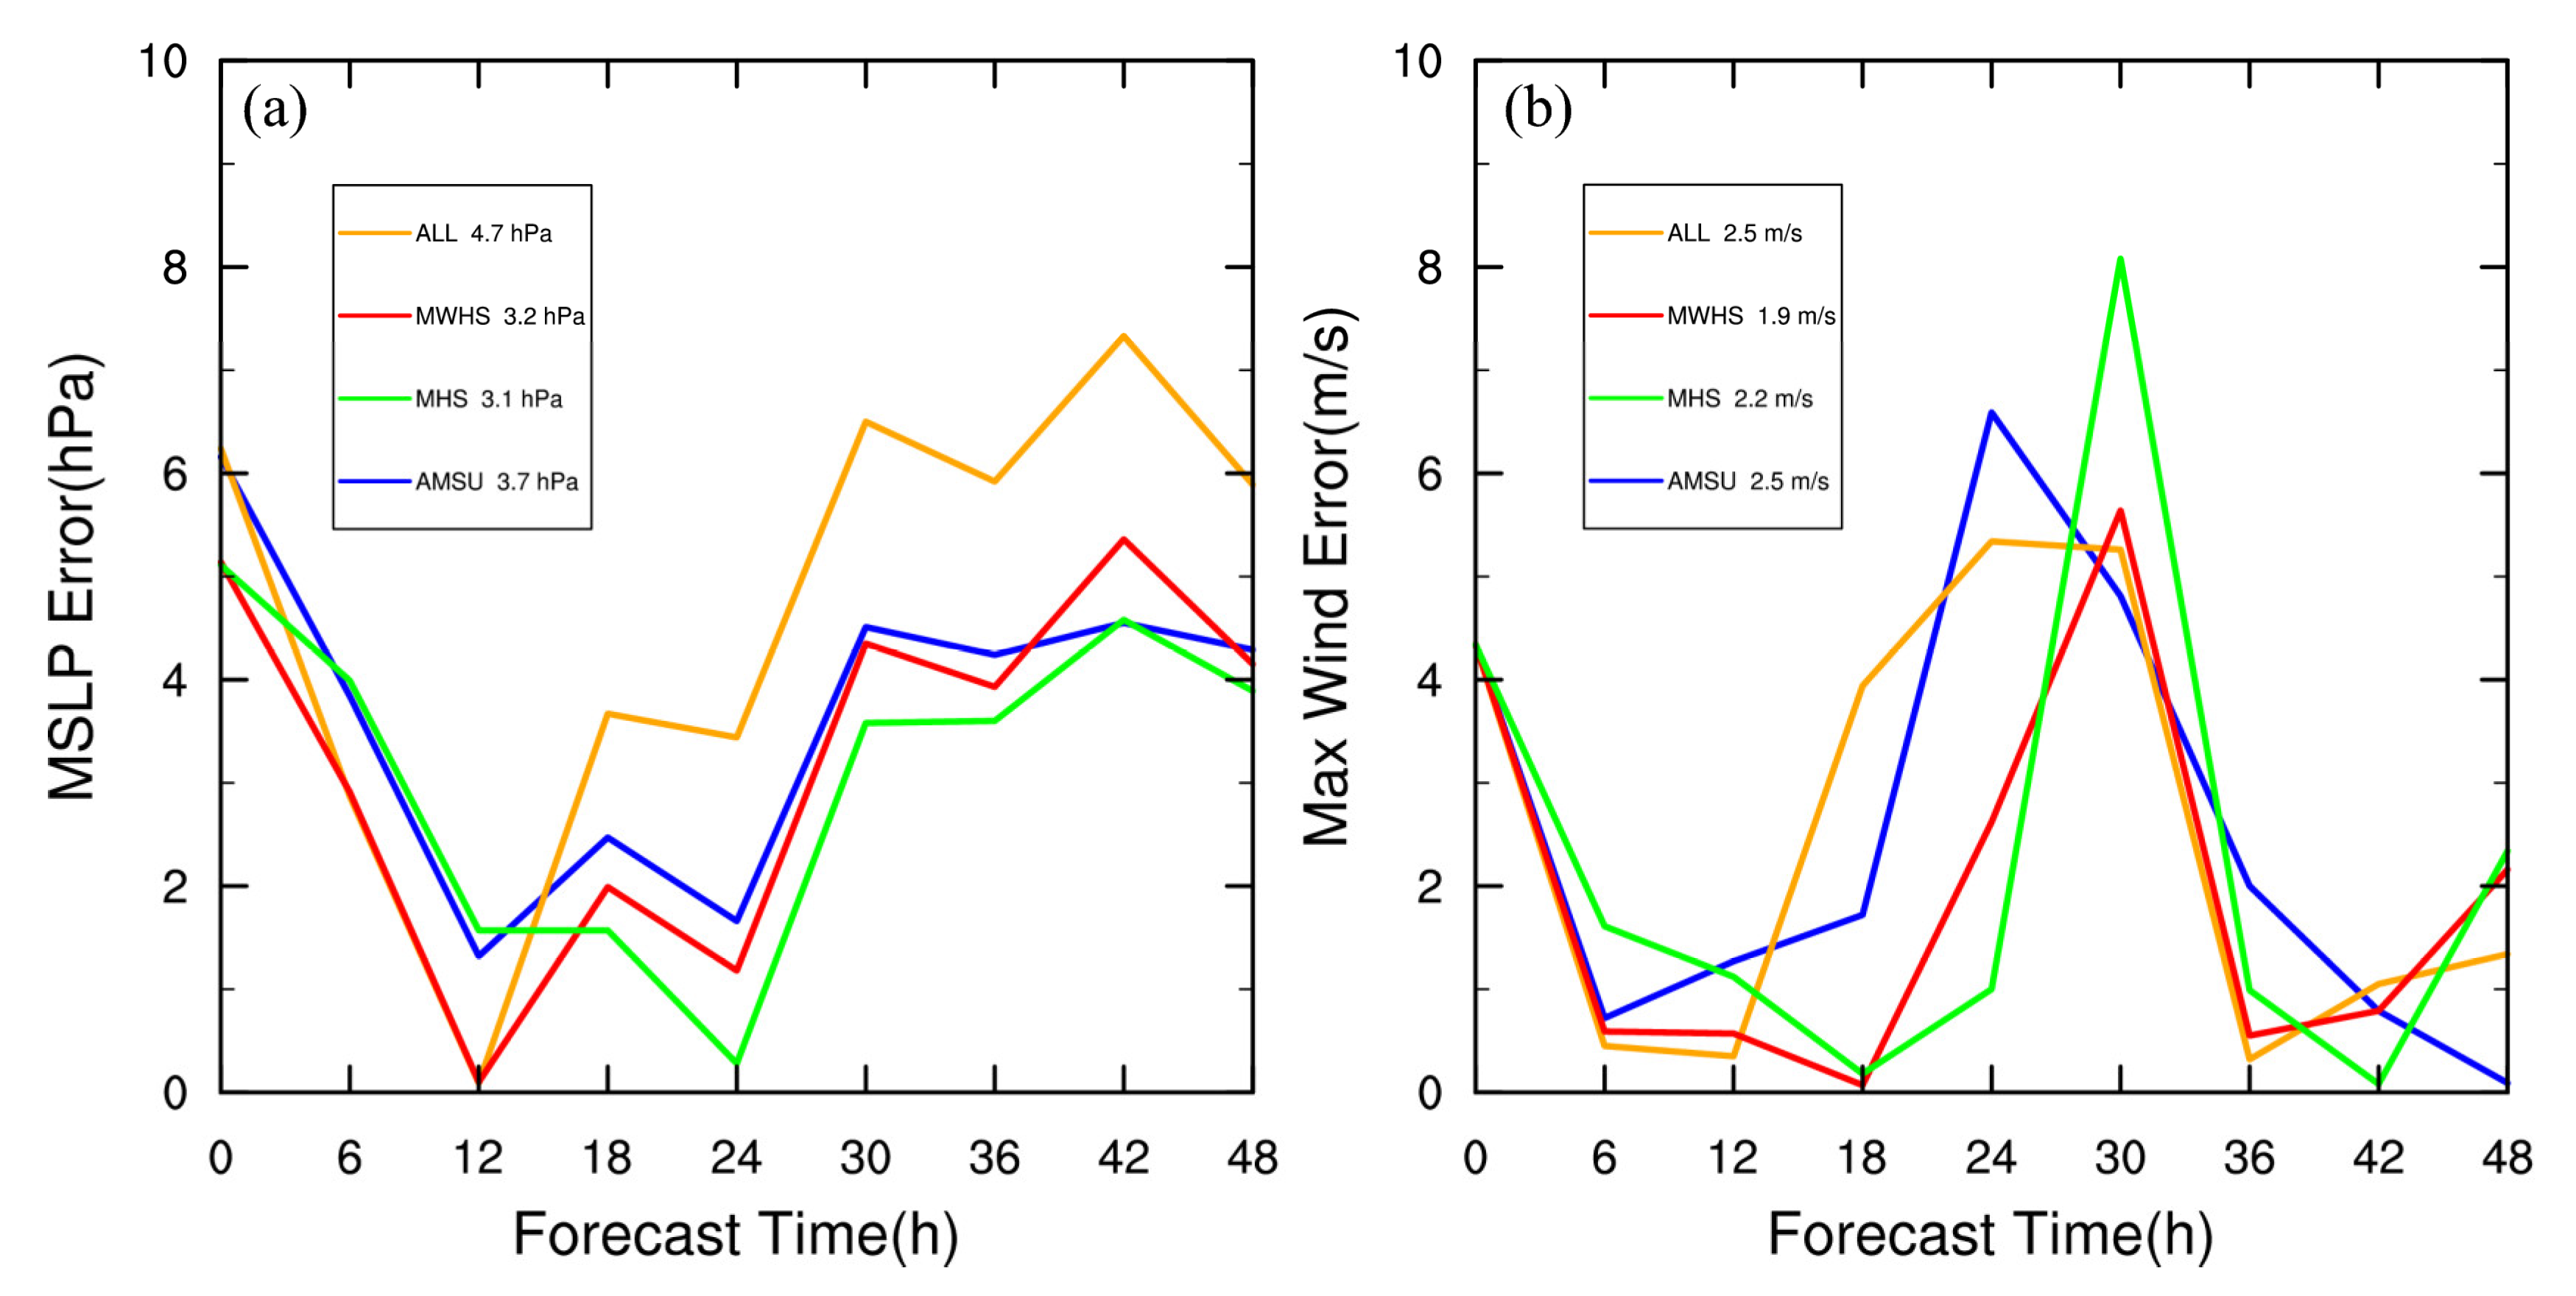
4.7. Results with Another Initialization Time

To provide solid results regarding the impacts of assimilating multi-source satellite radiance, another forecast cycle initialized at 1800UTC on 21 July 2018 is performed. In detail, apart from the timeline being put back by 12 h, other experimental settings are totally the same. The track forecast and intensity forecast are presented in this section.
Figure 13 shows the 48-h track forecast of Typhoon Ampil and the corresponding track errors initialized at 1800 UTC on 21 July. The track forecast of Typhoon Ampil (Figure 13a) illustrates that the AMSU experiment is closer to the actual observed track than the MHS and MWHS experiments, while the ALL experiment is most consistent with the observation. The results of the track errors (Figure 13b) show that the errors from the AMSU experiment are lower than those of MHS and MWHS in most of the time periods, and the track errors of the ALL experiment are generally lowest for the whole period. To be specific, the ALL experiment demonstrates a significant reduction in track errors compared to the other experiments, especially in the final 12 h. The maximum track error of the ALL experiment is less than 120 km, which is significantly lower than the maximum error of the other experiments. For the averaged track errors of the various experiments, the averaged track error of the AMSU experiment is reduced by about 65 km compared with the MHS and MWHS experiments, while the track error of the ALL experiment is further reduced by more than 18 km compared with that of the AMSU. This proves that the ALL experiment has the best performance on the 48-h track forecast.
Figure 14 shows the results of the 48-h absolute MSLP error initialized at 1800UTC on July 21 as well as the absolute MSW error for the four experiments. As seen in Figure 14a, the ALL and MWHS experiments yield the lowest errors from 6 to 12 h. The ALL experiment has a small and decreasing trend in MSLP errors for the first 12 h, while the errors increase sharply after 12 h and finally surpasse the other experiments. For MSW, it can be seen in Figure 14b that the errors obtained for all experiments are first on a decreasing and then an increasing trend, and the MWHS experiment has generally lower errors. In addition, the MSW errors for the ALL experiment reaches its lowest among the four experiments at model integration times of 6 h, 12 h, and 36 h. Since the clear-sky strategy is used, the lack of inner core observation may account for the poor performance of intensity forecast.
From the comparison of different initialization times, it can be found that the ALL experiment generally has the lowest track error among all these experiments. However, due to the lack of inner core structure of the typhoon with the clear-sky strategy, the forecasts of MSLP and MSW are not always the best. To be specific, the mean forecast error of MSLP in the ALL experiment initialized at 0600UTC on 22 July is superior to that initialized at 1800UTC on 21 July, while the mean forecast error of MSW from the ALL experiment initialized at different initialization time is higher than those experiments with radiances from individual humidity sensors.

5. Conclusions and Prospect

In this study, four experiments are carried out by assimilating AMSUA, MHS, and MWHS2 satellite radiance data to address their influence on the forecast of Typhoon Ampil. The first three experiments assimilate the above data separately, while the fourth experiment combine all three types of radiance. The results are compared from various aspects to assess the assimilation effects of different experiments. It is found that the information from the observations is efficiently introduced to the analytical field by assimilating the radiance data from the microwave channels. Compared with the experiment with only AMSUA, both experiments with radiance from humidity sensors outperform in terms of TC structure and moisture conditions. The ALL experiment shows advancement in the forecast skill for the total 24-h precipitation and the divided shorter time windows with relatively higher ETS objective score. For the track forecast, the ALL experiment is the most effective with the lowest track error compared to the remaining three experiments, while the forecasting of TC intensity still needs to be improved when assimilating radiance from all MHS, MWHS2, and AMSUA data sources.
This study demonstrates that combining different radiance sources may further improve the analyses and forecasting of TC compared with assimilating each type of radiance from individual sensors. Further investigations with more cases including multi-scale weather systems are worth exploring. Additionally, future study will focus on adopting more advanced DA algorithms, such as hybrid assimilation and ensemble Kalman filter (EnKF), to further optimize the analysis field, and ultimately the quality of the forecast.

Author Contributions

Conceptualization, A.S. and D.X.; methodology, D.X.; software, A.S.; validation, A.S., D.X. and F.S.; formal analysis, S.Z.; investigation, X.Z.; resources, L.S.; data curation, X.Z.; writing—original draft preparation, A.S. and S.Z.; writing—review and editing, A.S., D.X. and S.Z.; visualization, A.S.; supervision, F.S.; project administration, F.S.; funding acquisition, F.S. All authors have read and agreed to the published version of the manuscript.

Funding

This research was primarily supported by the National Natural Science Foundation of China (G42192553), the Shanghai Typhoon Research Foundation (TFJJ202107), China Meteorological Administration Innovation and Development Project (CXFZ2022P017), Postgraduate Research & Practice Innovation Program of Jiangsu Province (KYCX22_1163), the Chinese National Natural Science Foundation of China (G41805016), the research project of Heavy Rain and Drought-Flood Disasters in Plateau and Basin Key Laboratory of Sichuan Province in China (SZKT201904).

Institutional Review Board Statement

Not applicable.

Informed Consent Statement

Not applicable.

Data Availability Statement

The GFS data are provided from https://rda.ucar.edu/datasets/ds084.1/ (accessed on 23 July 2022), the GTS data are from https://rda.ucar.edu/datasets/ds351.0/ (accessed on 23 July 2022), the satellite data are presented from http://satellite.nsmc.org.cn/PortalSite/Data/DataView.aspx?currentculture=en-US (accessed on 23 July 2022), the best track dataset can be downloaded from https://tcdata.typhoon.org.cn/en/index.html (accessed on 23 July 2022), the sounding data are acquired from https://data.cma.cn/data/cdcdetail/dataCode/B.0011.0001C.html (accessed on 23 July 2022), the precipitation data are obtained from https://data.cma.cn/data/detail/dataCode/NAFP_CLDAS2.0_NRT.html (accessed on 23 July 2022).

Acknowledgments

We acknowledge the High Performance Computing Center of Nanjing University of Information Science & Technology for their support of this work.

Conflicts of Interest

The authors declare no conflict of interest. The funders had no role in the design of the study; in the collection, analyses, or interpretation of data; in the writing of the manuscript, or in the decision to publish the results.

References

  1. McNally, A.P.; Derber, J.C.; Wu, W.; Katz, B.B. The use of TOVS level-1b radiances in the NCEP SSI analysis system. Q. J. R. Meteorol. Soc. 2000, 126, 689–724. [Google Scholar] [CrossRef]
  2. Zapotocny, T.H.; Jung, J.A.; Marshall, J.F.L.; Treadon, R.E. A two-season impact study of four satellite data types and rawinsondedata in the NCEP Global Data Assimilation System. Weather Forecast. 2008, 23, 80–100. [Google Scholar] [CrossRef]
  3. Xu, D.; Liu, Z.; Huang, X.-Y.; Min, J.; Wang, H. Impact of assimilating IASI radiance observations on forecasts of two tropical cyclones. Meteorol. Atmos. Phys. 2013, 122, 1–18. [Google Scholar] [CrossRef]
  4. Smith, W.L.; Woolf, H.M.; Hayden, C.M.; Wark, D.Q.; McMillin, L.M. The TIROS-N operational vertical sounder. Bull. Am. Meteorol. Soc. 1979, 60, 1177–1187. [Google Scholar]
  5. Goodrum, G.; Kidwell, K.B.; Winston, W. (Eds.) NOAA KLM User’s Guide; National Oceanic and Atmospheric Administration: Washington, DC, USA, 1999. [Google Scholar]
  6. Li, J.; Liu, H. Improved hurricane track and intensity forecast using single field-of-view advanced IR sounding measurements. Geophys. Res. Lett. 2009, 36, L11813. [Google Scholar] [CrossRef]
  7. Liu, Z.; Schwartz, C.S.; Snyder, C.; Ha, S.-Y. Impact of assimilating AMSUA radiances on forecasts of 2008 Atlantic tropical cyclones initialized with a limited-area ensemble Kalman filter. Mon. Weather Rev. 2012, 140, 4017–4034. [Google Scholar] [CrossRef]
  8. Schwartz, C.S.; Liu, Z.; Chen, Y.; Huang, X.-Y. Impact of assimilating microwave radiances with a limited-area ensemble data assimilation system on forecasts of Typhoon Morakot. Weather Forecast. 2012, 27, 424–437. [Google Scholar] [CrossRef]
  9. Newman, K.M.; Schwartz, C.S.; Liu, Z.; Shao, H.; Huang, X.-Y. Evaluating forecast impact of assimilating microwave humidity sounder (MHS) radiances with a regional ensemble Kalman filter data assimilation system. Weather Forecast. 2015, 30, 964–983. [Google Scholar] [CrossRef]
  10. Shen, F.; Min, J. Assimilating AMSUA radiance data with the WRF Hybrid En3DVAR system for track predictions of Typhoon. Adv. Atmos. Sci. 2015, 32, 1231–1243. [Google Scholar] [CrossRef]
  11. Collard, A.; Derber, J.; Treadon, R.; Atkinson, N.; Jung, J.; Garrett, K. Toward assimilation of CrIS and ATMS in the NCEP Global Model. In Proceedings of the 18th International TOVS Study Conference, International Atovs Working Group, Toulouse, France, 21–27 March 2012. [Google Scholar]
  12. Zhu, Y.; Liu, E.; Mahajan, R. All-Sky Microwave Radiance Assimilation in the NCEP’s GSI Analysis System. Mon. Weather Rev. 2016, 144, 4709–4735. [Google Scholar] [CrossRef]
  13. Zou, X.; Wang, X.; Weng, F.; Li, G. Assessments of Chinese Fengyun Microwave Temperature Sounder (MWTS) measurements for weather and climate applications. J. Atmos. Ocean. Technol. 2011, 28, 1206–1227. [Google Scholar] [CrossRef]
  14. Chen, K.; English, S.; Bormann, N.; Zhu, J. Assessment of FY-3A and FY-3B MWHS Observations. Weather Forecast. 2015, 30, 1280–1290. [Google Scholar] [CrossRef]
  15. Guo, Y.; He, J.; Gu, S.; Lu, N. Calibration and validation of Feng Yun-3-D microwave humidity sounder II. IEEE Geosci. Remote Sens. Lett. 2019, 17, 1846–1850. [Google Scholar] [CrossRef]
  16. Lu, Q.; Lawrence, H.; Bormann, N.; English, S.; Lean, K.; Atkinson, N.; Bell, W.; Carminati, F. An evaluation of FY-3C satellite data quality at ECMWF and the Met Office. ECMWF Tech. Memo. 2015, 767, 37. [Google Scholar]
  17. Carminati, F.; Candy, B.; Bell, W.; Atkinson, N. Assessment and assimilation of FY-3 humidity sounders and imager in the UK Met Office global model. Adv. Atmos. Sci. 2018, 35, 942–954. [Google Scholar] [CrossRef]
  18. Xu, D.; Min, J.; Shen, F.; Ban, J.; Chen, P. Assimilation of MWHS radiance data from the FY-3B satellite with the WRF Hybrid-3DVAR system for the forecasting of binary typhoons. J. Adv. Model. Earth Syst. 2016, 8, 1014–1028. [Google Scholar] [CrossRef]
  19. Xu, D. Effects of Assimilating Clear-Sky FY-3D MWHS2 Radiance on the Numerical Simulation of Tropical Storm Ampil. Remote Sens. 2021, 13, 2873. [Google Scholar] [CrossRef]
  20. Sun, W.; Xu, Y. Assimilation of FY-3D MWHS2 Radiances with WRF Hybrid-3DVAR System for the Forecast of Heavy Rainfall Evolution Associated with Typhoon Ampil. Mon. Weather Rev. 2021, 149, 1419–1473. [Google Scholar] [CrossRef]
  21. Eyre, J. Progress achieved on assimilation of satellite data in numerical weather prediction over the last 30 years. In Proceedings of the ECMWF Seminar Proceedings: Recent Developments in Use of Satellite Observations in Numerical Weather Prediction, Shinfield Park, Reading, UK, 3–7 September 2007; pp. 1–27. [Google Scholar]
  22. Jiang, L.P.; Shi, C.X.; Zhang, T.; Guo, Y.; Yao, S. Evaluation of Assimilating FY-3C MWHS-2 Radiances Using the GSI Global Analysis System. Remote Sens. 2020, 12, 2511. [Google Scholar] [CrossRef]
  23. Klaes, K.D.; Cohen, M.; Buhler, Y.; Schlüssel, P.; Munro, R.; Luntama, J.; von Engeln, A.; Clérigh, E.Ó.; Bonekamp, H.; Ackermann, J.; et al. An Introduction to the EUMETSAT Polar system. Bull. Am. Meteorol. Soc. 2007, 88, 1085–1096. [Google Scholar] [CrossRef]
  24. Mo, T. Postlaunch calibration of the NOAA-19 Advanced Microwave Sounding Unit-A. J. Geophys. Res. 2010, 115, D8. [Google Scholar] [CrossRef]
  25. Bonsignori, R. The Microwave Humidity Sounder (MHS): In-orbit performance assessment. In Sensors, Systems, and Next-Generation Satellites XI, Proceedings of the SPIE Remote Sensing, Florence, Italy, 17–20 September 2017; SPIE: Munich, Germany, 2007; Volume 6744, p. 6744. [Google Scholar]
  26. Zhang, P.; Chen, L.; Xian, D.; Xu, Z. Recent progress of Fengyun meteorology satellites. Chin. J. Space Sci. 2018, 38, 788–796. [Google Scholar]
  27. Barker, D.; Huang, X.Y.; Liu, Z.; Auligné, T.; Zhang, X.; Rugg, S.; Ajjaji, R.; Bourgeois, A.; Bray, J.; Chen, Y.; et al. The weather research and forecasting model’s community variational/ensemble data assimilation system: WRFDA. Bull. Am. Meteorol. Soc. 2012, 93, 831–843. [Google Scholar] [CrossRef] [Green Version]
  28. Parrish, D.F.; Derber, J.C. The national meteorological center’s spectral statistical interpolation analysis system. Mon. Weather Rev. 2012, 120, 1747–1763. [Google Scholar] [CrossRef]
  29. Lorenc, A.C.; Ballard, S.P.; Bell, R.S.; Ingleby, N.B.; Andrews PL, F.; Barker, D.M.; Bray, J.R.; Clayton, A.M.; Dalby, T.; Li, D.; et al. The Met Office global three-dimensional variational data assimilation scheme. Q. J. R. Meteorol. Soc. 2000, 126, 2991–3012. [Google Scholar] [CrossRef]
  30. Lu, X.; Yu, H.; Ying, M.; Zhao, B.; Zhang, S.; Lin, L.; Bai, L.; Wan, R. Western North Pacific tropical cyclone database created by the China Meteorological Administration. Adv. Atmos. Sci. 2021, 38, 690–699. [Google Scholar] [CrossRef]
  31. Thompson, G.; Field, P.R.; Rasmussen, R.M.; Hall, W.D. Explicit Forecasts of Winter Precipitation Using an Improved Bulk Microphysics Scheme. Part II: Implementation of a New Snow Parameterization. Mon. Weather Rev. 2008, 136, 5095–5115. [Google Scholar] [CrossRef]
  32. Hong, S.Y.; Noh, Y.; Dudhia, J. A new vertical diffusion package with an explicit treatment of entrainment processes. Mon. Weather Rev. 2006, 134, 2318–2341. [Google Scholar] [CrossRef]
  33. Chou, M.D.; Suarez, M.J. An Efficient Thermal Infrared Radiation Parameterization for Use in General Circulation Models; NASA Technical Memorandum; NASA: Washington, DC, USA, 1994; Volume 3, p. 104606. [Google Scholar]
  34. Mlawer, E.J.; Taubman, S.J.; Brown, P.D. Radiative transfer for inhomogeneous atmospheres: RRTM, a validated correlated-k model for the longwave. J. Geophys. Res. Atmos. 1997, 102, 16663–16682. [Google Scholar] [CrossRef]
  35. Grell, G.A.; Freitas, S.R. A scale and aerosol aware stochastic convective parameterization for weather and air quality modeling. Atmos. Chem. Phys. 2014, 14, 5233–5250. [Google Scholar] [CrossRef]
  36. Liu, Z.; Rabier, F. The interaction between model resolution, observation resolution and observation density in data assimilation: A one-dimensional study. Q. J. Roy Meteorol. Soc. 2002, 128, 1367–1386. [Google Scholar] [CrossRef]
  37. Xie, Y.; Xing, J.; Shi, J.; Dou, Y.; Lei, Y. Impacts of radiance data assimilation on the Beijing 7.21 heavy rainfall. Atmos. Res. 2016, 169, 318–330. [Google Scholar] [CrossRef]
Figure 1. Simulated domain and the track of Typhoon Ampil.
Atmosphere 13 01427 g001
Figure 2. (a,c,e) OMB and (b,d,f) OMA after bias correction at 0600UTC on 22 July 2018, with NOAA-19 AMSUA channel 5 in the upper row, NOAA-19 MHS channel 4 in the middle row, and FY-3D MWHS2 channel 11 in the lower row.
Atmosphere 13 01427 g002
Figure 3. Scatters of (a,c,e) background fields and (b,d,f) analysis fields after bias correction at 0600UTC on 22 July 2018, with NOAA-19 AMSUA channel 5 in the upper row, NOAA-19 MHS channel 4 in the middle row, and FY-3D MWHS2 channel 11 in the lower row.
Atmosphere 13 01427 g003
Figure 4. Frequency histograms of (a,c,e) background fields and (b,d,f) analysis fields after bias correction at 0600UTC on 22 July 2018, with NOAA-19 AMSUA channel 5 in the upper row, NOAA-19 MHS channel 4 in the middle row, and FY-3D MWHS2 channel 11 in the lower row.
Atmosphere 13 01427 g004
Figure 5. Sea level pressure (hPa), 10 m wind speed (m/s), and 100 m relative humidity (%) of (a) AMSU experiment, (b) MHS experiment, (c) MWHS experiment, (d) ALL experiment at 0600UTC on 22 July 2018.
Atmosphere 13 01427 g005
Figure 6. Skew-T plots from (a) the sounding at Shanghai station, (b) AMSU experiment, (c) MHS experiment, (d) MWHS experiment, (e) ALL experiment at 1200 UTC on 22 July 2018.
Atmosphere 13 01427 g006
Figure 7. Vertical (a) U wind (m/s), (b) V wind (m/s), (c) temperature (K), (d) specific humidity (g/kg) RMSE profiles at 1800 UTC on 23 July 2018.
Atmosphere 13 01427 g007
Figure 8. Accumulated 24-h rainfall (mm) from 0000 UTC on 23 July to 0000 UTC on 24 July 2018, (a) observation, (b) AMSU experiment, (c) MHS experiment, (d) MWHS experiment, (e) ALL experiment.
Atmosphere 13 01427 g008
Figure 9. Accumulated 24-h rainfall ETS scores from 0000 UTC on 23 July to 0000 UTC on 24 July 2018.
Atmosphere 13 01427 g009
Figure 10. Accumulated 6-h rainfall ETS scores (a) from 0000 UTC to 0600 UTC, (b) from 0600 UTC to 1200 UTC, (c) from 1200 UTC to 1800 UTC, (d) from 1800 UTC to 2400 UTC.
Atmosphere 13 01427 g010
Figure 11. (a) The track and (b) the track error (km) of Typhoon Ampil in the 48-h forecast initialized at 0600UTC on 22 July 2018.
Atmosphere 13 01427 g011
Figure 12. (a) The MSLP error (hPa) and (b) MSW error (m/s) in the 48-h forecast initialized at 0600UTC on 22 July 2018.
Atmosphere 13 01427 g012
Figure 13. (a) The track and (b) the track error (km) of Typhoon Ampil in the 48-h forecast initialized at 1800UTC on 21 July 2018.
Atmosphere 13 01427 g013
Figure 14. (a) The MSLP error (hPa) and (b) MSW error (m/s) in the 48-h intensity forecast initialized at 1800UTC on 21 July 2018.
Atmosphere 13 01427 g014
Table 1. Experimental designment.
Experiment NameUsed Data
AMSUGTS conventional data and AMSUA/NOAA-19 radiance
MHSGTS conventional data and MHS/NOAA-19 radiance
MWHSGTS conventional data and MWHS2/FY-3D radiance
ALLGTS conventional data and the three types of radiance mentioned above
Table 2. List of mean RMSE, mean bias, and mean correlation from the experiments.
MetricAMSUMHSMWHSALL
Mean RMSEU: 3.46U: 3.54U: 3.64U: 3.42
V: 3.55V: 3.31V: 3.71V: 3.17
T: 0.89T: 0.85T: 0.96T: 0.84
Q: 1.31Q: 1.26Q: 1.31Q: 1.26
Mean BiasU: 0.71U: 0.63U: 0.74U: 0.66
V: 0.68V: 0.64V: 0.79V: 0.57
T: 0.13T: −0.09T: −0.10T: −0.06
Q: −0.33Q: 0.31Q: 0.29Q: 0.24
Mean CorrelationU: 0.55U: 0.53U: 0.49U: 0.56
V: 0.58V: 0.62V: 0.56V: 0.63
T: 0.74T: 0.77T: 0.72T: 0.77
Q: 0.69Q: 0.73Q: 0.70Q: 0.72
Publisher’s Note: MDPI stays neutral with regard to jurisdictional claims in published maps and institutional affiliations.

