Article

Application of Radar Radial Velocity Data Assimilation Based on Different Momentum Control Variables in Forecasting Typhoon Kompasu

1
Collaborative Innovation Center on Forecast and Evaluation of Meteorological Disasters, Nanjing University of Information Science & Technology, Nanjing 210044, China
2
Shanghai Typhoon Institute, China Meteorological Administration, Shanghai 200030, China
*
Author to whom correspondence should be addressed.
Atmosphere 2023, 14(1), 39; https://doi.org/10.3390/atmos14010039
Submission received: 31 October 2022 / Revised: 14 December 2022 / Accepted: 22 December 2022 / Published: 26 December 2022

Abstract

:
The study is based on the Weather Research and Forecasting Model (WRF) and the three-dimensional variational (3DVAR) data assimilation system. Based on two different control variables, the effects of radar radial velocity assimilation in forecasting of the tropical cyclone (TC) Kompasu were evaluated. The single observation experiment showed that DA_ψχ produces cyclonic increments, while DA_UV only produces increments in the same direction as the observation. DA_ψχ significantly enhances the wind field at 850 hPa with a large number of unphysical cyclonic increments. On the other hand, DA_UV produces reasonable cyclonic increments to enhance the TC. The assimilation of DA_UV makes the surface wind enhanced and the sea level pressure at the TC center reduced. The circular structure of the DA_ψχ wind field is not clear and neither is the large wind area concentrated. In addition, the DA_ψχ shows spurious convection at the high altitude of the vertical cross section, while the DA_UV presents enhanced large wind area at the bottom. The RMSE of the radial velocity is smaller during the circular assimilation in DA_UV. DA_ψχ does not improve the track forecast of Kompasu, while DA_UV shows a significant improvement by the track forecast.

1. Introduction

Tropical cyclones (TCs) are mesoscale convective systems with strong wind fields that often bring severe natural disasters to coastal people. Forecasting of near-landfall TCs is an effective means to reduce damage. The TC is commonly investigated by the Weather Research and Forecasting Model (WRF) [1,2,3]. Because of inaccurate atmospheric state, the error will grow with the integration time increasing. Data assimilation is a method to correct the atmospheric state with the available observations. There are few observation stations at sea while remote sensing observations provide a large amount of data. As a kind of remote sensing instrument with high spatial and temporal resolution, Doppler weather radar plays an important role in forecasting TCs.
In recent years, some new progress has been made in the study of radar radial velocity assimilation in the typhoon case. It is quite important for TC’s track and rainfall forecasts to assimilate radial velocity data during the 6 h immediately before TC landfall [4]. With the discovery, Xu et al. [5] focus on the determination of the background error length and variance scale. As a result, setting both background error variance scale and length scale to about 0.4 provides a better track than other combinations. The background error variance scale and length scale are rescaling factors according to the response length and variance of the statistic. An evenly spaced thinning method (ESTM) fitting for landfalling TCs is developed by Feng et al. (2020) [6]. ESTM is able to increase the utilization of information in the vicinity of the TC and reduce the landing position error of the TC by 64%. The extra control variables such as hydrometeor mixing ratios are considered in radar data assimilation. With the control variables as hydrometeor mixing ratios, the track forecast of Typhoon Chanthu is improved significantly to assimilate radar radial velocity and reflectivity [7]. Similar results are reflected in the paper by Shen et al. (2021) [8]. These studies illustrate the importance of radar data assimilation in typhoon forecasting from different perspectives.
In assimilation theory, the background error covariance can balance the relationship among physical quantities. The background error statistics are based on multiple control variables, so using different control variables produces different background error statistics. For TCs, the study focuses on the wind adjustment and momentum control variables play a vital role. There are two momentum control variable schemes in the numerical weather forecast region model. The first scheme uses stream function and velocity potential (ψ-χ), while the other uses zonal and meridional velocity components (U-V). Currently, most data assimilation techniques assume that the observation and model background errors follow Gaussian distribution in order to estimate the observation and background uncertainty. The velocity error correlation was derived from error correlation of heights under the geostrophic balance. ψ-χ can estimate the statistical regression between the stream function and the mass field under the geostrophic balance assumption. [9]. A number of studies have been conducted on the assimilation of radar data based on U-V and ψ-χ momentum control variables. Xu et al. [10] evaluate the effect of radar radial velocity and reflectivity assimilation in two momentum control variables. Reflectivity assimilation adjusts in-cloud temperatures and relative humidity which interferes with other variables in the forecast. If only radial velocity is assimilated, it excludes interference from other control variables and focuses on momentum control variables. Shen et al. [11] conducted a radial velocity assimilation study in two momentum control variables for a strong convective system. It is found that U-V can better forecast precipitation. Due to the mesoscale range and intensity of TCs, it is not known which control variables are more effective. Meanwhile, many assimilation studies are based on land convective systems for assimilation experiments [12,13,14], which disrupt geostrophic balance due to the frictional effect of the subsurface. This is the ψ-χ control variables unfavorable factor. With little friction at sea, the ψ-χ control variables may play to its advantage. Most of the previous work is focused on land-based convective systems, and a few studies with different control variables assimilated to weather systems at sea have been performed. Therefore, this study explores the application of data assimilation based on different momentum control variables in forecasting typhoon Kompasu.
The paper is structured as follows. Section 2 introduces the materials and methods, including cost function in three-dimensional variational data assimilation (3DVAR) and data processing. In Section 3, a case overview and experimental setup are presented. In Section 4, unfolded Doppler velocity, the result of single observation experiment, the impact on the analysis and the forecast results are introduced. In Section 5, the conclusions and discussion are provided.

2. Materials and Methods

2.1. The Cost Function in 3DVAR

The 3DVAR takes the dynamical constraints into account to find an optimal analysis field that minimizes the cost function. The cost function in 3DVAR is:
J ( x ) = 1 2 ( x x b ) T B 1 ( x x b ) + 1 2 [ y o H ( x ) ] T R 1 [ y o H ( x ) ]
J ( x ) in the Equation (1) is the cost function to be calculated. The right side of the Equation (1) is divided into two parts that evaluate the difference to the background field x b and observation field y o , respectively. They are both equally important, so they are given the same weight as 1 2 . In the first term, x stands the atmospheric state variable while x b stands the atmospheric state on the background field. B stands the background error covariance matrix. In another term, y o is the observation while H ( x ) stands the observation operator and R stands the covariance matrix of the observation error. Since B requires a huge amount of running memory, control variables which are several completely uncorrelated analysis variables are used to simplify B . Set x = x x b = U ν , H ( U v + x b ) ~ H ( U v ) + H ( x b ) and y = y o H ( x b ) , Equation (1) changed to:
J ( ν ) = 1 2 ν T ν + 1 2 ( y H ( U ν ) ) T R 1 ( y H ( U ν ) ) ,
Equation (2) is the cost function for the control variable ν . The right side also divided into two parts. y is the innovation vector. H stands the linear observation operator. U stands the transformation operator of the control variable. In Equation (2), B is implied in H by B = U U T after transforming the control variable. U can be split into three, horizontal transformation ( U h), vertical transformation ( U v), and physical transformation ( U p). Thus, B will be expressed as B = U p U v U h U h T U v T U p T [15]. We set the cross-variable error covariances zero. For computing the state of wind, there are two different control variable schemes which are named CV_ ψχ and CV_UV in this paper. To be specific, CV_ ψχ based on geostrophic adaptation theory includes unbalanced velocity potential (χ) and stream function (ψ). The transform U p is:
2 ψ = v x u y   a n d   2 χ = u x + v y
On the other hand, CV_UV replaces with eastward and northward velocity components. To obtain the B , the “NMC method” [16] is used to generate forecast difference ensembles by the Weather Research and Forecasting Model (WRF) during October 2021.

2.2. Data Processing and Observation Operator

In the study, Haikou Radar (110.246° E, 19.996° N, altitude 118.0 m, type CINRAD/SA) and Sanya Radar (109.592° E, 18.228° N, altitude 443.0 m, type CINRAD/SC) were used. Before assimilation, non-meteorological radar returns were removed based on the MetSignal algorithm [17]. Isolated points were removed, and echo-filling was done. When a TC was detected by radar, the radial velocity of the radar tends to appear velocity ambiguity. Based on the python library Pyart [18] with the region-based algorithm, the Doppler velocity was unfolded. It is now a common practice to perform a second quality control prior to thinning data: any radial velocity with values larger than 70 m s−1 or smaller than 2 m s−1 were discounted. Other radial velocity data were discounted with distances to the radar smaller than 4 km height [19]. The main purpose of this approach was to minimize the effect of ground clutter. The Chinese Next Generation Weather Surveillance Radar 1998 Doppler removed the zero-frequency ground signal interference in the signal processing stage. The interference of bio-echoes were also removed in the phase of identifying meteorological echoes. Therefore, we removed only the data with radial wind speed larger than 70 m/s in the second quality control. Finally, a bilinear interpolation algorithm was used to reduce the radar data to match the WRF grid (5 km). It reduced the data correlation. The observation error of radar radial velocity was set at 2 m/s [20].
In order to relate the observations to the model variables, an observation operator was required. Doppler radar radial velocity had the observation operator as:
V r = u x i x r i + v y i y r i + ( w v e ) z i z r i ,
In Equation (4), ( u , v, w ) are the three-dimensional velocity components and ( x , y , z ) are the radar location while ( x i , y i , z i ) are the location of the radial velocity observation. The r i is the distance from the radar to the observation and v e is the terminal velocity. Vertical velocity w is not a control variable. It adjusts to temperature, humidity, and horizontal wind field.

3. Case Survey and Experimental Setup

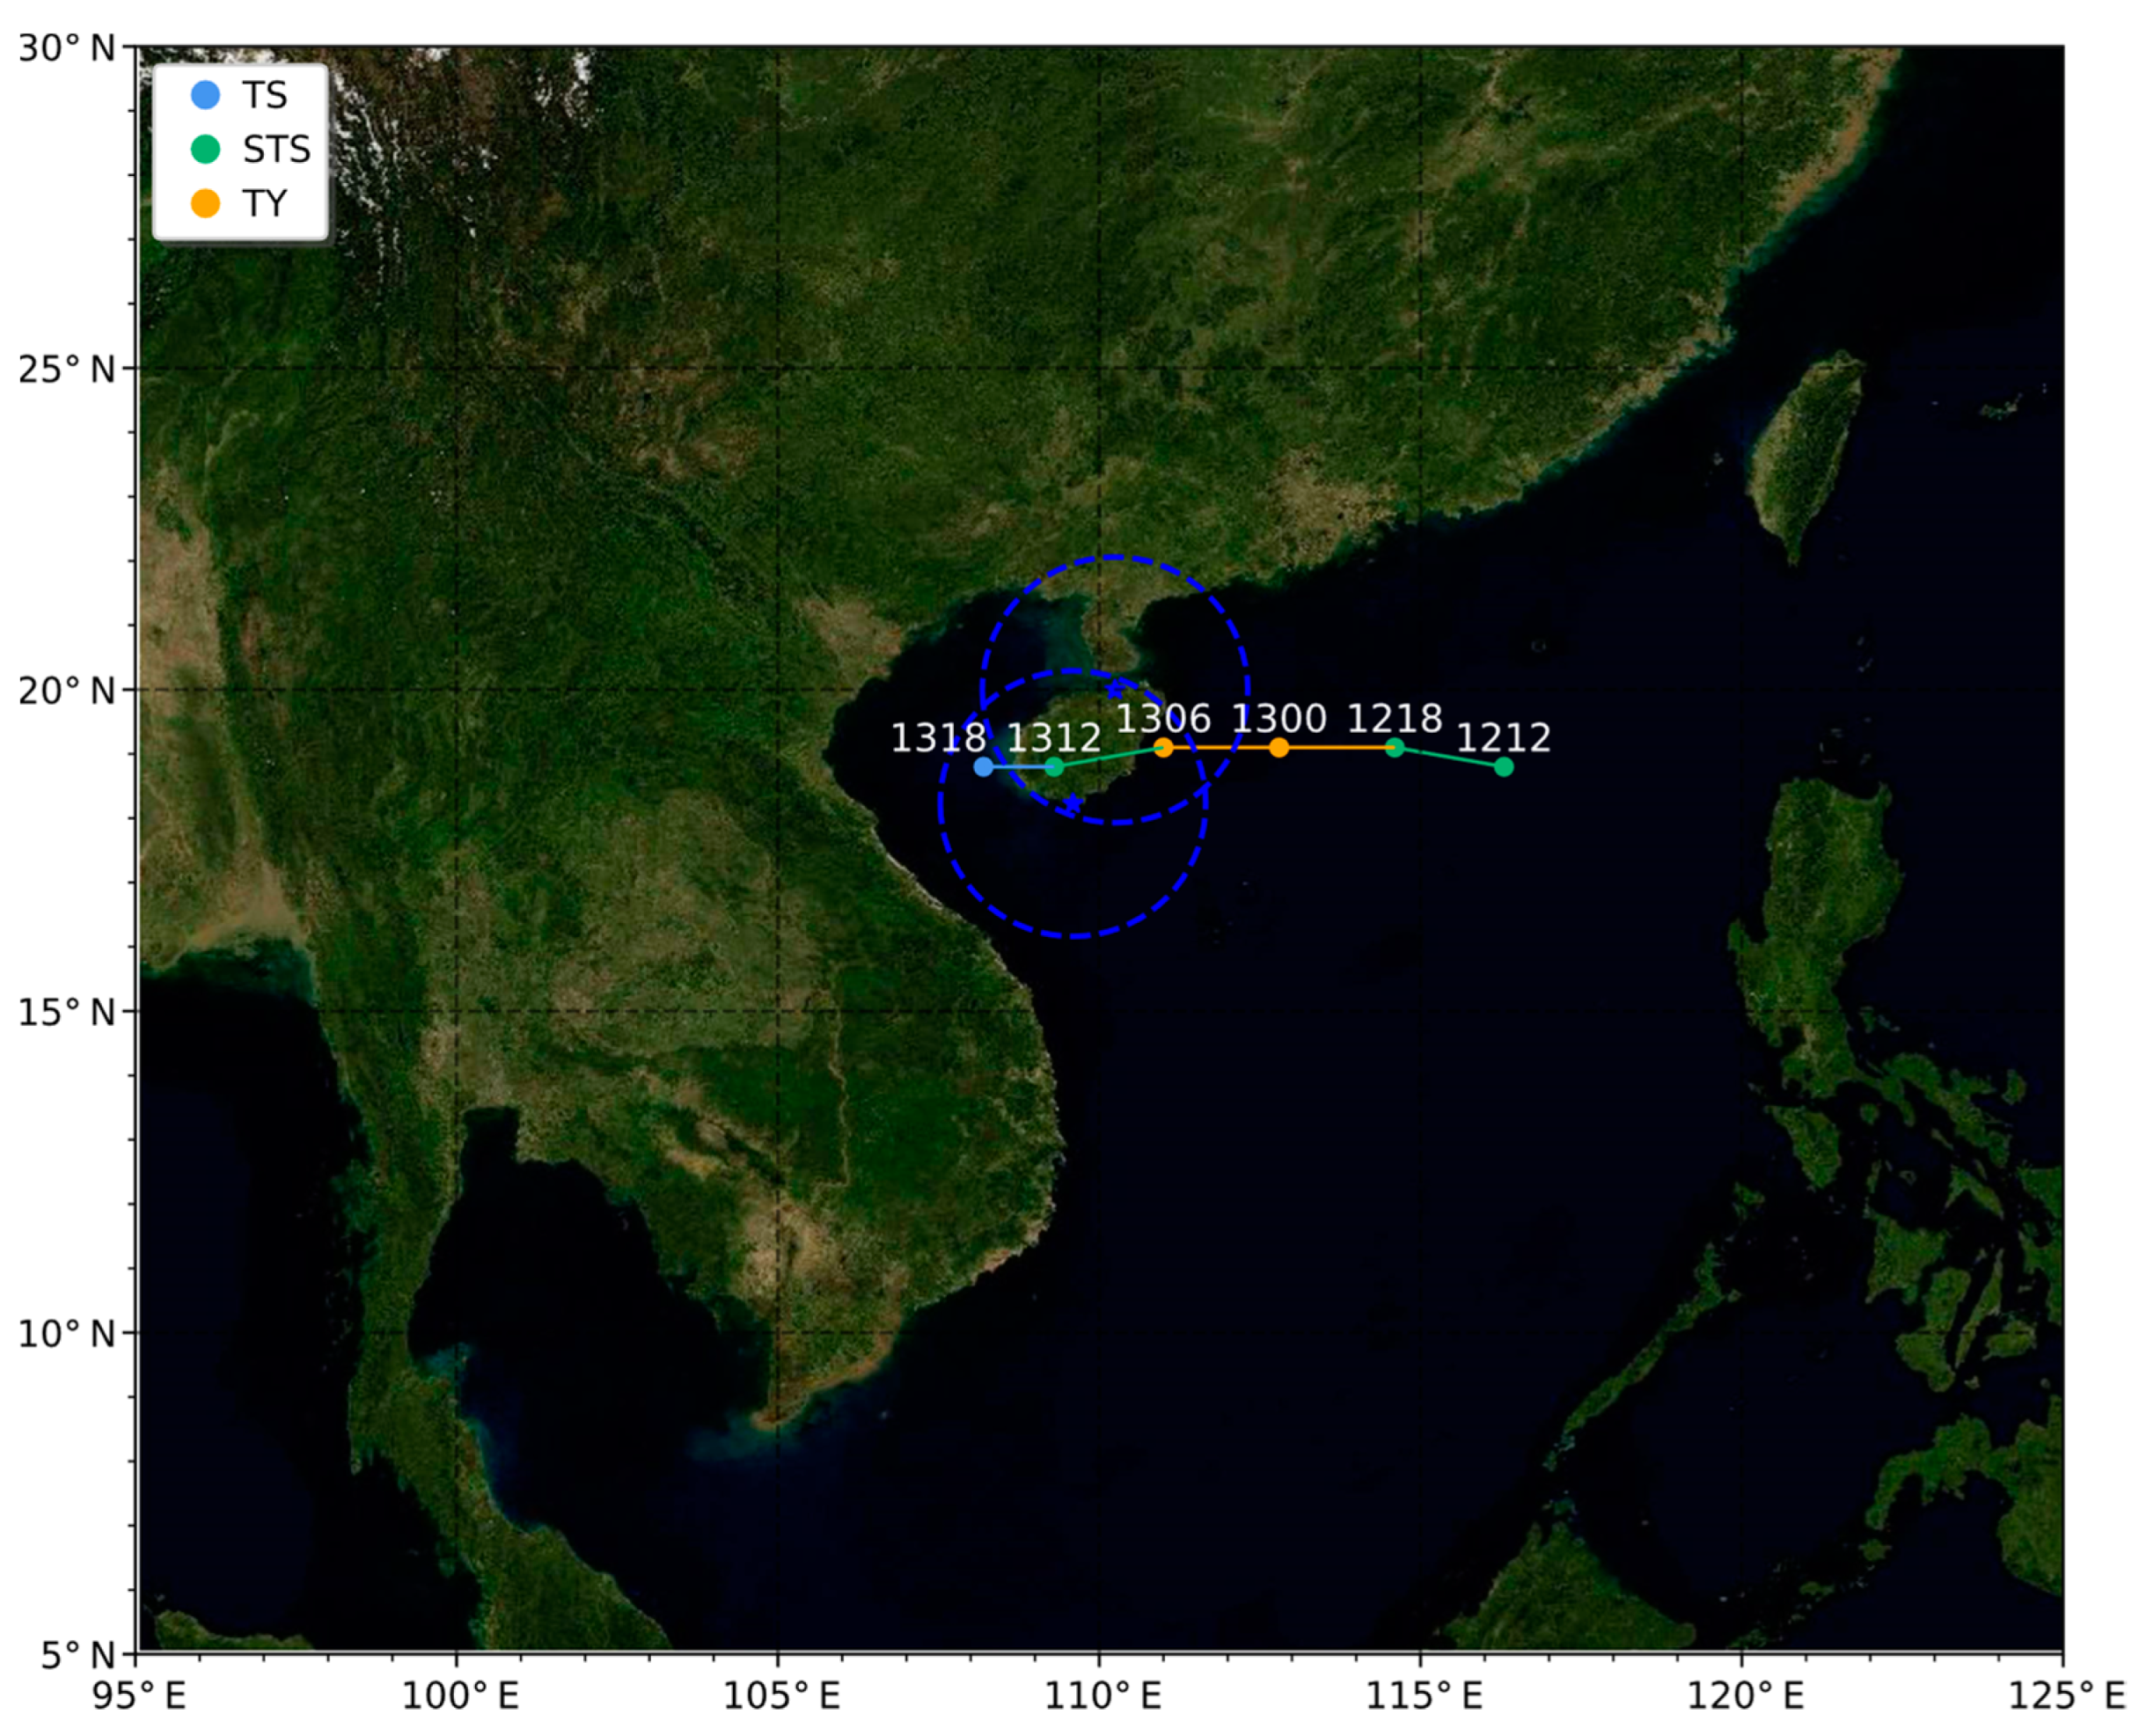
3.1. Typhoon Kompasu Overview

On 8 October 2021, a tropical depression over the ocean east of the Philippines was recognized as a tropical storm, and categorized as Typhoon Kompasu No. 18 in 2021. At 0300UTC 10 October the National Weather Service of the Philippines determined that Typhoon Kompasu had merged with a tropical depression located in the eastern part of the Philippines. The combined winds of Kompasu would gradually intensify and could be upgraded to the level of a strong tropical storm within the next 24 h. The Kompasu strengthened from strong tropical storm level to typhoon level. At 2100 UTC, its center was located in the northwestern sea surface of the South China Sea about 350 km east of Wanning City, Hainan Province, i.e., 19.1° N and 113.7° E. The maximum wind speed near the center was up to 33 m/s and the minimum pressure at the center was 970 hPa. It was expected to move in a westerly direction at a speed of 25–30 km per hour with the intensity strengthening. It landed on the 13th between Wenchang Cityand Lingshui City in Hainan Province around the coast. It landed with the intensity level of typhoon and the wind speed is 33~40 m/s. After landfall, the typhoon gradually weakened to severe tropical storm. It crossed Hainan Island and then moved into the Gulf of Tonkin, tending to the north of Vietnam.
Typhoon Kompasu became the strongest typhoon to land in Hainan, China in the past five years. With a huge circulation and wide impact, there were two deaths in Hainan and direct economic losses of 750 million yuan in Southwest China. It also caused serious disasters in the Philippines, resulting in 42 deaths, 5 injuries, 16 missing persons, and total economic losses of about 8.3 billion pesos.
To sum up, Typhoon Kompasu had the following characteristics: (1) huge size, stable westbound, wide impact; (2) precipitation impact with overlap; (3) the strongest typhoon to land in Hainan in the past five years. The study focuses on 12 h before Kompasu landfall and after landfall time. This is the period of time when Kompasu have the greatest impact on humans.

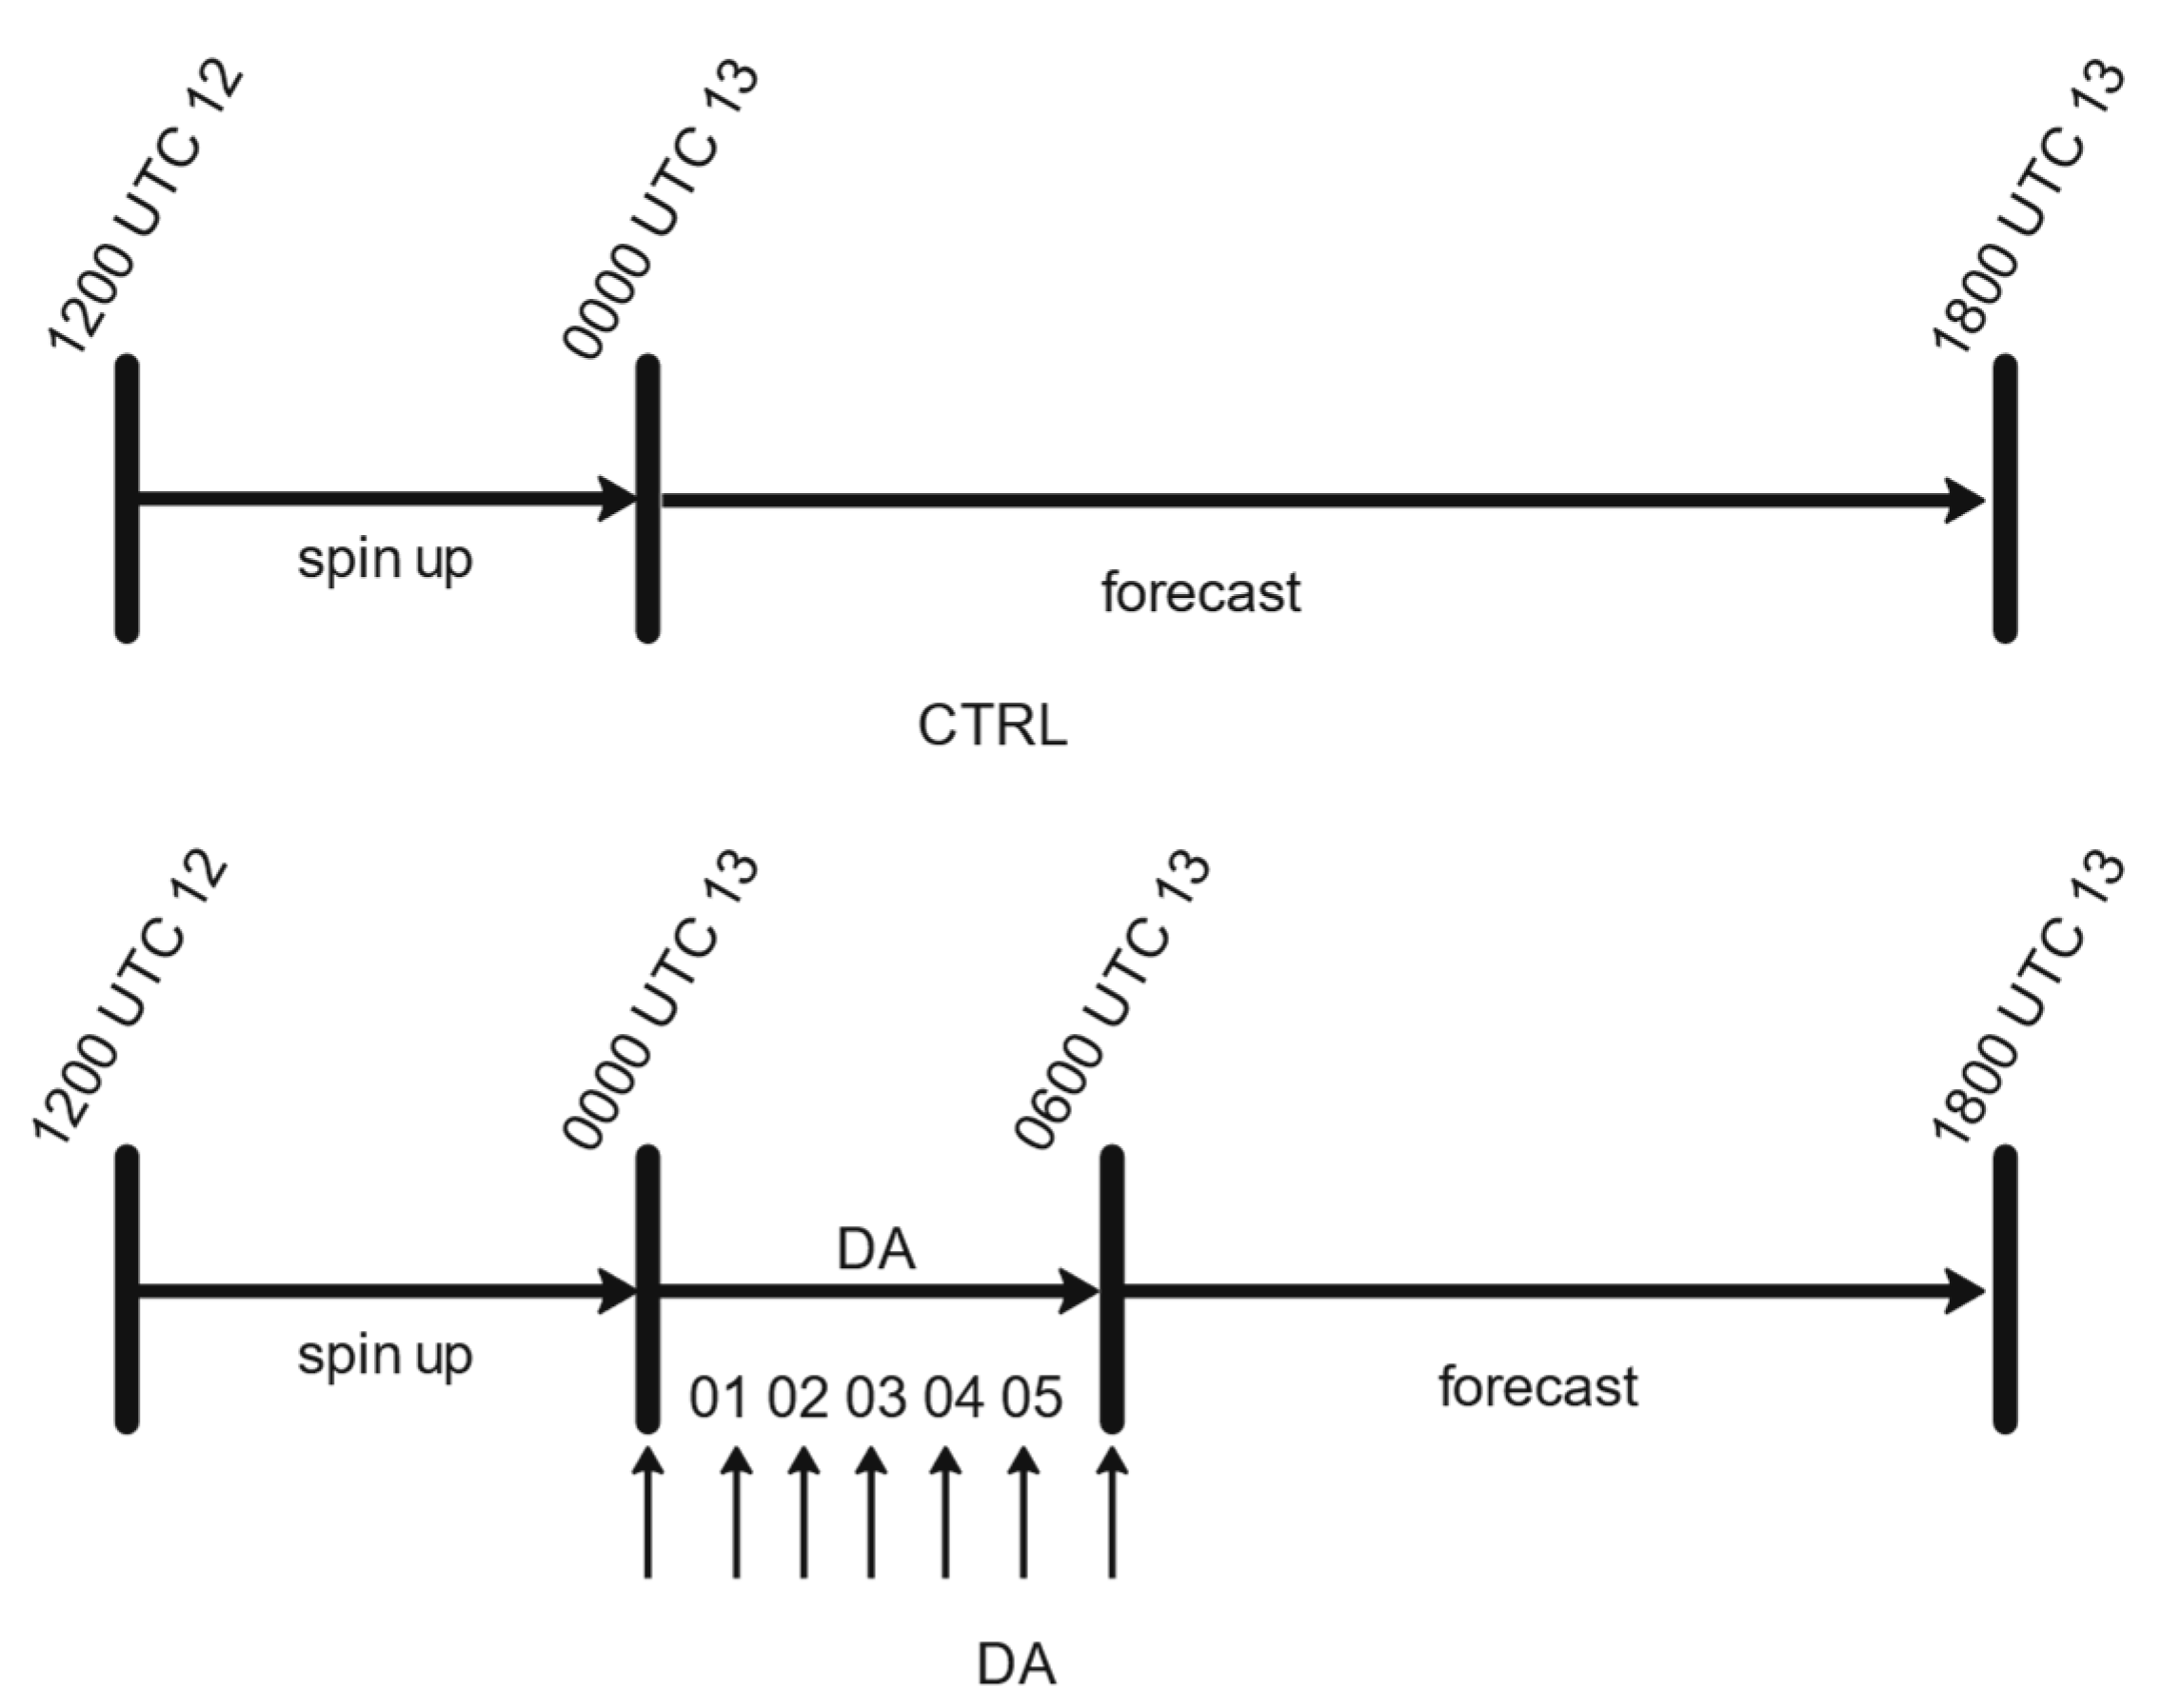
3.2. Experimental Setup

The experiments were conducted with advanced research WRF (ARW) modeling system of version 4.3 (National Center for Atmospheric Research (NCAR), https://www2.mmm.ucar.edu/wrf, accessed on 10 November 2022). Figure 1 is the simulated domain in model centered on TC processes. Its horizontal grid spacing is 5 km with 500 × 500 horizontal grids and 50 vertical layers. The physical schemes are following: WRF single–moment 6–class micro physical scheme [21]; the rapid radiative transfer model longwave and shortwave radiation scheme [22]; the Yonsei University scheme boundary layer scheme [23]; unified Noah land surface model for land surface processes scheme [24]; and MM5 similarity scheme for land surface processes [25]. The initial fields and boundary conditions were from NCAR/NCEP 15′ × 15′ GDAS/FNL data.
The simulation time was from 1212 UTC 12 to 1318 UTC 13 October 2021. The best track data were from the China Meteorological Administration (CMA). Figure 1 shows the best track positions and intensity for Kompasu. Before landfall, Kompasu intensified to a typhoon (TY) from a severe tropical storm (STS). After landfall, Kompasu rapidly weakened to an STS, an even tropical storm (TS). HaiKou Radar and Sanya Radar detected the process. Figure 2 shows flow chart for the control experiment (CTRL) and data assimilation experiments (DA). There were 7 occurrences of assimilation cycle from 1300 UTC to 1306 UTC 13 in DA experiments while no data assimilation in CTRL.
In order to compare the effects of different momentum control variables data assimilation on TC simulations, three sets of experiments were designed in this study (Table 1). A control experiment (CTRL) with no data assimilation, a data assimilation experiment with ψ-χ control variable experiment (DA_ψχ) and a data assimilation experiment with U-V control variable experiment (DA_UV) are set. To avoid the effects of reflectivity, only radar radial velocity is assimilated in DA experiments.

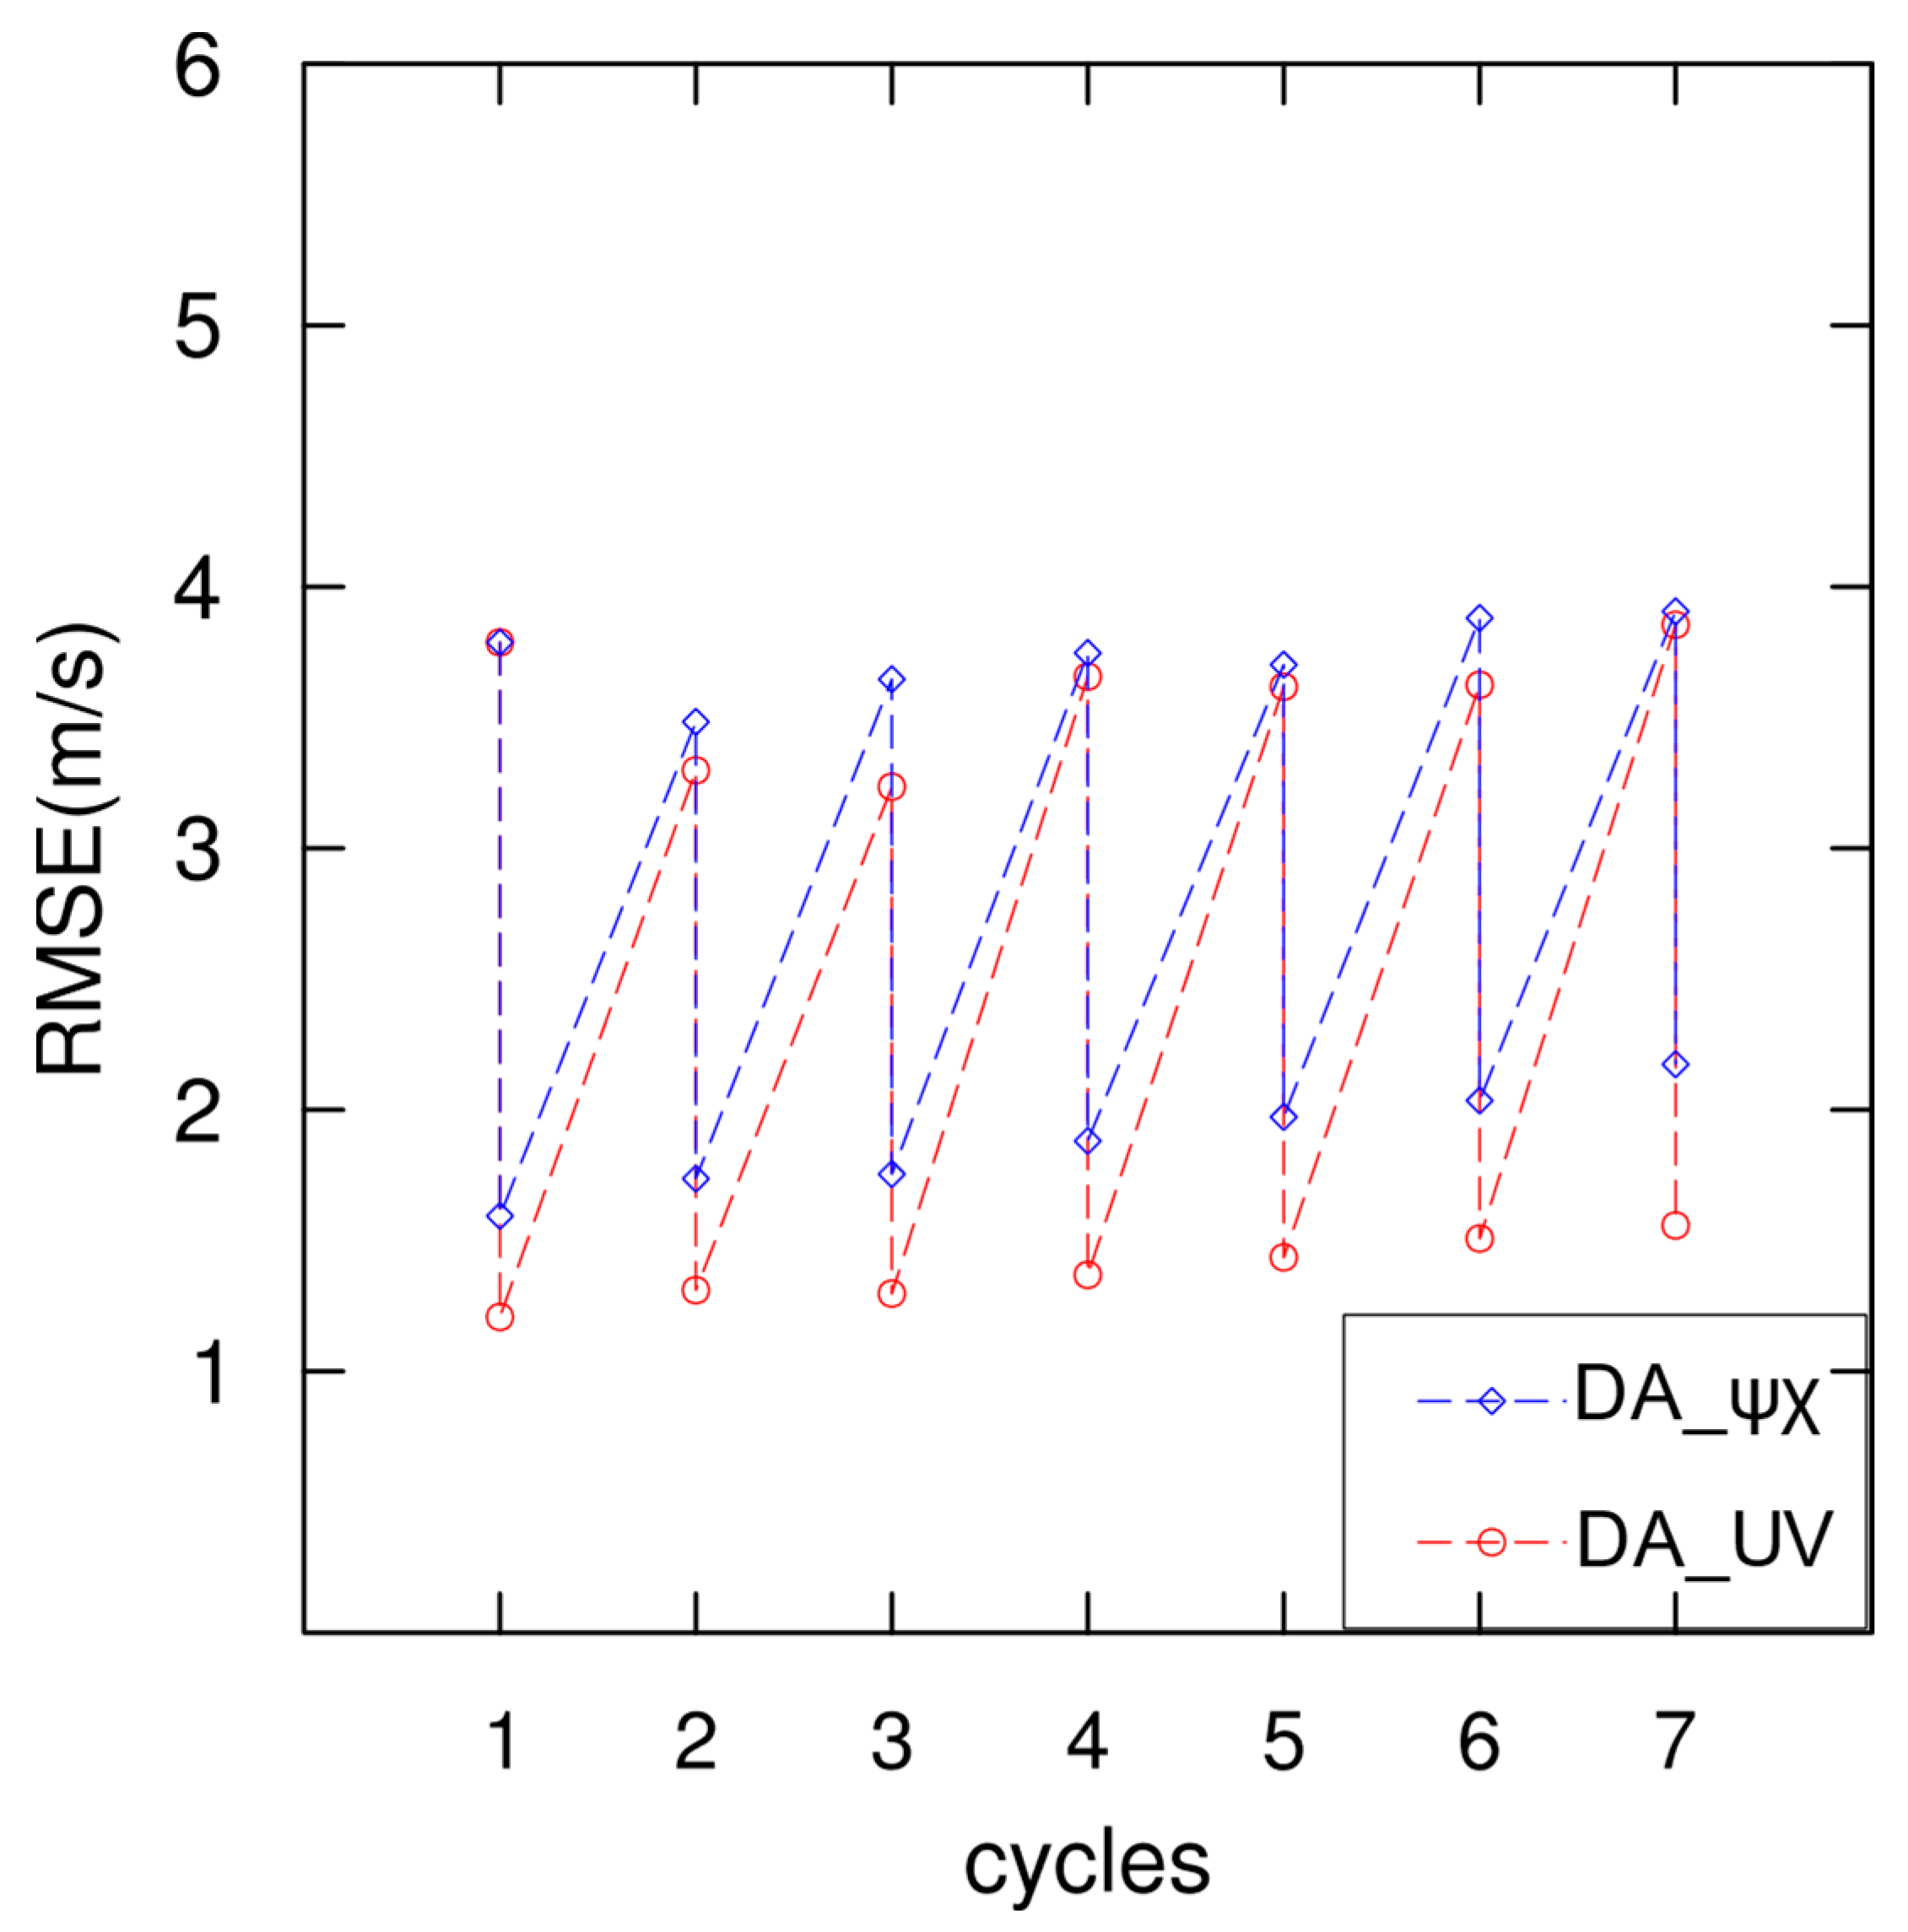
4. Data Analysis and Experimental Results

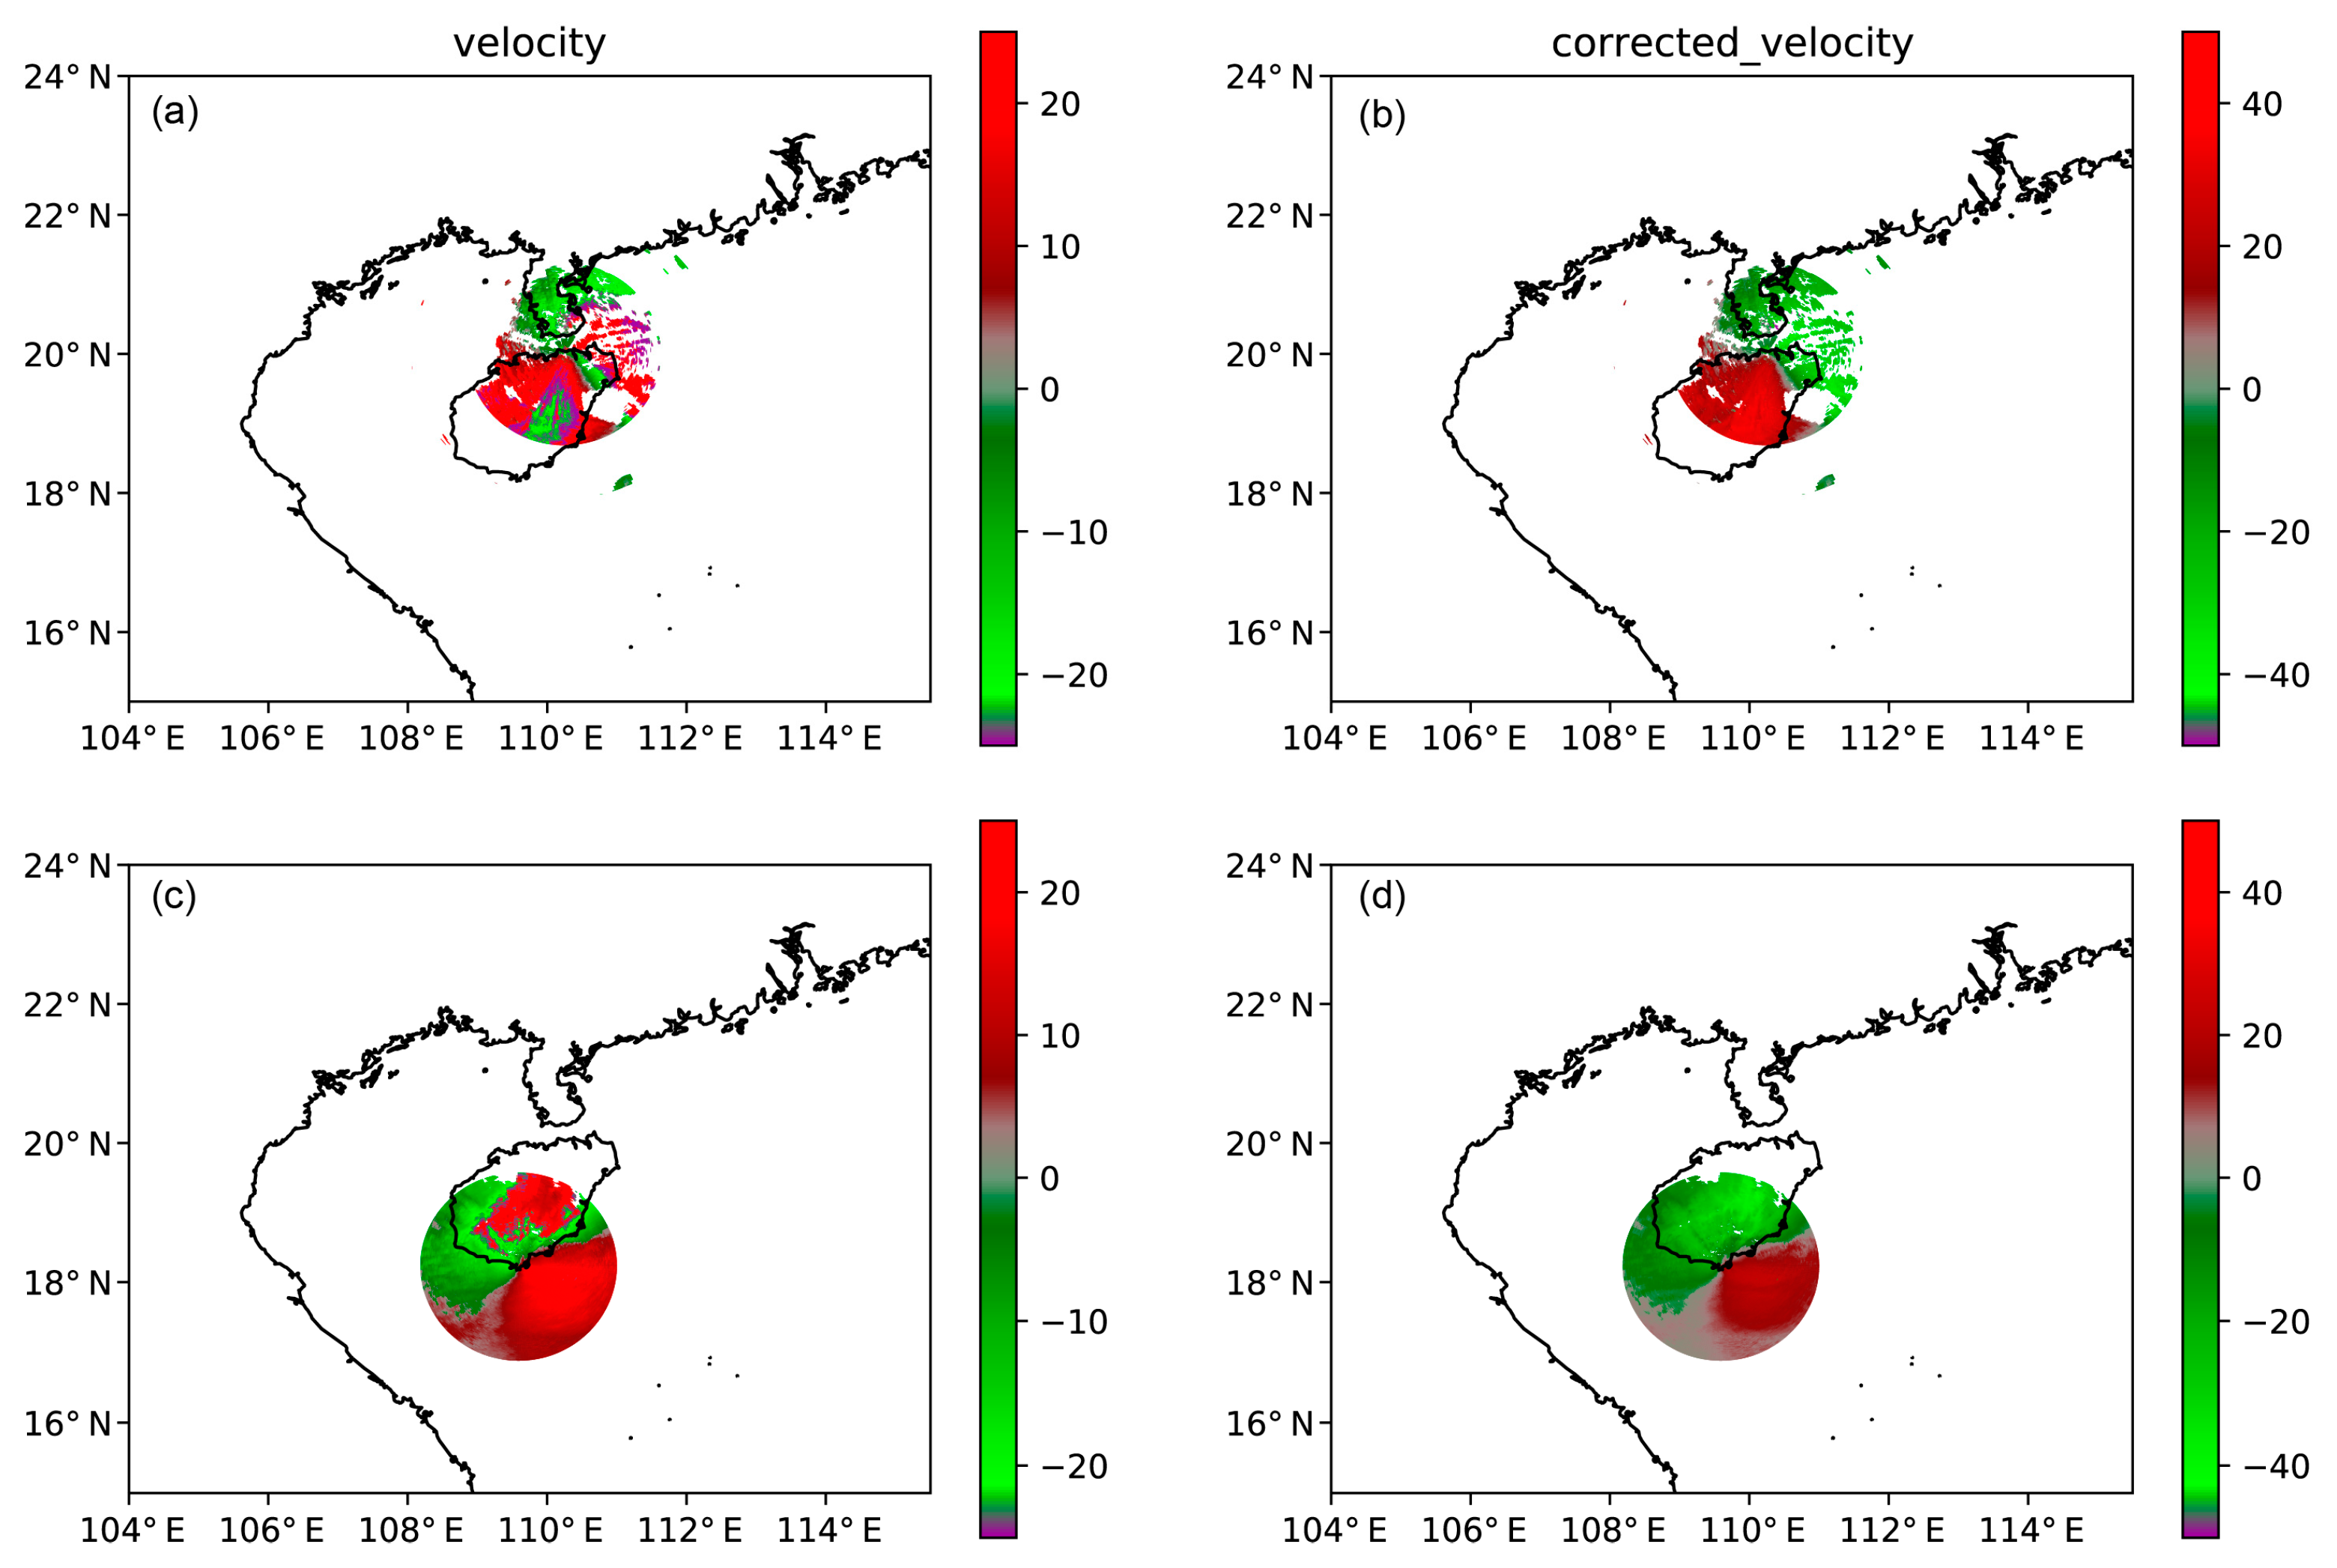
4.1. Quality Control of Radar Data

The Nyquist velocity of HKRD was 27.8325 m/s and that of SYRD was 24.4698 m/s. Figure 3 shows the Doppler radar radial velocity before and after unfolding. Due to the TC, there were strong northerly winds at the two radar locations. Prior to processing, severe velocity aliased occurred to the south and east of the HKRD, and to the north of the SYRD. These areas of folding radial velocity provided the wrong information. After data processing, the Doppler velocity was corrected and more continuous.

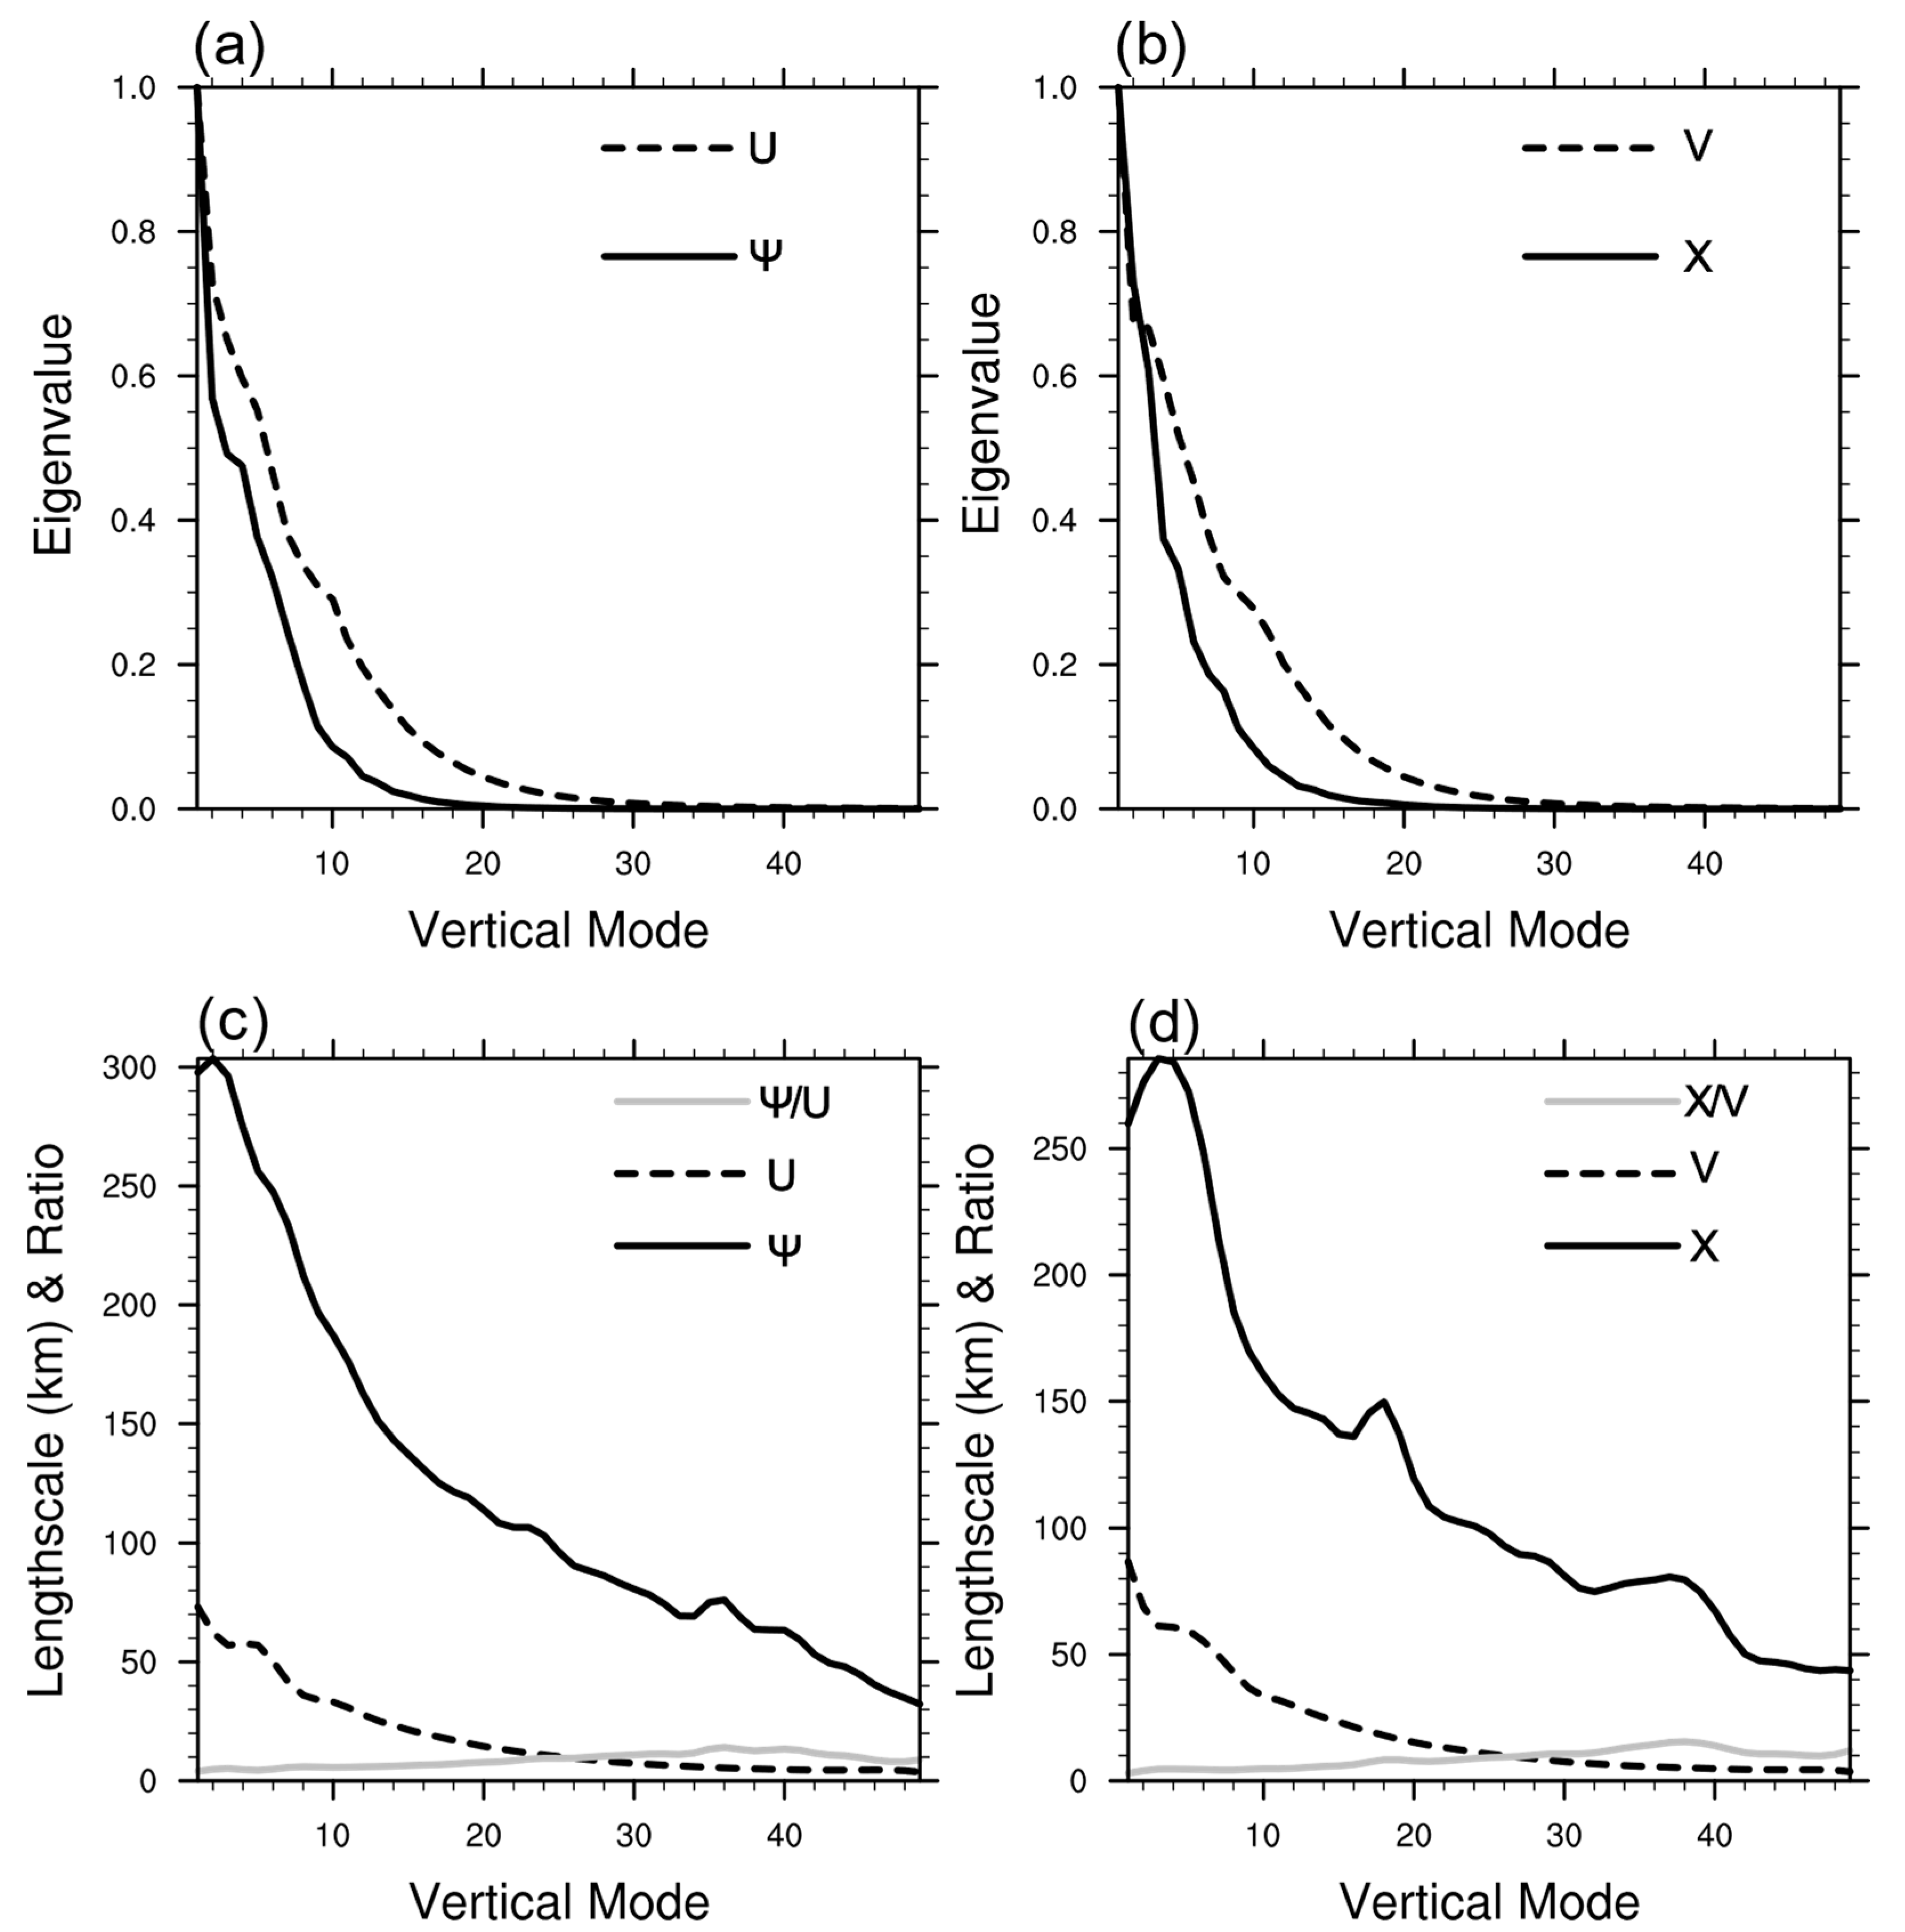
4.2. Background Error Statistics

The background error statistics were different based on different momentum control variables. The background error statistics for the eigenvalue and the length scale of the two different momentum control variables were uniform and isotropic, which changed only with vertical layers. Figure 4 shows how the eigenvalue and the length scale varied over the vertical mode. Since the difference of the eigenvalues of U (V) and ψ (χ) was too large, orders of magnitude of which were 1012 and 101, respectively, the eigenvalue was normalized by that of the first vertical mode of empirical orthogonal function (EOF). Every eigenvalue of ψ/χ/U/V corresponded the variance contribution at the specific vertical mode, so the larger eigenvalue represented more variance contribution at the vertical mode. In Figure 4a,b, the eigenvalue decreases with increasing vertical mode, indicating that lower modes have more significant statistics. For ψ/χ, the eigenvalues of the lower modes were so large that the middle and high modes’ variance contribution was small, which suggested that high-mode statistics did not reflect the true results well. Compared to ψ/χ, U/V improved statistical eigenvalue at the middle mode, which improved the effect of statistics at these modes. The length scale of the background error decreased with the increasing vertical mode, indicating that the assimilation would have a larger effect at the low and middle modes. The length scale under the ψ-χ control variables was larger than that of U-V. It can reach more than 200 km at lower modes. Xie and MacDonald (2012) [26] performed mathematical analysis and showed that ψ-χ control variables tend to produce analyses that possess large-scale motions of the background field. The larger length scale of ψ-χ in Figure 4 supports the view. From the ratio of the two, the ratio increases and the difference between them decreases with increasing vertical mode. This indicates that the response of ψ-χ control variables is wider.

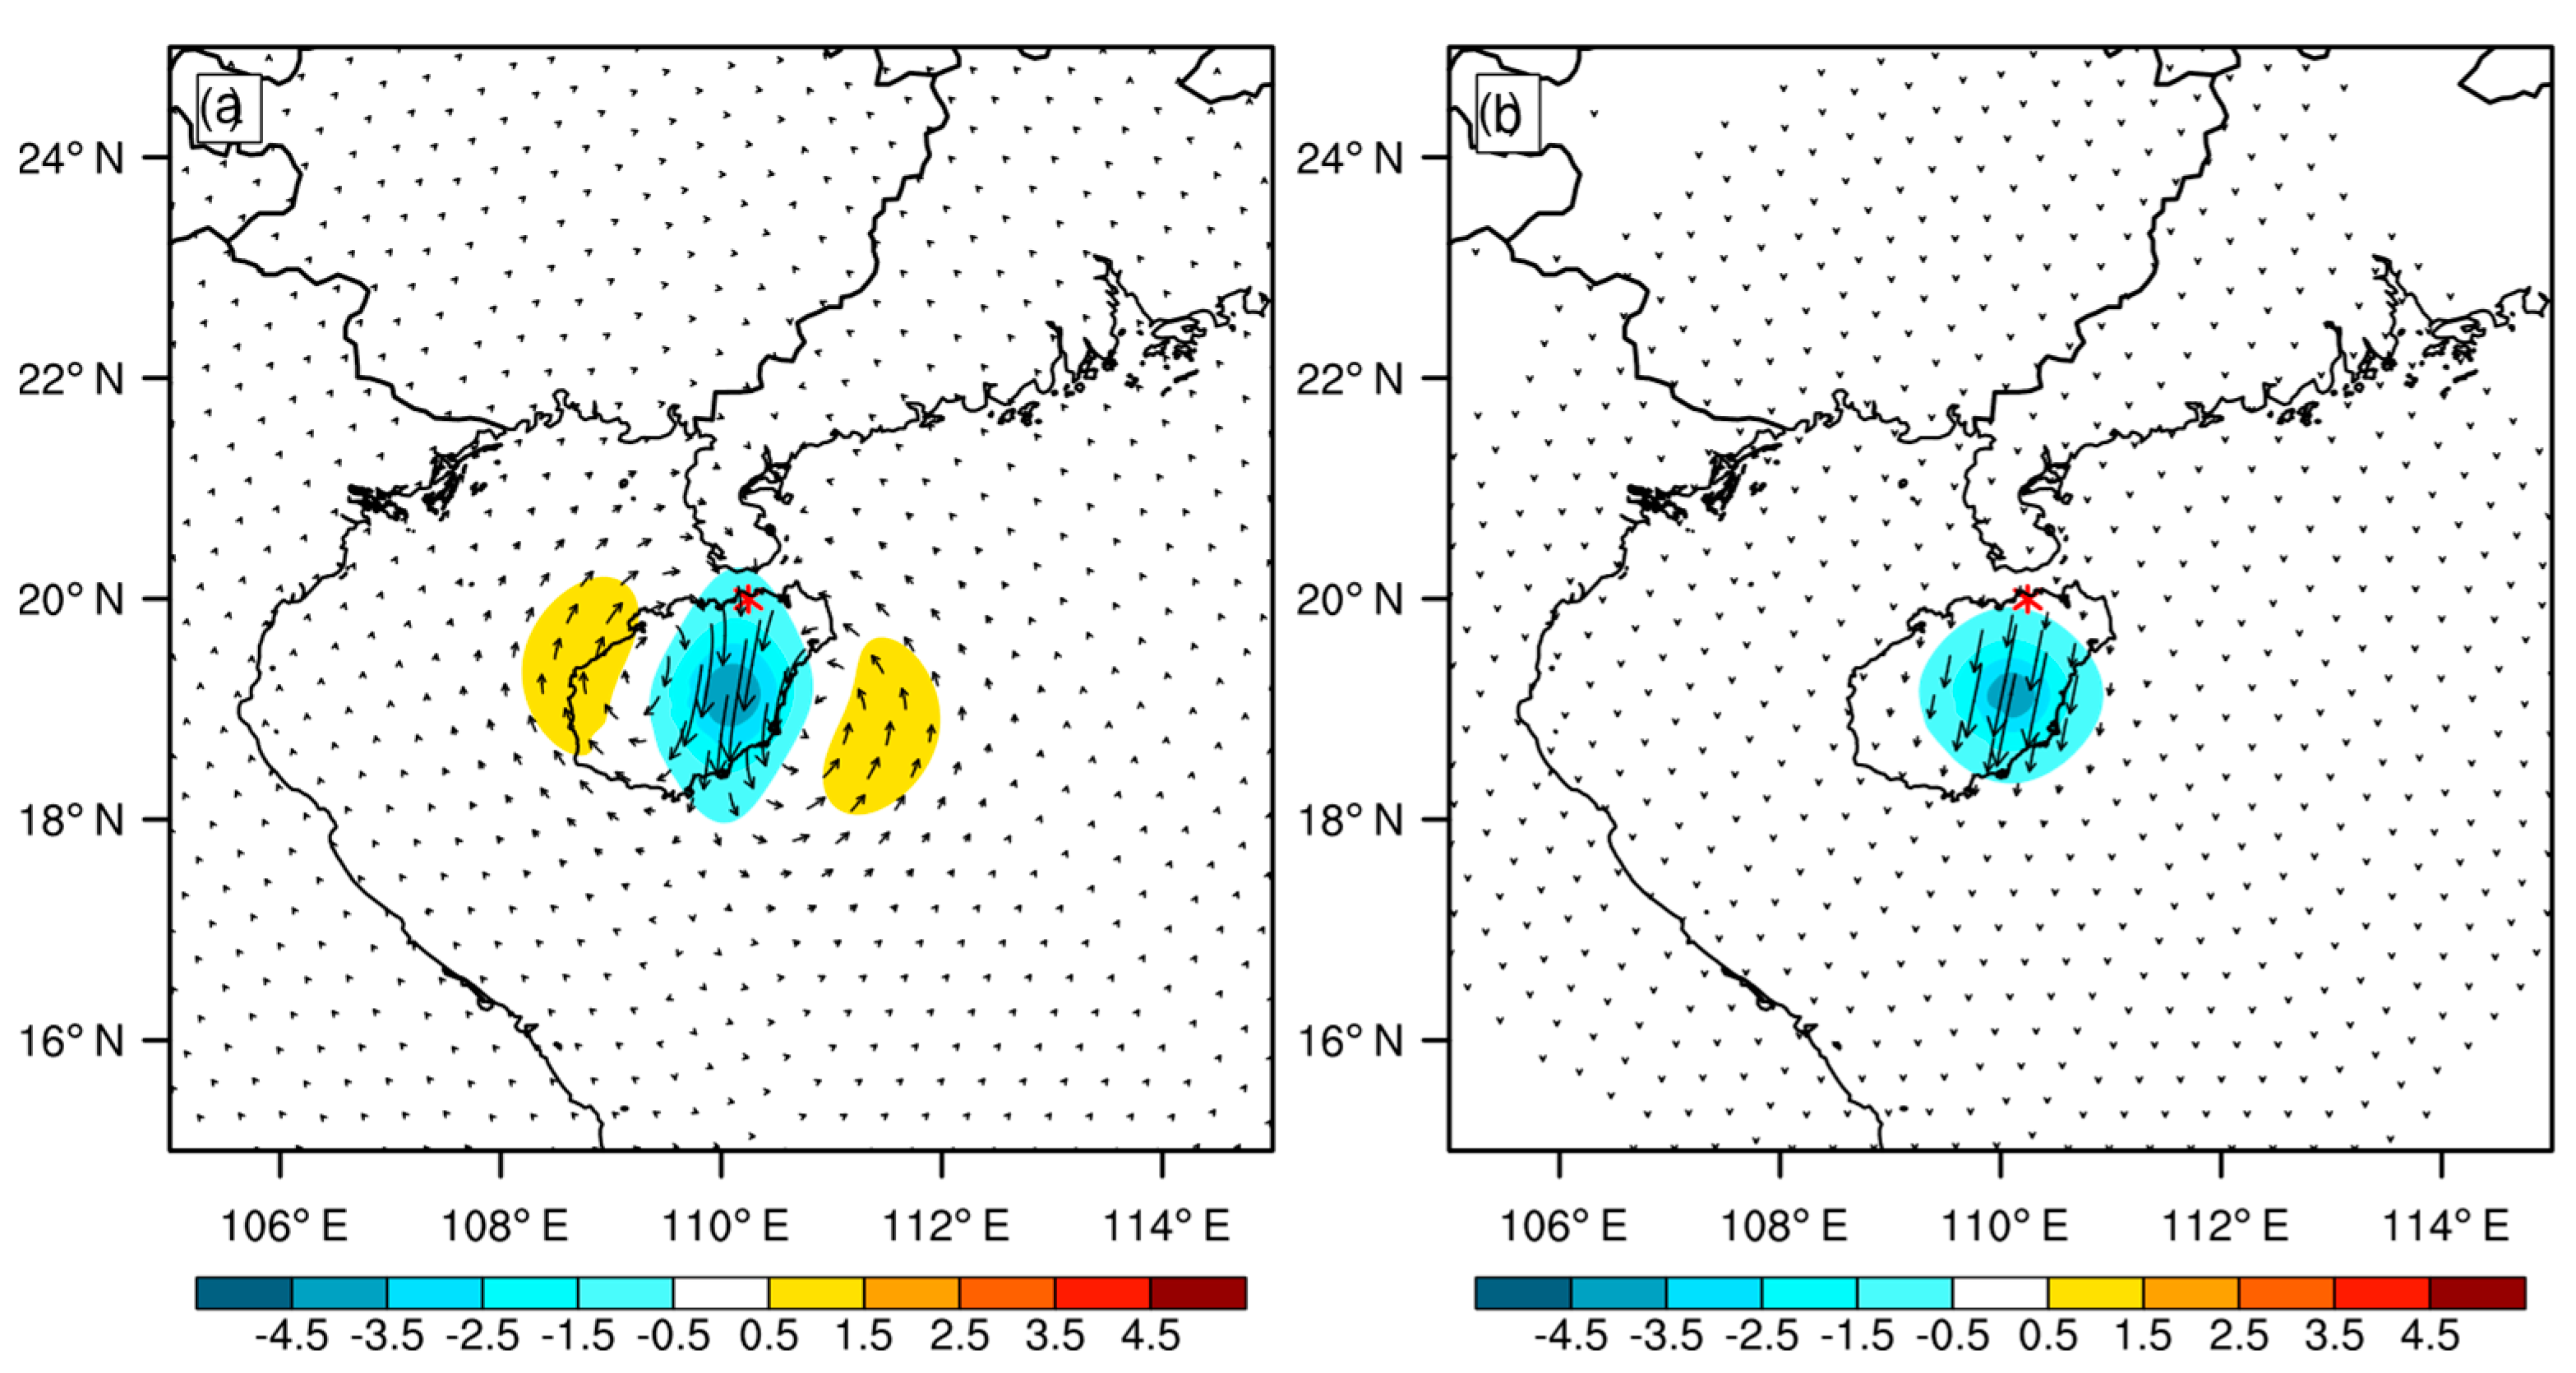
4.3. Single Observation Experiment

With the reliable observation data, a set of single observation experiment was designed. It can examine the effect on the dynamical structure in the model by assimilating different momentum control variables. The location of the observation was south of the radar (19.125° N, 110.09° E), at an altitude of 3321.8 m, with a positive radial velocity of 26.297 m/s. It can be inferred that the point was roughly located at 700 hPa with northerly winds. Figure 5 shows the y-component wind increment and wind vector increment at 700 hPa for different momentum control variable assimilation. The length scale factors are the ratio to the length scale. For both experiments having similar effect range, the length scale factor was set to 0.2 for DA_ψχ and 0.6 for DA_UV. Both produced a negative y-component wind increment at the observation point, with extreme values less than −3.5 m/s and decreasing in absolute value outward. DA_ψχ excited positive y-component wind increments on both sides of the negative region, forming two adjacent vorticity increments with the negative region, which are excited by geostrophic adaptation. In contrast, DA_UV has a consistent wind increment near the observation point. From the single-point experiment, it can be found that the longitudinal and latitudinal winds of DA_ψχ are not independent. They are constrained by the geostrophic equilibrium. Moreover, DA_ψχ has a more profound effect, changing the flow field with an increment of vorticity. DA_UV, on the other hand, relies on the observed wind and does not excite new vorticity increments beyond the observation.

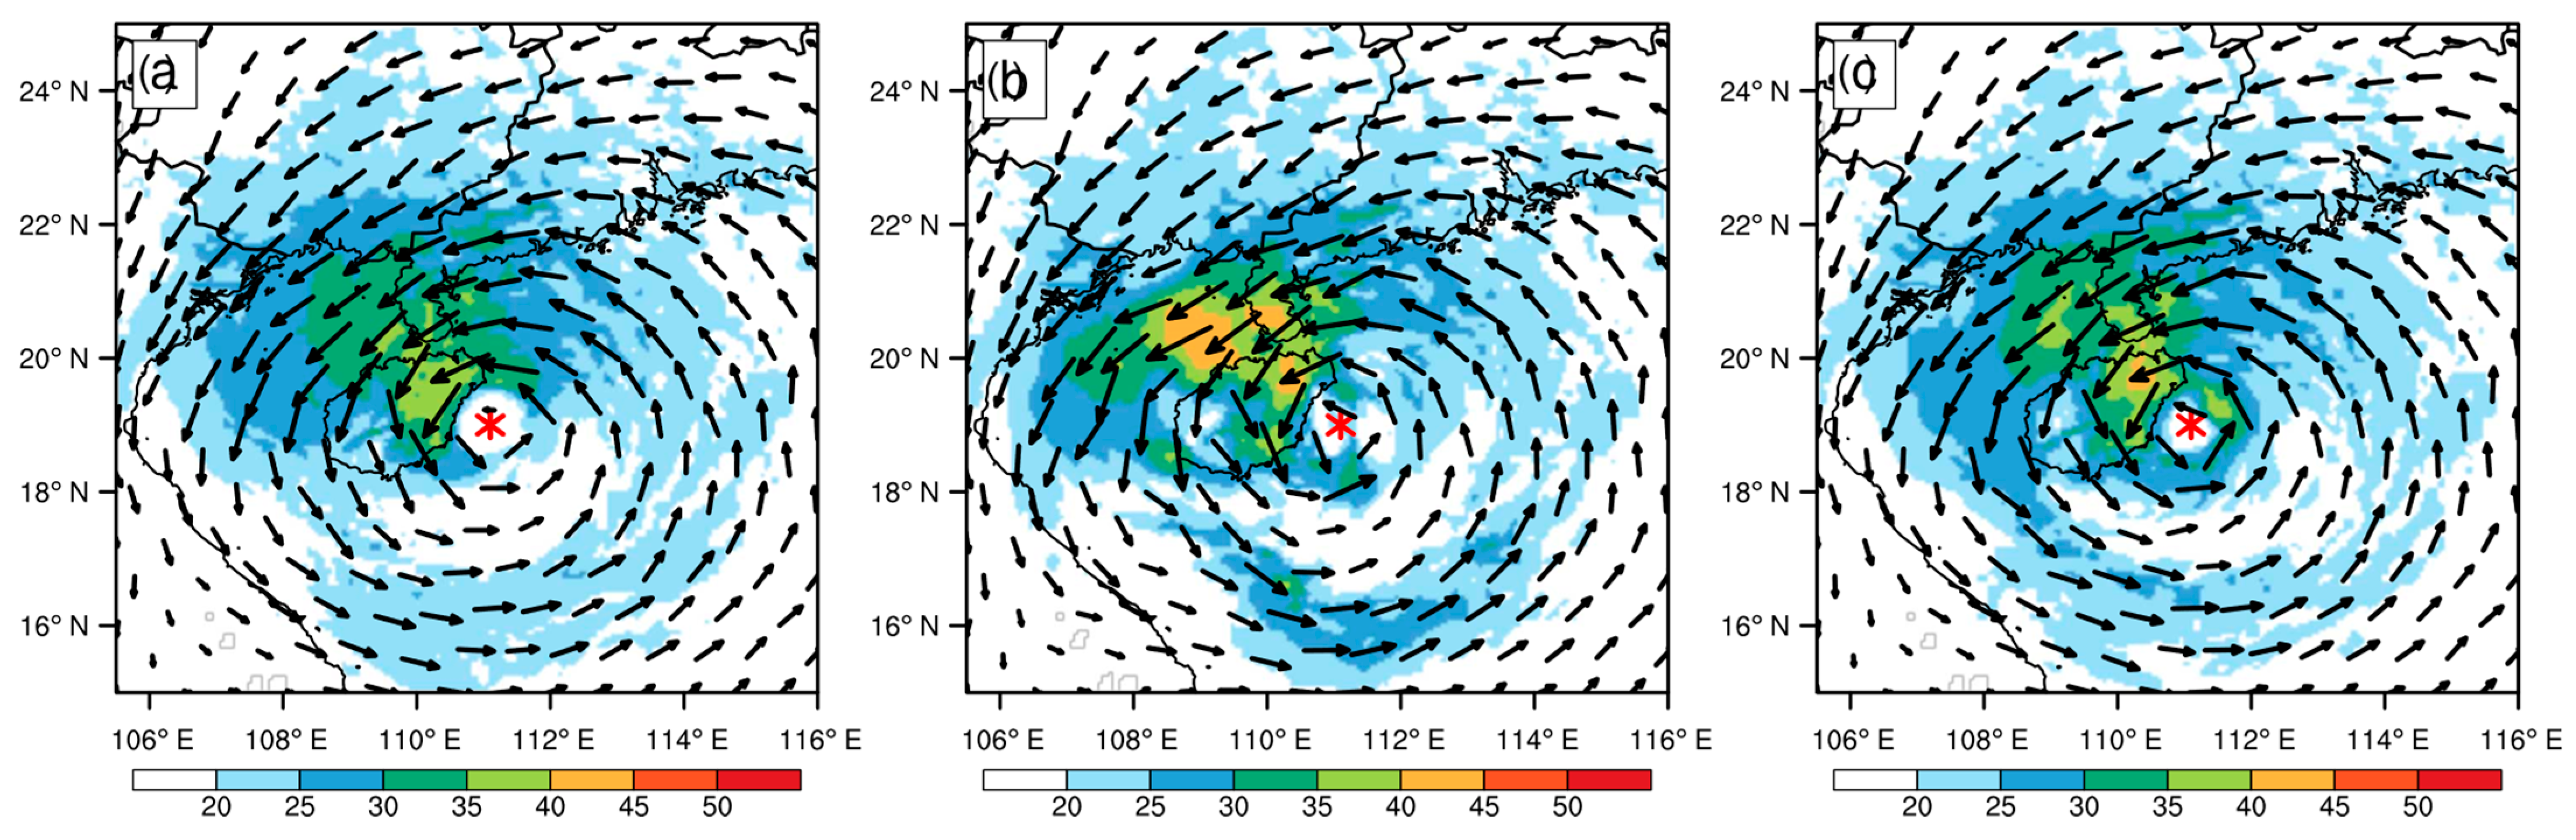
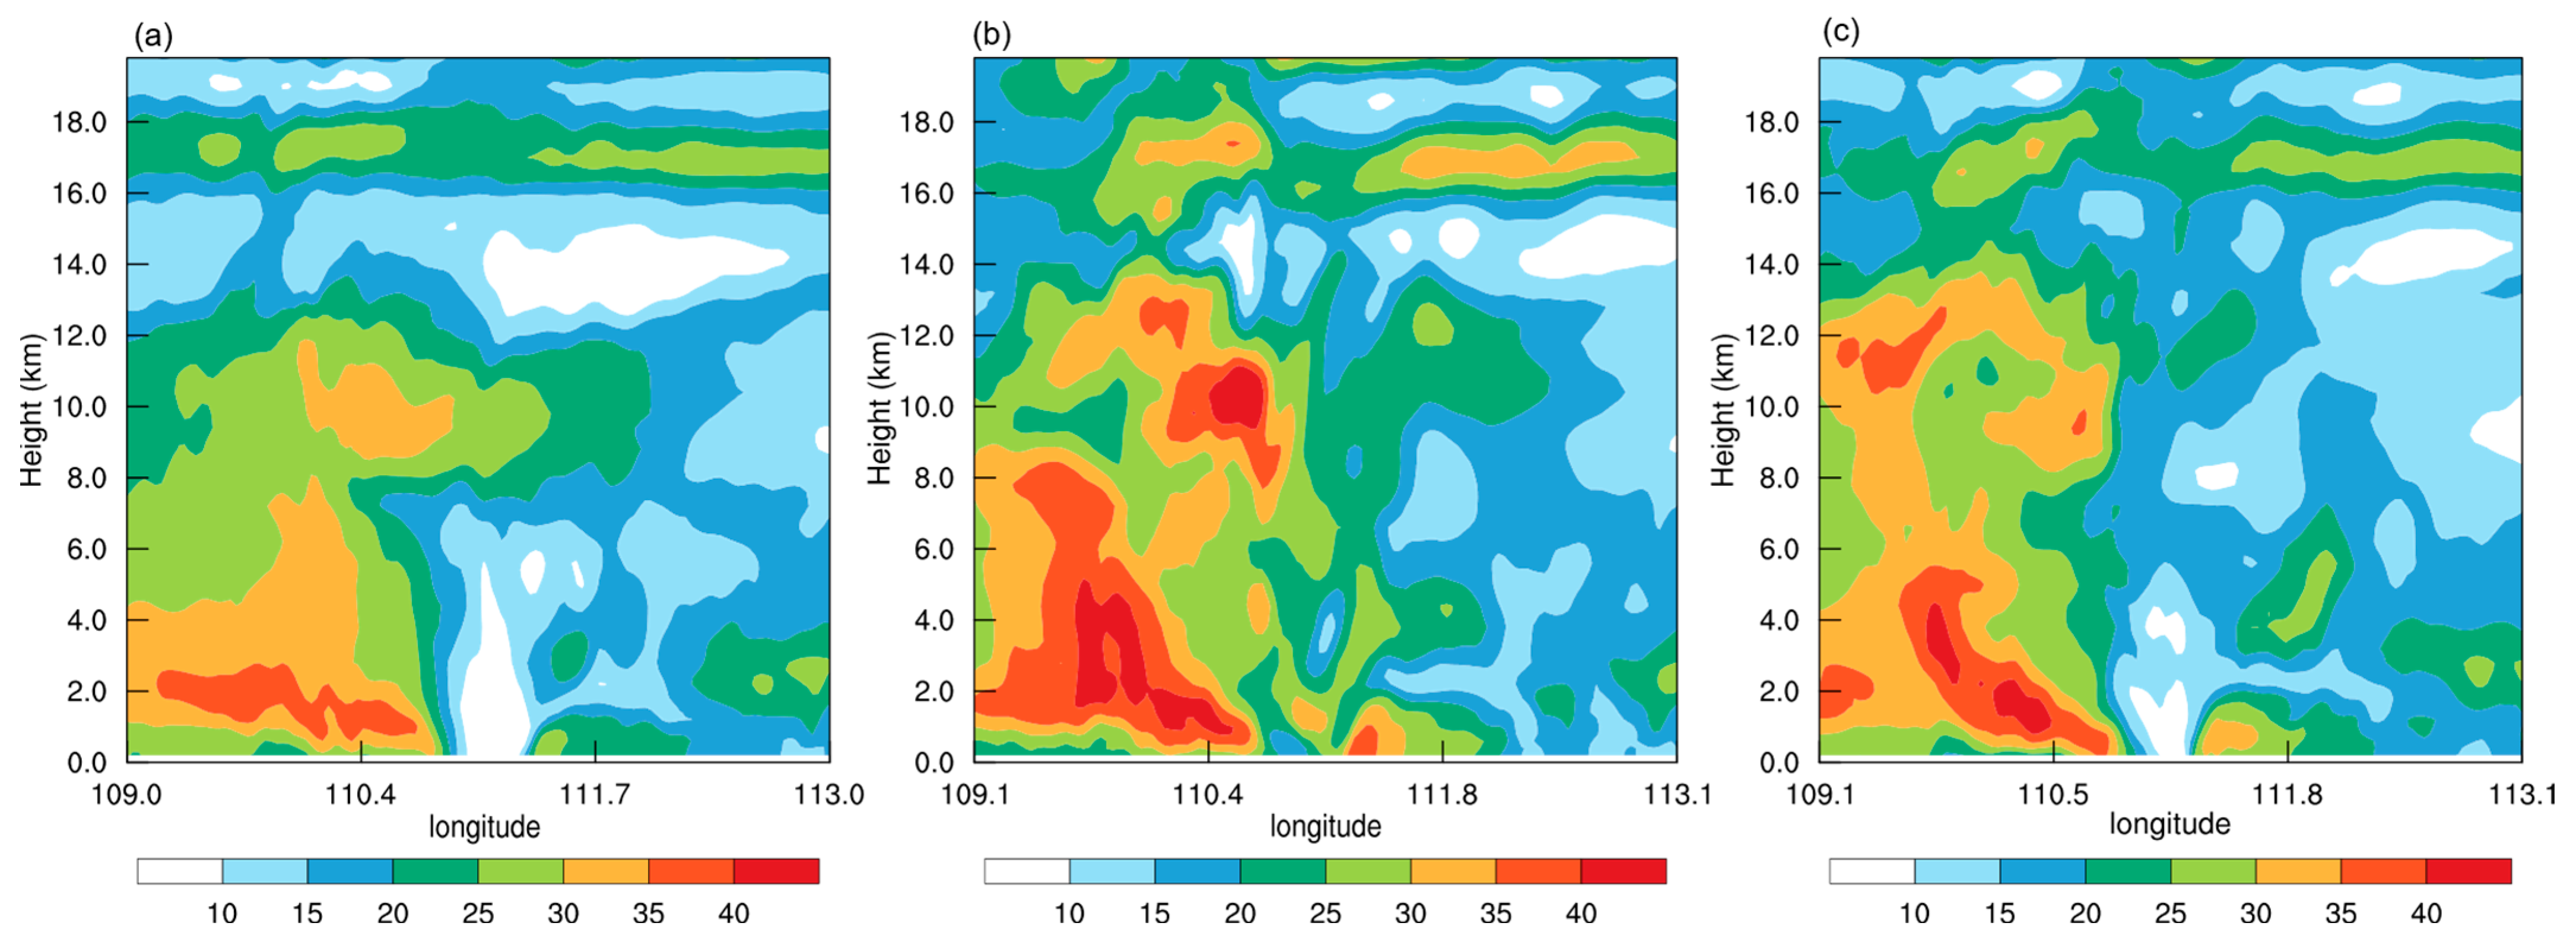
4.4. The Analysis of Kompasu

The single experiment showed how individual radar radial velocity affects the wind field, while the changes in the dynamical field in the model after seven cycles of assimilation could be even more profound. Figure 6 shows background and analysis wind speed and wind vector at 850 hPa at 0600 UTC 13 October. The “true” center location of Kompasu was from China Meteorological Administration (CMA). The circulation center of CTRL matched the real conditions with weaker TC intensity. It was manifested in the large TC’s eye which was weak wind zone with speed less than 20 m/s, insignificant closed wind circle, and the maximum wind speed not exceeding 40 m/s. In DA_ψχ, the wind in the northwestern part of Kompasu increased significantly. A large number of areas with wind speed over 40 m/s appeared, and the TC’s eye area was tightened. However, its TC’s eye changed from its original circular shape to an irregular shape similar to a two abreast circle. In DA_UV, the wind speed strengthened to over 40 m/s in the northwest of the TC center, while the wind field was also enhanced in the southeast. These winds formed a clear closed circle around the TC’s eye, with a complete and smaller eye area structure.
Figure 7 shows the increments of wind vector at 850 hPa after the assimilation with different momentum control variables. The effect of DA_ψχ on the wind field was obviously larger and more distant than that of DA_UV. The wind field increment in DA_ψχ appeared vortically, not only around Kompasu, but generated disorderly winds at a distance from Kompasu. To the east of the TC center, there were southerly wind increments, which strengthened the TC, whereas the wind increments in other directions of the TC appeared haphazard. The wind increments in DA_UV portrayed the original structure of the TC and appeared more organized. There were strong southeasterly wind increments in the northeastern part of the TC, and the winds around the TC’s eye area combined to reveal its cyclonic character. In the peripheral wind field of the TC, i.e., the southern side of Hainan Island, Kompasu was enhanced. To summarize, both assimilation schemes enhanced the main body of the TC, and DA_ψχ had a greater effect on the TC, even changing the structure of the TC’s eye area. DA_ψχ generated unrealistic winds, and DA_UV generated a more reasonable wind augmentation around the main body of the TC.
The effect of assimilation on the TC dynamical structure can be inferred from the 850 hPa wind field. The surface wind and sea level pressure were important indicators of TC intensity and an indicator to assess the impact of TCs on human life. Figure 8 shows 10 m wind rotated to earth coordinates as surface wind and sea level pressure. These variables were extracted from ARW WRF model output. Because Kompasu would soon make landfall, the wind speed on the west side of the TC was small in the three experiments. CTRL had a large TC’s eye, loose isobars, and low surface wind speed. DA_ψχ and DA_UV contracted TC’s eyes, compact isobars, and surface wind speeds larger than 30 m/s. After the assimilation, the TC enhanced the wind field and lower pressure relative to CTRL. Surface wind speed was stronger in DA_ψχ than DA_UV, but not concentrated in DA_ψχ. In DA_UV, winds were around the TC’s eye and coincided with the isobars.
The cyclonic nature of the DA_UV wind field is more pronounced in terms of single-level surface elements, while the sea-level pressure field is similar in two DA experiments. To investigate the variation of the vertical structure of the TC, Figure 9 shows vertical cross sections of analyzed horizontal wind speed that are along the red lines in Figure 8. The extreme center of the wind in CTRL is around 2 km height, and the wind speed is less than 40 m/s. The wind speed decreases from 2 km height upwards, and the top of the TC is about 13 km height. The TC’s eye area boundary was obvious and wind speed was less than 10 m/s in the TC’s eye while it increased outwardly. DA_ψχ compared to CTRL, the wind field was significantly enhanced, with the maximum wind speed exceeding 40 m/s. However, the extreme center of DA_ψχ was not concentrated and the range was larger. A severe convection occurred at about a 10 km height and the wind speed in the area exceeded 40m/s. Because the severe convection was isolating and such a strong wind speed is not expected to occur at such a high altitude, it was judged as a false convection. At the same time, the TC center became blurred and there were no areas of wind speeds less than 10 m/s at the lower levels. The wind field in DA_UV was also enhanced relative to CTRL, with the area of strong winds changing from flat to upward rumbling. The structure of the TC’s eye area was obvious, with the vertical column’s wind speed less than 20 m/s extending to the top of the TC. DA_UV simulated the vertical structure of the TC close to the theory, with the enhanced TC intensity at the same time. The original vertical structure of the TC was disrupted in DA_ψχ and false convection appears, which had a negative impact.
Quantitative comparisons were further conducted to evaluate the improved effect of the model wind in the two sets of assimilation experiments. Figure 10 calculates the root mean square error (RMSE) of the radar radial velocity for the background and the analysis. The RMSEs decreased the most after the first assimilation, while each subsequent assimilation made the RMSEs decrease. This was due to the simulation wind that was much less close to the real situation on the background field of the model at the first assimilation, so the increment of the first assimilation was also the largest. After the first assimilation, the RMSE of the analysis of DA_UV was smaller than that of DA_ψχ. Due to the accumulation effect, from the second time, the RMSEs of the background field of DA_UV were all lower than that of DA_ψχ. The RMSEs of the analysis of DA_UV were also smaller than that of DA_ψχ. This indicates that the wind in DA_UV was closer to the real situation, and its assimilation effect was better than that of DA_ψχ.

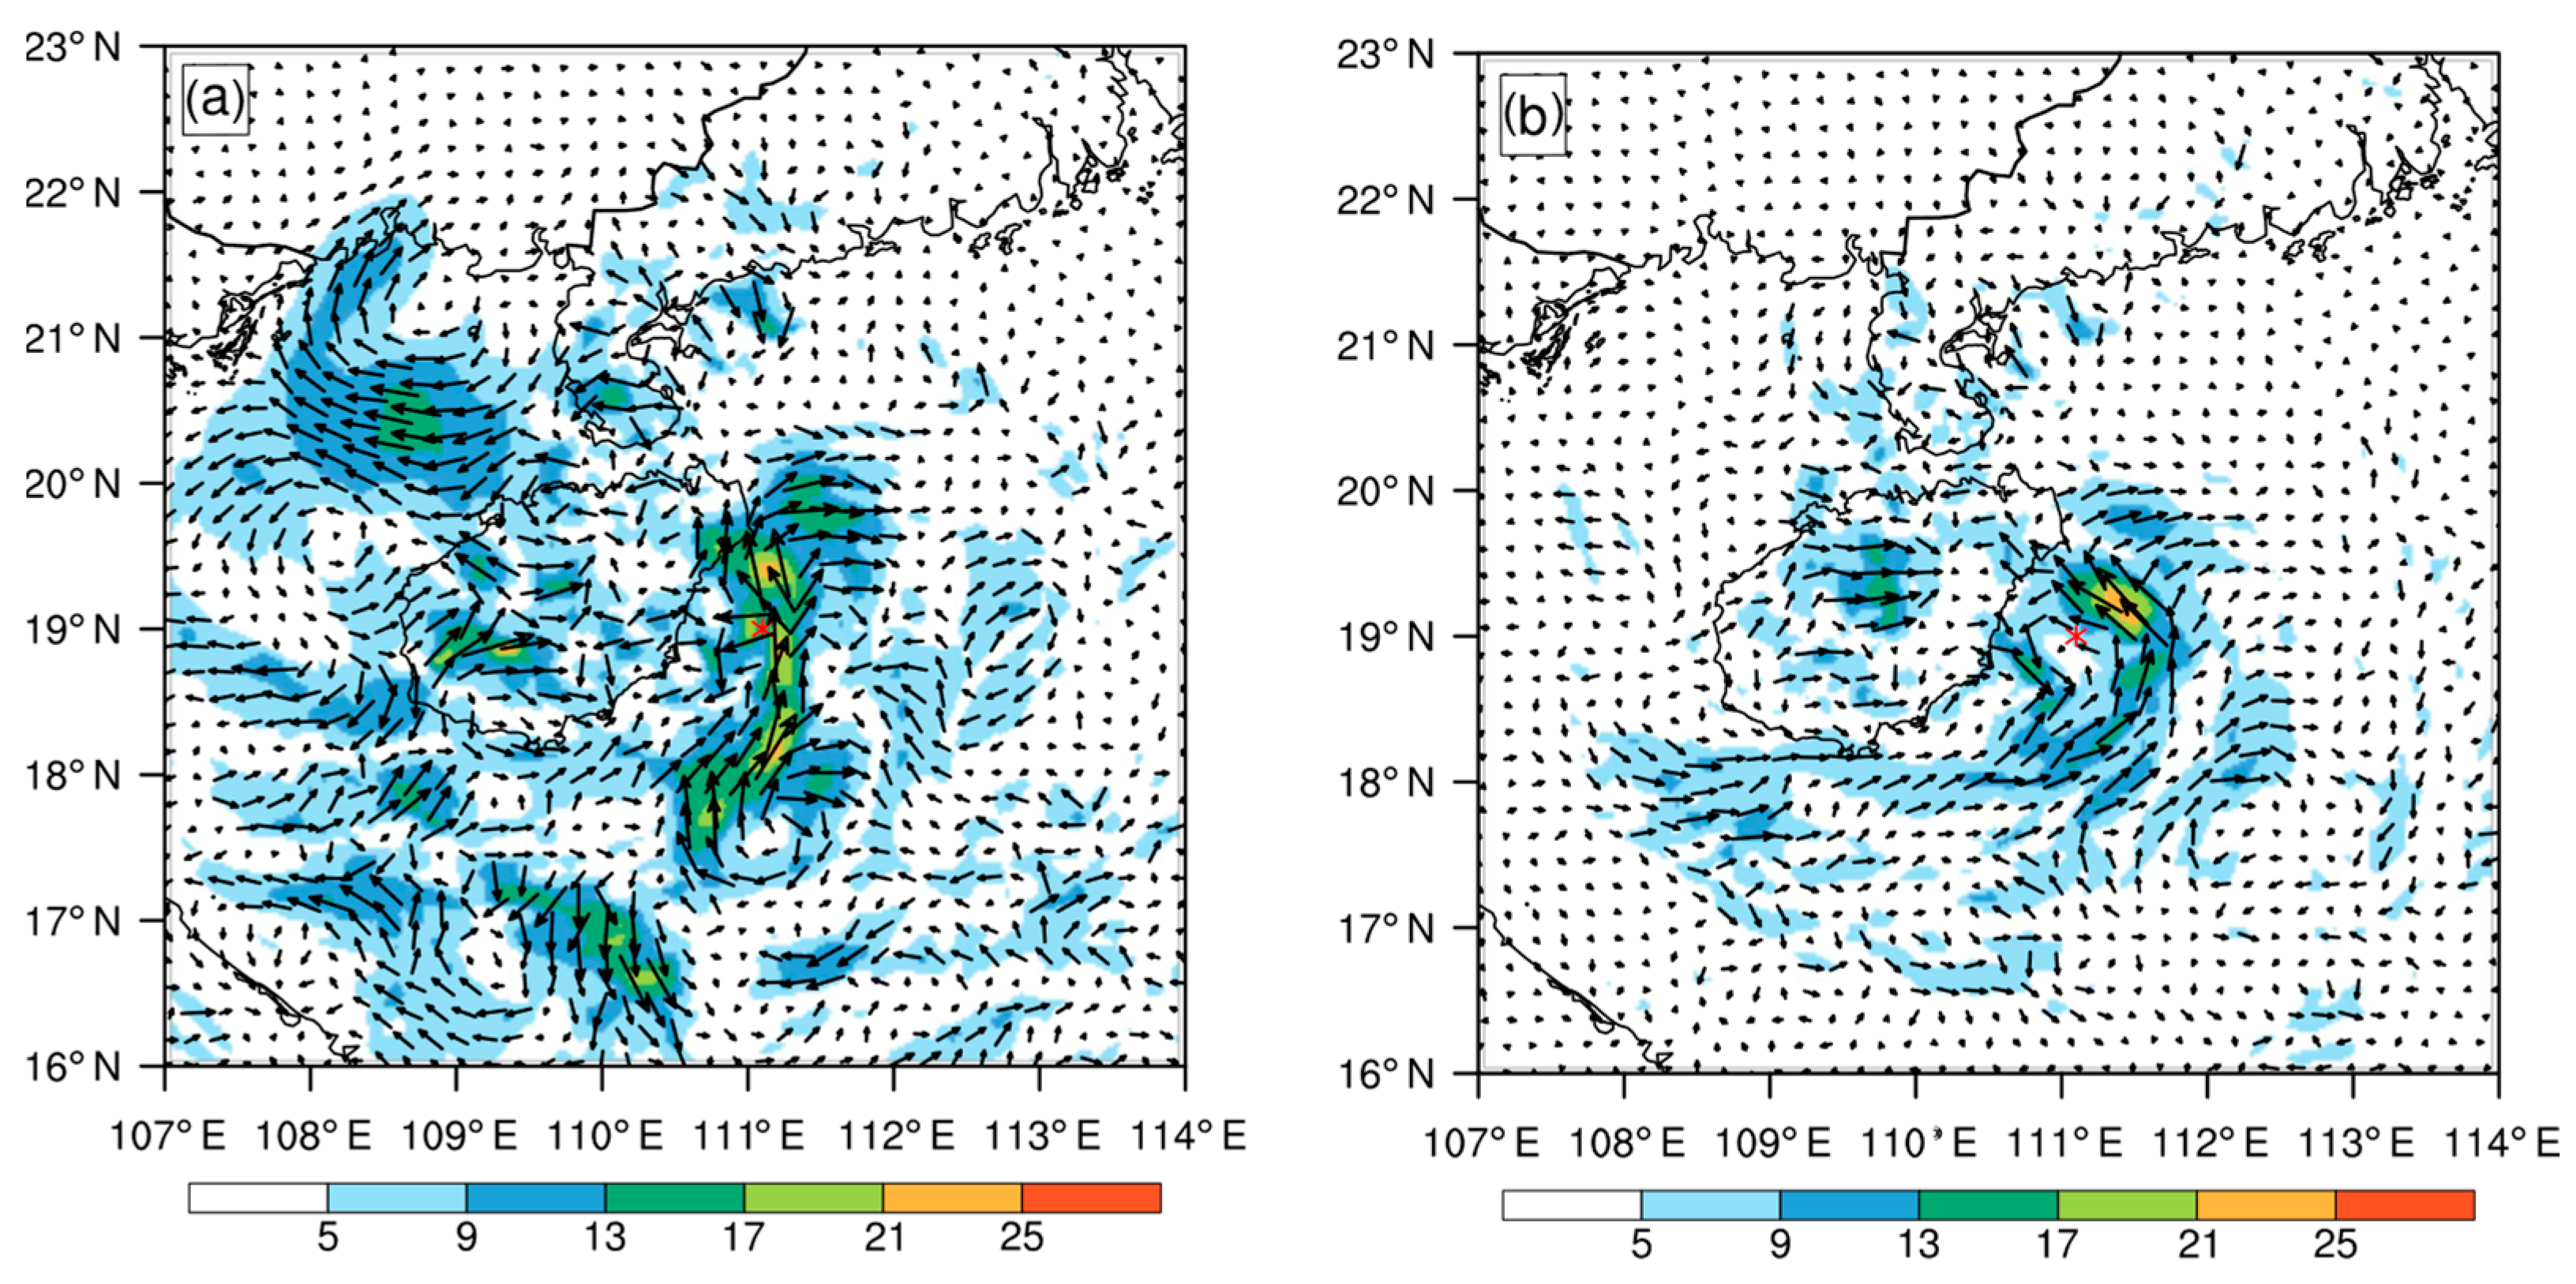
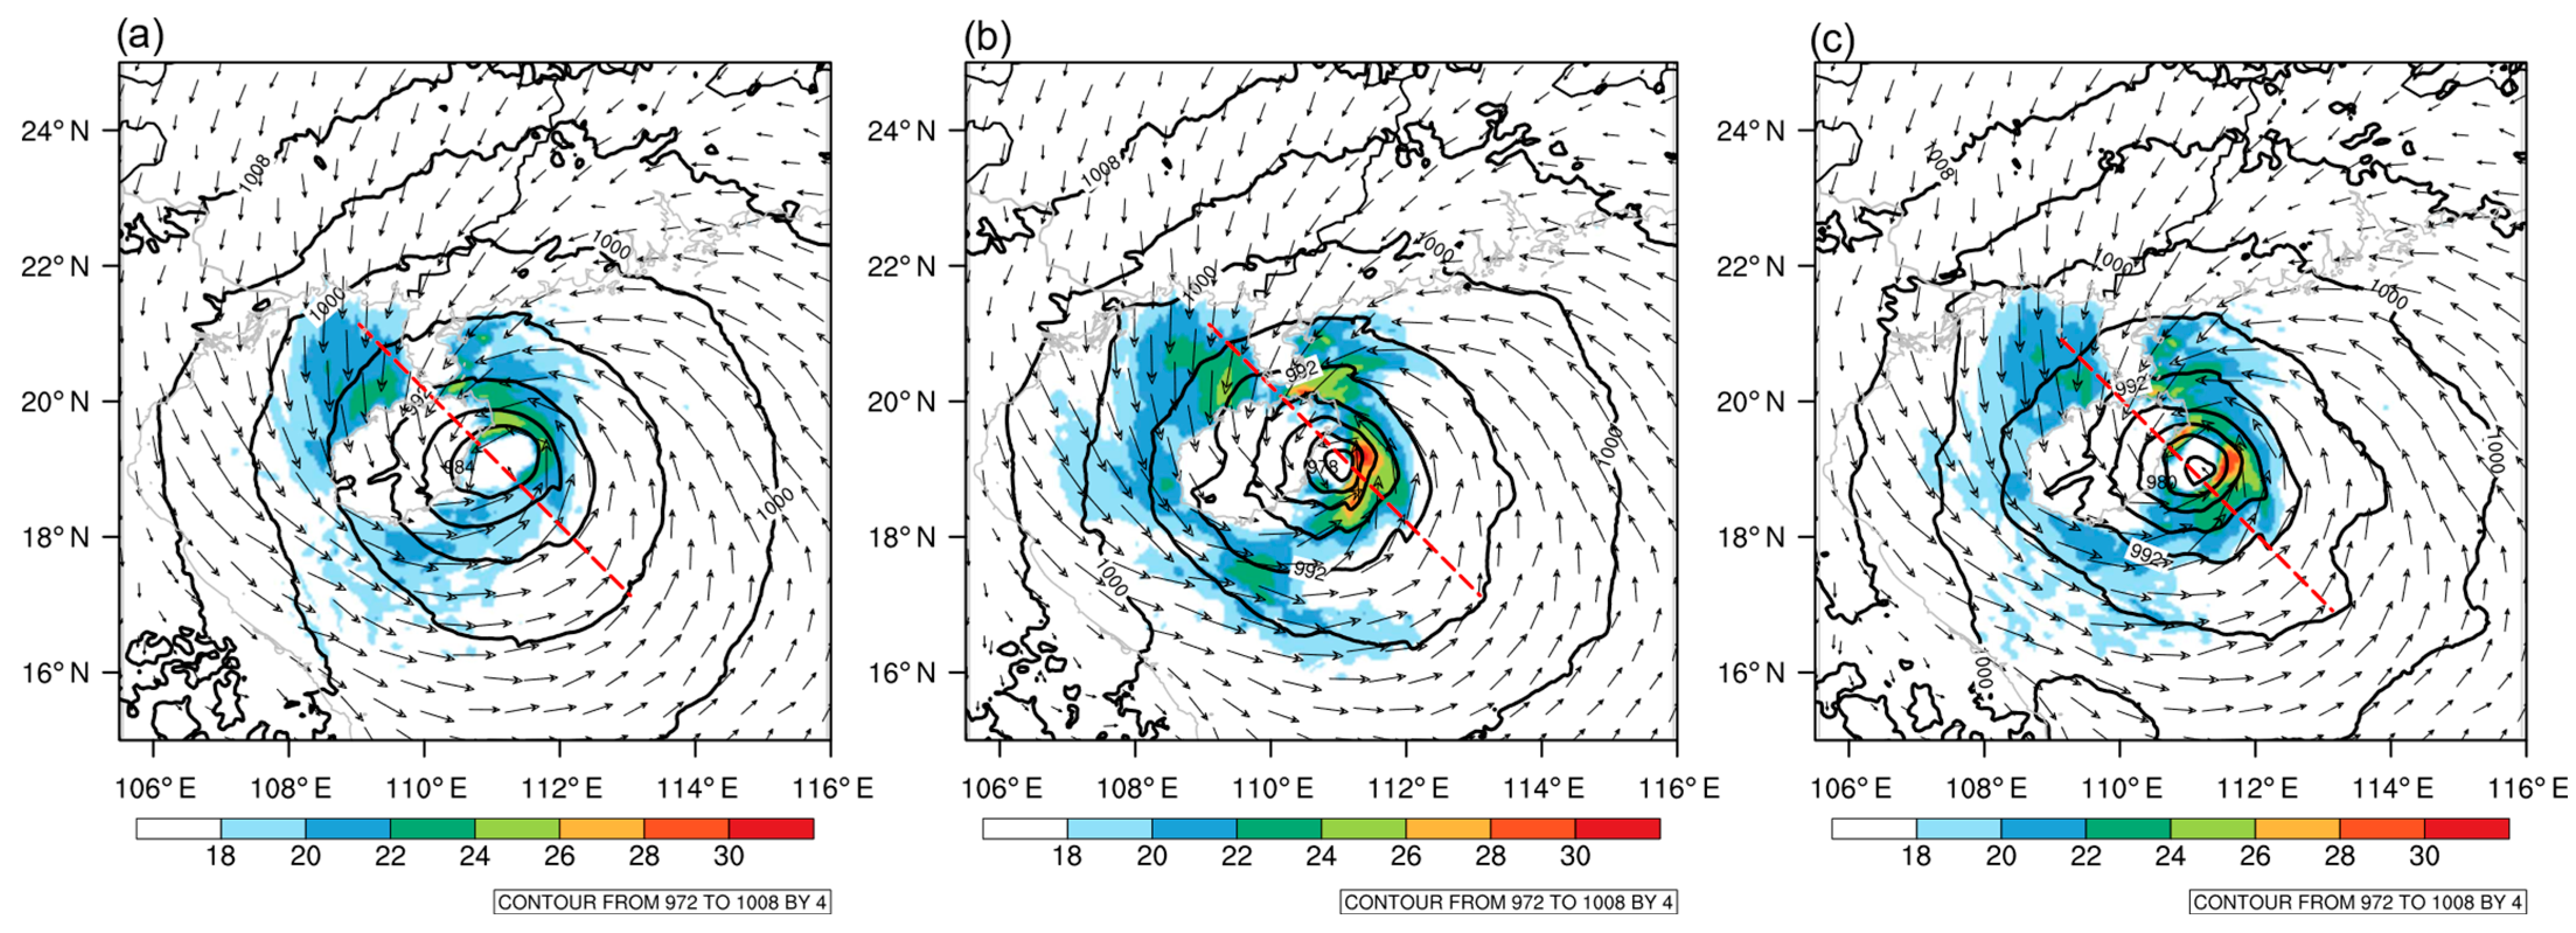
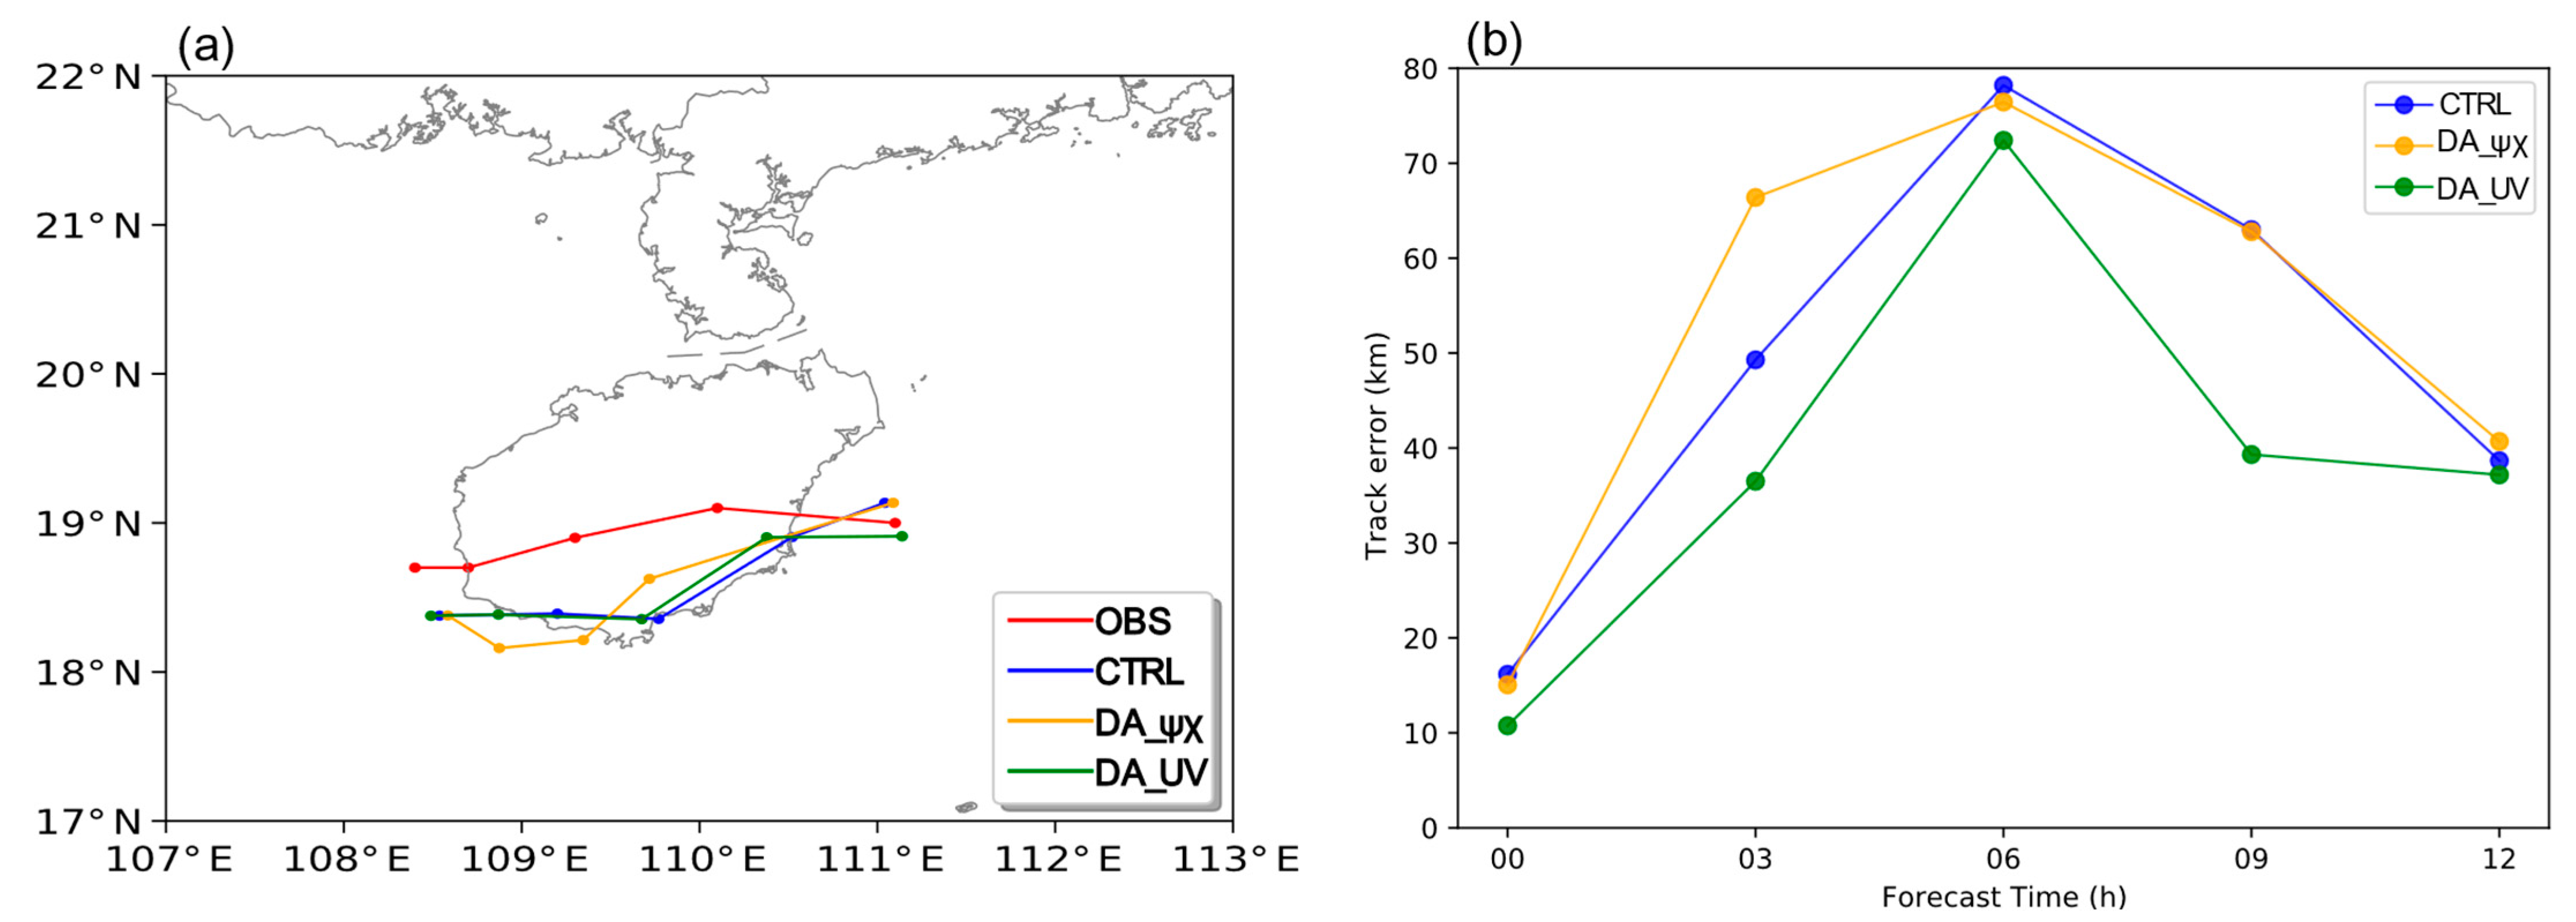
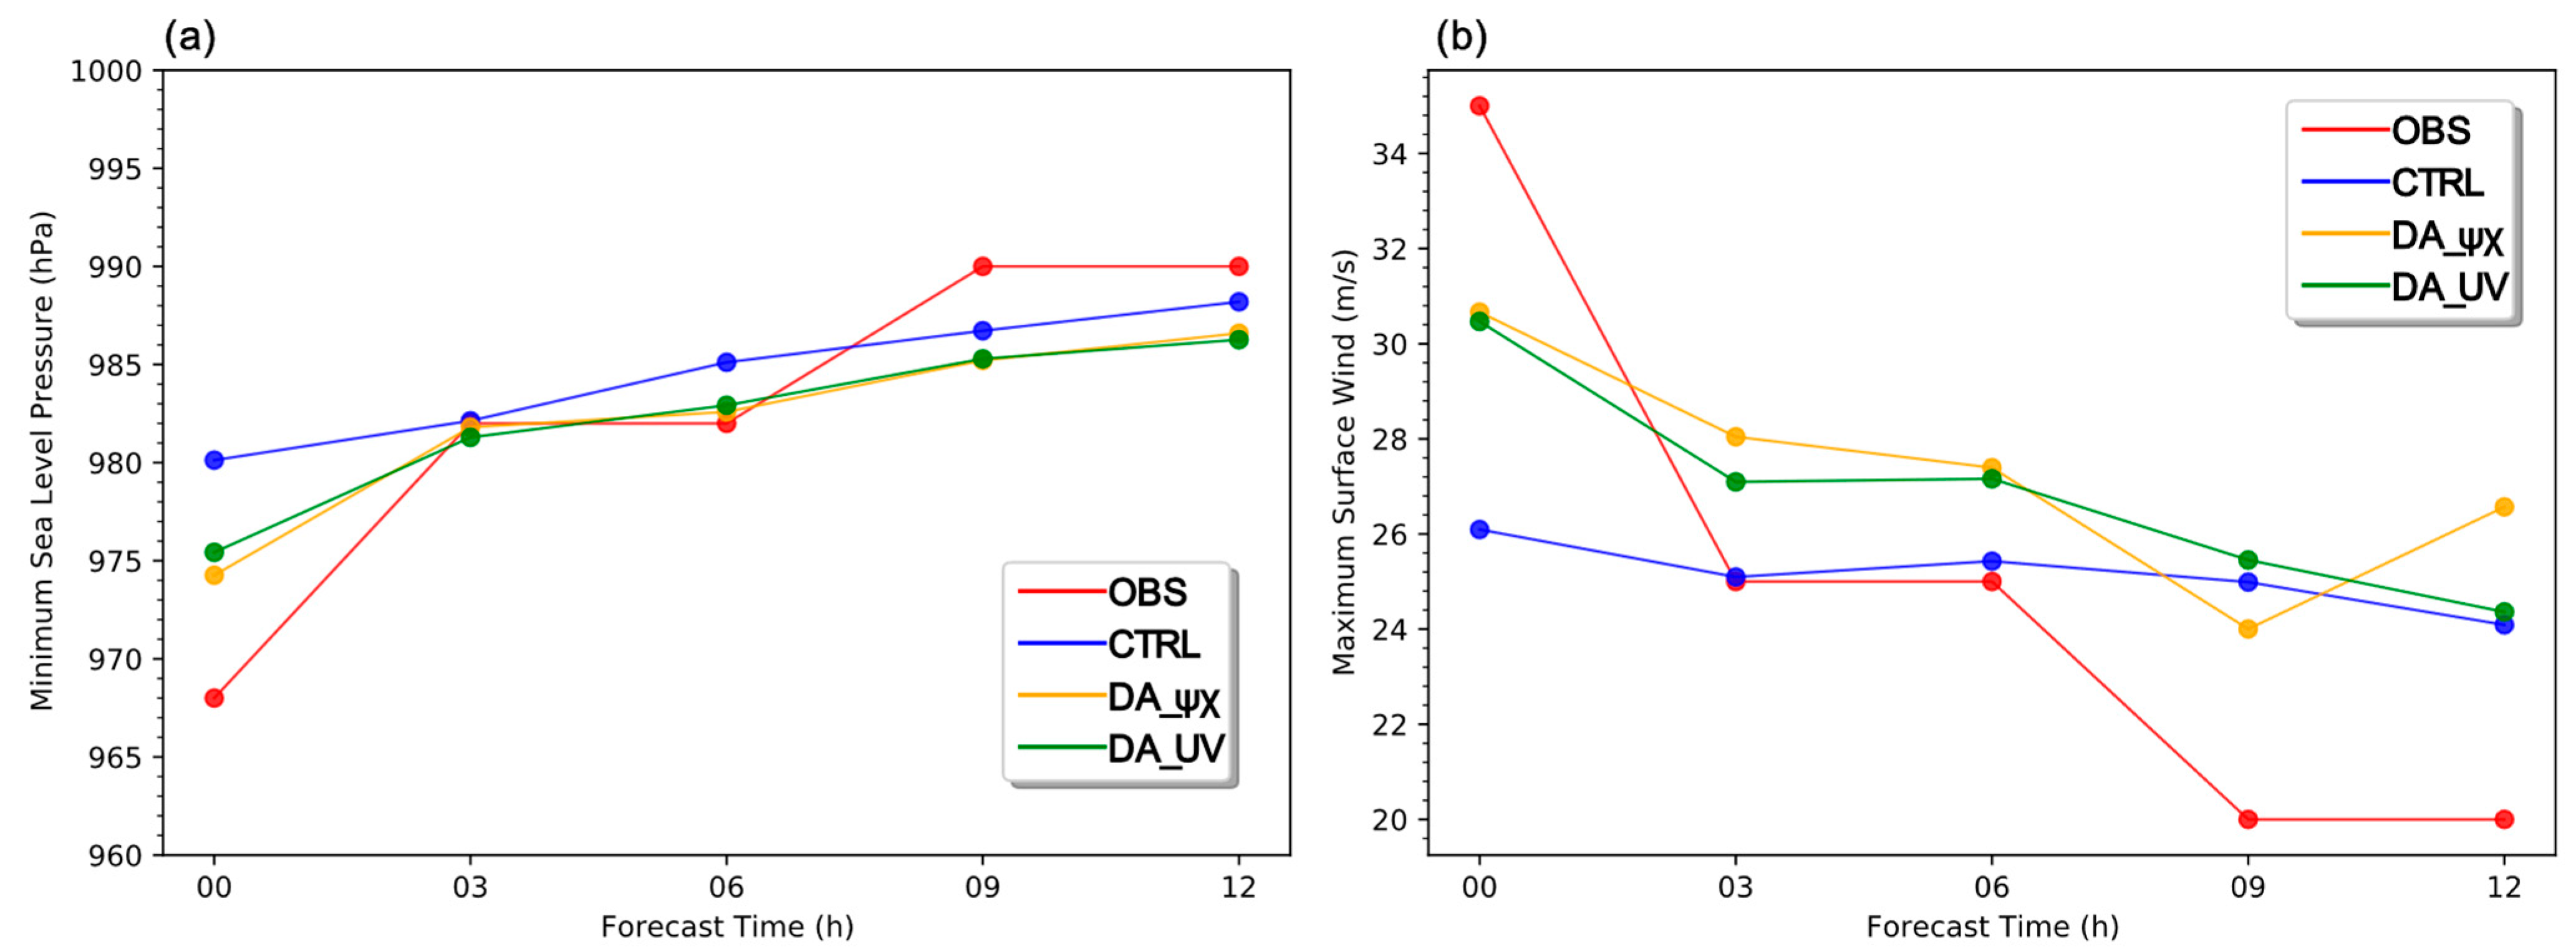
4.5. The Forecast of Kompasu

The purpose of the assimilation is to obtain a more accurate initial field. In order to evaluate the effect of the different momentum control variables, we made a 12 h deterministic forecast after the assimilation. We defined the typhoon center at the location of MSLP. Figure 11 shows the simulated track with the best track from CMA and the errors of three experiments during forecast time. At the last assimilation time, the TC center position of CTRL was northward of the best track and DA_ψχ was close to CTRL, while DA_UV obviously shifts CTRL to the south of the best track. From the Figure 11b, DA_UV was closer to the best track, with an error of about 10 km. Due to the effect of landfall, the simulated TC track error increases. The track error of DA_UV was significantly smaller than that of the other experiments. DA_ψχ had a less improved path forecast, even worse than CTRL.
Another difficulty in forecasting typhoons is the intensity. The maximum surface wind (MSW) and minimum sea level pressure (MSLP) are two important physical quantities to characterize the TC intensity. Figure 12 shows the forecast of MSLP and MSW. At the last assimilation time, the MSLP of OBS down to 968 hPa and WSM up to 35 m/s. The MSLP of CTRL was only 980 hPa and MSW was only 26 m/s, which indicates that the TC of CTRL is weak. After assimilation, the MSLP dropped to about 975 hPa and the MSW was more than 30 m/s. The assimilation enhanced the TC, but the effect of the two schemes was similar. Generally, the track forecast and intensity of DA_UV are more accurate. The track forecast of DA_ψχ was not significant, but enhances the intensity forecast. This is due to the fact that DA_ψχ produced unphysical winds during assimilation, which made the wind speed enhanced, but its location was inaccurate, producing a negative effect.

5. Conclusions and Discussion

In this paper, simulated assimilation experiments were conducted for Kompasu using different momentum control variables. Pre-experimentation, the radar data were processed and the velocity was unfolded. The background error statistics were evaluated under both control variable schemes, with larger variance scales at middle levels and smaller length scales under the U-V control variable. The single observation experiment shows that DA_ψχ produced cyclonic increments, while DA_UV only produced increments in the same direction as the observation. DA_ψχ had a significantly enhanced wind field at 850 hPa, but produces a large number of unphysical cyclonic increments. DA_UV, on the other hand, produced reasonable cyclonic increments to enhance the TC. The assimilation makes the surface wind enhanced and the sea level pressure at the TC center reduced. The circular structure of the DA_ψχ wind field was not clear and the large wind area was not concentrated. The DA_ψχ showed spurious convection at the high altitude of the vertical cross section, while the DA_UV presented an enhanced large wind area at the bottom. The RMSE of the radial velocity was smaller during the circular assimilation in DA_UV. In terms of Kompasu forecasts, DA_ψχ did not improve the path forecast of Kompasu, while DA_UV showed a significant improvement. Both DA_ψχ and DA_UV improved the intensity forecast of Kompasu, but the difference between them is not significant. In summary, DA_ψχ produces more unrealistic winds, although it can affect a longer range. This may be due to the fact that the TC system is a deep low-pressure system that does not conform to the geostrophic equilibrium. In contrast, the winds produced by DA_UV are based on the observations themselves, and therefore do not produce additional increments. Results show that DA_UV is better for simulating and forecasting Kompasu.
This study focused on the effects of different control variables in the assimilation of radar data. The conclusions were found based on one individual case. Thus, other weather systems need to be further investigated in future studies. On the other hand, the effect of joint assimilation with other observations is uncertain since there are numerous observations available currently. Hence, the effect of the joint assimilation of other observations such as satellite radiation data will be evaluated next study [27,28].

Author Contributions

Conceptualization, G.Y. and F.S.; methodology, G.Y.; software, J.M.; validation, G.Y., F.S.; formal analysis, G.Y.; investigation, J.M.; resources, J.M.; data curation, G.Y.; writing—original draft preparation, G.Y.; writing—review and editing, J.M. and F.S.; visualization, G.Y.; supervision, J.M.; project administration, J.M.; funding acquisition, J.M. All authors have read and agreed to the published version of the manuscript.

Funding

This research was funded by a grant from the National Natural Science Foundation of China, grant number 42192553. Program of Shanghai Academic/Technology Research Leader (21XD1404500), the Shanghai Typhoon Research Foundation (TFJJ202107), Innovation and Development Projects of China Meteorological Administration (CXFZ2021Z033), Open Research Fund Project on Drought and Flood in Plateau and Basin of Sichuan Provincial Key Laboratory (SZKT202002), Natural Science Foundation of China (U2242212).

Institutional Review Board Statement

Not applicable.

Informed Consent Statement

Written informed consent has been obtained from the patients to publish this paper.

Data Availability Statement

Not applicable.

Conflicts of Interest

The authors declare no conflict of interest.

References

  1. Shu, A.; Shen, F.; Jiang, L.; Zhang, T.; Xu, D. Assimilation of Clear-sky FY-4A AGRI radiances within the WRFDA system for the prediction of a landfalling Typhoon Hagupit (2020). Atmospheric Res. 2022, 283, 106556. [Google Scholar] [CrossRef]
  2. Song, L.; Shen, F.; Shao, C.; Shu, A.; Zhu, L. Impacts of 3DEnVar-Based FY-3D MWHS-2 Radiance Assimilation on Numerical Simulations of Landfalling Typhoon Ampil (2018). Remote Sens. 2022, 14, 6037. [Google Scholar] [CrossRef]
  3. Zhang, X.; Xu, D.; Liu, R.; Shen, F. Impacts of FY-4A AGRI Radiance Data Assimilation on the Forecast of the Super Typhoon “In-Fa” (2021). Remote Sens. 2022, 14, 4718. [Google Scholar] [CrossRef]
  4. Yue, J.; Meng, Z.; Yu, C.K.; Cheng, L.W. Impact of coastal radar observability on the forecast of the track and rainfall of Typhoon Morakot (2009) using WRF-based ensemble Kalman filter data assimilation. Adv. Atmos. Sci. 2017, 34, 66–78. [Google Scholar] [CrossRef]
  5. Xu, D.; Shen, F.; Min, J. Effect of background error tuning on assimilating radar radial velocity observations for the forecast of hurricane tracks and intensities. Meteorol. Appl. 2020, 27, e1820. [Google Scholar] [CrossRef] [Green Version]
  6. Feng, J.; Duan, Y.; Wan, Q.; Hu, H.; Pu, Z. Improved prediction of landfalling tropical cyclone in China based on assimilation of radar radial winds with new super-observation processing. Weather. Forecast. 2020, 35, 2523–2539. [Google Scholar] [CrossRef]
  7. Xu, D.; Shen, F.; Min, J. Effect of Adding Hydrometeor Mixing Ratios Control Variables on Assimilating Radar Observations for the Analysis and Forecast of a Typhoon. Atmosphere 2019, 10, 415. [Google Scholar] [CrossRef] [Green Version]
  8. Shen, F.; Min, J.; Li, H.; Xu, D.; Shu, A.; Zhai, D.; Guo, Y.; Song, L. Applications of Radar Data Assimilation with Hydrometeor Control Variables within the WRFDA on the Prediction of Landfalling Hurricane IKE (2008). Atmosphere 2021, 12, 853. [Google Scholar] [CrossRef]
  9. Wu, W.; Purser, J. Three-dimensional variational analysis with spatially inhomogeneous covariances. Mon. Wea. Rev. 2002, 130, 2905–2916. [Google Scholar] [CrossRef]
  10. Xu, D.; Yang, G.; Wu, Z.; Shen, F.; Li, H.; Zhai, D. Evaluate Radar Data Assimilation in Two Momentum Control Variables and the Effect on the Forecast of Southwest China Vortex Precipitation. Remote Sens. 2022, 14, 3460. [Google Scholar] [CrossRef]
  11. Shen, F.; Song, L.; Li, H.; He, Z.; Xu, D. Effects of different momentum control variables in radar data assimilation on the analysis and forecast of strong convective systems under the background of northeast cold vortex. Atmos. Res. 2022, 280, 106415. [Google Scholar] [CrossRef]
  12. Li, X.; Zeng, M.; Wang, Y.; Wang, W.; Wu, H.; Mei, H. Evaluation of two momentum control variable schemes and their impact on the variational assimilation of radar wind data: Case study of a squall line. Adv. Atmos. Sci. 2016, 33, 1143–1157. [Google Scholar] [CrossRef]
  13. Sun, J.; Wang, H.; Tong, W.; Zhang, Y.; Lin, C.-Y.; Xu, D. Comparison of the Impacts of Momentum Control Variables on High-Resolution Variational Data Assimilation and Precipitation Forecasting. Mon. Weather. Rev. 2016, 144, 149–169. [Google Scholar] [CrossRef]
  14. Thiruvengadam, P.; Indu, J.; Ghosh, S. Assimilation of Doppler Weather Radar data with a regional WRF-3DVAR system: Impact of control variables on forecasts of a heavy rainfall case. Adv. Water Resour. 2019, 126, 24–39. [Google Scholar] [CrossRef]
  15. Chen, Y.; Rizvi, S.R.H.; Huang, X.-Y.; Min, J.; Zhang, X. Balance characteristics of multivariate background error covariances and their impact on analyses and forecasts in tropical and Arctic regions. Arch. Meteorol. Geophys. Bioclimatol. Ser. B 2013, 121, 79–98. [Google Scholar] [CrossRef] [Green Version]
  16. Parrish, D.F.; Derber, J.C. The National Meteorological Center’s Spectral Statistical-Interpolation Analysis System. Mon. Weather Rev. 1992, 120, 1747–1763. [Google Scholar] [CrossRef]
  17. Krause, J.M. A Simple Algorithm to Discriminate between Meteorological and Nonmeteorological Radar Echoes. J. Atmospheric Ocean. Technol. 2016, 33, 1875–1885. [Google Scholar] [CrossRef]
  18. Helmus, J.J.; Collis, S.M. The Python ARM Radar Toolkit (Py-ART), a Library for Working with Weather Radar Data in the Python Programming Language. J. Open Res. Softw. 2016, 4, 25. [Google Scholar] [CrossRef] [Green Version]
  19. Xue, M.; Wang, D.H.; Gao, J.D.; Brewster, K.; Droegemeier, K.K. The Advanced Regional Prediction System (ARPS), storm-scale numerical weather prediction and data assimilation. Meteorol. Atmospheric Phys. 2003, 82, 139–170. [Google Scholar] [CrossRef]
  20. Zhang, F.; Weng, Y.; Sippel, J.A.; Meng, Z.; Bishop, C. Cloud-Resolving Hurricane Initialization and Prediction through Assimilation of Doppler Radar Observations with an Ensemble Kalman Filter. Mon. Weather Rev. 2009, 137, 2105–2125. [Google Scholar] [CrossRef]
  21. Hong, S.Y.; Lim, J.O.J. The WRF single–moment 6–class microphysics scheme (WSM6). J. Korean Meteorol. Soc. 2006, 42, 129–151. [Google Scholar]
  22. Iacono, M.J.; Delamere, J.S.; Mlawer, E.J.; Shephard, M.W.; Clough, S.A.; Collins, W.D. Radiative forcing by long-lived greenhouse gases: Calculations with the AER radiative transfer models. J. Geophys. Res. Atmos. 2008, 113, D13103. [Google Scholar] [CrossRef]
  23. Hong, S.-Y.; Noh, Y.; Dudhia, J. A New Vertical Diffusion Package with an Explicit Treatment of Entrainment Processes. Mon. Weather. Rev. 2006, 134, 2318–2341. [Google Scholar] [CrossRef] [Green Version]
  24. Mukul Tewari, N.C.A.R.; Tewari, M.; Chen, F.; Wang, W.; Dudhia, J.; LeMone, M.; Mitchell, K.; Ek, M.; Gayno, G.; Wegiel, J.; et al. Implementation and verification of the unified NOAH land surface model in the WRF model. In Proceedings of the 20th conference on weather analysis and forecasting/16th conference on numerical weather prediction, Seattle, WA, USA, 12–16 January 2004; pp. 11–15. [Google Scholar]
  25. Zhang, D.; Anthes, R.A. A high-resolution model of the planetary boundary layer—Sensitivity tests and comparisons with SESAME-79 data. J. Appl. Meteorol. 1982, 21, 1594–1609. [Google Scholar] [CrossRef]
  26. Xie, Y.; MacDonald, A.E. Selection of Momentum Variables for a Three-Dimensional Variational Analysis. Pure Appl. Geophys. 2011, 169, 335–351. [Google Scholar] [CrossRef]
  27. Shen, F.; Shu, A.; Li, H.; Xu, D.; Min, J. Assimilation of Himawari-8 imager radiance data with the WRF-3DVAR system for the prediction of Typhoon Soudelor. Nat. Hazards Earth Syst. Sci. 2021, 21, 1569–1582. [Google Scholar] [CrossRef]
  28. Shen, F.; Xu, D.; Li, H.; Min, J.; Liu, R. Assimilation of GPM Microwave Imager Radiance data with the WRF hybrid 3DEnVar system for the prediction of Typhoon Chan-hom (2015). Atmospheric Res. 2020, 251, 105422. [Google Scholar] [CrossRef]
Figure 1. The simulated domain with the best track for Kompasu from 1212 UTC 12 to 1318 UTC 13 October 2021. The radar locations (blue asterisks) of Sanya (SYRD) and Haikou (HKRD), maximum detectable range (230 km) circles are also indicated. The type of TC is identified by color: tropical storm (TS), severe tropical storm (STS), typhoon (TY).
Atmosphere 14 00039 g001
Figure 2. The flow chart for the control experiment (CTRL) and data assimilation experiments (DA).
Atmosphere 14 00039 g002
Figure 3. Doppler radar radial velocity of the first sweep at 0600UTC 13 October. (a) Raw data of HKRD; (b) unfolding data of HKRD; (c) raw data of SYRD; (d) unfolding data of SYRD.
Atmosphere 14 00039 g003
Figure 4. Eigenvalue rescaled by the first vertical mode ((a) ψ and U; (b) χ and V) and length scale with the ratio ((c) ψ, U and ψ/U; (d) χ, V and χ/V), with vertical mode.
Atmosphere 14 00039 g004
Figure 5. The increments of y-component wind speed with units as m s−1 and wind vector on 700 hPa in single observation experiments ((a) DA_ψχ; (b) DA_UV). The radar locations (red asterisks) of HKRD are also indicated.
Atmosphere 14 00039 g005
Figure 6. Wind speed with units as m s−1 of (a) background and (b) DA_ψχ; (c) DA_UV) analysis and vector on 850 hPa at 0600 UTC 13 October. The center location of Kompasu from CMA is indicated (red asterisk).
Atmosphere 14 00039 g006
Figure 7. The increments of wind vector on 850 hPa at 0600 UTC 13 October. ((a) DA_ψχ; (b) DA_UV). (Shaded; units: m s−1). The center location of Kompasu from CMA is indicated (red asterisk).
Atmosphere 14 00039 g007
Figure 8. The surface wind vector, speed (shaded; units: m s−1) and sea level pressure (contour; units: hPa). (a) CTRL; (b) DA_ψχ; (c) DA_UV. Vertical cross sections are along red dotted lines.
Atmosphere 14 00039 g008
Figure 9. Vertical cross sections of horizontal wind speed with units as m s−1. (a) CTRL; (b) DA_ψχ; (c) DA_UV.
Atmosphere 14 00039 g009
Figure 10. RMSEs of radial velocity (m s−1) in DA_ψχ and DA_UV of the background and analysis during data assimilation cycling.
Atmosphere 14 00039 g010
Figure 11. (a) The best track from CMA and others from three experiments during forecast time; (b) the track errors to the best track of three experiments during forecast time.
Atmosphere 14 00039 g011
Figure 12. The (a) MSLP and (b) MSW of observation and three experiments during forecast time.
Atmosphere 14 00039 g012
Table 1. Experiment scheme.
NumberExperimentScheme
1CTRLNo data assimilation
2DA_ψχ radial velocity assimilation
with ψ-χ control variable
3DA_UVradial velocity assimilation
with U-V control variable
Disclaimer/Publisher’s Note: The statements, opinions and data contained in all publications are solely those of the individual author(s) and contributor(s) and not of MDPI and/or the editor(s). MDPI and/or the editor(s) disclaim responsibility for any injury to people or property resulting from any ideas, methods, instructions or products referred to in the content.

