Article

Performance Evaluation of ERA5 Extreme Precipitation in the Yangtze River Delta, China

1
School of Environmental and Geographical Sciences, Shanghai Normal University, Shanghai 200234, China
2
School of Urban and Environmental Sciences, Huaiyin Normal University, Huai’an 223300, China
3
Department of Atmospheric and Oceanic Sciences/Institute of Atmospheric Sciences, Fudan University, Shanghai 200438, China
*
Author to whom correspondence should be addressed.
Atmosphere 2022, 13(9), 1416; https://doi.org/10.3390/atmos13091416
Submission received: 20 July 2022 / Revised: 26 August 2022 / Accepted: 31 August 2022 / Published: 2 September 2022
(This article belongs to the Special Issue The Water Cycle and Climate Change)

Abstract

:
Accurate extreme precipitation information is crucial for disaster risk management, social and economic development security, and climate change research. Taking the Yangtze River Delta (YRD), China, a high-impact area of extreme precipitation, as an example, this study evaluates the spatiotemporal performance of extreme precipitation in the latest fifth-generation reanalysis dataset from the European Centre for Medium-Range Weather Forecasts (i.e., ECMWF ERA5) for 1961–2018 based on surface observational precipitation data. The results showed that the 90th-percentile threshold of extreme precipitation extracted from ERA5 data with a daily precipitation amount >1 mm is closer to the actual observations. The ERA5 data can effectively capture the spatiotemporal patterns of the observed extreme precipitation in the YRD. The ERA5 data can successfully represent the seasonal cycle and interannual variability of daily, daytime, and nighttime extreme precipitation. However, the daytime (nighttime) extreme precipitation frequencies and amounts tend to be overestimated (underestimated) for the period 1961–2000, whereas they were significantly underestimated for the period 2000–2018. The trend estimation of seasonal and annual extreme precipitation in ERA5 needs to be improved. The ERA5 data revealed that the extreme precipitation in the YRD was dominated by large-scale precipitation, followed by convective precipitation, but their long-term trends were not clear. This study has conducted a detailed and reliable evaluation of the ERA5 extreme precipitation data. The findings serve as valuable guidance and provide accurate references to extreme climatic variables for data users and algorithm developers.

1. Introduction

The Sixth Assessment Report of the Intergovernmental Panel on Climate Change (IPCC AR6) has reported that the global surface mean temperature in the first two decades of the 21st century (2001–2020) has increased by 0.99 (0.84–1.10) °C compared to 1850–1900 [1]. A warming temperature generally holds more moisture and intensifies the hydrological cycle, which can increase regional and even global mean precipitation as well as extreme precipitation [2,3,4]. Precipitation extremes are expected to increase under global warming [4,5,6,7], which can cause severe impacts on ecosystems, social property, and human health [8,9,10]. For example, a rare record-breaking extreme precipitation event occurred in Henan, China, in July 2021 [11], and the summer extreme rainfall in 2020 along the Yangtze River Basin was the heaviest since 1961 [8], both events of which caused tremendous disaster to humans and triggered devastating socioeconomic impacts. In 2013/2014, winter storms hit southern England, causing severe floods and costing GBP 451 million in insured losses [12]. Thus, extreme precipitation events have received wide research attention from weather–climate scientific communities, the insurance industry, and the financial sector in recent years due to their serious adverse effects and great dangers [1,13,14,15,16]. These effects are especially severe in densely populated and economically developed regions, such as the Yangtze River Delta (YRD), China, which is a high-impact region of extreme precipitation [17,18].
Accurate identification of extreme precipitation from reliable precipitation data is of great importance for climate model extreme-value verification and calibration, urban disaster risk management, water resource management, and agricultural production safety [19,20,21,22,23]. Currently, precipitation data are provided by surface meteorological stations [24], remote sensing satellite observations [25], and climate reanalysis data [26]. Although surface observational data have better accuracy, they are often restricted by uneven spatial distribution and a limited number of meteorological stations [24,27]. Compared with ground observations, satellite-based precipitation data can compensate for the lack of spatial continuity and have relatively higher temporal resolutions [25,28], but they still have some shortcomings, e.g., short temporal coverage [25] and lack of other vertical atmospheric variables, which are crucial to understanding the physical processes of precipitation [26,29]. Reanalysis data are generally produced by blending surface observational datasets and forecasts from numerical simulation prediction systems across the world [30]. These products typically contain different atmospheric variables at various vertical pressure levels and provide a long-term estimate of climate variables, widely used in climate change sciences [30,31,32].
Currently, widely used reanalysis data include the Japanese 55-year Reanalysis (JRA-55) data released by the Japan Meteorological Agency [33]; Modern-Era Retrospective analysis for Research and Application, Version 2 (MERRA-2) [34]; global reanalysis products (NCEP-DOE Reanalysis II and NCEP-NCAR Reanalysis I) from the National Centers for Environmental Prediction and the National Center for Atmospheric Research (NCEP/NCAR) [35]; and the fifth generation of the global climate reanalysis product (ERA5), released by the European Centre for Medium-Range Weather Forecasts (ECMWF) [36]. Among these reanalysis datasets, ERA5 has been recognized as the best or nearly the best in depicting climate change [1,37,38,39,40]. The ERA5 dataset is also considered a valuable resource for scientists in the fields of climate change and hydrological modeling and beyond [41].
Due to the wide use of ERA5 reanalysis data, there have been many studies on the performance evaluation of the ERA5 reanalysis data in precipitation. For example, Jiang et al. [26] evaluated the accuracy of ERA5 for estimating precipitation based on gauge precipitation data over China Mainland during 2003–2015, and they found that ERA5 tended to overestimate (underestimate) light (moderate and heavy) precipitation events. Jiao et al. [41] pointed out that ERA5 data can well reproduce the annual and seasonal patterns of observational precipitation in China and eastern China, showing a higher correlation between ERA5 and observations during 1979–2018. Previous studies have mainly focused on the assessment of daily precipitation, but the systematic assessment of daily extreme precipitation in ERA5 against surface observations is still rare, especially with a long-term time series [19,41]. Moreover, precipitation has different mechanisms during daytime and nighttime because of the diurnal variations in relative humidity, solar radiation, and type of clouds with dominant precipitation [25,42]. Due to differences in emergency management measures, the risk of extreme precipitation might vary during daytime and nighttime. Thus, it is important to study extreme precipitation during daytime and nighttime. Assessment of precipitation variations during daytime and nighttime is of great importance for understanding the physical mechanisms of precipitation. At present, there is a lack of systematic evaluation of the ERA5 data in extreme precipitation, especially in the YRD, a densely populated and economically developed area. Hence, in this study, the ability of the ERA5 dataset is evaluated in terms of its performance in reproducing daily, daytime, and nighttime extreme precipitation events in the YRD. The assessment of precipitation extremes is relevant for flood risk assessment and management [19], which allows scientific emergency management measures to be taken in a timely manner and improves the level of urban resilience construction [43].
Total precipitation in the ERA5 reanalysis data consists of convective and large-scale precipitation [37]. Convective/large-scale precipitation is generated by the convective/cloud scheme in the ECMWF Integrated Forecasting System. The convective scheme refers to convection motion at a spatial scale smaller than the grid point. The cloud scheme refers to the formation and dissipation of clouds and large-scale precipitation caused by changes in atmospheric quantities at a spatial scale of the grid point or larger. Convective precipitation is characterized by short-duration, intense, localized, and sometimes violent precipitation, and large-scale precipitation is characterized by sustained, steady precipitation and is associated with large-scale atmospheric forces [44,45]. These two types of precipitation make a remarkable contribution to extreme precipitation. However, current methods for measuring convective and large-scale precipitation are more challenging, mainly through manual and satellite observations [44]. The ERA5 dataset provides convective and large-scale precipitation information with a high spatial and temporal resolution, which is an important contribution to understanding the composition of extreme precipitation [36]. Daily convective and large-scale precipitation characteristics have been widely investigated in previous studies, but these studies have mainly adopted manual observations or synoptic scale satellite observations with a short study period [44,45,46]. Therefore, this study also explores the characteristics of convective and large-scale precipitation during extreme precipitation events in the YRD region using ERA5 data with extended time series.
This study is organized as follows: Section 2 represents the materials and methods. Section 3 evaluates the daily and sub-daily precipitation in the ERA5 data against surface observation in terms of quantifying the precipitation frequency, amount, and intensity during daily, daytime, and nighttime at different temporal scales and investigates the spatiotemporal convective and large-scale characteristics that contribute to extreme precipitation. Section 4 and Section 5 cover the discussion and conclusions, respectively.

2. Materials and Methods
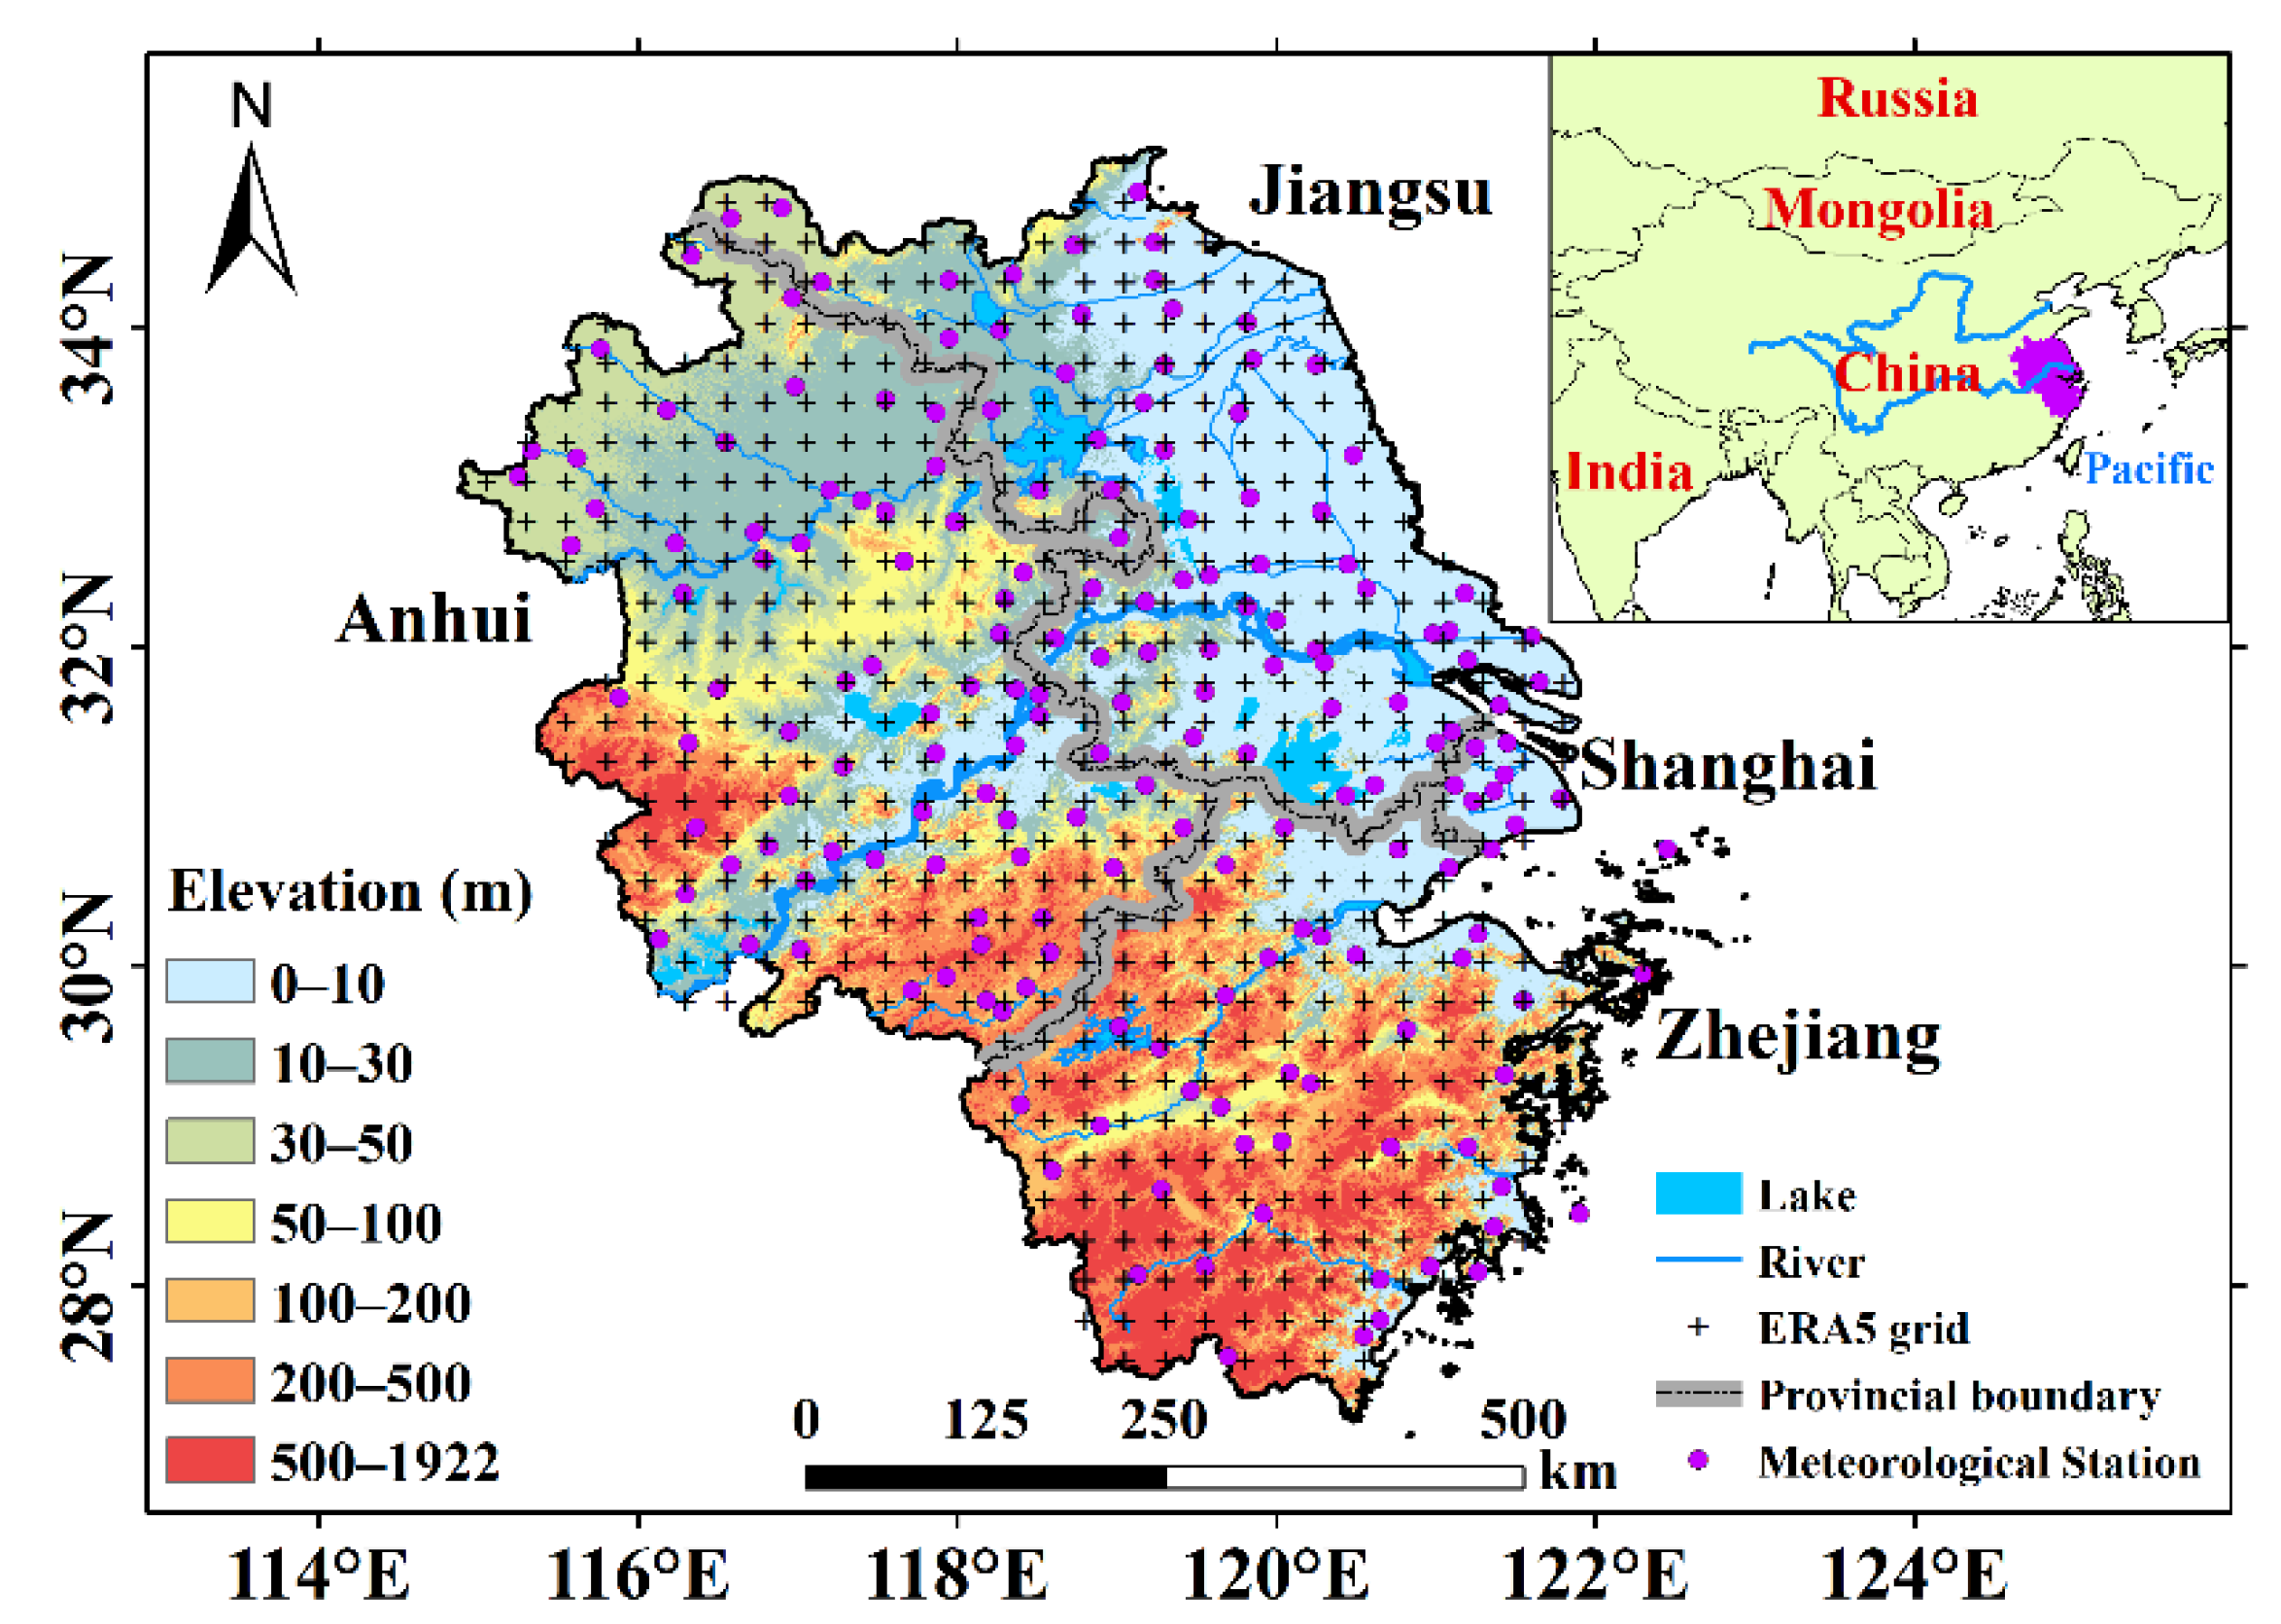
2.1. Study Area

The YRD region is located between 115–123° E and 27–35° N in eastern China and consists of the Shanghai municipality as well as Zhejiang, Jiangsu, and Anhui provinces (Figure 1). The YRD has an area of 3.58 × 10⁵ km2, accounting for ~3.7% of China’s land area, and has 227 million permanent residents, accounting for 16% of China’s total population [47]. The YRD is one of the regions with the highest population density, most active economic development, and highest degree of openness in China [48]. The YRD region has an annual total precipitation of 1000–1600 mm and an annual mean temperature of 14–18 °C and is prone to the East Asian summer monsoon [49]. Any anomalous variation in precipitation, especially extreme precipitation, might cause serious threats to urban food security, the safety of property and life, and social stability [50].

2.2. Datasets

Two types of datasets were used in this study:
(1)
The surface observational sub-daily precipitation dataset was derived from the National Meteorological Information Center of the China Meteorological Administration, spanning 1961–2018. The dataset provides accumulated precipitation records every 12 h, i.e., 8:00 and 20:00 Beijing Time (BT). Daytime denotes 8:00 to 20:00 BT, whereas nighttime denotes 20:00 of the last day to 8:00 of the current day. This dataset was released after strict quality control and homogeneity tests and is available from http://data.cma.cn/ (accessed on 19 July 2022). Considering the reliability and integrity of the data, the stations with ≥3% of all daily or sub-daily values missing during the study period were removed. Missing values for stations (<3% missing data) were replaced by values of adjacent stations [51]. Ultimately, 185 surface observational stations were used to evaluate the reanalysis data (Figure 1).
(2)
The ERA5, with a 0.25° spatial resolution and a 1-h temporal resolution, is the fifth-generation reanalysis dataset of the European Centre for Medium-Range Weather Forecasts, which includes detailed hydrometeorological reanalysis data for two time periods (1950–1978 and 1978–present) [37]. The ERA5 has relatively smaller errors than the previous version ERA-Interim when compared to observations [41]. This reanalysis product has been widely used in hydrometeorological studies [26,52,53]. It is available from https://www.ecmwf.int/en/forecasts/datasets/reanalysis-datasets/era5 (accessed on 19 July 2022).
To eliminate evaluation errors between the ERA5 and surface observations caused by different time zones, the time of the ERA5 precipitation dataset was converted from UTC to BT. Therefore, nighttime in ERA5 represents 12:00–24:00 UTC (corresponding to 20:00–08:00 BT) and daytime in ERA5 represents 0:00–12:00 UTC (corresponding to 08:00–20:00 BT). The time-zone-adjusted ERA5 precipitation time series has effectively improved evaluation accuracy compared with surface observations, and the errors were mainly from nighttime (Figure S1).

2.3. Statistical Analysis

2.3.1. Evaluation Metrics

New errors introduced by interpolation were avoided by using a comparison of the meteorological stations and their corresponding ERA5 grid points, a method that has also been used in previous studies [25,54]. Five statistical evaluation metrics were used in this study to compare the spatiotemporal performance of ERA5 (extreme) precipitation data against surface observation, including correlation coefficient (CC), mean bias (Bias), relative bias (RB), root-mean-square error (RMSE), and the distance between the indices of simulation and observations (DISO). These metrics were expressed as
C C = i = 1 n ( O i O ¯ ) · ( S i S ¯ ) i = 1 n ( O i O ¯ ) 2 · i = 1 n ( S i S ¯ ) 2 ,
B i a s = 1 n i = 1 n ( S i O i ) ,
R B = i = 1 n ( S i O i ) i = 1 n O i × 100 % ,
R M S E = 1 n i = 1 n ( S i O i ) 2 ,   and
D I S O = ( C C 1 ) 2 + N B 2 + N R M S E 2 ,
NB = Bias / O ¯ ,
NRMSE = RMSE / O ¯ ,
where Si and Oi represent the simulations (ERA5 data) and surface observations at each time step i, respectively; n is the number of time steps; S ¯ and O ¯ are the mean values of simulations and observations, respectively; NB is the ratio of Bias to O ¯ ; and NRMSE is the ratio of RMSE to O ¯ . CC, Bias, RB, and RMSE indicate the linear correlation, size of deviation, systematic deviation, and overall level of error between the simulations and observations, respectively. DISO is a more comprehensive index that combines CC, Bias, and RMSE according to the distance between the simulations and observations. The values of CC range from −1 to 1, with 1 (−1) indicating a completely positive (negative) correlation and 0 indicating no correlation. Positive (negative) values of Bias and RB denote overestimation (underestimation). The closer Bias, RB, RMSE, and DISO are to zero, the smaller the errors in the simulations and observations. Note that DISO is invalid when O ¯ equals 0.

2.3.2. Trend Calculation

Linear regression was employed in this study to analyze the long-term trends in extreme precipitation frequency, amount, and intensity [55,56]. The formula was
yi = a xi + b + ɛ (i = 1, 2, 3, …, n).
where y represents the variables (i.e., extreme precipitation frequency, amount, and intensity), x the time, n the sample size, a the trend, and b the regression constant. A two-tailed Student’s t-test was applied to determine the trend significance.

2.4. Definition of Extreme Precipitation

Extreme precipitation events are defined as the daily (sub-daily) precipitation amount exceeding the 90th-percentile threshold during wet days based on the local daily (sub-daily) climatology [19,57]. Meteorological stations only record precipitation events with a daily precipitation amount >0.1 mm. However, a large number of trace values (0.1 to 1 mm/day) exist in the daily (sub-daily) precipitation data of the ERA5 that are generally not recorded in surface observations. This result was consistent with the findings of Jiang et al. [26], who pointed out that ERA5 significantly overestimated light precipitation events in China. These trace values of ERA5 precipitation can cause the extracted 90th-percentile threshold to be substantially smaller than surface observations, which can further contribute to the overestimation of extreme precipitation as more precipitation events could exceed the threshold. Thus, the 90th-percentile threshold of ERA5 precipitation with a daily amount >1 mm was extracted to reduce the influence of these trace values. The adjusted threshold was very close to that of surface observational stations, while the unadjusted threshold was clearly lower, indicating that the threshold extraction of precipitation with a daily amount of >1 mm in the ERA5 data can capture extreme precipitation more accurately (Table 1). Subsequent studies have used the adjusted threshold to extract extreme precipitation events.
Three extreme precipitation properties, i.e., frequency, amount, and intensity, were analyzed in the current study. Extreme precipitation frequency is the number of days (sub-days) of the extreme precipitation events in a given time step. Extreme precipitation amount is the cumulative precipitation of all extreme precipitation events. Extreme precipitation intensity refers to the ratio of extreme precipitation amount and the days. Previous studies have provided similar interpretations of the extreme precipitation frequency, intensity, and amount [25,30].

3. Results

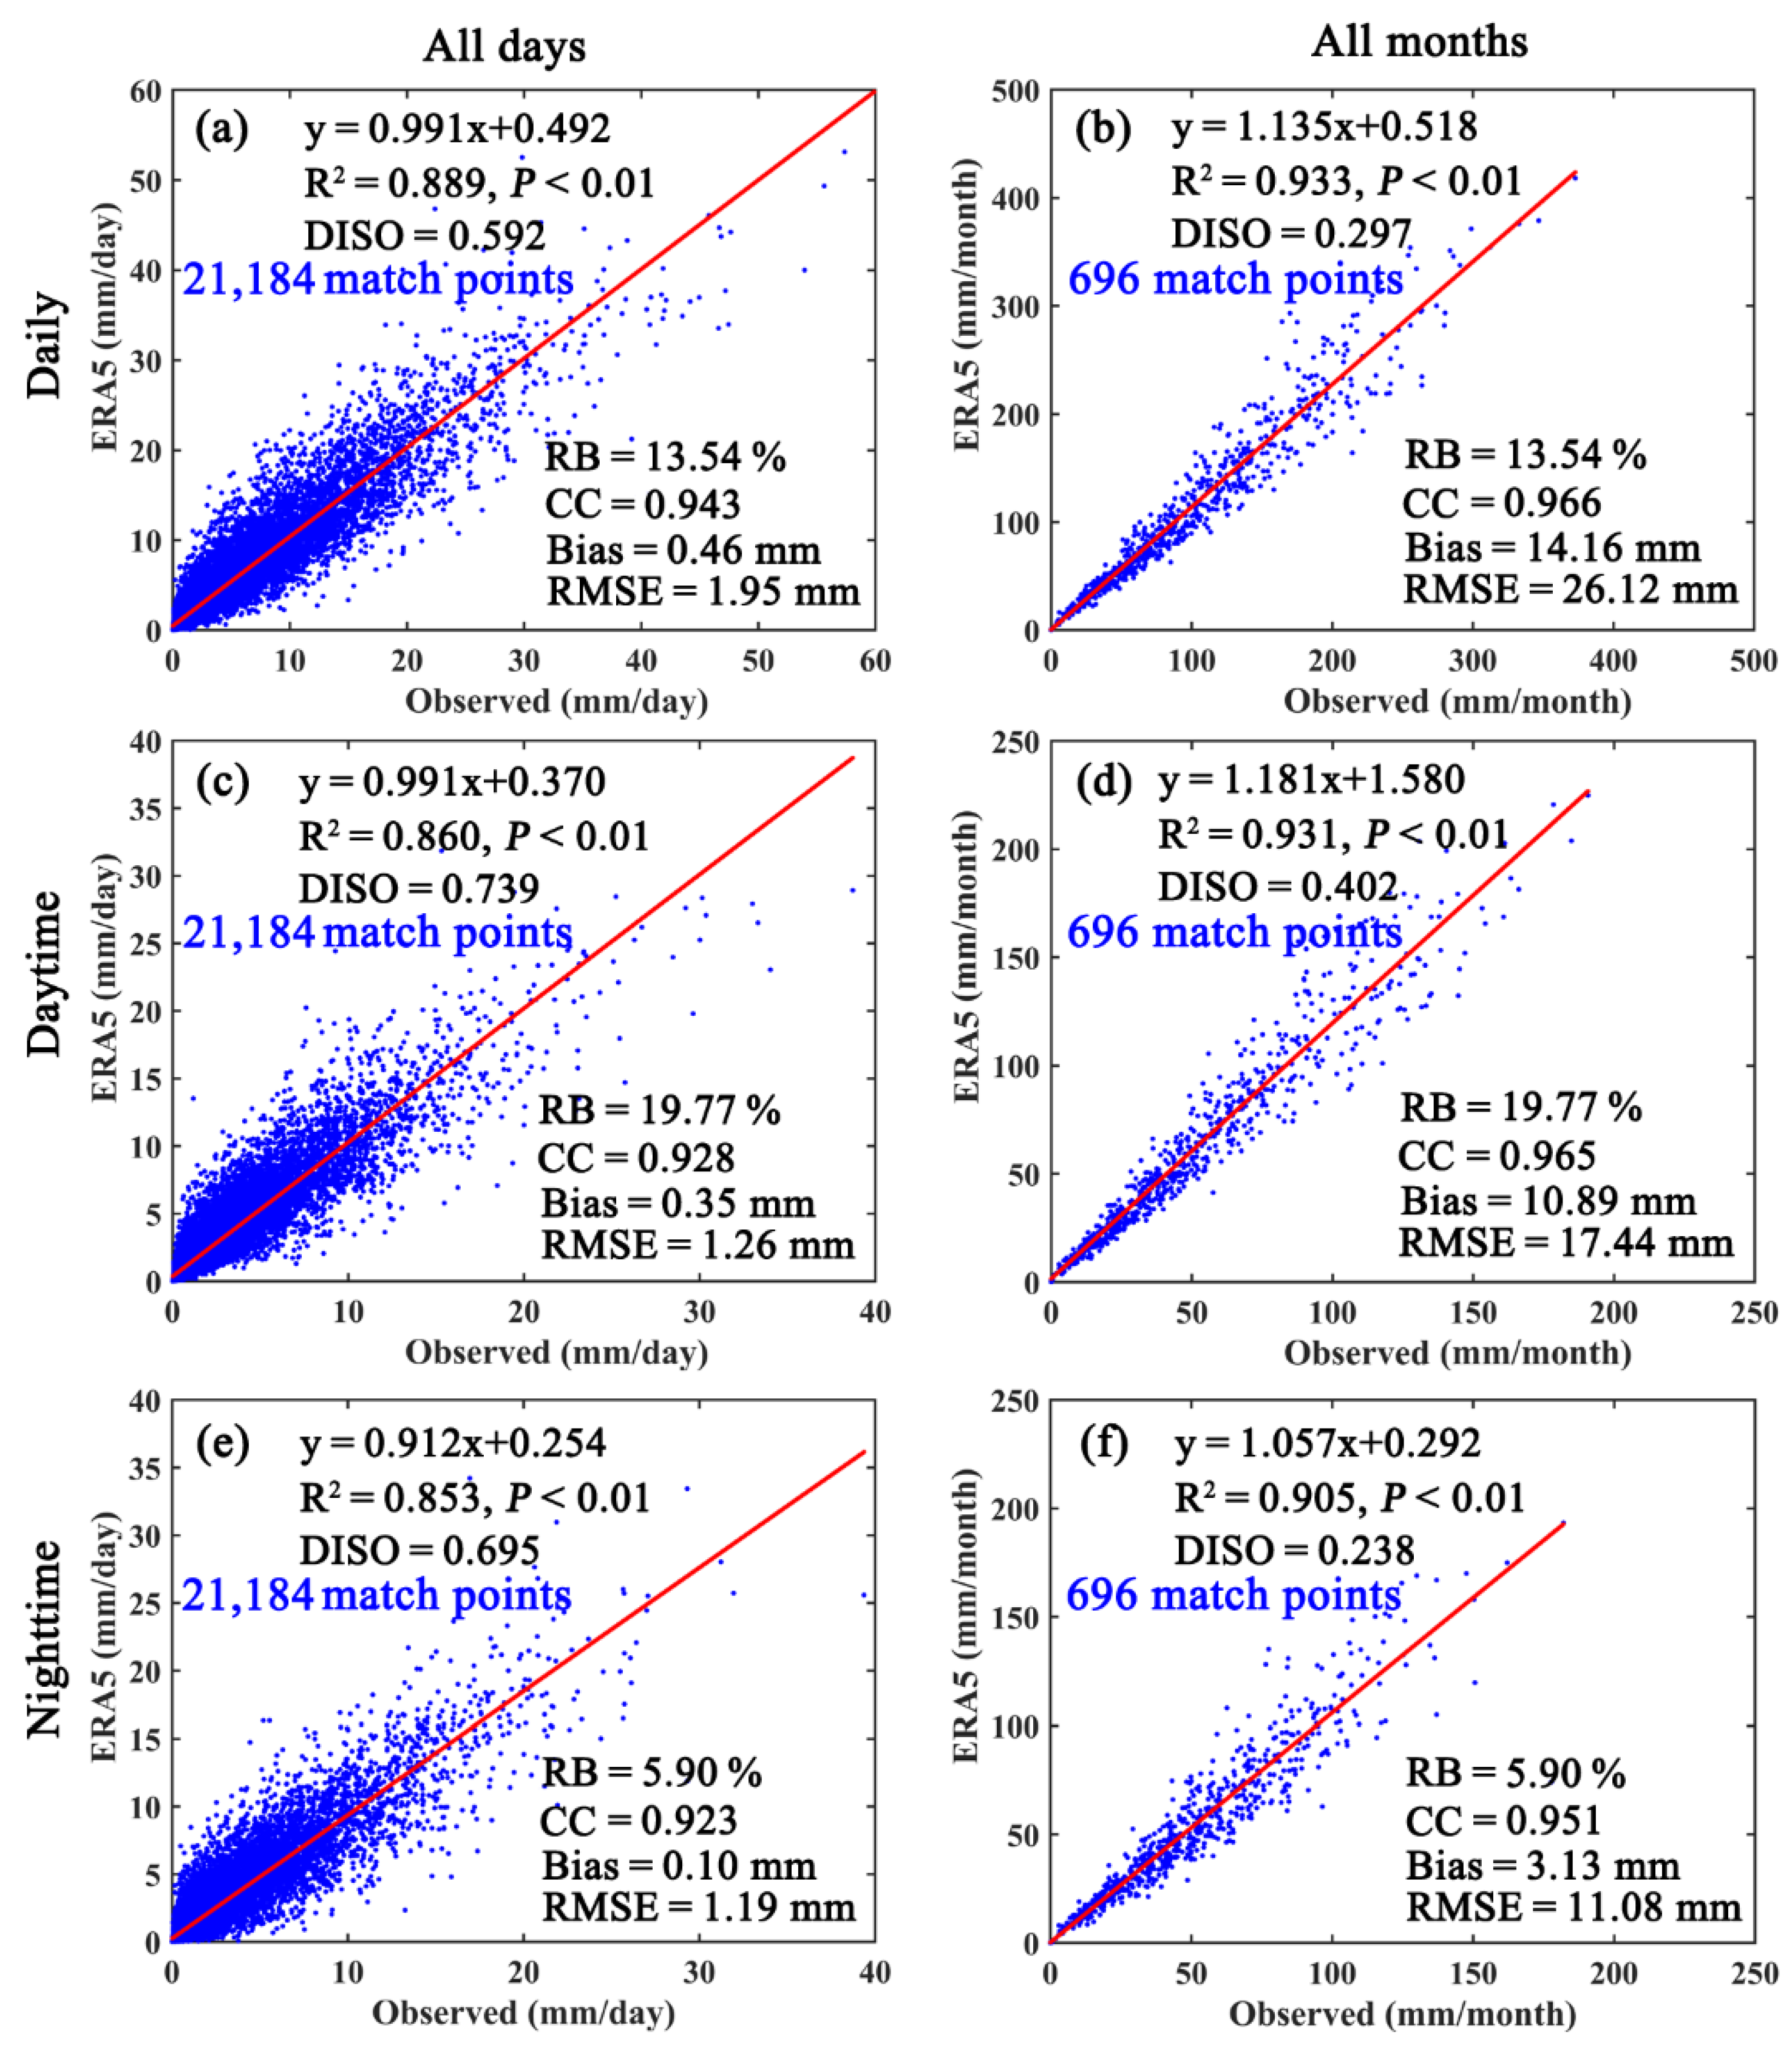
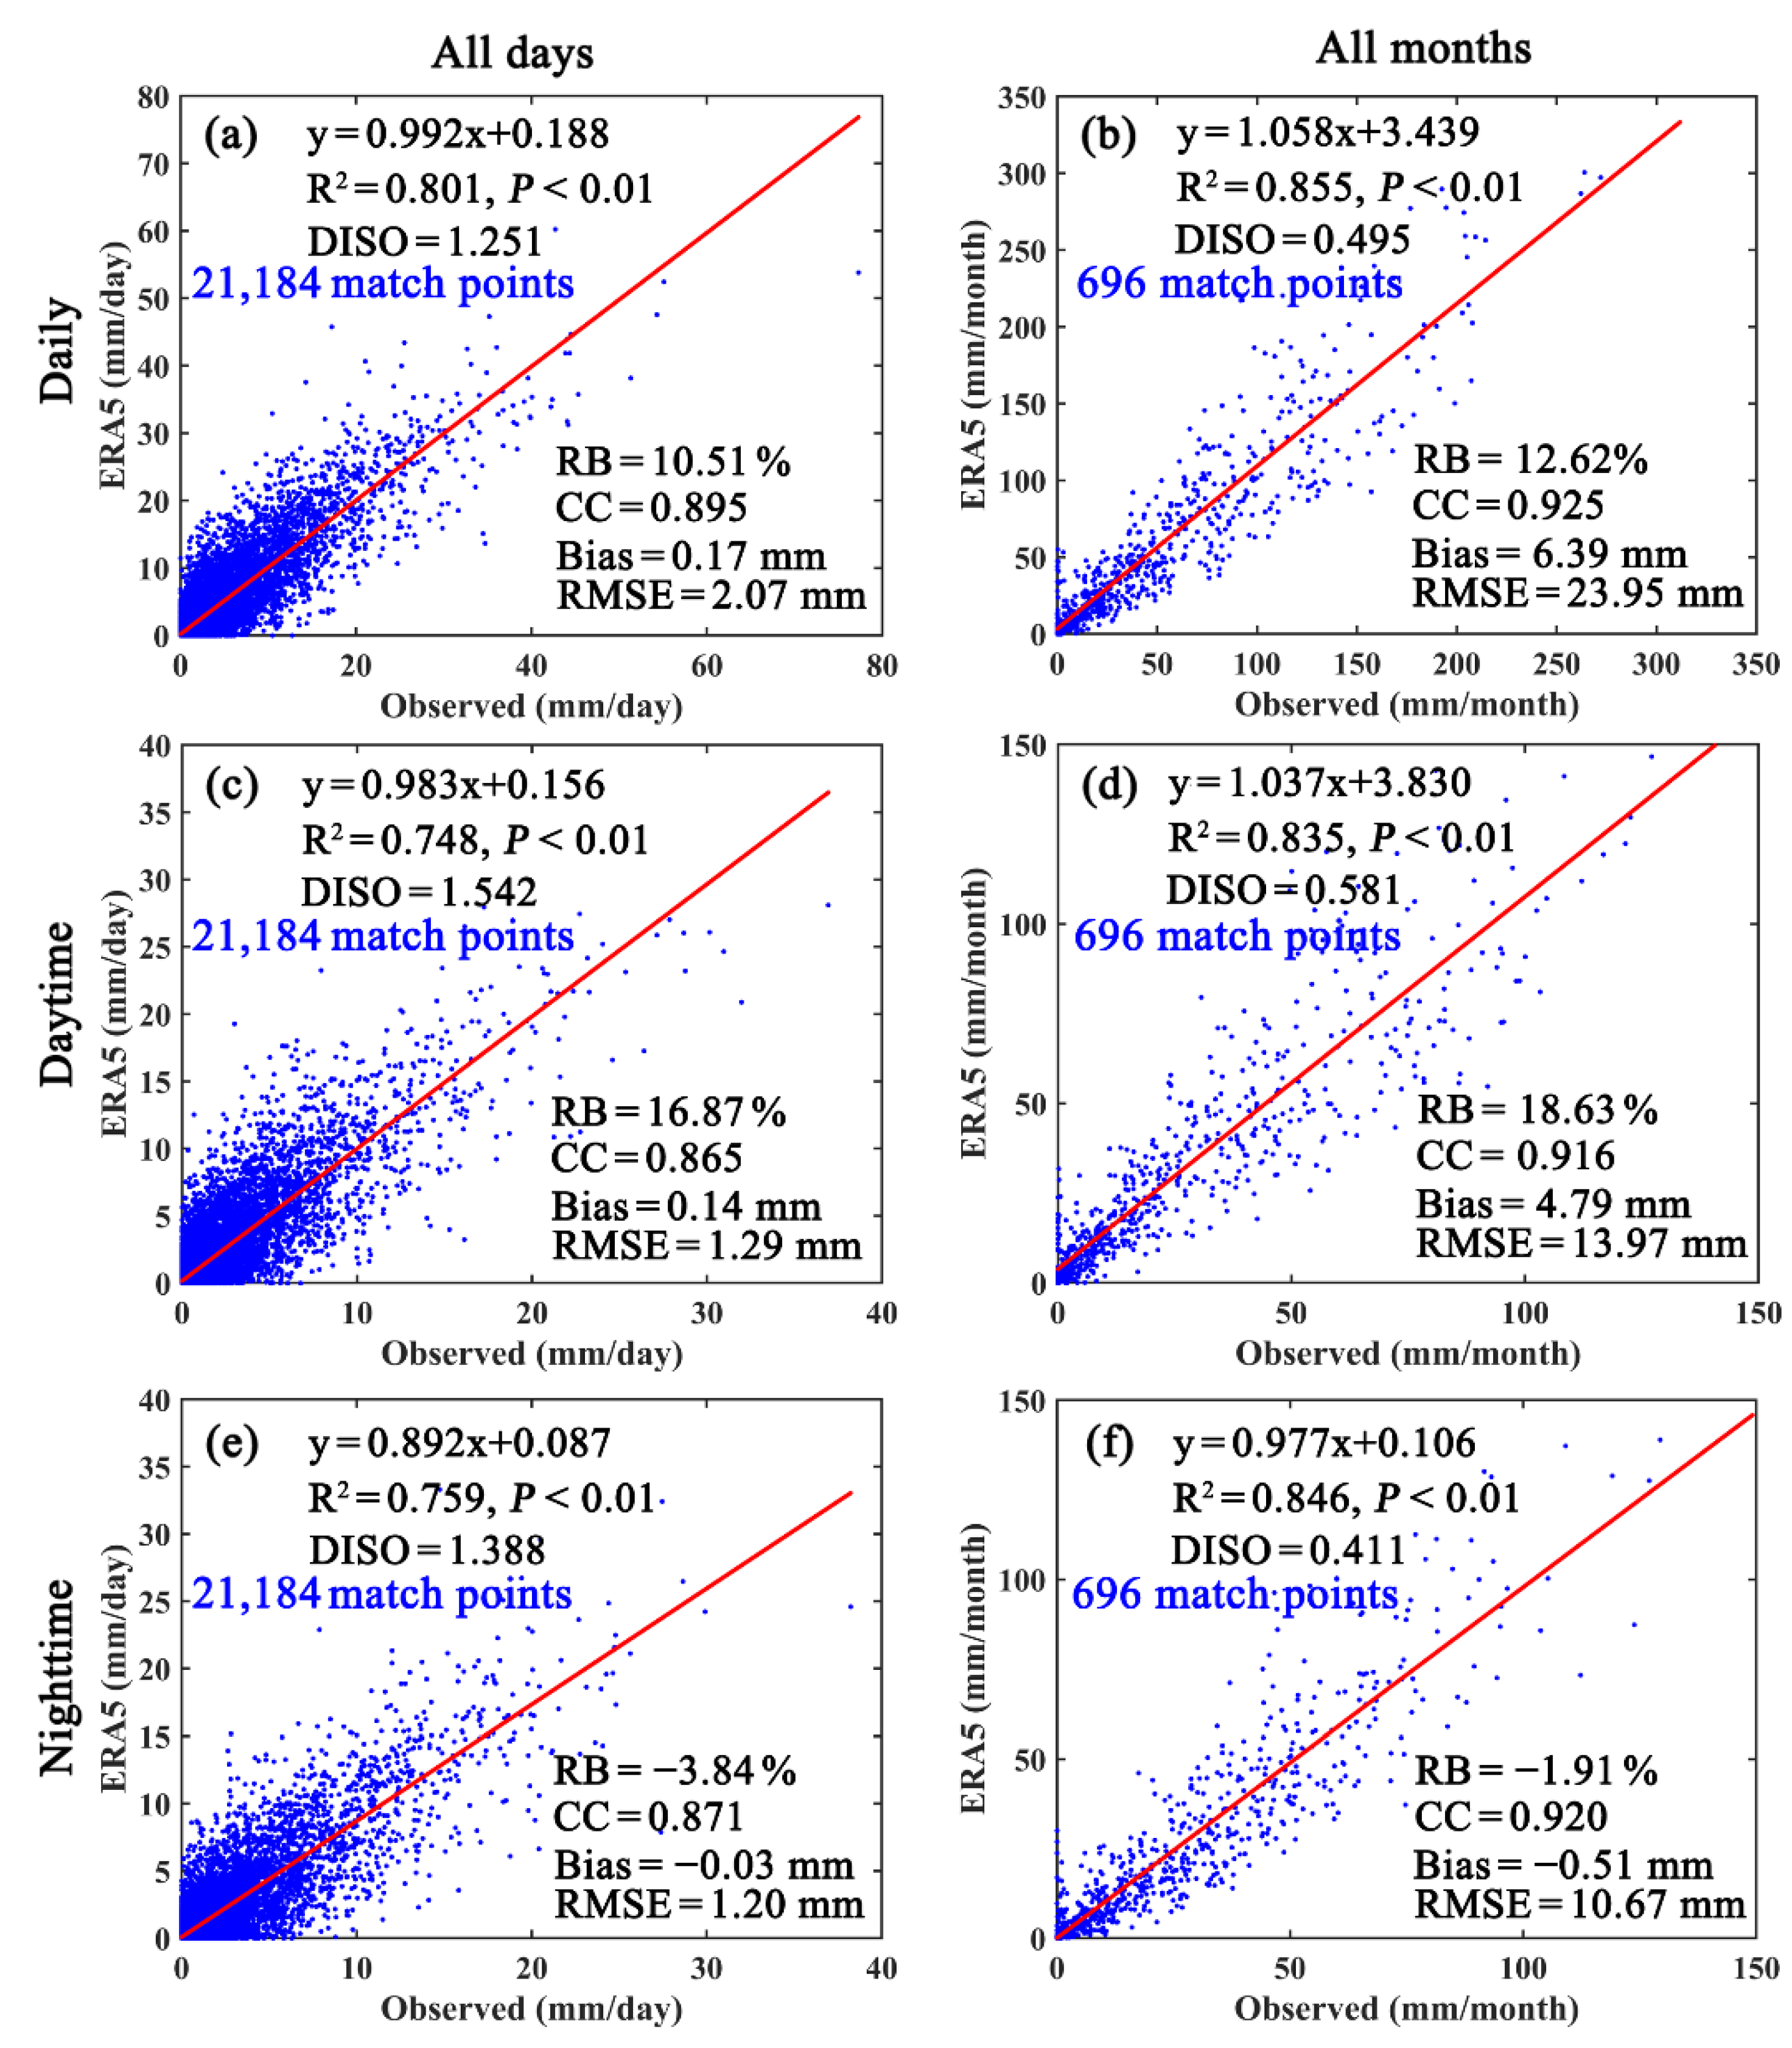
3.1. Overall Evaluation of ERA5 Precipitation Data

The general performance of ERA5 precipitation data was first evaluated before evaluating the accuracy of the ERA5 extreme precipitation. The daily, daytime, and nighttime CC, Bias, RB, RMSE, and DISO for all-day and all-month precipitation from the observational stations and their corresponding ERA5 grid points were examined for the period 1961–2018 (Figure 2). At the daily scale, the ERA5 precipitation reasonably captured the characteristics of the observed values, with higher CC (0.943), lower RB (overestimated by 13.54%), lower Bias (0.46 mm), lower RMSE (1.95 mm), and lower DISO (0.592) values (Figure 2a). The daytime (nighttime) ERA5 precipitation was similar to daily precipitation, showing relatively high accuracy, with the corresponding CC, Bias, RB, RMSE, and DISO values of 0.928 (0.923), 0.35 (0.10) mm, 19.77% (5.9%), 1.26 (1.19) mm, and 0.739 (0.695) (Figure 2c,e). Notably, on the all-day scale, the simulation effect of ERA5 precipitation during nighttime in ERA5 was better than during daytime. Compared with all-day precipitation, the ERA5 precipitation accuracy was significantly improved on the all-month scale (Figure 2b,d,f). Monthly total precipitation from ERA5 and observation data was more highly correlated (CC = 0.966) than that of daily precipitation (Figure 2b). On the all-month scale, nighttime precipitation showed lower RB (5.9%), Bias (3.13 mm), RMSE (11.08 mm), and DISO (0.238) than those during daytime (Figure 2d,f). In short, the ERA5 precipitation data at the all-day and all-month scales exhibited good performance and reproducibility compared with surface observational stations.
The evaluation of ERA5 extreme precipitation is shown in Figure 3. Consistent with total precipitation, the ERA5 extreme precipitation also captured the observed extreme precipitation characteristics well. For instance, the ERA5 extreme precipitation data showed high consistency with observations on the daily scale, with higher CC (0.895), lower RB (overestimated by 10.51%), lower Bias (0.17 mm), lower RMSE (2.07 mm), and lower DISO (1.251) values (Figure 3a). The daytime (nighttime) ERA5 extreme precipitation was similar to daily extreme precipitation, showing a relatively high accuracy, with the corresponding CC, Bias, RB, RMSE, and DISO values of 0.865 (0.871), 0.14 (−0.03) mm, 16.87% (−3.84%), 1.29 (1.20) mm, and 1.542 (1.388), respectively (Figure 3c,e). Compared with all-day extreme precipitation, ERA5 extreme precipitation accuracy was better relative to the all-month scale. Monthly total precipitation at the daily, daytime, and nighttime scales from ERA5 was highly correlated (CC = 0.925, 0.916, and 0.920, respectively) with observation data (Figure 3b,d,f). In general, although the simulation effect of ERA5 total precipitation was slightly better than the extreme precipitation, both (at the all-day and all-month scales) exhibited good performance and reproducibility compared with observational data.
In addition to the comparisons of regional averages, we also compared monthly and yearly precipitation and extreme precipitation for each station and its corresponding grid point for each month and year, respectively (Figures S2 and S3). The results show that ERA5 can roughly reflect precipitation and extreme precipitation in the YRD at the monthly and annual scales.

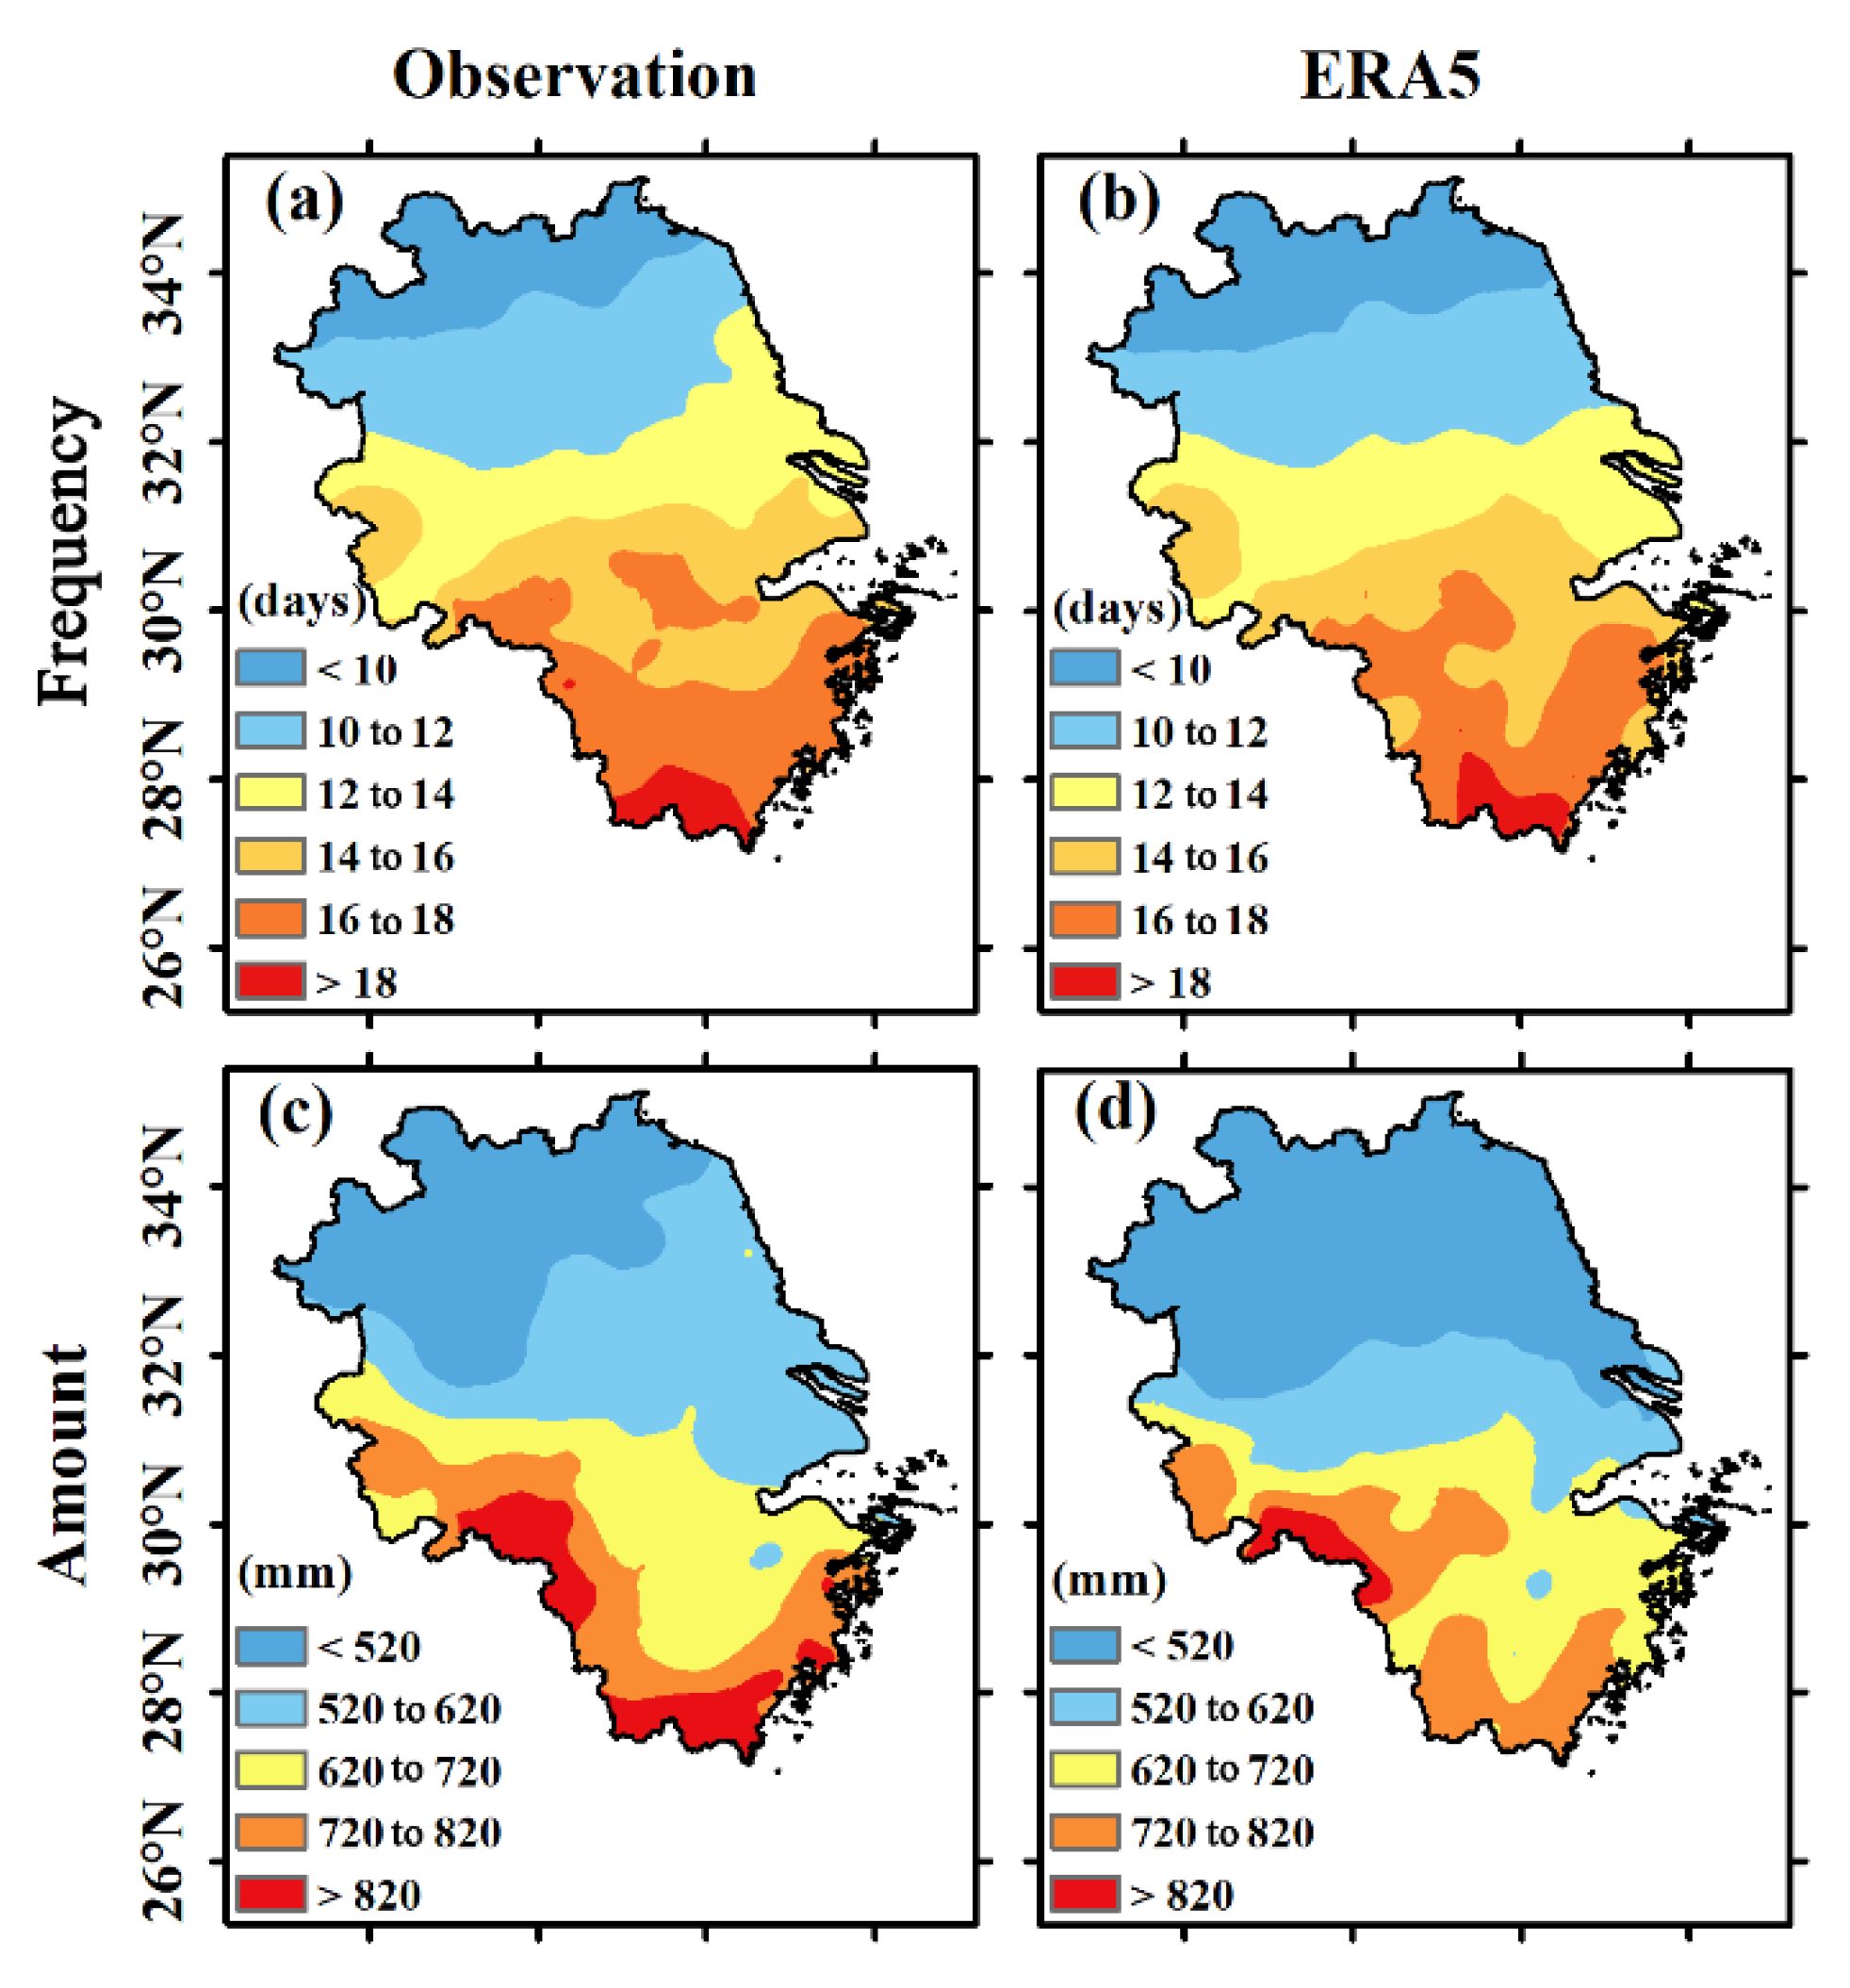
3.2. Climatological Patterns in Annual Total Extreme Precipitation

The spatial distribution of the annual mean extreme precipitation frequency and amount in the YRD for the period 1961–2018 were investigated in observational and ERA5 data (Figure 4). As shown in Figure 4a, the annual extreme precipitation frequency in the observational data displayed an evident south–north gradient, with high values in the south (>16 days) and low values in the north (<10 days). The western parts of the study area (mountainous region) also showed relatively high values (14–16 days). The spatial distribution of extreme precipitation frequency had not only a zonal differentiation but also appeared to have a high elevation dependence. Similar spatial patterns were found in the ERA5 data (Figure 4b). The spatial distribution of the annual mean extreme precipitation amount in the observational data also had a clear south–north gradient, decreasing from >720 mm in the south to <520 mm in the north (Figure 4c). The areas with high values of extreme precipitation were mainly distributed in the southern and southwestern edge of the YRD region. Similar spatial characteristics of extreme precipitation amounts were also found in the ERA5 data, but the specific values were slightly smaller than the observational data (Figure 4d).

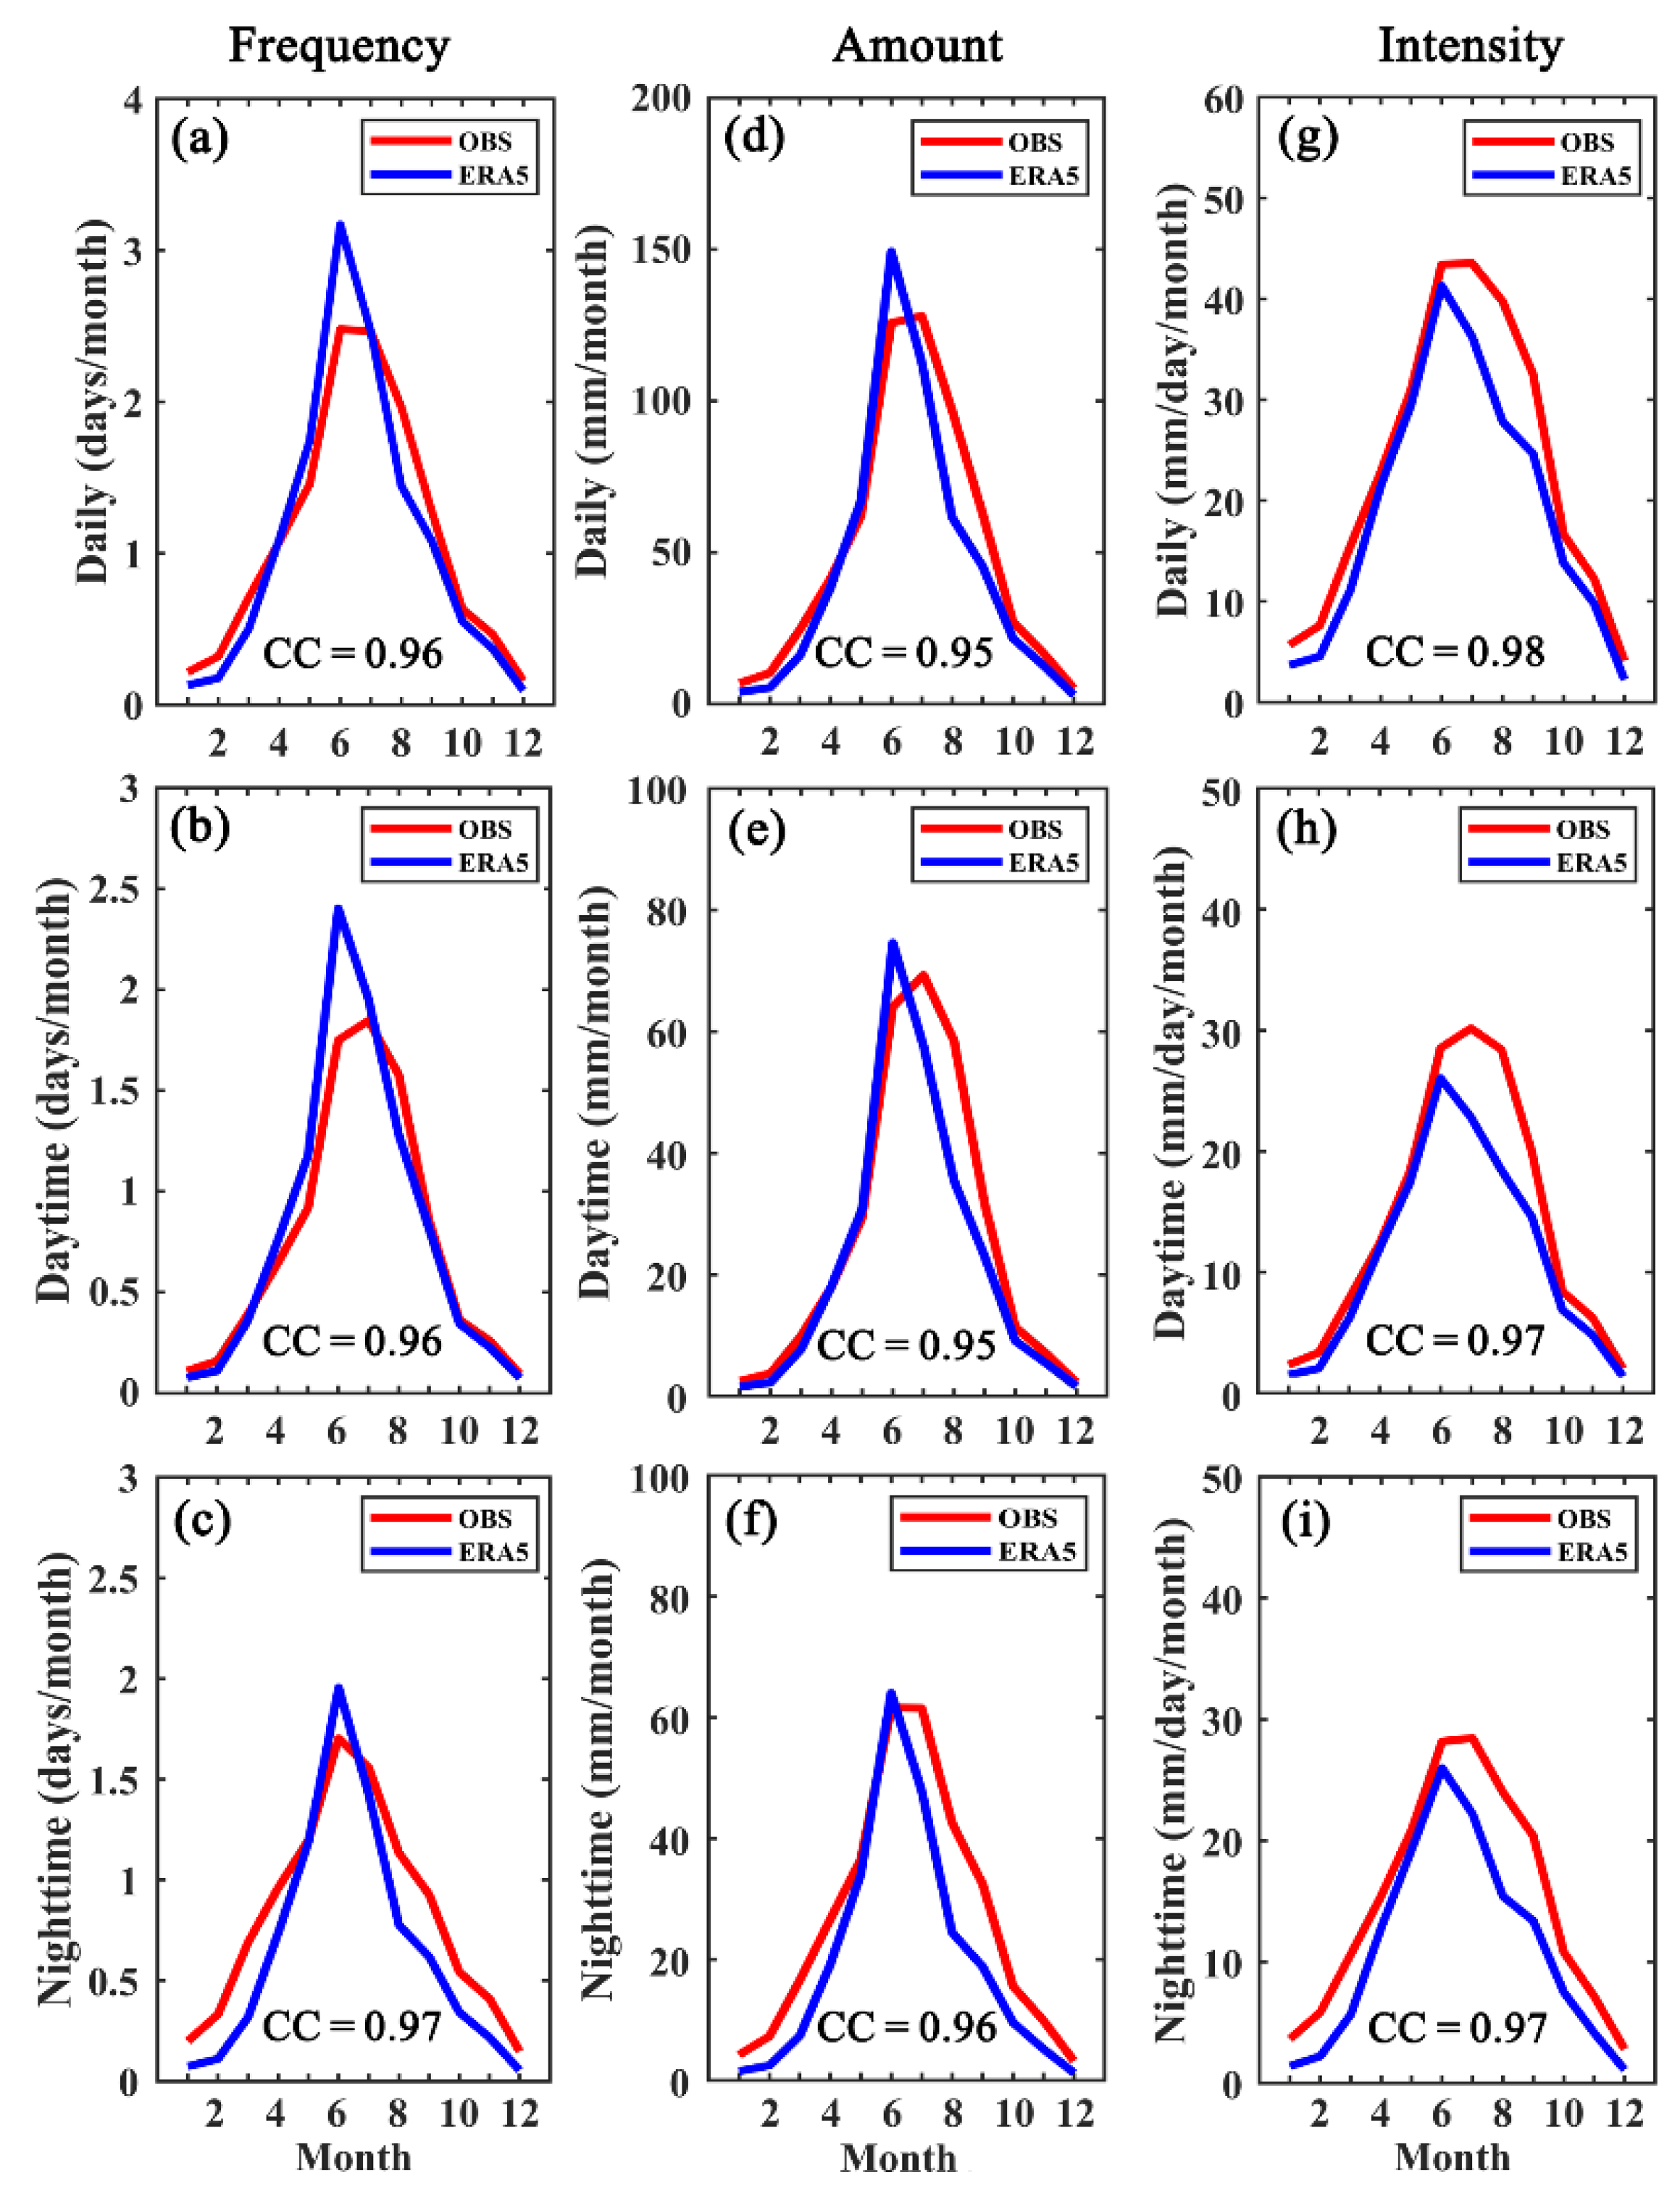
3.3. Seasonal Cycles of Daily/Sub-Daily Extreme Precipitation

ERA5 reanalysis data can reasonably represent the seasonal shape of the extreme precipitation frequency, amount, and intensity at the daily, daytime, and nighttime scales (Figure 5). For extreme precipitation frequency at the daily scale, the ERA5 roughly reproduced the seasonal shape of observations, with a higher CC of 0.96. However, ERA5 data significantly overestimated extreme precipitation frequency in June (Figure 5a). A similar characteristic of extreme precipitation frequency was also found at the daytime scale (Figure 5b). ERA5 slightly overestimated the nighttime extreme precipitation frequency from May to July and underestimated the rest of the months (Figure 5c). ERA5 can generally represent the seasonal shape of the extreme precipitation amount at the daily, daytime, and nighttime scales (CC > 0.95), performing especially well from January to June but with an underestimation from July to December (Figure 5d–f). Extreme precipitation intensity was the result of dividing the extreme precipitation amount by frequency. Therefore, due to the characteristics mentioned above, extreme precipitation intensity showed good performance from January to May, whereas it was underestimated from June to December (Figure 5g–i). Overall, ERA5 can well reproduce the seasonal cycles of extreme precipitation characteristics.

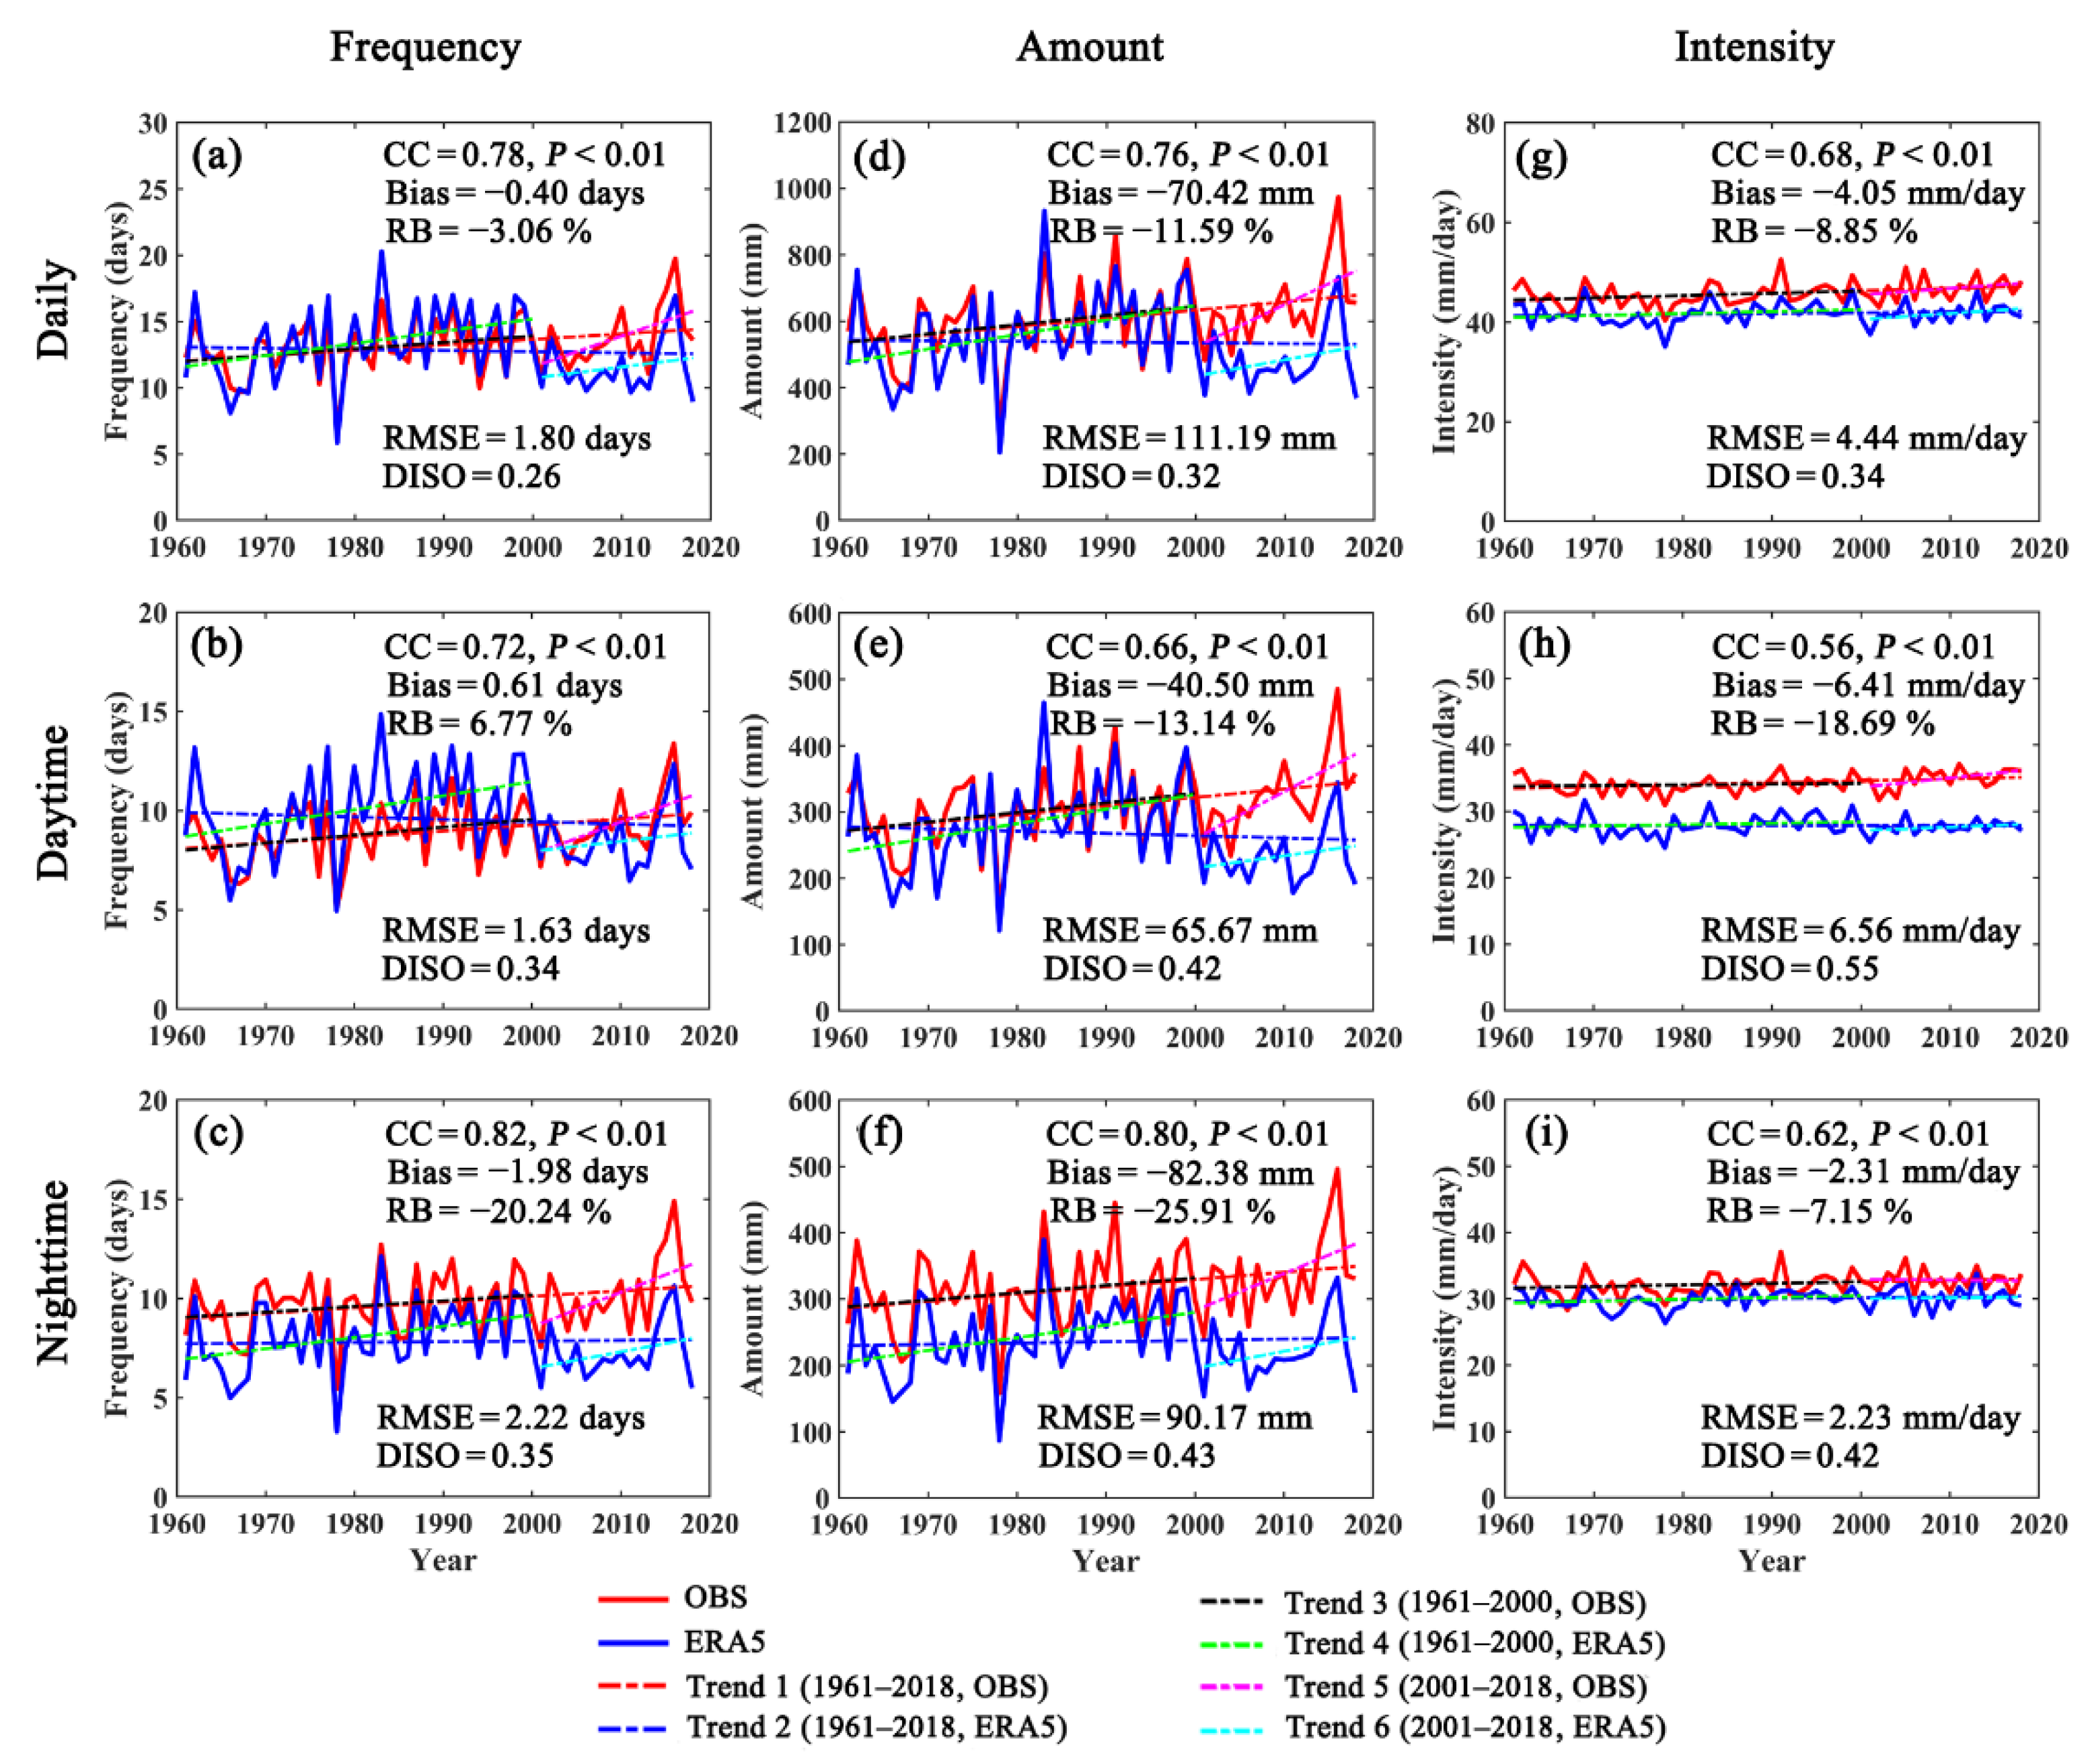
3.4. Interannual Variations of Daily/Sub-Daily Extreme Precipitation

The interannual variations of extreme precipitation frequency, amount, and intensity at the daily, daytime, and nighttime scales over the YRD for the period 1961–2018 showed that the observation-based extreme precipitation increased significantly after the year 2000, whereas the ERA5-based extreme precipitation decreased slightly after the year 2000, showing a divergence between the two datasets (Figure 6). Thus, the whole study period was further subdivided into two periods: 1961–2000 and 2001–2018. Accordingly, the trends for the periods 1961–2018, 1961–2000, and 2001–2018 were calculated (Table 2).
In general, ERA5 reanalysis data roughly reproduced the interannual variations in extreme precipitation frequency and amount in the YRD during the study period with a stronger correlation (0.66 ≤ CC ≤ 0.82). However, the correlation of extreme precipitation intensity was relatively weak (0.56 ≤ CC ≤ 0.68). The correlations between ERA5 and observational data in extreme precipitation frequency, amount, and intensity were found to be higher during nighttime (0.82, 0.80, and 0.62, respectively) than during daytime (0.72, 0.62, and 0.56, respectively). This indicated that the ability of ERA5 to reproduce annual extreme precipitation in the YRD region was better during nighttime than daytime.
Annual extreme precipitation frequency at the daily scale was slightly underestimated by ERA5 reanalysis data, with Bias at −0.40 days and RB at −3.06% (Figure 6a). It is worth noting that the time series of the regionally averaged annual total extreme precipitation frequency at the daily scale from ERA5 and observational data were more consistent for the period 1961–2000, whereas ERA5 tended to be significantly underestimated for the period 2001–2018. There were diurnal differences in the estimation of the ERA5 extreme precipitation frequency. For instance, ERA5 overestimated daytime extreme precipitation frequency for the period 1961–2000 and slightly underestimated the frequency for the period 2001–2018. On the whole, this showed an overestimation, with Bias at 0.61 days and an RB of 6.67% (Figure 6b). During the nighttime, ERA5 tended to underestimate the extreme precipitation frequency for all study periods, with Bias at −1.98 days and RB at −20.24% (Figure 6c). The temporal characteristics of the extreme precipitation amount were similar to the extreme precipitation frequency, but the extreme precipitation amount in ERA5 at daily, daytime, and nighttime scales showed underestimations, with Bias at −70.42, −40.50, and −82.38 mm and RB at −11.59%, −13.14%, and −25.91%, respectively, among which the amount during nighttime was most clearly underestimated (Figure 6d–f). Notably, the extreme precipitation amount in ERA5 was underestimated significantly after 2001. Compared with observations, the extreme precipitation intensity in ERA5 was underestimated at the daily, daytime, and nighttime scales (Figure 6g–i); this was related to the extreme precipitation amount and frequency.
The interannual variation trends in extreme precipitation were further calculated for different periods based on the ERA5 and observational data (Table 2). The observed daily, daytime, and nighttime extreme precipitation frequency increased significantly at the rates of 0.41, 0.30, and 0.28 days/decade during the period 1961–2018, whereas no statistically significant interannual trends during the same period were observed in ERA5. The observed daily, daytime, and nighttime extreme precipitation frequency increased more significantly at the rates of 2.34, 1.65, and 1.75 days/decade (p < 0.05) during the period 2001–2018, respectively, whereas the ERA5 daily, daytime, and nighttime extreme precipitation frequency increased significantly at the rates of 0.92, 0.71, and 0.57 days/decade (p < 0.05), respectively, only during the period 1961–2000. Similar temporal characteristics were found in the extreme precipitation amount. During the period 1961–2018, the observed daily, daytime, and nighttime extreme precipitation amount increased significantly (24.69, 12.82, and 10.98 mm/decade, respectively), and it increased even more rapidly during the period 2001–2018 (127.37, 70.71, and 55.61 mm/decade, respectively). However, the daily, daytime, and nighttime extreme precipitation amount in ERA5 showed statistically significant increasing trends only for 1961–2000 (43.64, 21.86, and 19.13 mm/decade, respectively). For extreme precipitation intensity, increasing trends in daily, daytime, and nighttime extreme precipitation intensity during the period 1961–2018 were found only in the observational data as well as in the daytime during the period 2001–2018.
Some slight differences in the seasonal trend patterns were also found (Figures S4–S7, Tables S1–S4). For example, ERA5 showed a weak decreasing trend in extreme precipitation frequency (amount) in spring at the rate of −0.16 days/decade (−6.72 mm/decade) for the period 1961–2018, whereas no evident trends were found in observational data for the same period. Observational data showed an increasing trend in the extreme precipitation amount (intensity) at the rate of 20.76 mm/decade (1.60 mm/day/decade) for the period 2001–2018, whereas no evident trends were found in ERA5 during the same period (Figure S4, Table S1). The trend in summer was similar to those on the annual scale because extreme precipitation in summer dominated the whole year’s precipitation (Figure S5, Table S2). In autumn, observed daily, daytime, and nighttime extreme precipitation frequency (amount) increased at the rates of 1.24, 0.78, and 0.98 days/decade (58.51, 28.22, and 30.55 mm/decade), respectively, for the period 2001–2018. However, the extreme precipitation frequency and amount increased during the period 1961–2018 in winter (Figures S6 and S7, Tables S3 and S4). In summary, ERA5 generally reproduced the time series of the extreme precipitation in the YRD, but the estimation of interannual and seasonal trends remains to be improved.

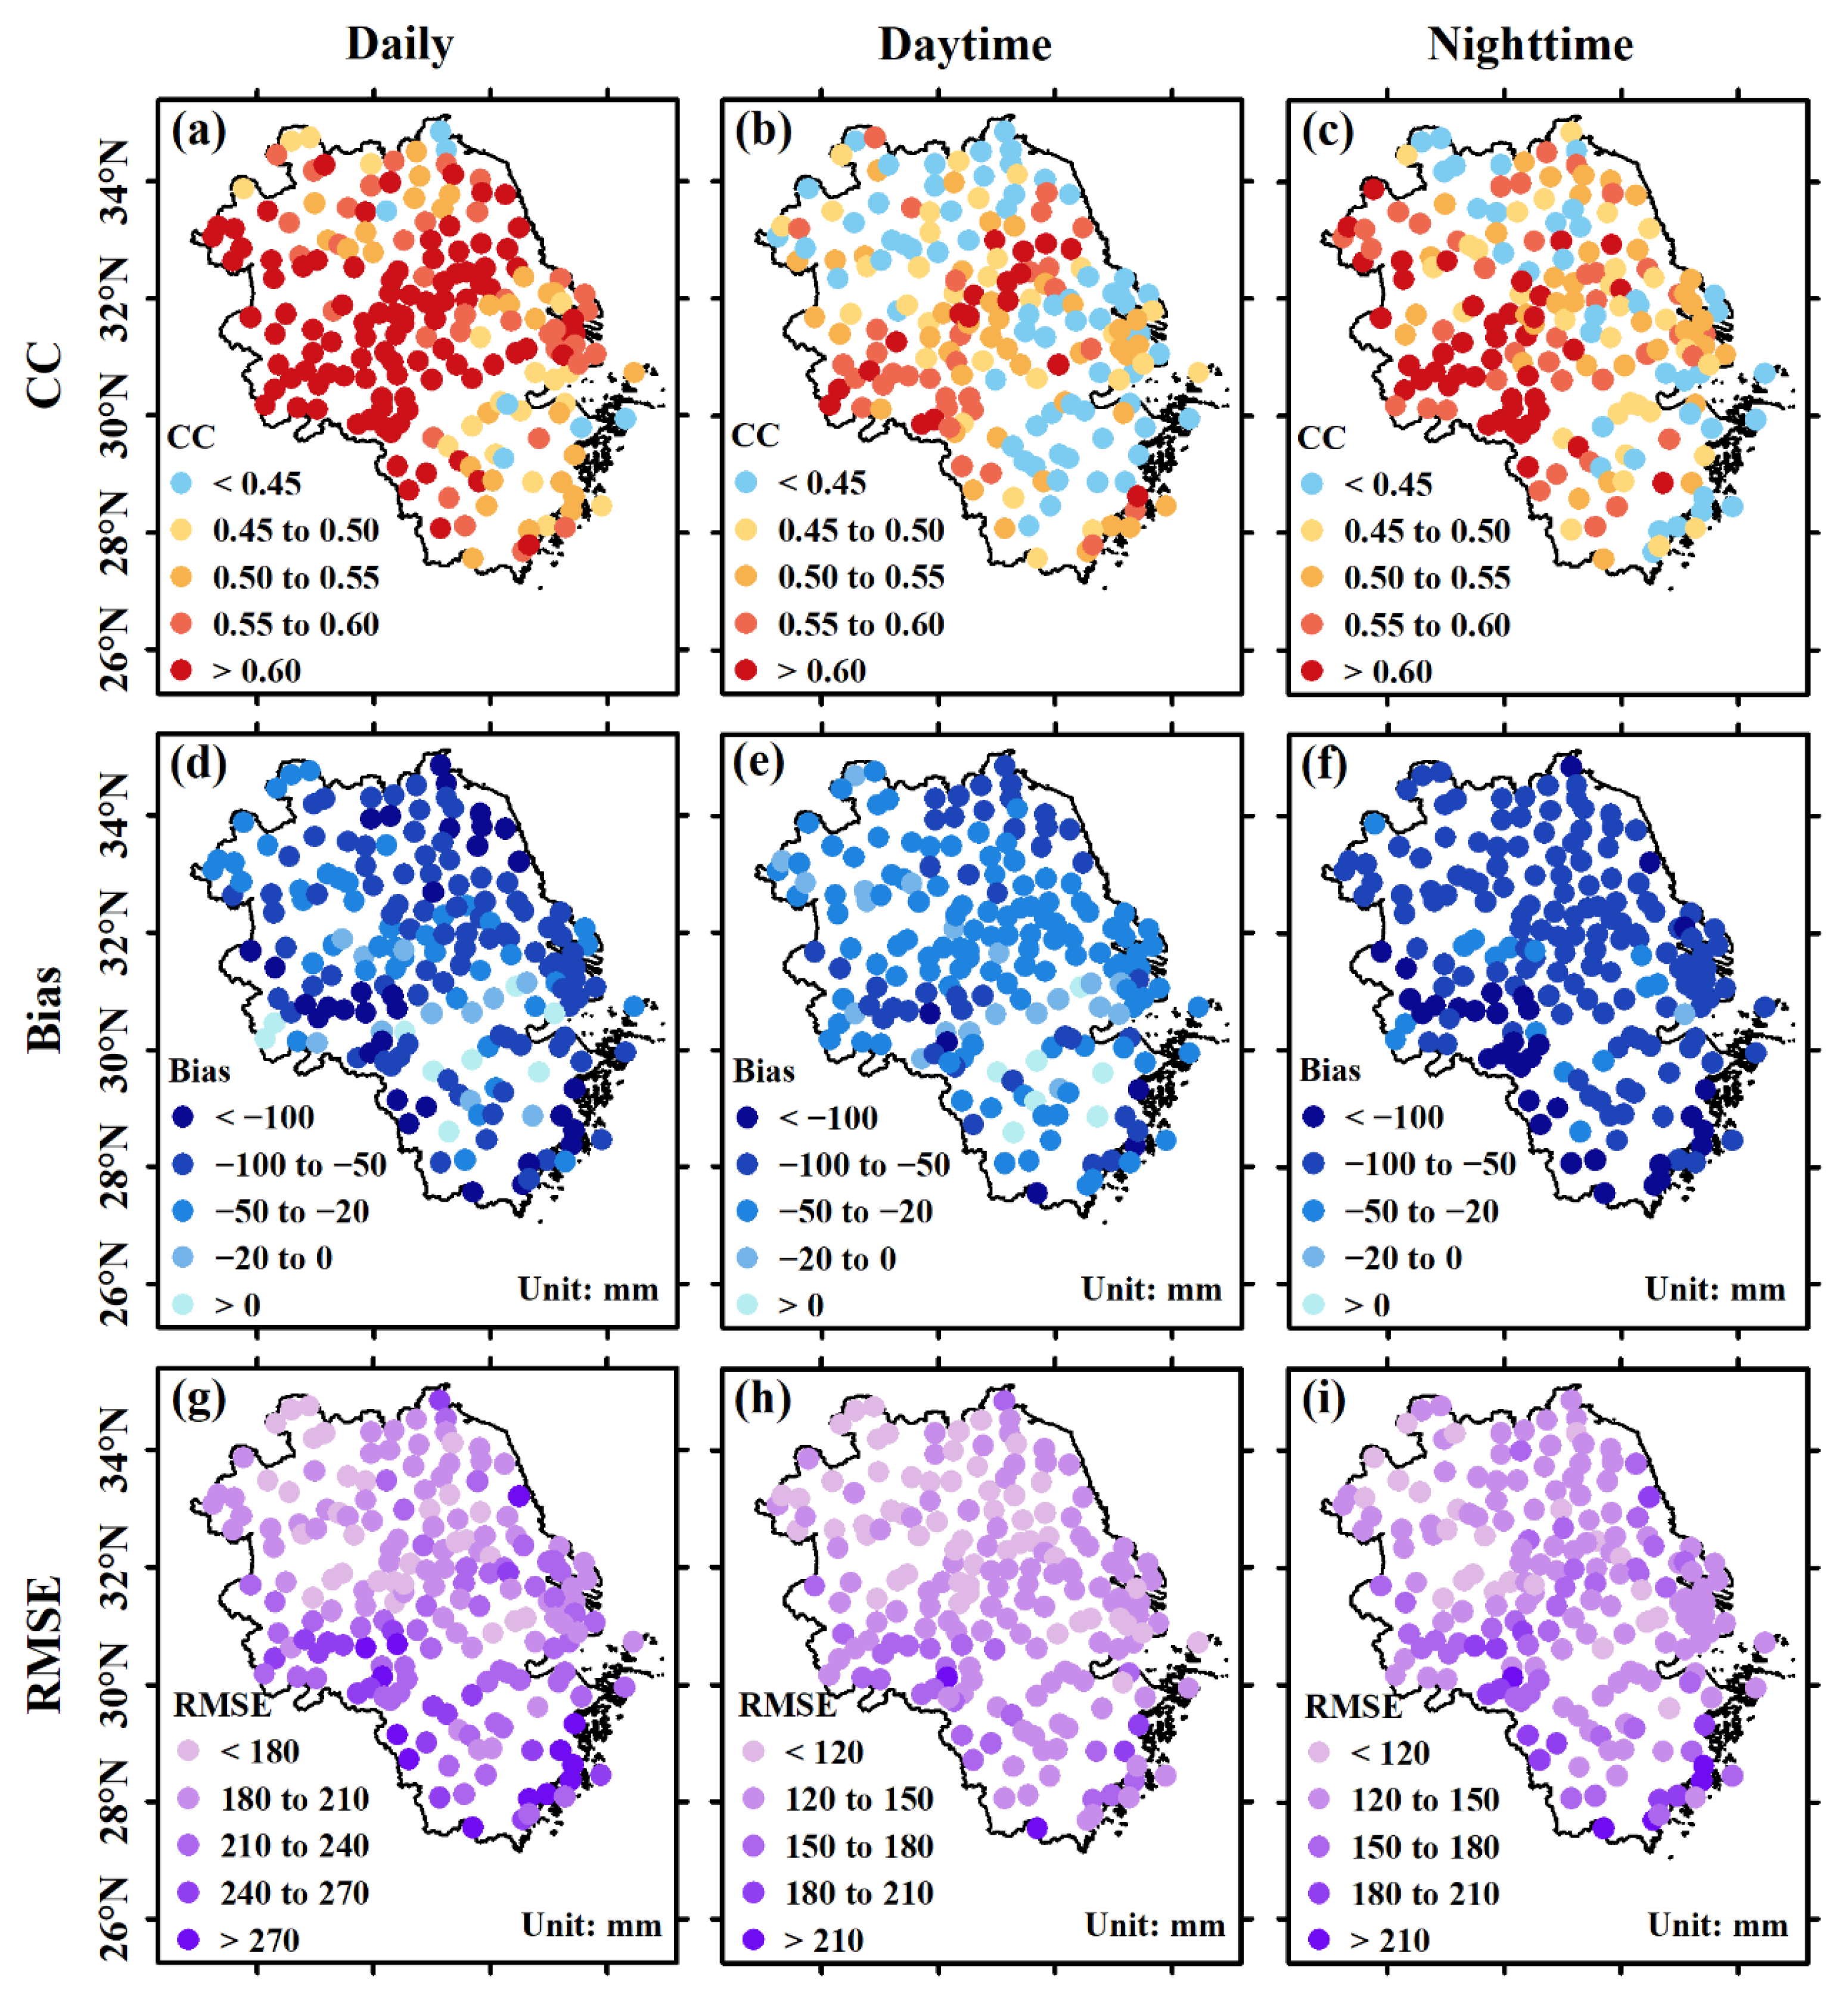
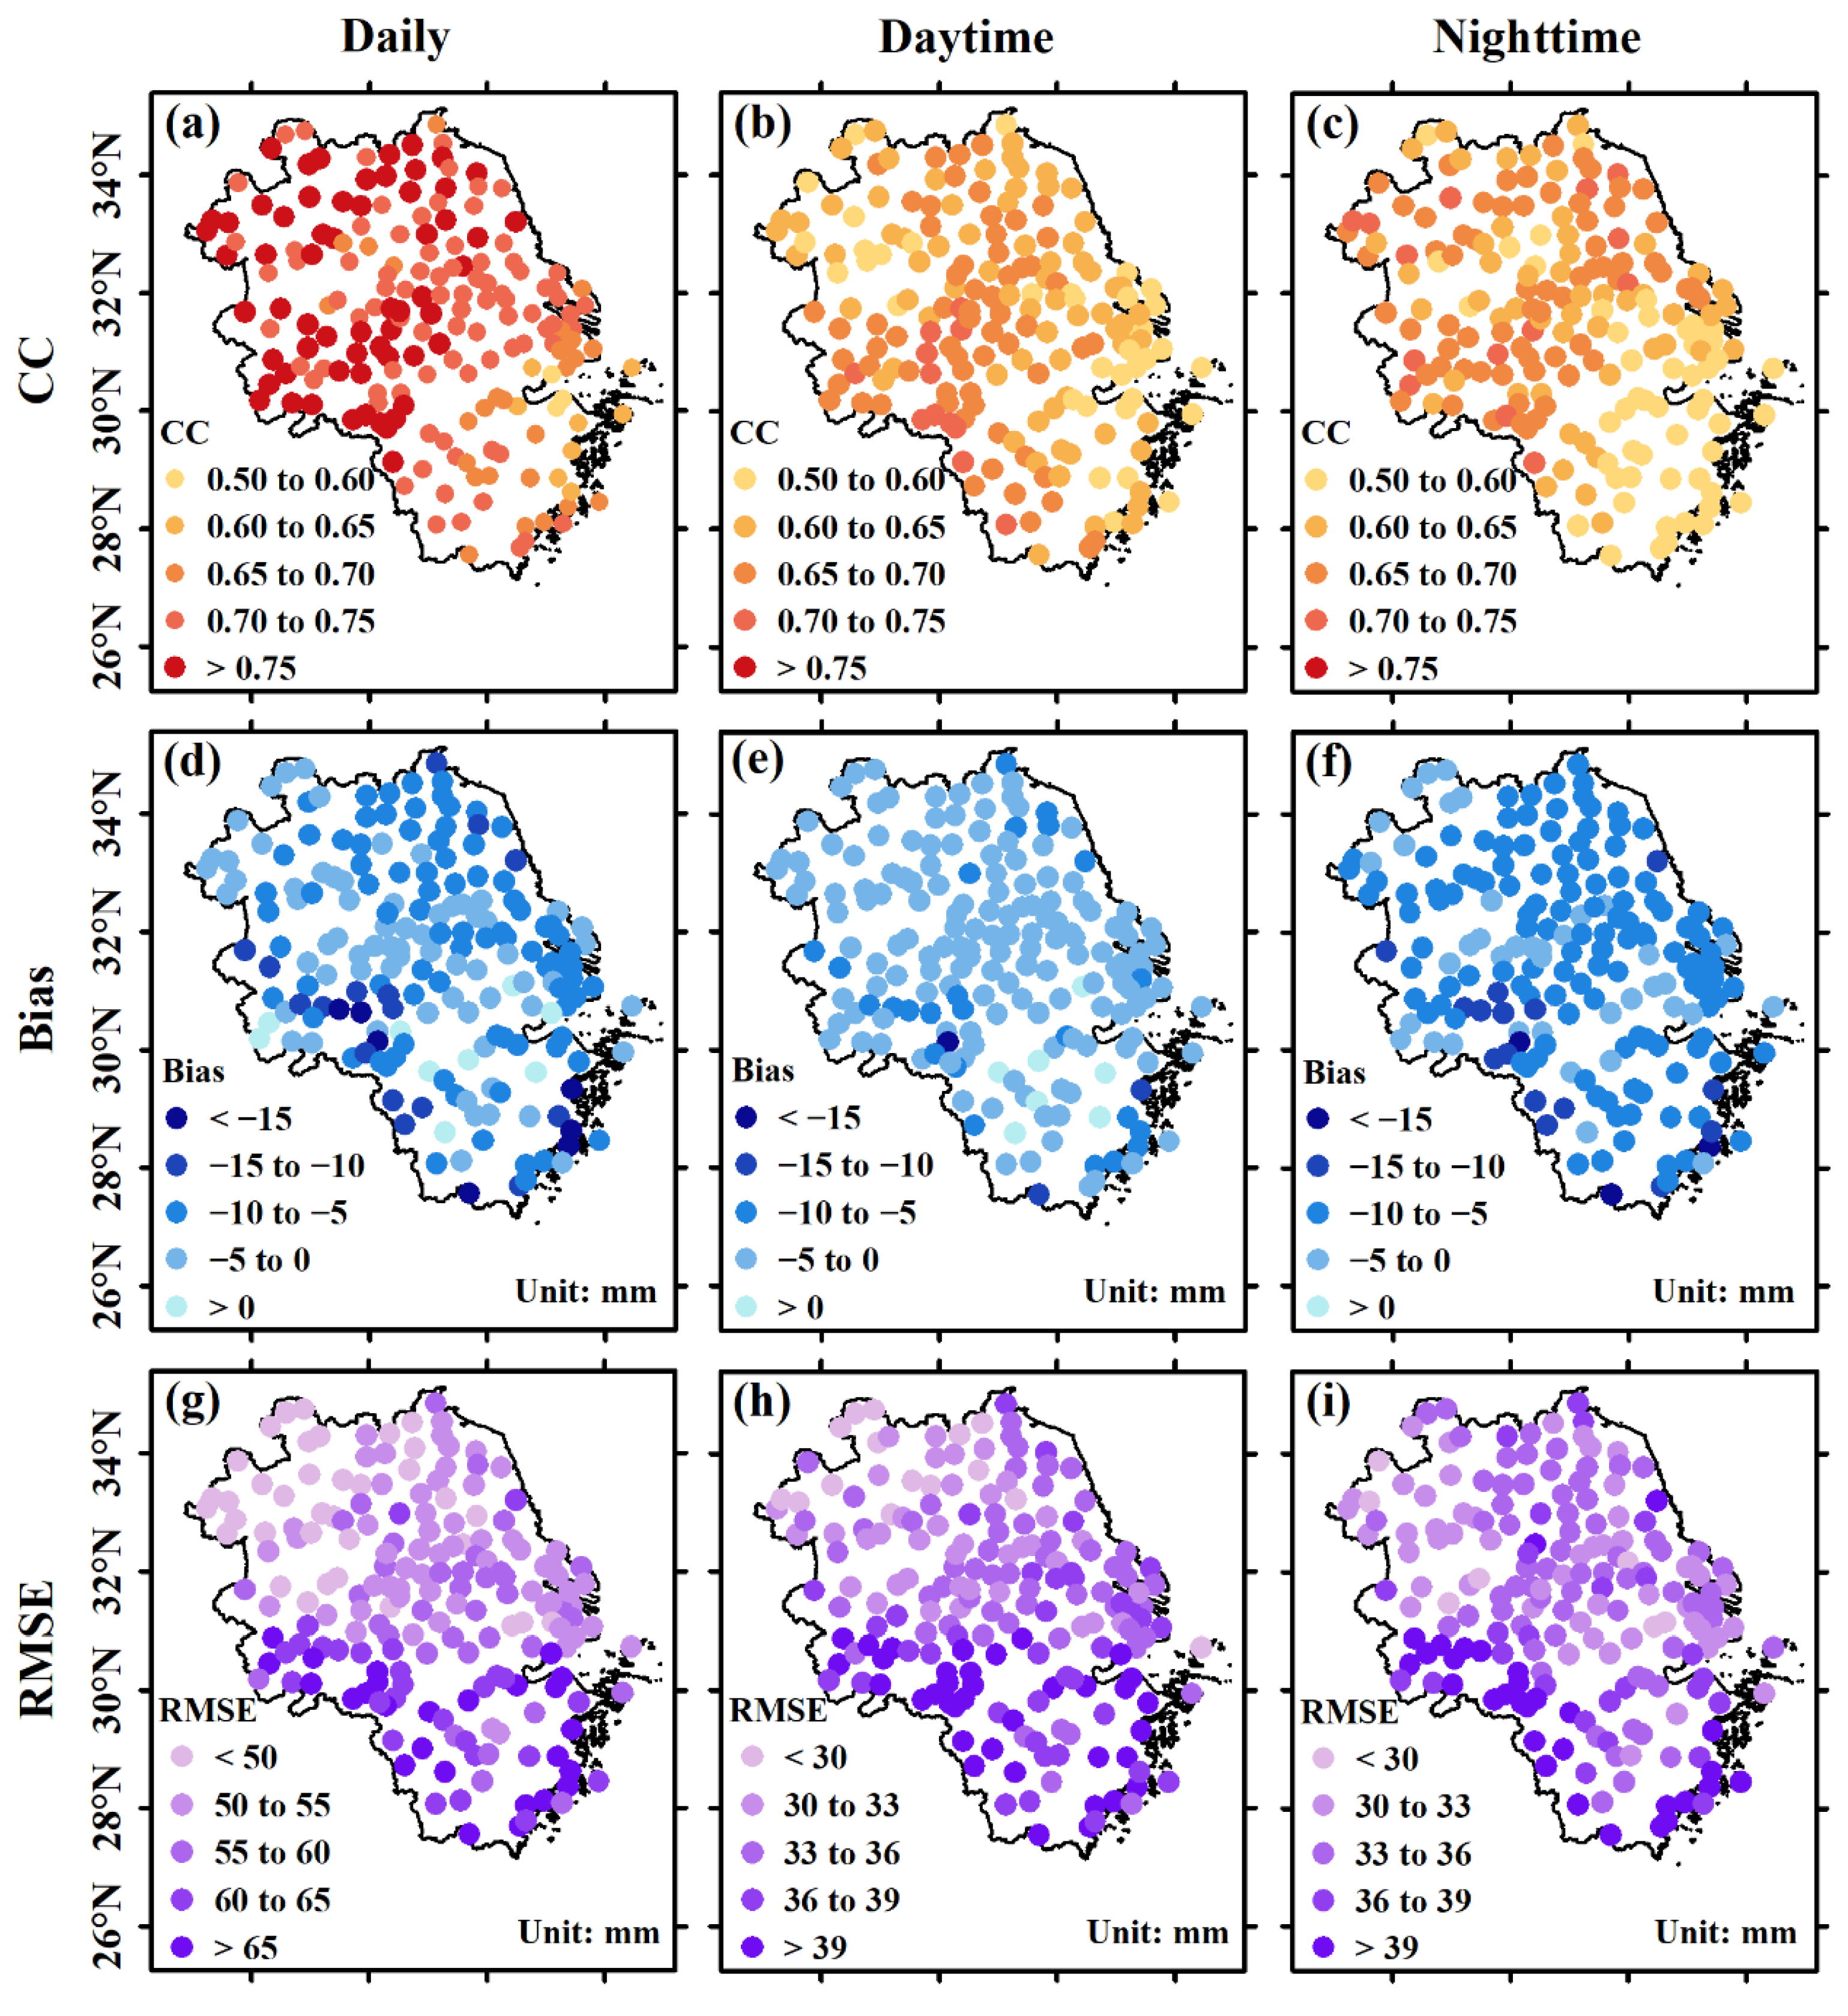
3.5. Spatial Patterns of Extreme Precipitation Evaluation

The spatial distribution of the CC, Bias, and RMSE of the monthly extreme precipitation amount between the ERA5 reanalysis data and observational data in the YRD for the period 1961–2018 was examined (Figure 7). In general, the monthly extreme precipitation amount in ERA5 displayed a higher correlation with observations at the daily scale (Figure 7a), with higher CC in the north (>0.70) and relatively lower CC in the south (0.50 < CC < 0.70). This indicated that ERA5 extreme precipitation in the central and north parts of the YRD better reproduced the monthly extreme precipitation characteristics. Similarly, daytime and nighttime extreme precipitation amounts also had higher CC in the north and lower CC in the south, but their values were lower than those on the daily scale (Figure 7b,c). Most station-corresponding ERA5 grid points showed negative Bias ranging from −15 to 0 mm; however, a small number of positive Bias were located south of the study area (Figure 7d–f). The spatial distribution of RMSE at the daily scale had a south–north gradient, with higher values in the south (>65 mm) and lower values in the north (<50 mm), indicating the extreme precipitation data in ERA5 had higher accuracy and reliability in the northern part of the YRD (Figure 7g). The numerical values of the RMSE during daytime and nighttime were relatively lower than the daily scale (Figure 7h,i).
The spatial distribution of the CC, Bias, and RMSE of the yearly extreme precipitation amount between the ERA5 reanalysis data and surface observations was similar to that at the monthly scale (Figure 8). The yearly extreme precipitation amount in ERA5 had higher CC with observations at the daily scale (Figure 8a), with higher values in the north (CC > 0.60) and lower values in the south (0.45 < CC < 0.50). However, daytime and nighttime extreme precipitation amounts had a lower CC in the northern and eastern parts of the YRD (Figure 8b,c). On the whole, CC on the annual scale was not as good as that on the monthly scale. Most station-corresponding ERA5 grid points showed underestimation, with Bias ranging from −100 to 0 mm and a small number of positive Bias values located in the south of the study area (Figure 8d–f). On the annual scale, the RMSE between ERA5 and observational data had a small overall difference, showing a weak north–south gradient (Figure 8g–i).

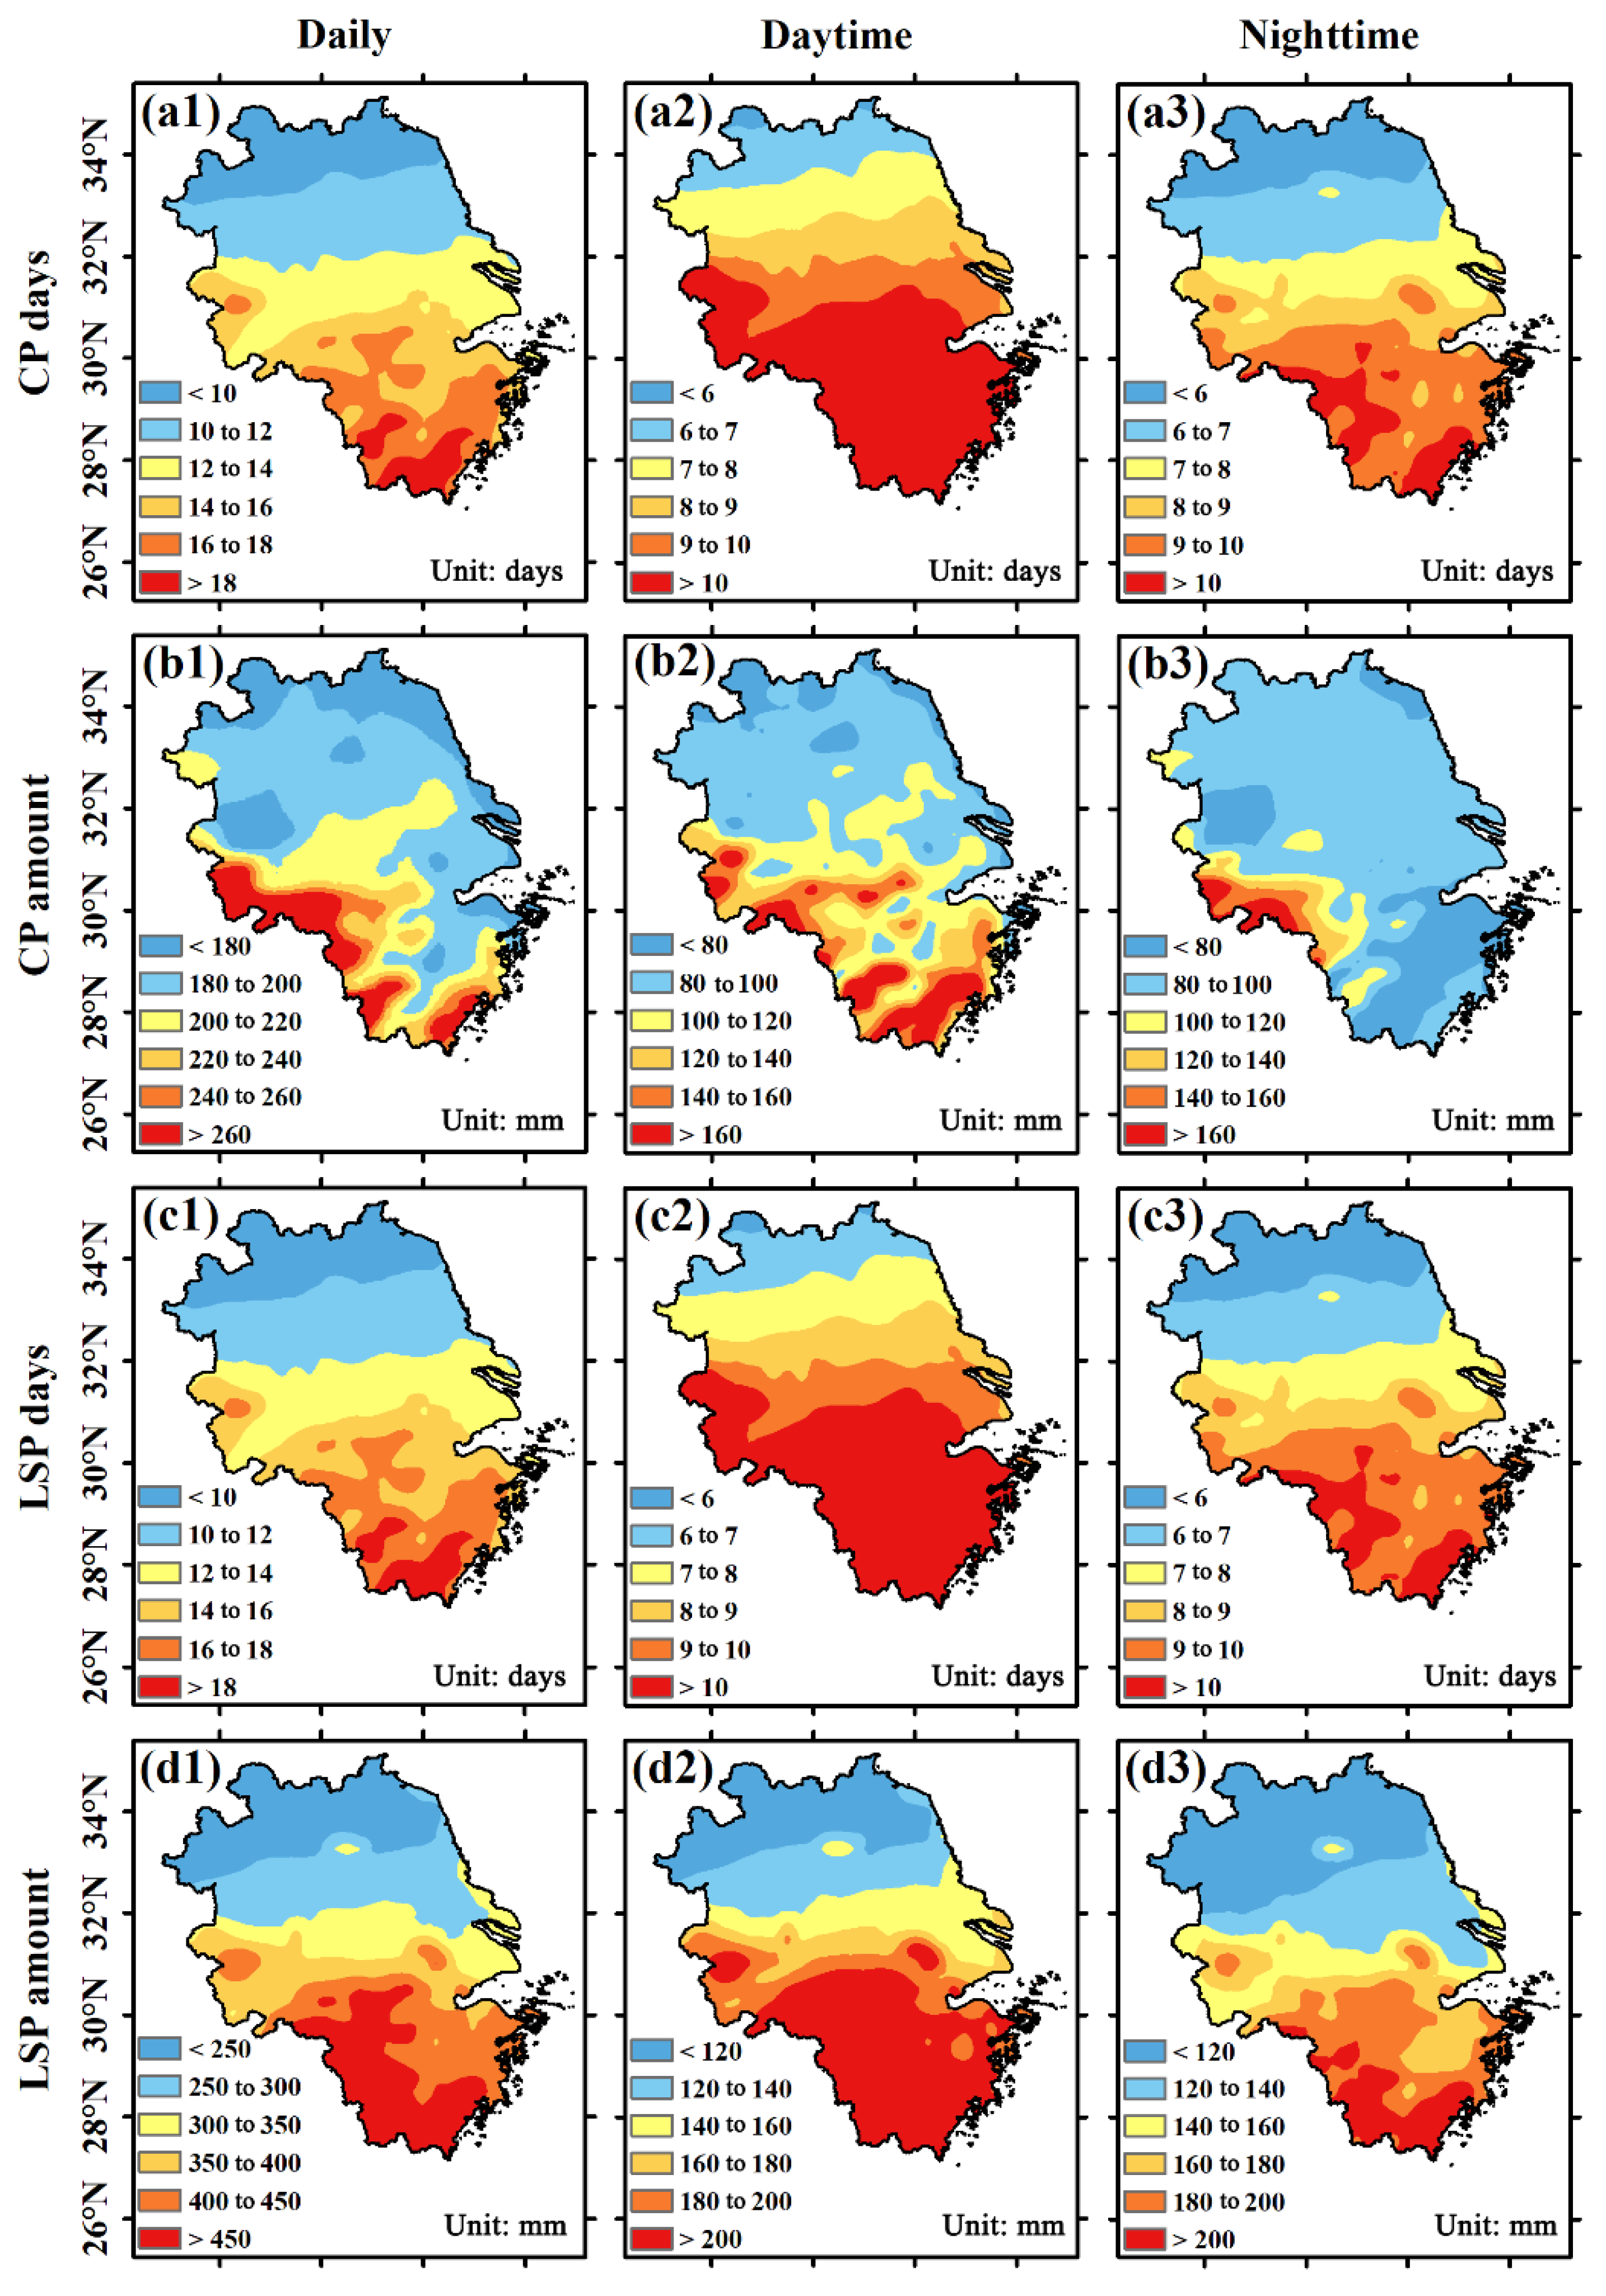
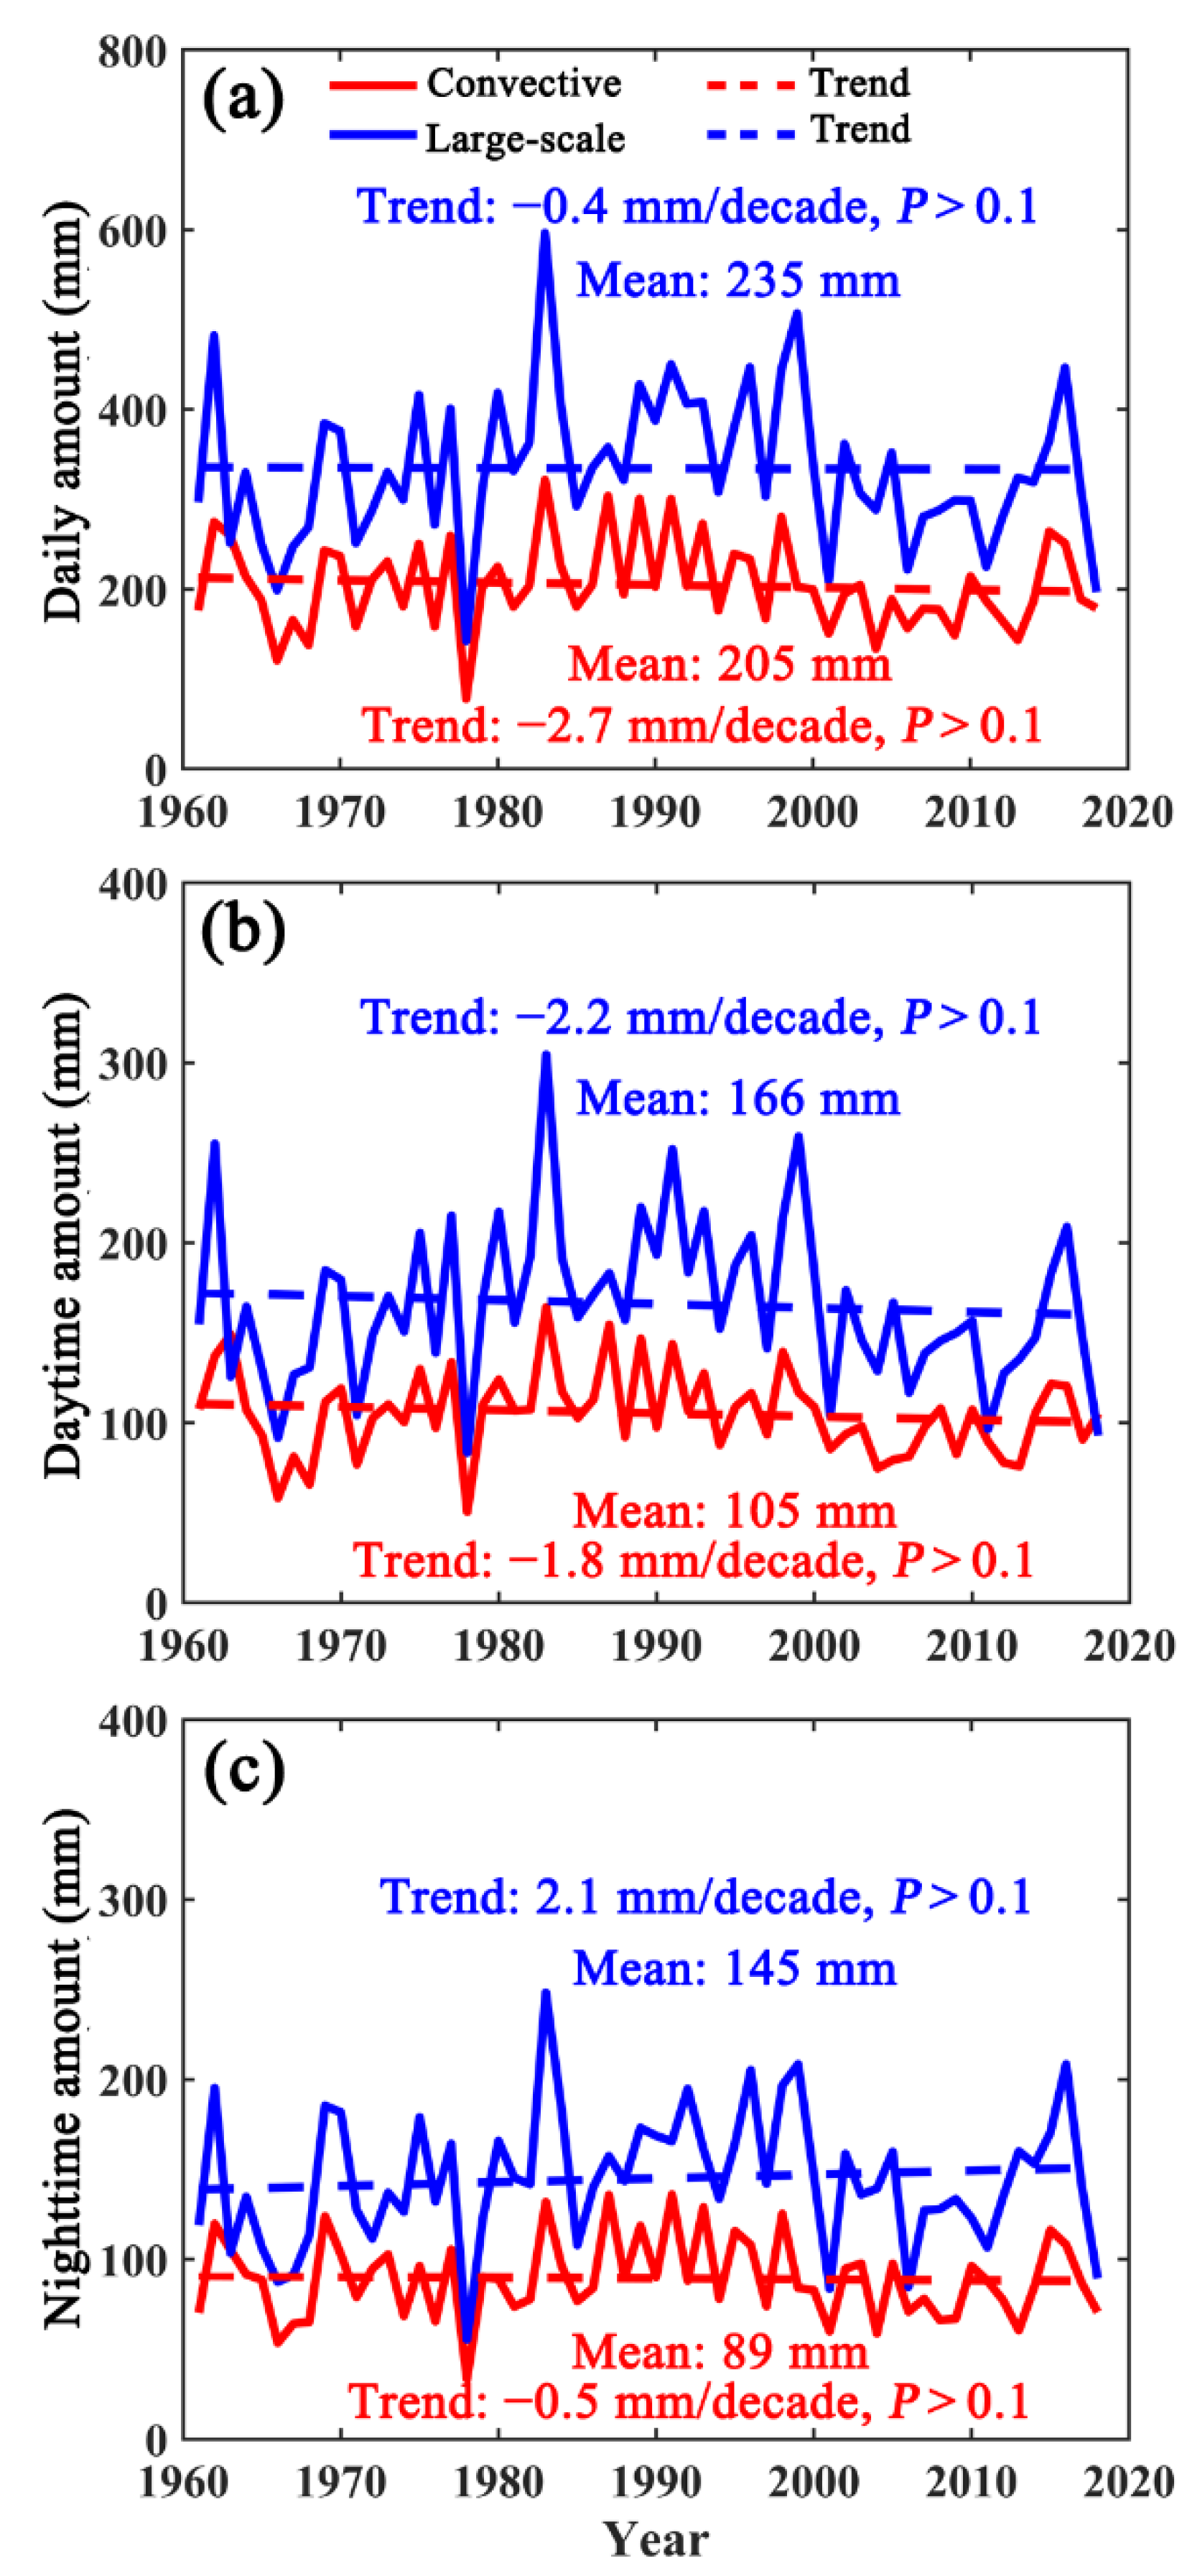
3.6. Patterns of Convective/Large-Scale Precipitation during Extreme Precipitation

Based on the above-mentioned evaluation of ERA5 extreme precipitation at different spatiotemporal scales, it was found that ERA5 generally reproduced the characteristics of extreme precipitation in the YRD region. In ERA5, precipitation consisted of convective and large-scale precipitation. To reveal the influence of different precipitation components on extreme precipitation, the spatiotemporal characteristics of convective and large-scale precipitation days and the amount when extreme precipitation occurred were further analyzed (Figure 9 and Figure 10). Notably, convection and large-scale precipitation, when mentioned below, refer to convection and large-scale precipitation when an extreme precipitation event occurs.
The annual mean convective precipitation days at the daily scale showed an evident south–north gradient, decreasing from the south (>16 days) to the north (<10 days) (Figure 9(a1)). The mean convective precipitation days at daytime and nighttime scales also exhibited similar patterns to those at the daily scale. However, their numbers of days were slightly lower, ranging from >10 days in the south to <6 days in the northern parts of the YRD (Figure 9(a2,a3)). It should be noted that the daytime and nighttime conditions here could not be directly compared because the numerical values of extreme precipitation thresholds were different. The distribution of large-scale precipitation days was almost the same as that of convective precipitation days (Figure 9(c1–c3)) because almost every extreme precipitation event in ERA5 included convective and large-scale precipitation processes. For extreme precipitation amounts, the high values of convective precipitation (>260 mm) at the daily scale were located in the southwestern part of the study area, whereas the low values (<200 mm) were in the north and eastern parts of the YRD (Figure 9(b1)). The values of daytime convective precipitation were greater than those during nighttime in the southern part of the study area (Figure 9(b2,b3)). Large-scale precipitation also had a similar spatial distribution, with high values in the south, low values in the north, and higher values during daytime than those during nighttime (Figure 9(d1–d3)).
The temporal characteristics of daily, daytime, and nighttime convective and large-scale precipitation that led to extreme precipitation were further investigated (Figure 10). ERA5 reanalysis data clearly revealed that extreme precipitation in the YRD was dominated by large-scale precipitation, with convective precipitation also playing an important role. The annual mean values of large-scale (convective) precipitation reached 235 (205), 166 (105), and 145 (89) mm at daily, daytime, and nighttime scales, respectively. The seasonal variations of convective and large-scale precipitation were also explored, and it was found that, in spring, large-scale (convective) precipitation decreased significantly (p < 0.1) at the daily scale, with rates of −3.7 (−2.9) mm/decade, whereas the trends were not statistically significant at the daytime and nighttime scales (Figure S8a–c). In summer, large-scale (convective) precipitation had a weak, increasing trend (p > 0.1) at daily and nighttime scales, with rates of 3.6 (1.1) and 3.1 (0.8) mm/decade, respectively, and negative trends during daytime at a rate of −0.1 (−0.6) mm/decade (Figure S8d–f). In autumn, convective and large-scale precipitation mainly decreased insignificantly during the study period (Figure S8g–i). In winter, large-scale precipitation at the daily scale decreased significantly at a rate of 1.6 mm/decade (p < 0.05), but the trend of convective precipitation was weak (p > 0.1), with daytime and nighttime showing insignificant trends (Figure S8j–l). On the whole, seasonal extreme precipitation was also dominated by large-scale precipitation, but the trends of large-scale and convective precipitation were not evident.

4. Discussion

Accurate extreme precipitation information is of great importance for urban disaster risk management and agricultural production safety [41]. The ERA5 reanalysis dataset is widely used in climate change sciences, providing a long-term database for extreme precipitation research [26,41]. In this study, the YRD, a highly populated and economically developed region in eastern China (highly susceptible to extreme precipitation), was used as an example for evaluating the reproducibility performance of spatiotemporal patterns of daily, daytime, and nighttime ERA5 extreme precipitation based on surface observations.
In the evaluation method between observations and ERA5, the general method used was to generate grid data from the meteorological stations [26,41]. However, such a spatial interpolation approach might introduce additional errors due to the uneven spatial distribution of stations [25,58,59]. Thus, this study directly compared the stations and their corresponding ERA5 grid points to avoid introducing new errors. This approach has also been used in previous studies [25,53,54]. It should be noted that, to date, there has been no unified comparison method, which is also one of the sources of uncertainty in evaluating results.
In this study, the conversion from UTC to local time was used for evaluation, which effectively improved the evaluation accuracy (Figure S1); however, many evaluation studies have ignored this point [19,26,41]. It should be noted that long timescale data can be evaluated directly using UTC time zones (with negligible error), while short timescale data, such as the daily scale or synoptic scale, should be evaluated by converting time zones to local time [16,30].
Meteorological stations only record precipitation events with daily precipitation amounts >0.1 mm. However, there are a large number of daily trace precipitation values (0–1 mm) in ERA5 that are not recorded by meteorological stations. This results in a significant overestimation of light precipitation events in ERA5, which is consistent with the findings of a recent study [26]. The percentile extreme precipitation threshold has been extracted by ranking all wet-day precipitation values during the study period from smallest to largest, with the values at the 90th-percentile being the 90th-percentile extreme precipitation threshold and any precipitation value above this threshold defined as extreme precipitation [57]. If the wet days in ERA5 precipitation were used directly to calculate thresholds, the presence of trace values would lead to a low threshold, resulting in a significant overestimation of extreme precipitation [53]. Therefore, in this study, trace values of wet-day precipitation in ERA5 were removed, and the corresponding mean threshold (24.75 mm) was closer to the surface observation (24.37 mm) (Table 1), indicating that this method was reasonable. It is suggested here that subsequent studies that use the percentile threshold approach for studying extreme precipitation in ERA5 should use the value of daily precipitation >1 mm.
This study systematically evaluated the spatiotemporal performance of daily, daytime, and nighttime extreme precipitation in the ERA5 data against observational data at different temporal scales in the YRD for the period 1961–2018. ERA5 extreme precipitation can generally capture the spatiotemporal patterns of the observed extreme precipitation in the YRD; this is suitable for hydrological cycle and climate change research [2,26,41]. The present assessment results show that ERA5 better reflects the spatial characteristics of the climatology of extreme precipitation in the YRD (Figure 4). Extreme precipitation in the YRD had a clear spatial heterogeneity in ERA5 and observational data, with higher values in the south and lower values in the northern parts of the study area. Notably, the western, southern, and southwestern parts of the YRD had more extreme precipitation, corresponding to relatively higher elevations (Figure 1). These results indicate that, in addition to the zonal differentiation of precipitation itself, the increased topographic elevation in these areas may be an important reason for the occurrence of more extreme precipitation in these mountainous and hilly areas rather than in low-lying plain areas [41]. However, the promotion effect of topographic rise on extreme precipitation does not exist in the whole region of China. For example, the Tibetan Plateau has a high and complex topography, and extreme precipitation over the Tibetan Plateau is much less than that of the YRD because it receives less moisture [26]. Considering that the YRD region is densely populated, more attention should be paid to topographically related extreme precipitation in the southwest of the YRD.
In general, the ERA5 can also effectively simulate the seasonal cycle characteristics of extreme precipitation in the YRD, with CC > 0.95 (Figure 5). However, except at nighttime, extreme precipitation at the daily and daytime scales was found to be slightly overestimated from April to June, while it was underestimated from July to October (the period of concentrated extreme precipitation). This was consistent with the conclusion of a previous study that pointed out that ERA5 can underestimate heavy precipitation [26]. In addition, ERA5 was effective at simulating the annual and seasonal variations in extreme precipitation. For example, the CC of the extreme precipitation frequency (amount) between ERA5 and observational data were all greater than 0.71 (0.65) at the annual and seasonal scales, respectively. The CC during nighttime was higher than that during daytime, but the mean and relative bias were larger during nighttime than during daytime, suggesting that nighttime simulations performed better on the interannual variability, but in terms of average deviation, daytime simulations performed better. Daytime ERA5 extreme precipitation frequency and amount displayed overestimation (underestimation) for the period 1961–2000 (2001–2018). Nighttime ERA5 extreme precipitation was underestimated for all study periods. It should be pointed out that ERA5 greatly underestimated extreme precipitation in the YRD region after the year 2001, which thus requires special attention.
The interannual variation trends of the extreme precipitation in ERA5 and observational data were different to some extent. For example, the daily ERA5 extreme precipitation frequency increased more significantly at a rate of 0.92 days/decade during the period 1961–2000, whereas the observational data increased more significantly at a rate of 2.34 days/decade during the period 2001–2018. The daily extreme precipitation frequency in ERA5 had no statistically significant trend during the period 1961–2018, but observations did have an increasing trend during the period 1961–2000 (Table 2). Daytime and nighttime extreme precipitation frequencies also showed the same characteristics. Similar patterns were also observed in extreme precipitation amounts at daily, daytime, and nighttime scales. Thus, the trend simulation of ERA5 extreme precipitation needs to be improved. For instance, Hu and Franzke [19] have pointed out that precipitation extremes in reanalysis datasets are less accurate compared to temperature extremes. A previous study has also pointed out that interannual and seasonal precipitation changes in the ERA5 reanalysis data are not entirely in agreement with surface observational data [41], which is consistent with the findings in this current study. This might have been because reanalysis products generally consider observational variables (e.g., 2 m air temperature, ground pressure, 2 m relative humidity, and 10 m wind speed) to obtain more mathematically and physically meaningful climate variability for improving data quality; however, uncertainty remains [32,41]. The ability of ERA5 reanalysis data to capture the real climate would be affected by errors in observational systems, numerical simulations, and assimilation schemes [41]. Accordingly, it is still difficult to completely replace observational data with reanalysis data to reflect the real state of the atmosphere [60]. Although the trend simulation effect needs to be improved, ERA5, as a new generation of reanalysis data, still provides a good data source basis for the spatiotemporal characteristics of extreme precipitation.
This study also found that the spatial distribution of convective and large-scale precipitation at the occurrence of extreme precipitation was similar to that of extreme precipitation, presenting a north–south gradient, with a high value in the south and a low value in the north (Figure 9). At first glance, both extreme convection and large-scale precipitation might appear to be higher during daytime than nighttime. However, it should be noted that the thresholds used for extreme precipitation extraction were different during daytime and nighttime, such that they could not have a direct magnitude comparison. In this study, the extreme precipitation in the YRD was dominated by large-scale precipitation throughout the whole study period, and the interannual and seasonal large-scale and convective precipitation showed almost no clear change trend (Figure 10 and Figure S8). This was slightly different from the findings of a previous study that used a different study area, time period, and precipitation data. They pointed out that convective/non-convective precipitation increased/decreased rapidly over Eurasia during the period 1966–2000, and convective precipitation became the dominant precipitation type by the end of the study period [44]. In their study, large-scale precipitation and convective precipitation data mainly came from ground observations, which could not accurately divide the proportion of convective and large-scale precipitation in extreme precipitation. Generally, extreme precipitation was divided into independent large-scale or convective precipitation or coexistence of the two. However, almost every extreme precipitation in the ERA5 reanalysis data accurately showed the joint participation of the two kinds of precipitation. These led to the difference between the findings of these two studies. Other studies on large-scale convective precipitation have mainly focused on the synoptic scale (short time scale) and could not obtain the changing characteristics of long time series [45,61]. Extreme convection and large-scale precipitation are very important to the study of extreme precipitation, and more accurate multisource datasets with longer time series are urgently needed for future studies to provide more accurate information and improve the ability of regional defenses against extreme precipitation.

5. Conclusions

Taking the YRD region as a case study, this study synthetically and systematically examined the ability of ERA5 extreme precipitation data to reproduce the extreme precipitation frequency, amount, and intensity at different temporal scales based on surface observational stations for the period 1961–2018 and also explored the spatiotemporal characteristics of convective and large-scale precipitation when extreme precipitation events occur. The conclusions were summarized as follows:
(1)
The threshold obtained from the 90th-percentile extraction using the daily ERA5 precipitation amount of >1 mm was very close to the threshold based on observations. Both the ERA5 total precipitation and extreme precipitation data at the all-day and all-month scales exhibited relatively good performance and reproducibility.
(2)
A spatial comparison showed that ERA5 effectively reproduced the spatial distribution of climatological extreme precipitation frequency and amount in the YRD region. It also showed higher correlations of the extreme precipitation amount between the ERA5 and surface observations at the monthly scale. ERA5 successfully represented the seasonal cycle and interannual variability of daily, daytime, and nighttime extreme precipitation. Daytime (nighttime) ERA5 extreme precipitation frequency and amount tended to be overestimated (underestimated) for the period 1961–2000, whereas they were significantly underestimated for the period 2000–2018. The estimation of annual and seasonal trends in ERA5 extreme precipitation remains to be improved.
(3)
ERA5 revealed that the annual mean convective/large-scale precipitation that contributes to extreme precipitation in the YRD was more in the south and less in the north. Extreme precipitation in the YRD was dominated by large-scale precipitation, with convective precipitation as an important supplement; however, their multiyear trends were not clear.

Supplementary Materials

The following supporting information can be downloaded at: https://www.mdpi.com/article/10.3390/atmos13091416/s1, Figure S1: Scatter plots of time-zone-adjusted (a–c) and unadjusted (d–f) ERA5 precipitation against surface observations at the daily, daytime, and nighttime scales for the period 1961–2018. The 185 meteorological stations and their corresponding ERA5 grid points were compared in this study; Figure S2. Scatterplot of daily (a,b), daytime (c,d), and nighttime (e,f) precipitation from observational stations and their corresponding ERA5 grid points for each station for each month or year in the YRD for the period 1961–2018. The left (right) column represents all-month (all-year) values, and solid red lines denote linear regression lines. The matching points at the monthly and annual scales are 128,760 and 10,730, respectively (185 stations * 696 months/station and 185 stations * 12 years/station); Figure S3. Same as Figure S2, but for extreme precipitation; Figure S4: Time series of the spring extreme precipitation frequency (a–c), amount (d–f), and intensity (g–i) in the observation stations (red) and their corresponding ERA5 grid-point (blue) reanalysis data at the daily, daytime, and nighttime scales (left, middle, and right columns, respectively); Figure S5: Same as Figure S4, but in summer; Figure S6: Same as Figure S4, but in autumn; Figure S7: Same as Figure S4, but in winter; Figure S8: Seasonal variations of convective and large-scale precipitation contributed to extreme precipitation at the daily, daytime, and nighttime scales in the YRD during the period 1961–2018; Table S1: Trends of spring extreme precipitation frequency, amount, and intensity from observation stations and their corresponding ERA5 grid points, respectively, at the daily, daytime, and nighttime scales; Table S2: Trends of summer extreme precipitation frequency, amount, and intensity from observation stations and their corresponding ERA5 grid points, respectively, at the daily, daytime, and nighttime scales; Table S3: Trends of autumn extreme precipitation frequency, amount, and intensity from observation stations and their corresponding ERA5 grid points, respectively, at the daily, daytime, and nighttime scales; Table S4: Trends of winter extreme precipitation frequency, amount, and intensity from observation stations and their corresponding ERA5 grid points, respectively, at the daily, daytime, and nighttime scales.

Author Contributions

Conceptualization, L.S., Y.Z. and S.U.; methodology: L.S. and Y.Z.; software: L.S. and X.M.; formal analysis, L.S. and Y.Z.; data curation, L.S. and Y.Z.; writing—original draft preparation, L.S.; writing—review and editing, L.S., J.W., Y.Z., X.M. and S.U.; visualization, L.S. and G.C.; supervision, J.W. and Y.Z.; funding acquisition, J.W. and Y.Z. All authors have read and agreed to the published version of the manuscript.

Funding

This study was supported by the National Natural Science Foundation of China (42171080, 42105125) and the Humanities and Social Sciences Foundation of the Chinese Ministry of Education (19YJCZH259).

Institutional Review Board Statement

Not applicable.

Informed Consent Statement

Not applicable.

Data Availability Statement

Data are available after request to the corresponding author.

Acknowledgments

We are very grateful to the anonymous reviewers for their constructive comments and thoughtful suggestions.

Conflicts of Interest

The authors declare no conflict of interest.

References

  1. IPCC. Summary for Policymakers. Climate Change 2021: The Physical Science Basis. In Contribution of Working Group I to the Sixth Assessment Report of the Intergovernmental Panel on Climate Change; Masson-Delmotte, V.P., Zhai, A., Pirani, S.L., Connors, C., Péan, S., Berger, N., Caud, Y., Chen, L., Goldfarb, M.I., Gomis, M., et al., Eds.; Cambridge University Press: Cambridge, UK, 2021. [Google Scholar]
  2. Allan, R.P.; Barlow, M.; Byrne, M.P.; Cherchi, A.; Douville, H.; Fowler, H.J.; Gan, T.Y.; Pendergrass, A.G.; Rosenfeld, D.; Swann, A.L.S.; et al. Advances in understanding large-scale responses of the water cycle to climate change. Ann. N. Y. Acad. Sci. 2020, 1472, 49–75. [Google Scholar] [CrossRef]
  3. Allan, R.P.; Soden, B.J. Atmospheric warming and the amplification of precipitation extremes. Science 2008, 321, 1481–1484. [Google Scholar] [CrossRef] [PubMed]
  4. Zhang, W.; Furtado, K.; Wu, P.; Zhou, T.; Chadwick, R.; Marzin, C.; Rostron, J.; Sexton, D. Increasing precipitation variability on daily-to-multiyear time scales in a warmer world. Sci. Adv. 2021, 7, eabf8021. [Google Scholar] [CrossRef] [PubMed]
  5. Zhai, P.; Zhang, X.; Wan, H.; Pan, X. Trends in Total Precipitation and Frequency of Daily Precipitation Extremes over China. J. Clim. 2005, 18, 1096–1108. [Google Scholar] [CrossRef]
  6. Pendergrass, A.G. What precipitation is extreme? Science 2018, 360, 1072. [Google Scholar] [CrossRef]
  7. Gualdi, S.; Scoccimarro, E.; Bellucci, A.; Zampieri, M.; Navarra, A. Heavy Precipitation Events in a Warmer Climate: Results from CMIP5 Models. J. Clim. 2013, 26, 7902–7911. [Google Scholar]
  8. Zhou, Z.Q.; Xie, S.P.; Zhang, R. Historic Yangtze flooding of 2020 tied to extreme Indian Ocean conditions. Proc. Natl. Acad. Sci. USA 2021, 118, e2022255118. [Google Scholar] [CrossRef]
  9. Cho, C.; Li, R.; Wang, S.Y.; Yoon, J.-H.; Gillies, R.R. Anthropogenic footprint of climate change in the June 2013 northern India flood. Clim. Dyn. 2015, 46, 797–805. [Google Scholar] [CrossRef]
  10. Zeppel, M.J.B.; Wilks, J.V.; Lewis, J.D. Impacts of extreme precipitation and seasonal changes in precipitation on plants. Biogeoscience 2014, 11, 3083–3093. [Google Scholar] [CrossRef]
  11. Nie, Y.; Sun, J. Moisture Sources and Transport for Extreme Precipitation Over Henan in July 2021. Geophys. Res. Lett. 2022, 49, e2021GL097446. [Google Scholar] [CrossRef]
  12. Schaller, N.; Kay, A.L.; Lamb, R.; Massey, N.R.; van Oldenborgh, G.J.; Otto, F.E.L.; Sparrow, S.N.; Vautard, R.; Yiou, P.; Ashpole, I.; et al. Human influence on climate in the 2014 southern England winter floods and their impacts. Nat. Clim. Chang. 2016, 6, 627–634. [Google Scholar] [CrossRef]
  13. IPCC. Managing the risks of extreme events and disasters to advance climate change adaptation. In A Special Report of Working Groups I and II of the Intergovernmental Panel on Climate Change; Cambridge University Press: Cambridge, UK, 2012. [Google Scholar]
  14. Myhre, G.; Alterskjaer, K.; Stjern, C.W.; Hodnebrog, O.; Marelle, L.; Samset, B.H.; Sillmann, J.; Schaller, N.; Fischer, E.; Schulz, M.; et al. Frequency of extreme precipitation increases extensively with event rareness under global warming. Sci. Rep. 2019, 9, 16063. [Google Scholar] [CrossRef] [PubMed]
  15. Zhang, W.; Zhou, T.; Zou, L.; Zhang, L.; Chen, X. Reduced exposure to extreme precipitation from 0.5 degrees C less warming in global land monsoon regions. Nat. Commun. 2018, 9, 3153. [Google Scholar] [CrossRef] [PubMed]
  16. Chinita, M.J.; Richardson, M.; Teixeira, J.; Miranda, P.M.A. Global mean frequency increases of daily and sub-daily heavy precipitation in ERA5. Environ. Res. Lett. 2021, 16, 074035. [Google Scholar] [CrossRef]
  17. You, S.; Chen, X. Regional integration degree and its effect on a city’s green growth in the Yangtze River Delta: Research based on a single-city regional integration index. Clean Technol. Environ. Policy 2021, 23, 1837–1849. [Google Scholar] [CrossRef]
  18. Shen, L.; Wen, J.; Zhang, Y.; Ullah, S.; Cheng, J.; Meng, X. Changes in population exposure to extreme precipitation in the Yangtze River Delta, China. Clim. Serv. 2022, 27, 100317. [Google Scholar] [CrossRef]
  19. Hu, G.; Franzke, C.L.E. Evaluation of Daily Precipitation Extremes in Reanalysis and Gridded Observation-Based Data Sets Over Germany. Geophys. Res. Lett. 2020, 47, e2020GL089624. [Google Scholar] [CrossRef]
  20. Rivoire, P.; Martius, O.; Naveau, P. A Comparison of Moderate and Extreme ERA-5 Daily Precipitation With Two Observational Data Sets. Earth Space Sci. 2021, 8, e2020EA001633. [Google Scholar] [CrossRef]
  21. Liao, X.; Xu, W.; Zhang, J.; Li, Y.; Tian, Y. Global exposure to rainstorms and the contribution rates of climate change and population change. Sci. Total Environ. 2019, 663, 644–653. [Google Scholar] [CrossRef]
  22. Wang, Y.; Li, H.; Wang, H.; Sun, B.; Chen, H. Evaluation of CMIP6 model simulations of extreme precipitation in China and comparison with CMIP5. Acta Meteorol. Sin. 2021, 79, 369–386. [Google Scholar]
  23. Liu, Y.; Geng, X.; Hao, Z.; Zheng, J. Changes in Climate Extremes in Central Asia under 1.5 and 2 °C Global Warming and their Impacts on Agricultural Productions. Atmosphere 2020, 11, 1076. [Google Scholar] [CrossRef]
  24. Wu, Y.; Wu, S.-Y.; Wen, J.; Xu, M.; Tan, J. Changing characteristics of precipitation in China during 1960–2012. Int. J. Clim. 2016, 36, 1387–1402. [Google Scholar] [CrossRef] [Green Version]
  25. Li, Y.; Guo, B.; Wang, K.; Wu, G.; Shi, C. Performance of TRMM Product in Quantifying Frequency and Intensity of Precipitation during Daytime and Nighttime across China. Remote Sens. 2020, 12, rs12040740. [Google Scholar] [CrossRef]
  26. Jiang, Q.; Li, W.; Fan, Z.; He, X.; Sun, W.; Chen, S.; Wen, J.; Gao, J.; Wang, J. Evaluation of the ERA5 reanalysis precipitation dataset over Chinese Mainland. J. Hydrol. 2021, 595, 125660. [Google Scholar] [CrossRef]
  27. Chen, H.; Yu, R.; Li, J.; Yuan, W.; Zhou, T. Why Nocturnal Long-Duration Rainfall Presents an Eastward-Delayed Diurnal Phase of Rainfall down the Yangtze River Valley. J. Clim. 2010, 23, 905–917. [Google Scholar] [CrossRef]
  28. Adler, R.F.; Sapiano, M.R.P.; Huffman, G.J.; Wang, J.-J.; Gu, G.; Bolvin, D.; Chiu, L.; Schneider, U.; Becker, A.; Nelkin, E.; et al. The Global Precipitation Climatology Project (GPCP) Monthly Analysis (New Version 2.3) and a Review of 2017 Global Precipitation. Atmosphere 2018, 9, 138. [Google Scholar] [CrossRef]
  29. Kidd, C.; Levizzani, V. Status of satellite precipitation retrievals. Hydrol. Earth Syst. Sci. 2011, 15, 1109–1116. [Google Scholar] [CrossRef]
  30. Zhou, C.; Wang, K. Contrasting Daytime and Nighttime Precipitation Variability between Observations and Eight Reanalysis Products from 1979 to 2014 in China. J. Clim. 2017, 30, 6443–6464. [Google Scholar] [CrossRef]
  31. You, Q.; Bao, Y.; Jiang, Z.; Pepin, N.; Moore, G.W.K. Surface pressure and elevation correction from observation and multiple reanalyses over the Tibetan Plateau. Clim. Dyn. 2019, 53, 5893–5908. [Google Scholar] [CrossRef]
  32. Dee, D.P.; Uppala, S.M.; Simmons, A.J.; Berrisford, P.; Poli, P.; Kobayashi, S.; Andrae, U.; Balmaseda, M.A.; Balsamo, G.; Bauer, P.; et al. The ERA-Interim reanalysis: Configuration and performance of the data assimilation system. Quart. J. Royal Meteorol. Soc. 2011, 137, 553–597. [Google Scholar] [CrossRef]
  33. Kobayashi, S.; Ota, Y.; Harada, Y.; Ebita, A.; Moriya, M.; Onoda, H.; Onogi, K.; Kamahori, H.; Kobayashi, C.; Endo, H.; et al. The JRA-55 Reanalysis: General Specifications and Basic Characteristics. J. Meteorol. Soc. Japan Ser. II 2015, 93, 5–48. [Google Scholar] [CrossRef]
  34. Gelaro, R.; McCarty, W.; Suárez, M.J.; Todling, R.; Molod, A.; Takacs, L.; Randles, C.A.; Darmenov, A.; Bosilovich, M.G.; Reichle, R.; et al. The Modern-Era Retrospective Analysis for Research and Applications, Version 2 (MERRA-2). J. Clim. 2017, 30, 5419–5454. [Google Scholar] [CrossRef] [PubMed]
  35. Saha, S.; Moorthi, S.; Wu, X.; Wang, J.; Nadiga, S.; Tripp, P.; Behringer, D.; Hou, Y.-T.; Chuang, H.-y.; Iredell, M.; et al. The NCEP Climate Forecast System Version 2. J. Clim. 2014, 27, 2185–2208. [Google Scholar] [CrossRef]
  36. Harrigan, S.; Zsoter, E.; Alfieri, L.; Prudhomme, C.; Salamon, P.; Wetterhall, F.; Barnard, C.; Cloke, H.; Pappenberger, F. GloFAS-ERA5 operational global river discharge reanalysis 1979–present. Earth Syst. Sci. Data. 2020, 12, 2043–2060. [Google Scholar] [CrossRef]
  37. Hersbach, H.; Bell, B.; Berrisford, P.; Hirahara, S.; Horányi, A.; Muñoz-Sabater, J.; Nicolas, J.; Peubey, C.; Radu, R.; Schepers, D.; et al. The ERA5 global reanalysis. Quart. J. Royal Meteorol. Soc. 2020, 146, 1999–2049. [Google Scholar] [CrossRef]
  38. Tarek, M.; Brissette, F.P.; Arsenault, R. Evaluation of the ERA5 reanalysis as a potential reference dataset for hydrological modelling over North America. Hydrol. Earth Syst. Sci. 2020, 24, 2527–2544. [Google Scholar] [CrossRef]
  39. Jain, P.; Castellanos-Acuna, D.; Coogan, S.C.P.; Abatzoglou, J.T.; Flannigan, M.D. Observed increases in extreme fire weather driven by atmospheric humidity and temperature. Nat. Clim. Chang. 2021, 12, 63–70. [Google Scholar] [CrossRef]
  40. Zhu, Y.; Liu, X.; Zhang, Y.; Chen, C.; Shen, L.; Ju, Q.; Zhou, T.; Xia, P. The Proportional Characteristics of Daytime and Nighttime Precipitation Based on Daily Precipitation in Huai River Basin, China. Atmosphere 2022, 13, 1287. [Google Scholar] [CrossRef]
  41. Jiao, D.; Xu, N.; Yang, F.; Xu, K. Evaluation of spatial-temporal variation performance of ERA5 precipitation data in China. Sci. Rep. 2021, 11, 17956. [Google Scholar] [CrossRef]
  42. Yu, R.; Zhou, T.; Xiong, A.; Zhu, Y.; Li, J. Diurnal variations of summer precipitation over contiguous China. Geophys. Res. Lett. 2007, 34, 2006GL028129. [Google Scholar] [CrossRef]
  43. Tayyab, M.; Zhang, J.; Hussain, M.; Ullah, S.; Liu, X.; Khan, S.N.; Baig, M.A.; Hassan, W.; Al-Shaibah, B. Gis-Based Urban Flood Resilience Assessment Using Urban Flood Resilience Model: A Case Study of Peshawar City, Khyber Parhtunkhwa, Pakistan. Remote Sens. 2021, 13, 1864. [Google Scholar] [CrossRef]
  44. Ye, H.; Fetzer, E.J.; Wong, S.; Lambrigtsen, B.H. Rapid decadal convective precipitation increase over Eurasia during the last three decades of the 20th century. Sci. Adv. 2017, 3, e1600944. [Google Scholar] [CrossRef] [PubMed] [Green Version]
  45. Wang, R.; Tian, W.; Chen, F.; Wei, D.; Luo, J.; Tian, H.; Zhang, J. Analysis of convective and stratiform precipitation characteristics in the summers of 2014–2019 over Northwest China based on GPM observations. Atmos. Res. 2021, 262, 105762. [Google Scholar] [CrossRef]
  46. Kyselý, J.; Rulfová, Z.; Farda, A.; Hanel, M. Convective and stratiform precipitation characteristics in an ensemble of regional climate model simulations. Clim. Dyn. 2015, 46, 227–243. [Google Scholar] [CrossRef]
  47. National Bureau of Statistics of China. China Statistical Yearbook 2020; China Statistics Press: Beijing, China, 2020.
  48. Tang, D.; Mao, M.; Shi, J.; Hua, W. The Spatio-Temporal Analysis of Urban-Rural Coordinated Development and Its Driving Forces in Yangtze River Delta. Land 2021, 10, 495. [Google Scholar] [CrossRef]
  49. Wang, Y.; Xu, Y.; Tabari, H.; Wang, J.; Wang, Q.; Song, S.; Hu, Z. Innovative trend analysis of annual and seasonal rainfall in the Yangtze River Delta, eastern China. Atmos. Res. 2020, 231, 104673. [Google Scholar] [CrossRef]
  50. Sun, R.; Gong, Z.; Gao, G.; Shah, A.A. Comparative analysis of Multi-Criteria Decision-Making methods for flood disaster risk in the Yangtze River Delta. Int. J. Disaster Risk Reduct. 2020, 51, 101768. [Google Scholar] [CrossRef]
  51. Zhang, Y.; Liu, C.; You, Q.; Chen, C.; Xie, W.; Ye, Z.; Li, X.; He, Q. Decrease in light precipitation events in Huai River Eco-economic Corridor, a climate transitional zone in eastern China. Atmos. Res. 2019, 226, 240–254. [Google Scholar] [CrossRef]
  52. Ullah, W.; Wang, G.; Lou, D.; Ullah, S.; Bhatti, A.S.; Ullah, S.; Karim, A.; Hagan, D.F.T.; Ali, G. Large-scale atmospheric circulation patterns associated with extreme monsoon precipitation in Pakistan during 1981–2018. Atmos. Res. 2021, 253, 105489. [Google Scholar] [CrossRef]
  53. Zhang, Y.; Mao, G.; Chen, C.; Shen, L.; Xiao, B. Population Exposure to Compound Droughts and Heatwaves in the Observations and ERA5 Reanalysis Data in the Gan River Basin, China. Land 2021, 10, 1021. [Google Scholar] [CrossRef]
  54. Zhao, P.; Gao, L.; Wei, J.; Ma, M.; Deng, H.; Gao, J.; Chen, X. Evaluation of ERA-Interim Air Temperature Data over the Qilian Mountains of China. Adv. Meteorol. 2020, 2020, 7353482–7353492. [Google Scholar] [CrossRef]
  55. Duan, A.; Xiao, Z. Does the climate warming hiatus exist over the Tibetan Plateau? Sci. Rep. 2015, 5, 13711. [Google Scholar] [CrossRef] [PubMed] [Green Version]
  56. Shen, L.; Zhang, Y.; Ullah, S.; Pepin, N.; Ma, Q. Changes in snow depth under elevation-dependent warming over the Tibetan Plateau. Atmos. Sci. Lett. 2021, 22, e1041. [Google Scholar] [CrossRef]
  57. Zhao, J.; Su, B.; Sanjit, K.M.; Wang, Y.; Tao, H.; Jiang, T. Population exposure to precipitation extremes in the Indus River Basin at 1.5 °C, 2 °C and 3 °C warming levels. Adv. Clim. Chang. Res. 2021, 12, 199–209. [Google Scholar] [CrossRef]
  58. Li, Z.; Yang, D.; Hong, Y. Multi-scale evaluation of high-resolution multi-sensor blended global precipitation products over the Yangtze River. J. Hydrol. 2013, 500, 157–169. [Google Scholar] [CrossRef]
  59. Tan, M.L.; Ibrahim, A.L.; Duan, Z.; Cracknell, A.P.; Chaplot, V. Evaluation of Six High-Resolution Satellite and Ground-Based Precipitation Products over Malaysia. Remote Sens. 2015, 7, 1504–1528. [Google Scholar] [CrossRef]
  60. Bengtsson, L. Can climate trends be calculated from reanalysis data? J. Geophys. Res. 2004, 109, 2004JD004536. [Google Scholar] [CrossRef]
  61. Rulfová, Z.; Kyselý, J. Trends of Convective and Stratiform Precipitation in the Czech Republic, 1982–2010. Adv. Meteorol. 2014, 2014, 647938–647948. [Google Scholar] [CrossRef] [Green Version]
Figure 1. Locations of 185 meteorological stations and 549 ERA5 grid points in the YRD.
Atmosphere 13 01416 g001
Figure 2. Scatterplot of daily (a,b), daytime (c,d), and nighttime (e,f) precipitation from surface observational stations and their corresponding ERA5 grid points in the YRD for the period 1961–2018. The left (right) column represents all-day (all-month) values, and solid red lines denote linear regression lines. The 21,184 and 696 matching points on the all-day and all-month scales represent the temporal comparisons over 21 and 184 days and 696 months, respectively.
Atmosphere 13 01416 g002
Figure 3. Scatterplot of daily (a,b), daytime (c,d), and nighttime (e,f) extreme precipitation from surface observational stations and their corresponding ERA5 grid points in the YRD for the period 1961–2018. The left (right) column represents all-day (all-month) values, and solid red lines denote linear regression lines. The 21,184 and 696 matching points on the all-day and all-month scales represent the temporal comparisons over 21 and 184 days and 696 months, respectively.
Atmosphere 13 01416 g003
Figure 4. Spatial distribution of annual mean extreme precipitation days (a,b) and amount (c,d) in the YRD for the period 1961–2018.
Atmosphere 13 01416 g004
Figure 5. Seasonal cycles of extreme precipitation frequency (ac), amount (df), and intensity (gi) in observations (OBS, red) and their corresponding ERA5 grid points (blue) at the daily, daytime, and nighttime scales (top, middle, and bottom rows, respectively). CC denotes correlation coefficient.
Atmosphere 13 01416 g005
Figure 6. Time series of the annual extreme precipitation frequency (ac), amount (df), and intensity (gi) in the observational stations (red) and their corresponding ERA5 grid points (blue) reanalysis data at the daily, daytime, and nighttime scales (left, middle, and right columns, respectively).
Atmosphere 13 01416 g006
Figure 7. Correlation coefficient (CC) (ac), Bias (df), and RMSE (gi) between the monthly time series of precipitation amount data of stations and their corresponding ERA5 grid points at the daily, daytime, and nighttime scales (left, middle, and right panels, respectively) for the period 1961–2018 in the YRD.
Atmosphere 13 01416 g007
Figure 8. Correlation coefficient (CC) (ac), Bias (df), and RMSE (gi) between the yearly time series of precipitation amount data of stations and their corresponding ERA5 grid points at the daily, daytime, and nighttime scales (left, middle, and right panels, respectively) for the period 1961–2018 in the YRD.
Atmosphere 13 01416 g008
Figure 9. Annual mean convective/large-scale precipitation days (a1a3, c1c3) and amounts (b1b3, d1d3) contributing to extreme precipitation at the daily, daytime, and nighttime scales.
Atmosphere 13 01416 g009
Figure 10. Time series of convective and large-scale precipitation amounts at daily (a), daytime (b), and nighttime (c) scales for the period 1961–2018 in the YRD.
Atmosphere 13 01416 g010
Table 1. The 90th-percentile threshold for surface observational stations and the adjusted and unadjusted threshold for station-corresponding ERA5 grid points.
ThresholdTime Scale
DailyDaytimeNighttime
Threshold for observation24.37 mm18.17 mm16.17 mm
Adjusted threshold for ERA524.75 mm16.95 mm17.97 mm
Unadjusted threshold for ERA519.33 mm12.56 mm13.57 mm
Note: Adjusted and unadjusted thresholds represent the threshold extracted using daily ERA5 precipitation amounts of >1 and 0.1 mm, respectively.
Table 2. Trends of annual extreme precipitation frequency, amount, and intensity from observational stations and their corresponding ERA5 grid points, respectively, at the daily, daytime, and nighttime scales.
Time ScalePeriodFrequency (Days/Decade)Amount
(mm/Decade)
Intensity
mm/Day/Decade
OBSERA5OBSERA5OBSERA5
Daily1961–20180.41 **−0.0924.69 ***−2.140.49 ***0.16
1961–20000.49 *0.92 **27.76*43.64 **0.460.40
2001–20182.34 **0.85127.37 ***49.201.311.20
Daytime1961–20180.30 **−0.1212.82 ***−3.490.29 ***−0.01
1961–20000.40 *0.71 **14.40 *21.86 **0.110.20
2001–20181.65 **0.5170.71 ***18.451.40 **0.52
Nighttime1961–20180.28 **0.0410.98 **2.020.24 *0.14
1961–20000.290.57 **11.1619.13 **0.240.28
2001–20181.75 **0.8455.61 **25.82−0.120.14
Note: *, **, and *** represent significance at 0.1, 0.05, and 0.01 level, respectively.
Publisher’s Note: MDPI stays neutral with regard to jurisdictional claims in published maps and institutional affiliations.

