Article

Possible Impact of Early Spring Arctic Sea Ice on Meiyu Cessation over the Yangtze–Huaihe River Basin

1
Tianjin Key Laboratory for Oceanic Meteorology, Tianjin 300074, China
2
Tianjin Institute of Meteorological Science, Tianjin 300074, China
3
Civil Aviation University of China, Tianjin 300300, China
4
Mitigation and Adaptation to Climate Change in Shanghai, Shanghai Regional Climate Center, Shanghai 200030, China
*
Author to whom correspondence should be addressed.
Atmosphere 2022, 13(8), 1293; https://doi.org/10.3390/atmos13081293
Submission received: 4 July 2022 / Revised: 10 August 2022 / Accepted: 11 August 2022 / Published: 15 August 2022
(This article belongs to the Special Issue The Water Cycle and Climate Change)

Abstract

:
The timing of the cessation of Meiyu is closely connected to the amount of Meiyu rainfall and the commencement of the rainy season in North China. Accurately forecasting the Meiyu withdrawal date (MWD) over the Yangtze–Huaihe River basin (YHRB) has significant implications for the prevention and mitigation of flooding in eastern China. This study observed an intimate out-of-phase relationship between MWD variations and early spring (March and April) Arctic Sea ice area (SIA) anomalies to the north of the Chukchi and Beaufort Seas, as well as SIA anomalies to the north of the Queen Elizabeth Islands (75° N–82° N, 170° E–130° W and 82° N–86° N, 130° W–80° W, respectively) on the interannual timescale. As such, these can be considered key Arctic Sea ice domains connected to Meiyu cessation in the YHRB. The Arctic SIA anomalies in the key domains persist from early spring to early summer (May and June), thus exerting a lag modulation effect on year-to-year changes in Meiyu cessation, which can be demonstrated through observational analysis and results from the Community Earth System Model Large Ensemble Numerical Simulation (CESM-LENS) project. Specifically, the preceding negative SIA anomalies in the key domains are linked to a planetary-scale Rossby wave-like pattern emanating over areas to the northwest of the Chukchi Sea. This tele-connected wave-like pattern is conducive to the generation and maintenance of a quasi-barotropic “north-low–south-high” meridional see-saw pattern over the East Asian–Western North Pacific sector in July, which is a pivotal circulation pattern responsible for delayed Meiyu termination. Furthermore, the situation is the opposite in response to increased sea ice in these key domains within the Arctic. This study proposes a significant cryospheric forcing indicator for Meiyu cessation over the YHRB, which may provide helpful information for operational forecasting of the withdrawal timing of the Meiyu over the YHRB.

1. Introduction

In China, Meiyu (also known as Baiu in Japan and Changma in Korea) is a famous East Asian sub-tropical rainy season that exhibits pronounced spatiality and seasonality [1,2,3,4,5,6,7,8,9,10,11,12,13,14,15,16]. Spatially, the Meiyu–Baiu–Changma rainbelt extends from central-eastern China to the southern portions of Korea and Japan, featuring a quasi-stationary nature [15,17,18,19,20,21]. Note that this rainbelt is tied to an extended Meiyu–Baiu front (MBF) [5,15,19,22], which can be deemed a typical atmospheric response to the interplay of tropical/sub-tropical climate systems, such as the East Asian summer monsoon and the western North Pacific (WNP) sub-tropical high and mid–high latitude atmospheric circulations (e.g., Eurasian atmospheric blocking) [1,13,15,23,24,25]. Temporally, the onset of the Meiyu season begins in mid-June and terminates in mid-July climatologically, coinciding with the northward advancement of the East Asian summer monsoon into the East Asian sub-tropics along the northwestern flank of the western North Pacific sub-tropical high [1,4,9,15,16,26,27,28].
In China, Meiyu is prominent over the Yangtze–Huaihe River basin (YHRB) [26,29]. A long-lasting Meiyu season can excite highly excessive rainfall along the MBF. Excessive rainfall is likely to increase the frequency of disasters such as floods [30,31], thus causing heavy economic losses. A case in point was the extreme Meiyu period in June–July 2020, during which the gauged precipitation broke the record maintained since 1961 [32]. As such, the derived devastating floods sparked more than 200 casualties and enormous economic losses, greater than RMB 170 billion [33,34]. Considering the huge negative socio-economic impacts exerted by the extreme 2020 Meiyu rainfall, many studies have explored the causes of such an erratic precipitation phenomenon, highlighting the combined roles of internal variability—such as atmospheric tele-connections [35,36], sea surface temperature (SST) forcings from three oceans [21,28,37,38,39,40,41,42,43], cryospheric forcing from the Arctic Ocean [24,25], and anthropogenic aerosol reductions due to the COVID-19 lockdown [44,45]—in sustaining the stable East Asian atmospheric circulation anomalies responsible for the sustained MBF. Hence, the results of the above-mentioned studies could provide helpful references for predicting such aberrant Meiyu rainfall in the future.
Note that except for the earlier onset, the long-lasting duration of Meiyu over the YHRB was also induced by a delayed cessation of Meiyu rainfall [26,32,46]. In this regard, previous studies have investigated potential sources for the prediction of Meiyu onset and cessation. For example, Wang et al. [9] have reported that the warm/cold phase of the central Pacific El Niño–Southern Oscillation in the previous February and spring could lead to late (early) Meiyu onset by means of the Pacific–Japan wave train. Furthermore, Wang et al. [16] suggested that SST warming/cooling over the tropical Arabian Sea in June can exert a faraway influence on the delayed Meiyu cessation date through the forcing of an East Asian coastal “north-low–south-high” meridional see-saw pattern, which resembled the Pacific–Japan pattern [47,48]. To date, compared to the Meiyu onset over the YHRB, existing studies have paid relatively limited attention to sources for Meiyu cessation prediction [16], especially possible sources from the Arctic. Existing studies corroborated that the reduced/increased Arctic Sea ice can significantly induce Eurasian climate anomalies by forcing large-scale Rossby waves and/or modulating critical systems such as the Arctic polar vortex and the East Asian trough [24,49,50,51,52,53]. As for the Meiyu rainfall, a recent study by Chen et al. [24] reported that the low Arctic Sea ice cover in late spring–early summer of 2020 along the Siberian coast was an important indicator responsible for the 2020 record-breaking Meiyu–Baiu rainfall. However, discussions regarding whether and how Arctic Sea ice anomalies modulate Meiyu cessation over the specific YHRB domain remain insufficient to date, partially owing to the fact that such discussions mainly concentrated on how anomalous Arctic Sea ice induced anomalies in the Meiyu–Baiu rainfall or the summertime rainfall in China, paying little attention to its connection with the cessation of Meiyu. In the current study, it is identified that the negative/positive early spring sea ice area (SIA) anomalies to the north of the Chukchi and Beaufort Seas, as well as SIA anomalies to the north of the Queen Elizabeth Islands, were conducive to delayed/advanced YHRB Meiyu cessation. Such findings facilitate a novel understanding of the modulatory role of early spring Arctic climate anomalies in influencing Meiyu cessation variability, which can help to predict and mitigate early summer water hazards in the YHRB.
The remainder of this paper is structured as follows: Section 2 describes the data and methods used in this study. Section 3 presents the circulation background tied to the cessation of Meiyu, as well as the relationship between the YHRB Meiyu cessation and early spring Arctic Sea ice on the inter-annual timescale, followed by the physical mechanisms underlying their linkage. Section 4 presents brief conclusions and further discussions.

2. Data and Methods

2.1. Data

1. The Meiyu withdrawal dates (MWDs) in the YHRB for the period 1980–2016 were obtained from Wang et al. [16] (cf. their Table 1). According to Zhou [26], the YHRB Meiyu termination criteria are formulated as follows: (1) Ridge position of the WNP sub-tropical high at 120° E ≥ 27° N (or mean positions of 5880 gpm isoline at 115° E, 120° E, and 125° E ≥ 31° N); and (2) −8 °C isothermal at 120° E ≥ 40° N at 500 hPa. Such criteria suggest the northward jump of the high-pressure system over the WNP, thus terminating the YHRB Meiyu season with strikingly high temperatures. Note that the MWDs delineate profound year-to-year variations with almost no linear trend, with the average MWD occurring approximately on 13 July [16].
2. The monthly mean atmospheric re-analysis data were provided by the National Centers for Environmental Prediction (NCEP)–National Center for Atmospheric Research (NCAR) Re-analysis I (NCEP/NCAR; horizontal resolution: 2.5° × 2.5°) [54] for the 1980–2016 period.
3. The monthly mean outgoing long-wave radiation (OLR) data were obtained from the National Oceanic and Atmospheric Administration (NOAA) for the 1980–2016 period, with a horizontal resolution of 2.5° × 2.5° [55].
4. The monthly mean precipitation data were derived from the Climate Prediction Center Merged Analysis of Precipitation data (CMAP; horizontal resolution: 2.5° × 2.5°) [56] for the 1980–2016 period.
5. The monthly mean sea ice concentration (SIC) data were downloaded from the Met Office Hadley Centre Sea Ice and SST data set (HadISST; horizontal resolution: 1.0° × 1.0°) [57] for the 1980–2016 period. Following Han et al. [53], the SIA was used, which indicates the product of SIC by the corresponding grid area.
6. The numerical model experimental data were obtained from the Community Earth System Model Large Ensemble Numerical Simulation data sets (CESM-LENS; horizontal resolution: 0.9° × 1.25°), completed at NCAR [58]. In this study, following the approach employed in previous studies [59,60], the ensemble mean results among the 35 ensemble members of CESM-LENS were analyzed. All of the members were imposed with the same radiative forcing but initiated from different tiny perturbations of atmospheric states. This study focused on the historical simulation period of 1920–2005. The variables used include SIC and the geopotential height.

2.2. Methodology

The vertically integrated horizontal water vapor transport (<WVT>) and its divergence (<WVT_div>) were calculated as:
WVT = 1 g P s 300 q V d p ,
WVT _ div = 1 g P s 300 p ( q V ) d p ,
where g is the gravitational acceleration, Ps is the surface pressure, q is the specific humidity, V = (u, v) is the horizontal wind vector (u and v represent the zonal and meridional wind, respectively), and p ( ) denotes the horizontal divergence in the pressure coordinates.
Following the approach of Wang et al. [16], the vertically-integrated meridional moist static energy (Es for simplicity) flux <vEs> was computed as
v E s = 1000 300 v ( C p T + g z + L q ) d p ,
where Cp is the specific heat at constant pressures of dry air, T is the temperature, z is the height above the surface, and L is the latent heat of the condensation.
The Rossby wave source (RWS) can be calculated as follows [61]:
RWS = [ V χ ( ζ + f ) ] ,
where V χ is the divergent wind, ζ is the relative vorticity, and f is the planetary vorticity.
The wave activity flux (WAF) was used to examine the propagation of stationary Rossby waves [62], which can be calculated based on the following formula:
WAF = P 2 | U ¯ | [ u ¯ ( ψ x 2 - ψ ψ x x ) + v ¯ ( ψ x ψ y - ψ ψ x y ) u ¯ ( ψ x ψ y - ψ ψ x y ) + v ¯ ( ψ y 2 - ψ ψ y y ) ] ,
where ψ is the perturbation stream function, | U ¯ | is the horizontal wind speed, u ¯ ( v ¯ ) is the zonal (meridional) component of the basic flow, and P is the pressure divided by 1000 hPa.
This study used the term early spring to denote the period of March–April (MA), early summer to refer to May–June (MJ), and mid-summer to refer to July. According to previous studies [14,16,63], this study focused on examining how early spring Arctic SIA anomalies modulate July-associated circulation anomalies, which coincide by and large with the sub-seasonal variation range of the MWDs over the YHRB. Thus, July-mean atmospheric patterns associated with the inter-annual variability of the MWD over the YHRB were considered to be simultaneous patterns associated with Meiyu cessation. To focus on the inter-annual relationship between the YHRB Meiyu cessation and early spring Arctic Sea ice, long-term trends in the variables were removed beforehand [52,64]. The two-tailed Student’s t-test was conducted for assessment of the statistical significance. The basic flow chart of the methodology is shown in Figure 1.

3. Results

3.1. Circulation Background Tied to the Interannual Meiyu Cessation

Before discussing the connection between the inter-annual variations of YHRB Meiyu cessation and the early spring Arctic Sea ice, it is first essential to scrutinize the circulation background tied to the cessation of the Meiyu. Figure 2 plots the July-mean MWD-regressed circulation patterns at different levels. For later-than-normal MWD years, a clear meridional dipolar pattern dominating areas over the East Asian–WNP sector at the lower level can be discerned (Figure 2c), with an anomalous anticyclonic circulation with the center to the south of Japan and a cyclonic anomaly centered over the Korean Peninsula, inclining along the northwest–southeast direction. This see-saw pattern is also prominent in the middle troposphere (Figure 2b), delineating a quasi-barotropic structure. Note that, compared to its lower-level counterpart, the mid-tropospheric cyclonic anomaly tends to enhance its spatial coverage, with quite significant negative 500 hPa geopotential height (Z500) anomalies. Meantime, in association with the above-mentioned see-saw pattern, significant positive 200 hPa zonal wind (U200) anomalies dominating areas around the YHRB region can be observed (Figure 2a), which facilitate the southward displacement of the upper-level tropospheric East Asian westerly jet, thereby enhancing in situ zonal wind shear anomalies [16,43,65]. Under this circulation background, more heat and moisture along the northwestern flank of the western North Pacific sub-tropical high can be transported into the YHRB region, converging with more relatively cold and dry air advected by the cyclonic circulation centered over Korea (Figure 3a). As such, ascending motion anomalies tend to appear over the YHRB and its surroundings (figure not shown), favoring enhanced convective instability [37] and, thus, contributing to the increased rainfall over the YHRB. The aforementioned circulation background corresponds to a stable “north-low–south high” meridional see-saw pattern over the East Asian–WNP sector, suggesting a southward extension of the high-pressure system, which hampers the adjustments of large-scale circulations that are conducive to the termination of Meiyu [16,26,43].
Evidence of regional-scale atmospheric responses (i.e., rainfall/OLR anomalies; Figure 3b,c) vindicates the aforementioned modulation of atmospheric circulation. It can be seen that rainfall and OLR anomalies correspond well to the <WVT_div> anomalies (Figure 3a). The significant convergence of westerly/southwesterly <WVT> anomalies and northwesterly <WVT> anomalies induces an anomalous zonal-extended MBF stretching from the YHRB to central Japan, with negative OLR/positive precipitation in situ (Figure 3b,c). In addition, extensive anomalies of positive OLR and negative precipitation can be found over the WNP, forming the northwest–southeast dipole OLR/rainfall pattern (Figure 3b,c), which highly corresponds to the circulation patterns and integrated WVT pattern over the East Asian–WNP sector, as shown in Figure 2b,c and Figure 3a, respectively.
Furthermore, it should be noted that the circulation background and atmospheric responses during earlier-than-normal MWD years highly mirror those during later-than-normal MWD years [16]. As such, for the convenience of analysis, this study explores the physical mechanisms through which early spring Arctic Sea ice regulates the delayed Meiyu cessation over the YHRB in the following subsections: the circumstances are simply the opposite in the case of earlier Meiyu retreat.

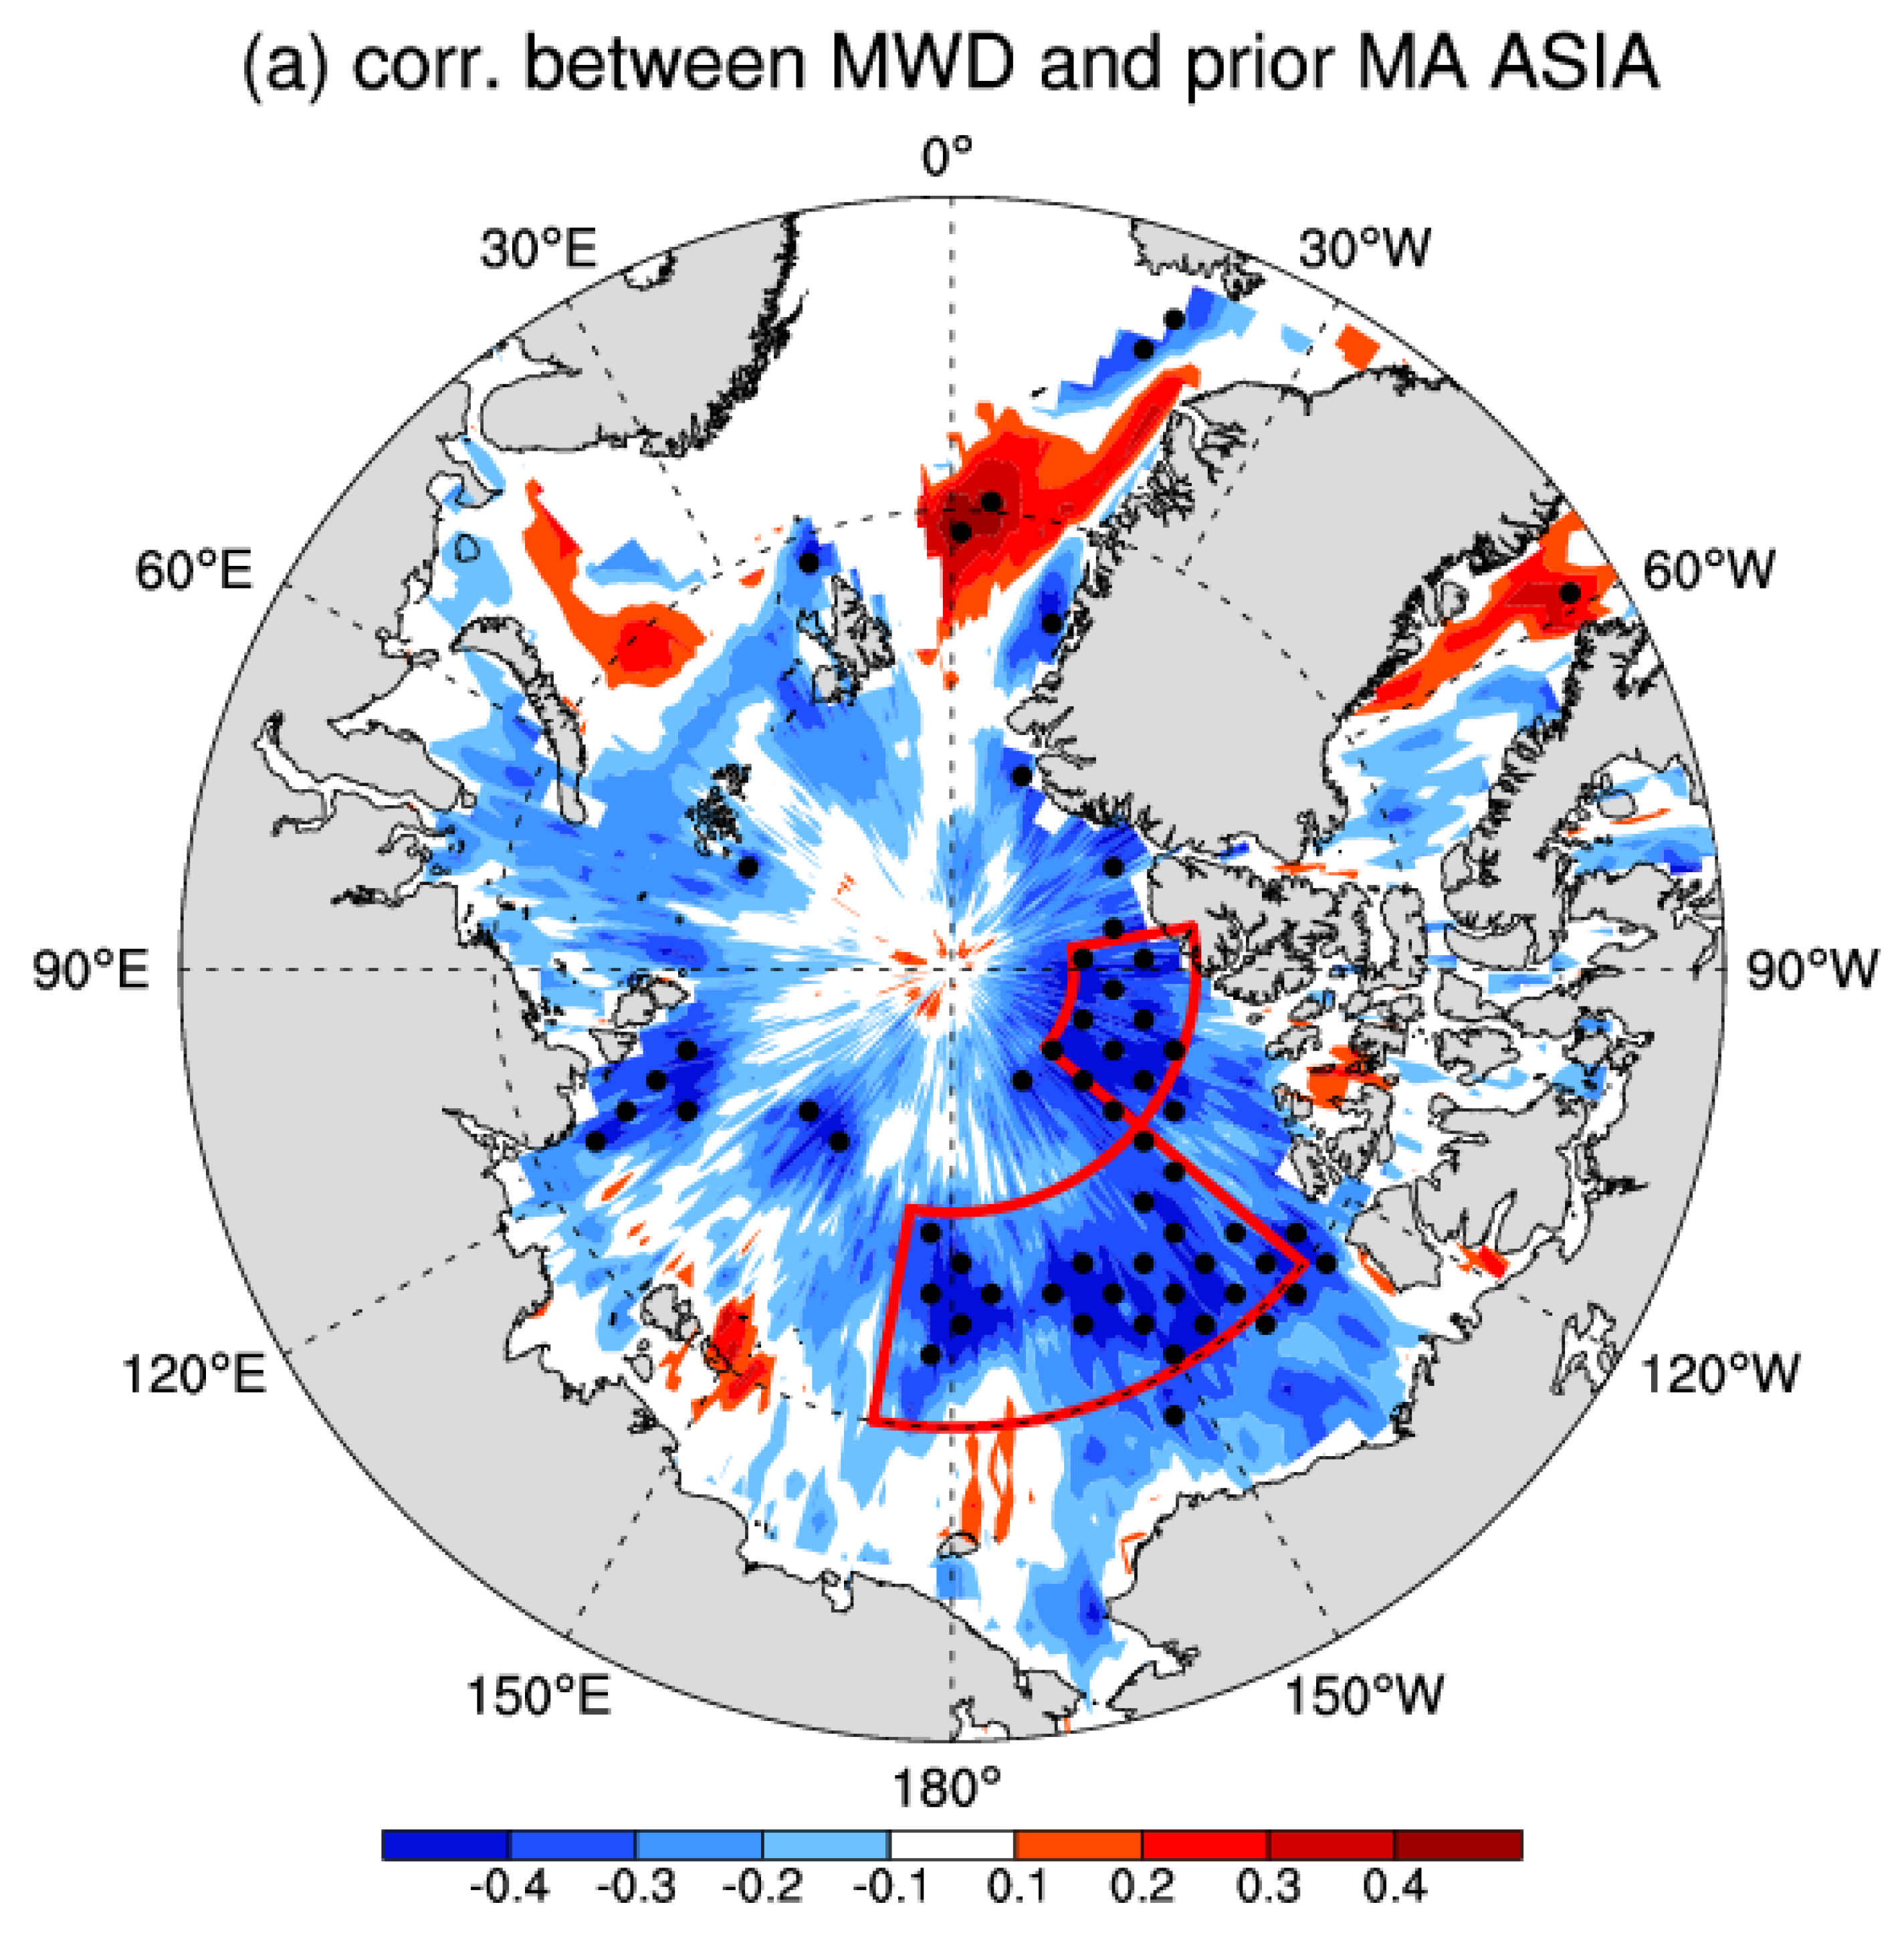
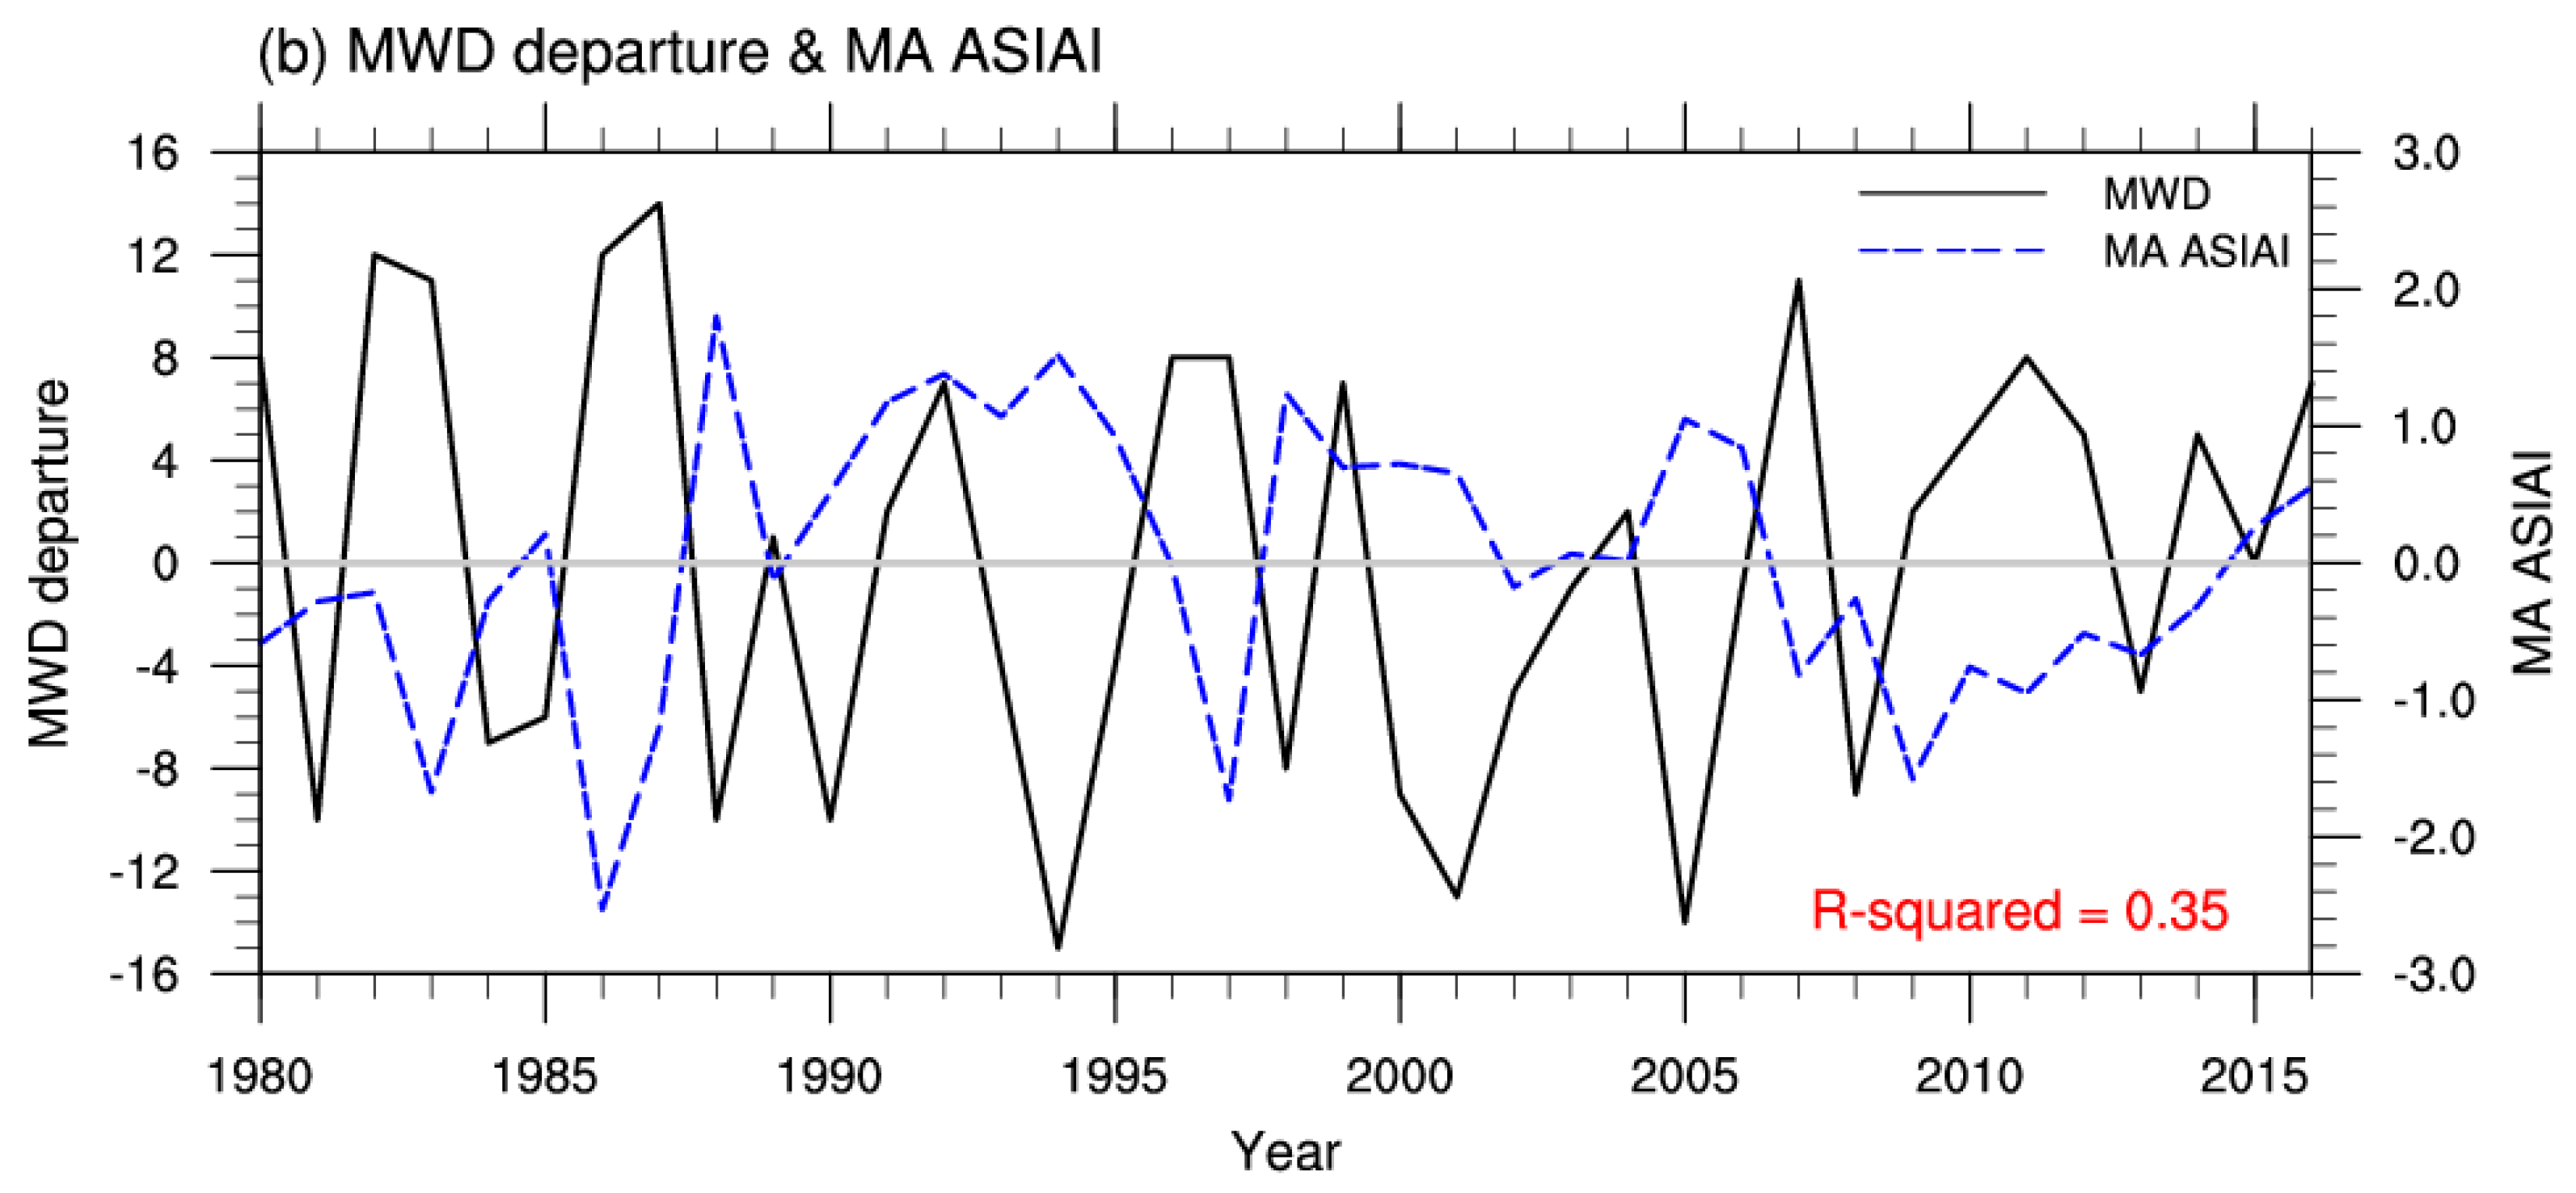
3.2. Relationship between Inter-Annual Variations of Meiyu Cessation and Early Spring Arctic Sea Ice

Figure 4a presents the temporal correlation coefficients (TCCs) between the time-series of MWDs and the Arctic SIA in the previous early spring for the period 1980–2016. Significant negative TCCs over areas to the north of the Chukchi and Beaufort Seas, as well as areas to the north of the Queen Elizabeth Islands (75° N–82° N, 170° E–130° W and 82° N–86° N, 130° W–80° W, respectively), can be observed. To quantitatively describe their correlation, this study firstly defined an Arctic SIA index (ASIAI) as the weighted areal mean SIA over the above key Arctic Sea ice domains (red frames in Figure 4a) in early spring. As exhibited in Figure 4b, the temporal variations in MWDs and MA-mean ASIAI were considerably coincident, with a TCC-squared (i.e., determination coefficient) value of 0.35, exceeding the 99% confidence level. Note that the TCCs between MWDs and May-mean ASIAI decreased obviously (figure not shown). The above correlation analysis suggests that delayed YHRB Meiyu cessation is significantly preceded by diminished early spring SIA over the key Arctic Sea ice domains. Furthermore, our proposed ASIAI performs well in terms of capturing years with extreme values of delayed MWDs, such as 1983 and 1986 (Figure 4b).
To further examine the role of negative SIA anomalies in modulating the delayed Meiyu cessation, circulation anomalies regressed onto the antecedent negative MA-mean ASIAI were plotted (Figure 5). It can be clearly observed that the large-scale atmospheric patterns over the East Asian-WNP sector bear a strong resemblance to those tied to the delayed YHRB Meiyu cessation, including the significantly anomalous positive U200 belt (Figure 5a) and the quasi-barotropic “north-low–south-high” dipolar pattern (Figure 5b,c). Such circulation features indicate that the atmospheric conditions in the midsummer following decreased SIA anomalies in the key Arctic domains in early spring are favorable for delayed Meiyu termination, which could be verified in terms of convergence of the westerly/southwesterly and northwesterly <WVT> anomalies (Figure 6a), under the guidance of the above see-saw pattern and positive U200 anomalies (i.e., the southward shift of the East Asian westerly jet). As a result, an anomalous elongated MBF with positive rainfall/negative OLR appears over the YHRB (Figure 6b,c), maintaining the Meiyu season and, therefore, inducing the delayed Meiyu cessation. It is worth noting that, although the above negative ASIAI-associated patterns illustrate certain disparities of position/magnitude in comparison with those MWD-regressed ones (Figure 2 and Figure 3), they may still significantly affect the inter-annual Meiyu cessation.
In summary, the above results demonstrate that the preceding early spring sea ice changes in areas to the north of the Chukchi Sea and Seas and areas to the north of the Queen Elizabeth Islands exhibit a significant contribution to the inter-annual Meiyu cessation over the YHRB, which is characterized by negative SIA anomalies followed by delayed Meiyu cessation, and vice versa. The decreased MA SIA may affect the Meiyu cessation by regulating large-scale atmospheric circulations over the East Asian–WNP in the ensuing mid-summer, which, in turn, trigger an enhanced MBF to hinder the termination of the Meiyu season. As a consequence, the Meiyu withdrawal occurs later. The remote forcing role of a low SIA phase in the modulation of the delayed Meiyu cessation will be discussed in Section 3.3.

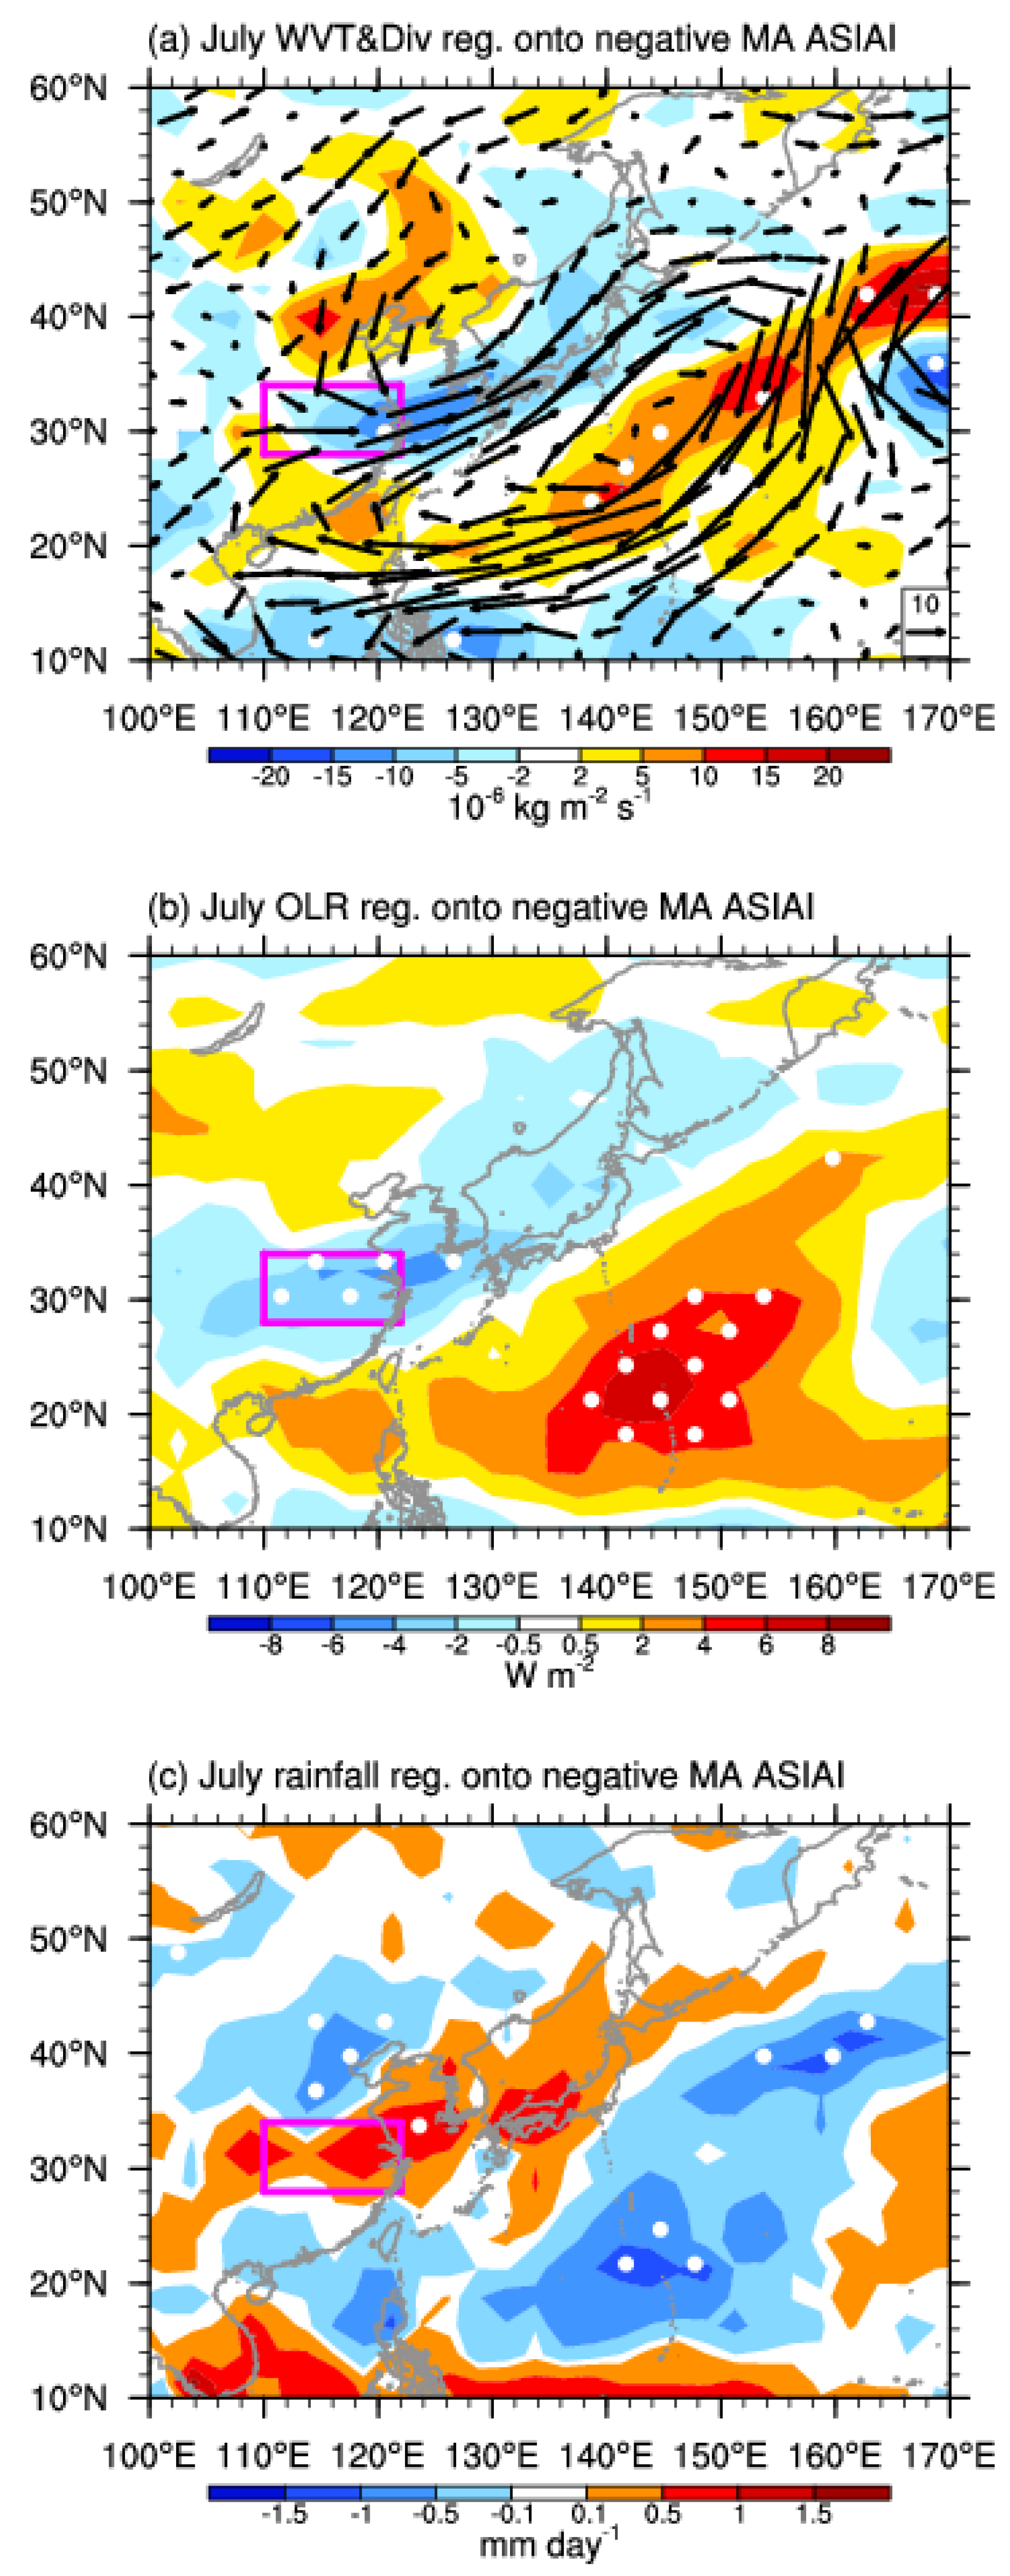
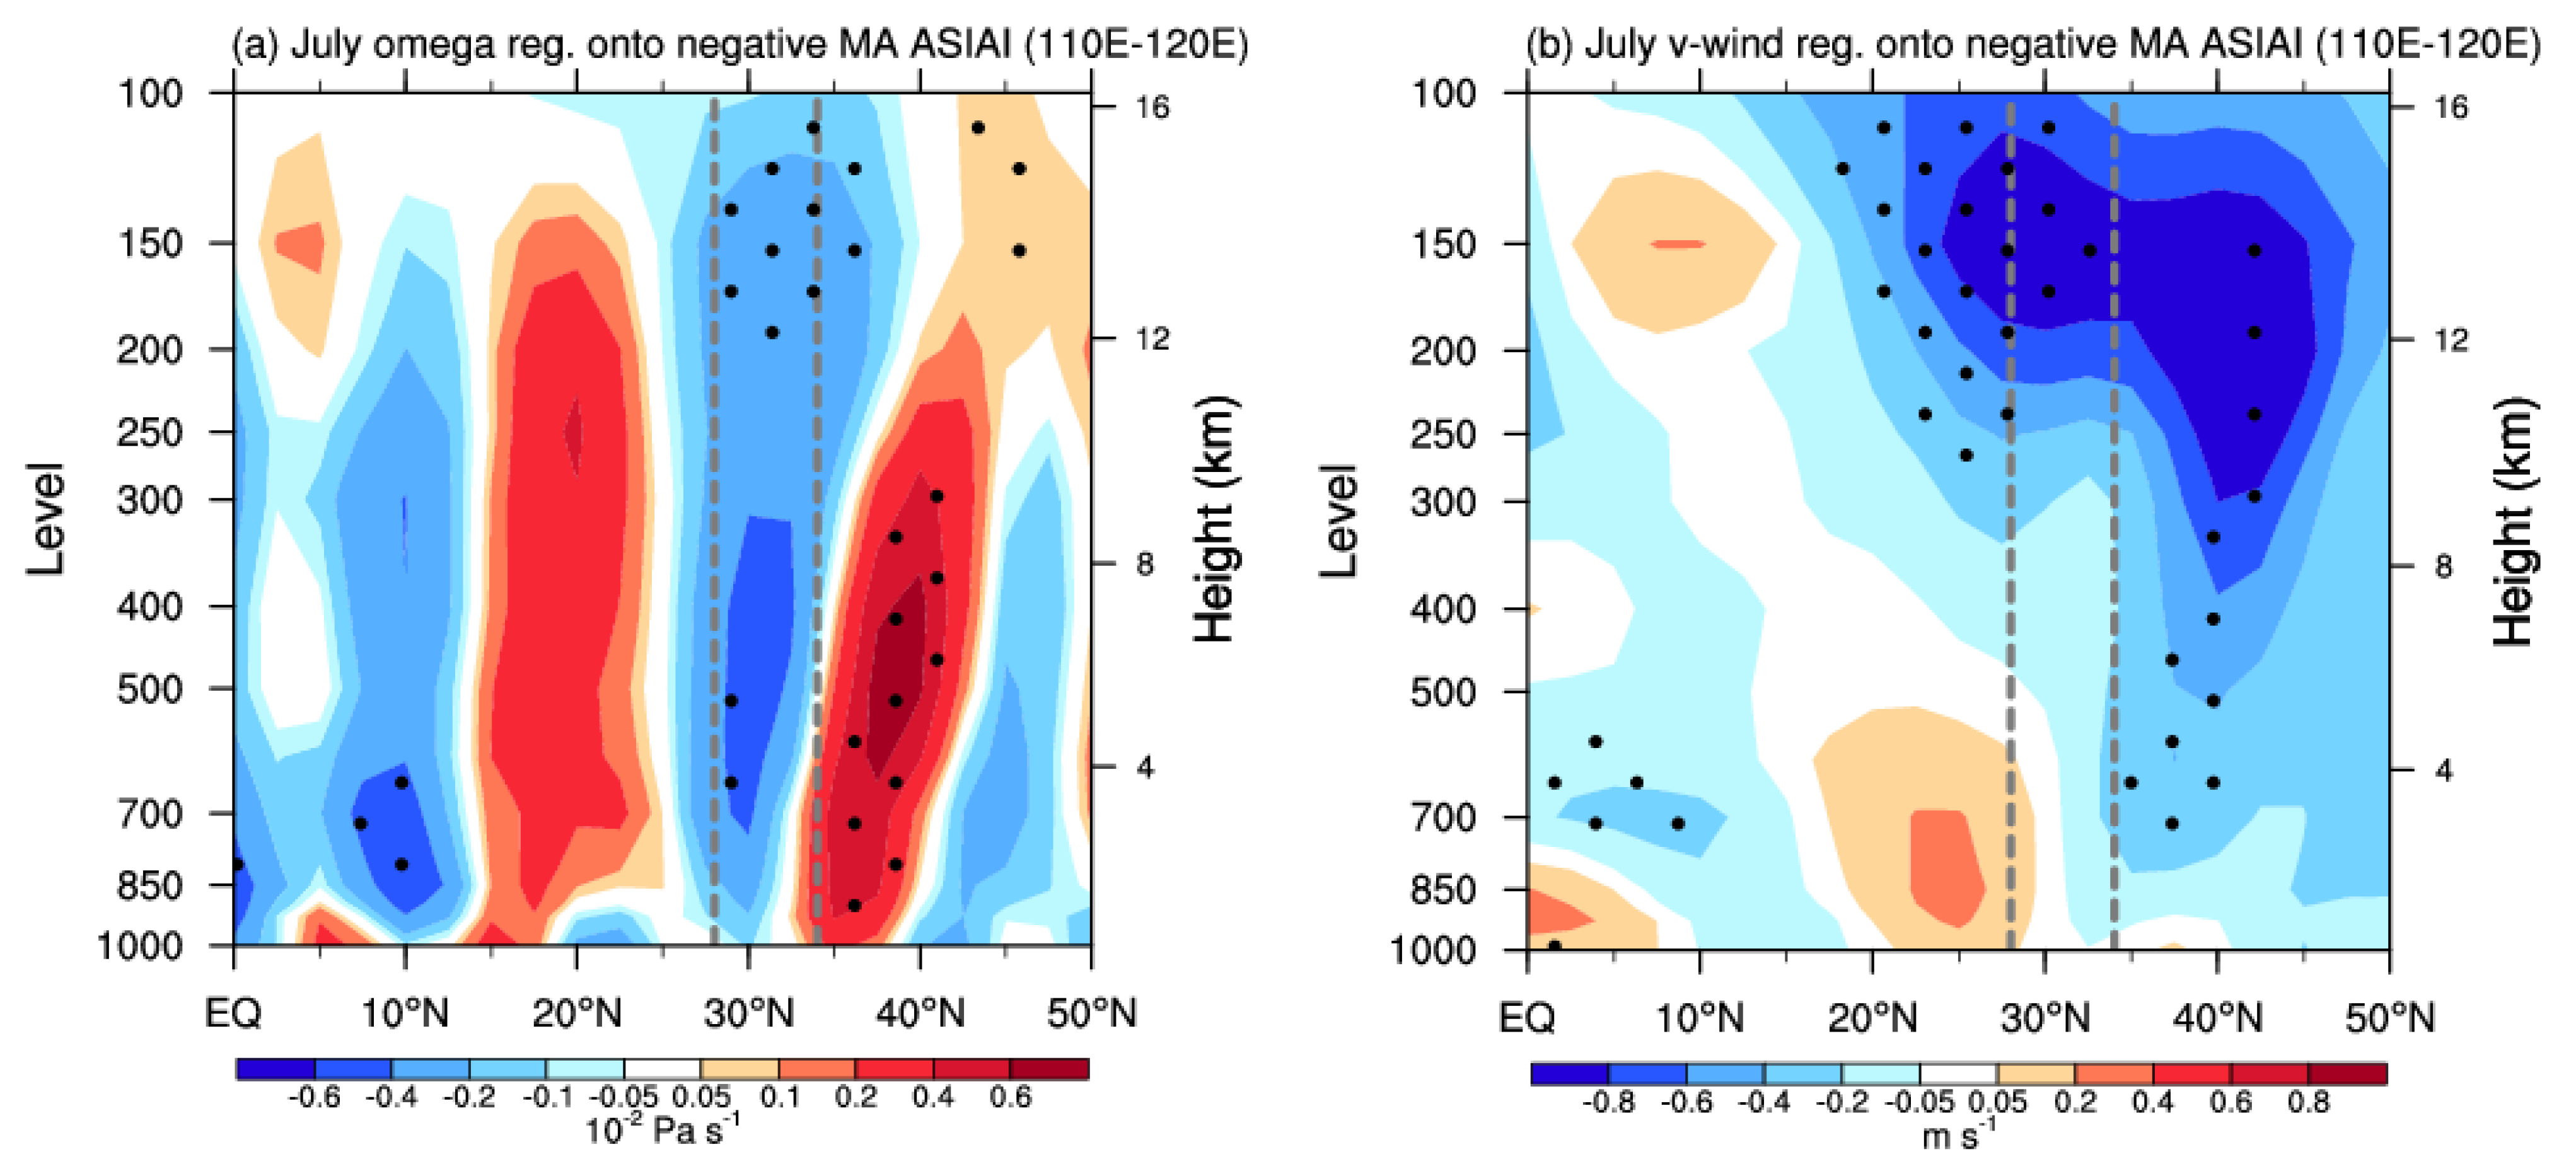
3.3. Underlying Physical Pathway of How Early Spring Arctic Sea Ice Modulates Meiyu Cessation

To reveal the modulation effect of the early spring SIA anomalies over the key Arctic domains on the delayed Meiyu cessation, dynamical processes tied to a low SIA phase are further examined, which may play fundamental roles in sustaining the Meiyu distribution. Figure 7a shows the July-mean regressed vertical motion anomalies with respect to the negative MA-mean ASIAI. With a low SIA phase, significant ascending motion anomalies appear over the YHRB, providing essential localized dynamical conditions to maintain Meiyu precipitation. Additionally, downward motion anomalies appearing to the north of the YHRB can be observed, forming a clear meridional overturning circulation (Figure 7a). Such overturning circulation could reflect the confrontation of anomalous northward warm, moist southerly airflows and southward cold, dry northerly airflows over the YHRB (Figure 7b), sustaining the quasi-barotropic “north-low–south-high” meridional see-saw pattern over the East Asian–WNP sector in July, as shown in Figure 5 and Figure 6. Note that when the early spring SIA is higher than normal, the northerly airflow anomalies are much more strengthened and predominant. In this case, the significant southward negative <vEs> anomalies are found to be centered over the Bohai Gulf, confronting the northward positive <vEs> anomalies prevailing over southern China and the northern South China Sea in the following mid-summer (Figure 8a). This confrontation may excite a pronounced and stable zonally oriented MBF belt (Figure 8b; characterized by intense absolute 850 hPa meridional equivalent potential temperature gradient [16,19]). Furthermore, the previous low SIA phase corresponds to positive vertical zonal wind shear anomalies around the YHRB in July (Figure 8c), suggesting a southward-shifted and enhanced East Asian westerly jet, which is connected to the anomalous positive U200 belt (Figure 5a). The above dynamical conditions can jointly hamper the northward advancement of the East Asian summer monsoon into northern China, thus pushing the Meiyu rainband southward and anchoring it over the YHRB, which may trigger a delayed withdrawal of the Meiyu season accordingly.
Naturally, one may wish to understand the physical pathway through which a decreased MA SIA over the remote key Arctic domains can exert a lag modulation effect on the Meiyu cessation. To address this question, the TCCs between the early spring ASIAI and the subsequent Arctic SIA were first determined (Figure 9) with the aim of evaluating the seasonal persistence of SIA anomalies in the key Arctic domains. It can be noticeably identified that the SIA anomalies over the two key frames show significant persistence from early spring to early summer (left figure of Figure 9). Previous studies have reported that persistent negative SIA anomalies over Arctic areas can allow more in situ open-water surfaces to absorb more solar radiation [24,25], thus enhancing upward turbulent heat flux from the ocean to the overlying atmosphere [53]. Consequently, from the above results, the negative early spring SIA anomalies over the key Arctic domains could exert a persistent warming effect on the underlying air column until the following early summer, which may exert a lag impact on the ensuing mid-summer precipitation through modulating atmospheric circulations over the East Asian area by tele-connections [49,50]. To verify this assertion, localized anomalies of 300 hPa RWS and associated divergent winds, as well as planetary-scale WAF propagation tied to negative MA-mean ASIAI, are presented in Figure 10 and Figure 11. It can be identified that, although the early spring SIA anomalies over the two key frames may not persist into the following mid-summer (right figure of Figure 9), they can still remotely modulate the Meiyu cessation-associated circulation patterns, according to Figure 10 and Figure 11. As shown in Figure 10, significant upper-tropospheric negative RWS anomalies with anomalous divergent winds (which can be triggered by a low SIA phase) are located over areas to the northwest of the Chukchi Sea at approximately 165° E–180° E. In addition, positive RWS anomalies with anomalous confluent winds also located to the east, at approximately 150° E–135° W, were also observed. The advection of vorticity by divergent winds acts as the RWS [61], forcing a distinct planetary-scale Rossby wave-like pattern, which emanates over areas to the northwest of the Chukchi Sea with alternating anticyclonic and cyclonic circulation anomalies, propagating eastward and then shifting south-eastward all the way into the Asian regions near 60° N, 30° W, thus transmitting the influence of faraway negative SIA anomalies in the key Arctic Sea ice domains into the downstream East Asian–WNP through an arc-shaped far-reaching atmospheric wave-like tele-connected pattern (Figure 11). In this circumstance, cold, dry polar air can be brought into the middle latitudes, sustaining the “north-low–south-high” dipolar pattern. As a response, YHRB Meiyu cessation is delayed.

4. Conclusions and Discussions

4.1. Conclusions

In this study, the circulation background connected to the inter-annual variation characteristics of the YHRB Meiyu cessation was studied, and the potential mechanism from the perspective of Arctic Sea ice anomalies was revealed. Our major findings can be summarized as follows:
1. A quasi-barotropic “north-low–south high” meridional see-saw pattern over the East Asian–WNP sector is critical for a delayed YHRB Meiyu cessation, featuring ascending motion anomalies with anomalies of negative OLR/positive rainfall over the YHRB.
2. This study identified a significant out-of-phase relationship between the Meiyu cessation and the preceding early spring SIA anomalies in areas to the north of the Chukchi and Beaufort Seas, as well as SIA anomalies in areas to the north of the Queen Elizabeth Islands, which can be deemed key Arctic Sea ice domains. Negative MA SIA anomalies over these key Arctic domains are followed by a delayed YHRB Meiyu cessation.
3. Potential physical mechanisms regarding the modulation effect of the SIA anomalies were proposed. Early spring SIA anomalies in the above key domains show significant persistence from early spring to early summer, which are sufficient to remotely modulate the Meiyu cessation-associated circulation patterns in mid-summer. More specifically, a low SIA phase can force a distinct planetary-scale Rossby wave-like pattern emanating over areas to the northwest of the Chukchi Sea, propagating eastward and then shifting southeastward all the way into the Asian regions, thus transmitting the influence of negative SIA anomalies in the key domains into the East Asian–WNP though an arc-shaped far-reaching tele-connection. As such, the quasi-barotropic “north-low–south-high” meridional see-saw pattern over the East Asian–WNP sector in July, which is the corresponding crucial circulation pattern responsible for the delayed YHRB Meiyu termination, can be sustained.

4.2. Discussions

To further lend credence to the possible linkage between the MA negative SIA anomalies in the key Arctic domains and the subsequent YHRB Meiyu cessation, results from the CESM-LENS were considered in order to verify whether historical CESM-LENS data can reveal their relationship. Figure 12 presents the composite Z500 difference for the ensemble mean of the 35 CESM-LENS members in July between the five lowest and highest MA-mean ASIAI years during 1920–2005. The simulations reveal the critical “north-low–south-high” meridional dipole pattern over the East Asian–WNP sector, and, although there existed a certain bias regarding the simulated positions of the dipole pattern, the proposed process regarding how early spring SIA anomalies in the key Arctic domains modulate the subsequent YHRB Meiyu termination could be generally verified. The main bias is that the simulated pattern was shifted more northward, compared to its observational counterpart (see Figure 5b and Figure 12), with the negative Z500 center covering the Sea of Okhotsk and the positive Z500 center dominating areas to the south of Japan. Note that such a similar northward shift phenomenon has also been described in the work of Xu et al. [52], who suggested the salient impact of reduced sea ice in the Barents and Kara Seas on the variation of the East Asian trough in late winter through the use of another NCAR-series model (i.e., the Whole Atmosphere Community Climate Model) [52]. Consequently, it can be inferred that there may be intrinsic systematic biases regarding the simulated positions of the atmospheric anomalies over the East Asian–WNP sector. The pathway by which SIA anomalies in the key Arctic domains influence the East Asian atmospheric circulations proposed in this study requires justification in future research.
Furthermore, it is necessary to evaluate the performance of the SIA anomalies in the key Arctic domains. It is noted that both of the MWDs over the YHRB in 2019 and 2020 were on 21 July, corresponding to a delayed Meiyu cessation [16]. Fortunately, noticeable negative SIA anomalies were observed over the key Arctic domains in 2019 and 2020 (Figure 13), which may suggest the good performance of negative SIA anomalies in predicting delayed YHRB Meiyu cessation.

Author Contributions

J.W.: Conceptualization, Writing—Original Draft, Resources, Formal analysis, Validation; N.F.: Investigation, Methodology, Funding acquisition, Project administration, Writing—Review & Editing; P.L.: Investigation, Methodology, Funding acquisition, Writing—Review & Editing; M.L.: Writing—Review & Editing. All authors have read and agreed to the published version of the manuscript.

Funding

This work is supported by the National Key R&D Program of China (2020YFB1600103), National Natural Science Foundation of China (42175056, 41790471), Natural Science Foundation of Shanghai (21ZR1457600), and China Meteorological Administration Innovation and Development Project (CXFZ2022J009).

Institutional Review Board Statement

Not applicable.

Informed Consent Statement

Not applicable.

Data Availability Statement

NCEP/NCAR reanalysis data are openly available at https://psl.noaa.gov/data/gridded/data.ncep.reanalysis.html (accessed on 2 May 2022). NOAA OLR data are available online at https://psl.noaa.gov/data/gridded/data.olrcdr.interp.html (accessed on 2 May 2022). CMAP data are available online at https://psl.noaa.gov/data/gridded/data.cmap.html (accessed on 2 May 2022). HadISST data were downloaded from https://www.metoffice.gov.uk/hadobs/hadisst/ (accessed on 2 May 2022). The CESM1 large ensemble simulations are available online at https://www.earthsystemgrid.org/dataset/ucar.cgd.ccsm4.cesmLE.html (accessed on 2 May 2022).

Conflicts of Interest

The authors declare no conflict of interest.

References

  1. Tao, S.; Chen, L. A Review of Recent Research on the East Asian Summer Monsoon in China. Monsoon Meteorology; Chang, C.-P., Krishnamurti, T.N., Eds.; Oxford University Press: New York, NY, USA, 1987; pp. 60–92. [Google Scholar]
  2. Lau, K.M.; Yang, G.J.; Shen, S.H. Seasonal and intraseasonal climatology of summer monsoon rainfall over East Asia. Mon. Weather. Rev. 1988, 116, 18–37. [Google Scholar] [CrossRef]
  3. Enomoto, T.; Hoskins, B.J.; Matsuda, Y. The formation mechanism of the Bonin high in August. Q. J. R. Meteorol. Soc. 2003, 129, 157–178. [Google Scholar] [CrossRef]
  4. Ding, Y.; Chan, J.C.L. The East Asian summer monsoon: An overview. Meteorol. Atmos. Phys. 2005, 89, 117–142. [Google Scholar] [CrossRef]
  5. Ninomiya, K.; Shibagaki, Y. Multi-scale features of the Meiyu-Baiu front and associated precipitation systems. J. Meteorol. Soc. Jpn. 2007, 85, 103–122. [Google Scholar] [CrossRef]
  6. Ding, Y.; Wang, Z. A study of rainy seasons in China. Meteorol. Atmos. Phys. 2008, 100, 121–138. [Google Scholar] [CrossRef]
  7. Ding, Y.; Wang, Z.; Sun, Y. Inter-decadal variation of the summer precipitation in East China and its association with decreasing Asian summer monsoon. Part I: Observed evidences. Int. J. Climatol. 2008, 28, 1139–1161. [Google Scholar] [CrossRef]
  8. Ding, Y.; Sun, Y.; Wang, Z.; Zhu, Y.; Song, Y. Inter-decadal variation of the summer precipitation in China and its association with decreasing Asian summer monsoon Part II: Possible causes. Int. J. Climatol. 2009, 29, 1926–1944. [Google Scholar] [CrossRef]
  9. Wang, J.; He, J.; Liu, X.; Wu, B. Interannual variability of the Meiyu onset over Yangtze-Huaihe River Valley and analyses of its previous strong influence signal. Chin. Sci. Bull. 2009, 54, 687–695. [Google Scholar] [CrossRef]
  10. Kosaka, Y.; Xie, S.P.; Nakamura, H. Dynamics of interannual variability in summer precipitation over East Asia. J. Clim. 2011, 24, 5435–5453. [Google Scholar] [CrossRef]
  11. Choi, K.S.; Kang, S.D.; Kim, H.D. Multiple linear regression model for the prediction of Changma onset date in Korea. Int. J. Climatol. 2014, 34, 1000–1010. [Google Scholar] [CrossRef]
  12. Choi, J.W.; Lee, J.S.; Moon, I.J. Second Changma retreat variability in Korea using the available water resources index and relevant large-scale atmospheric circulation. Int. J. Climatol. 2016, 36, 2273–2287. [Google Scholar] [CrossRef]
  13. Chiang, J.C.H.; Kong, W.; Wu, C.H.; Battisti, D.S. Origins of East Asian summer monsoon seasonality. J. Clim. 2020, 33, 7945–7965. [Google Scholar] [CrossRef]
  14. Choi, J.W.; Kim, H.D.; Wang, B. Interdecadal variation of Changma (Korean summer monsoon rainy season) retreat date in Korea. Int. J. Climatol. 2020, 40, 1348–1360. [Google Scholar] [CrossRef]
  15. Ding, Y.; Liang, P.; Liu, Y.; Zhang, Y. Multiscale variability of Meiyu and its prediction: A new review. J. Geophys. Res. Atmos. 2020, 125, e2019JD031496. [Google Scholar] [CrossRef]
  16. Wang, J.; Liu, Y.; Ding, Y.; Wu, Z. Towards influence of Arabian Sea SST anomalies on the withdrawal date of Meiyu over the Yangtze-Huaihe River basin. Atmos. Res. 2021, 249, 105340. [Google Scholar] [CrossRef]
  17. Ninomiya, K.; Akiyama, T. Multi-scale features of Baiu, the summer monsoon over Japan and the East Asia. J. Meteorol. Soc. Japan. Ser. II 1992, 70, 467–495. [Google Scholar] [CrossRef]
  18. Sampe, T.; Xie, S.P. Large-scale dynamics of the Meiyu-Baiu rainband: Environmental forcing by the westerly jet. J. Clim. 2010, 23, 113–134. [Google Scholar] [CrossRef]
  19. Li, Y.; Deng, Y.; Yang, S.; Zhang, H. Multi-scale temporospatial variability of the East Asian Meiyu-Baiu fronts: Characterization with a suite of new objective indices. Clim. Dyn. 2018, 51, 1659–1670. [Google Scholar] [CrossRef]
  20. Yao, Y.; Lin, H.; Wu, Q. Linkage between interannual variation of the East Asian intraseasonal oscillation and Mei-Yu onset. J. Clim. 2018, 32, 145–160. [Google Scholar] [CrossRef]
  21. Ding, Y.; Liu, Y.; Hu, Z.Z. The record-breaking Mei-Yu in 2020 and associated atmospheric circulation and tropical SST anomalies. Adv. Atmos. Sci. 2021, 38, 1980–1993. [Google Scholar] [CrossRef]
  22. Guan, P.; Chen, G.; Zeng, W.; Liu, Q. Corridors of Mei-Yu-season rainfall over eastern China. J. Clim. 2020, 33, 2603–2626. [Google Scholar] [CrossRef]
  23. Ding, Y. Summer monsoon rainfalls in China. J. Meteorol. Soc. Jpn. 1992, 70, 373–396. [Google Scholar] [CrossRef]
  24. Chen, X.; Dai, A.; Wen, Z.; Song, Y. Contributions of Arctic Sea ice loss and East Siberian atmospheric blocking to 2020 record-breaking Meiyu-Baiu rainfall. Geophys. Res. Lett. 2021, 48, e2021GL092748. [Google Scholar] [CrossRef]
  25. Chen, X.; Wen, Z.; Song, Y.; Guo, Y. Causes of extreme 2020 Meiyu-Baiu rainfall: A study of combined effect of Indian Ocean and Arctic. Clim. Dyn. 2022, 1–17. [Google Scholar] [CrossRef]
  26. Zhou, Z.K. Analyses and Prediction of Meiyu in Yangtze-Huaihe River Valley; Meteorological Press: Beijing, China, 2006; pp. 1–184. (In Chinese) [Google Scholar]
  27. Zhang, R.; Min, Q.; Su, J. Impact of El Niño on atmospheric circulations over East Asia and rainfall in China: Role of the anomalous western North Pacific anticyclone. Sci. China Earth Sci. 2017, 60, 1124–1132. [Google Scholar] [CrossRef]
  28. Zhou, Z.Q.; Xie, S.P.; Zhang, R. Historic Yangtze flooding of 2020 tied to extreme Indian Ocean conditions. Proc. Natl. Acad. Sci. USA 2021, 118, e2022255118. [Google Scholar] [CrossRef]
  29. Li, H.; He, S.; Fan, K.; Wang, H. Relationship between the onset date of the Meiyu and the South Asian anticyclone in April and the related mechanisms. Clim. Dyn. 2019, 52, 209–226. [Google Scholar] [CrossRef]
  30. Xie, Z.; Du, Y.; Zeng, Y.; Miao, Q. Classification of yearly extreme precipitation events and associated flood risk in the Yangtze-Huaihe River Valley. Sci. China Earth Sci. 2018, 61, 1341–1356. [Google Scholar] [CrossRef]
  31. Burgan, H.I.; Icaga, Y. Flood analysis using Adaptive Hydraulics (AdH) model in Akarcay Basin. Tek. Dergi 2019, 30, 9029–9051. [Google Scholar] [CrossRef]
  32. Chen, T.; Zhang, F.; Yu, C.; Ma, J.; Zhang, X.; Shen, X.; Zhang, F.; Luo, Q. Synoptic analysis of extreme Meiyu precipitation over Yangtze River Basin during June–July 2020. Meteorol. Mon. 2020, 46, 1415–1426. (In Chinese) [Google Scholar] [CrossRef]
  33. Liang, P.; Hu, Z.Z.; Ding, Y.; Qian, Q. The extreme Mei-Yu season in 2020: Role of the Madden-Julian oscillation and the cooperative influence of the Pacific and Indian Oceans. Adv. Atmos. Sci. 2021, 38, 2040–2054. [Google Scholar] [CrossRef]
  34. Wang, L.; Sun, X.; Yang, X.; Tao, L.; Zhang, Z. Contribution of water vapor to the record-breaking extreme Meiyu rainfall along the Yangtze River Valley in 2020. J. Meteorol. Res. 2021, 35, 557–570. [Google Scholar] [CrossRef]
  35. Liu, B.; Yan, Y.; Zhu, C.; Ma, S.; Li, J. Record-breaking Meiyu rainfall around the Yangtze River in 2020 regulated by the subseasonal phase transition of the North Atlantic oscillation. Geophys. Res. Lett. 2020, 47, e2020GL090342. [Google Scholar] [CrossRef]
  36. Qiao, S.; Chen, D.; Wang, B.; Cheung, H.N.; Liu, F.; Cheng, J.; Tang, S.; Zhang, Z.; Feng, G.; Dong, W. The longest 2020 Meiyu season over the past 60 years: Subseasonal perspective and its predictions. Geophys. Res. Lett. 2021, 48, e2021GL093596. [Google Scholar] [CrossRef]
  37. Takaya, Y.; Ishikawa, I.; Kobayashi, C.; Endo, H.; Ose, T. Enhanced Meiyu-Baiu rainfall in early summer 2020: Aftermath of the 2019 super IOD event. Geophys. Res. Lett. 2020, 47, e2020GL090671. [Google Scholar] [CrossRef]
  38. Guo, Y.; Zhang, R.; Wen, Z.; Li, J.; Zhang, C.; Zhou, Z. Understanding the role of SST anomaly in extreme rainfall of 2020 Meiyu season from an interdecadal perspective. Sci. China Earth Sci. 2021, 64, 1619–1632. [Google Scholar] [CrossRef]
  39. Tang, S.; Luo, J.J.; He, J.; Wu, J.; Zhou, Y.; Ying, W. Toward understanding the extreme floods over Yangtze River Valley in June–July 2020: Role of tropical oceans. Adv. Atmos. Sci. 2021, 38, 2023–2039. [Google Scholar] [CrossRef]
  40. Ueda, H.; Yokoi, M.; Kuramochi, M. Enhanced subtropical anticyclone over the Indo–Pacific Ocean associated with stagnation of the Meiyu–Baiu rainband during summer, 2020. SOLA 2021, 17, 14–18. [Google Scholar] [CrossRef]
  41. Zheng, J.; Wang, C. Influences of three oceans on record-breaking rainfall over the Yangtze River Valley in June 2020. Sci. China Earth Sci. 2021, 64, 1607–1618. [Google Scholar] [CrossRef]
  42. Cai, Y.; Chen, Z.; Du, Y. The role of Indian Ocean warming on extreme rainfall in central China during early summer 2020: Without significant El Niño influence. Clim. Dyn. 2022, 59, 951–960. [Google Scholar] [CrossRef]
  43. Liu, C.; Hu, C.; Yang, S.; Lin, L.; Wu, Z. Super East Asian monsoon Mei-yu in June and July 2020 tied to dissimilar-shifting upper-level westerlies. Atmos. Res. 2022, 274, 106213. [Google Scholar] [CrossRef]
  44. Kripalani, R.; Ha, K.J.; Ho, C.H.; Oh, J.H.; Preethi, B.; Mujumdar, M.; Prabhu, A. Erratic Asian summer monsoon 2020: COVID-19 lockdown initiatives possible cause for these episodes? Clim. Dyn. 2022, 59, 1339–1352. [Google Scholar] [CrossRef]
  45. Yang, Y.; Ren, L.; Wu, M.; Wang, H.; Song, F.; Leung, L.R.; Hao, X.; Li, J.; Chen, L.; Li, H.; et al. Abrupt emissions reductions during COVID-19 contributed to record summer rainfall in China. Nat. Commun. 2022, 13, 959. [Google Scholar] [CrossRef]
  46. Huang, Q.; Wang, L.; Li, Y.; He, J. Determination of the onset and ending of regional Meiyu over Yangtze-Huaihe River Valley and its characteristics. J. Trop. Meteorol. 2012, 28, 749–756. (In Chinese) [Google Scholar]
  47. Nitta, T. Convective activities in the tropical western Pacific and their impact on the Northern Hemisphere summer circulation. J. Meteorol. Soc. Jpn. 1987, 65, 373–390. [Google Scholar] [CrossRef]
  48. Wang, C. Three-ocean interactions and climate variability: A review and perspective. Clim. Dyn. 2019, 53, 5119–5136. [Google Scholar] [CrossRef]
  49. Wu, B.; Zhang, R.; Wang, B.; D’Arrigo, R. On the association between spring Arctic Sea ice concentration and Chinese summer rainfall. Geophys. Res. Lett. 2009, 36, L09501. [Google Scholar] [CrossRef]
  50. Wu, B.; Zhang, R.; Ding, Y.; D’Arrigo, R. Distinct modes of the East Asian summer monsoon. J. Clim. 2008, 21, 1122–1138. [Google Scholar] [CrossRef]
  51. Zhang, J.; Tian, W.; Chipperfield, M.P.; Xie, F.; Huang, J. Persistent shift of the Arctic polar vortex towards the Eurasian continent in recent decades. Nat. Clim. Chang. 2016, 6, 1094–1099. [Google Scholar] [CrossRef]
  52. Xu, M.; Tian, W.; Zhang, J.; Wang, T.; Qie, K. Impact of sea ice reduction in the Barents and Kara Seas on the variation of the East Asian trough in late winter. J. Clim. 2021, 34, 1081–1097. [Google Scholar] [CrossRef]
  53. Han, T.; Zhang, M.; Zhu, J.; Zhou, B.; Li, S. Impact of early spring sea ice in Barents Sea on midsummer rainfall distribution at Northeast China. Clim. Dyn. 2021, 57, 1023–1037. [Google Scholar] [CrossRef]
  54. Kalnay, E.; Kanamitsu, M.; Kistler, R.; Collins, W.; Deaven, D.; Gandin, L.; Iredell, M.; Saha, S.; White, G.; Woollen, J.; et al. The NCEP/NCAR 40-year reanalysis project. Bull. Am. Meteorol. Soc. 1996, 77, 437–471. [Google Scholar] [CrossRef]
  55. Liebmann, B.; Smith, C.A. Description of a complete (interpolated) outgoing longwave radiation dataset. Bull. Am. Meteorol. Soc. 1996, 77, 1275–1277. [Google Scholar] [CrossRef]
  56. Xie, P.; Arkin, P.A. Global precipitation: A 17-year monthly analysis based on gauge observations, satellite estimates, and numerical model outputs. Bull. Am. Meteorol. Soc. 1997, 78, 2539–2558. [Google Scholar] [CrossRef]
  57. Rayner, N.A.; Parker, D.E.; Horton, E.B.; Folland, C.K.; Alexander, L.V.; Rowell, D.P.; Kent, E.C.; Kaplan, A. Global analyses of sea surface temperature, sea ice, and night marine air temperature since the late nineteenth century. J. Geophys. Res. 2003, 108, 4407. [Google Scholar] [CrossRef]
  58. Kay, J.E.; Deser, C.; Phillips, A.; Mai, A.; Hannay, C.; Strand, G.; Arblaster, J.M.; Bates, S.C.; Danabasoglu, G.; Edwards, J.; et al. The community earth system model (CESM) large ensemble project: A community resource for studying climate change in the presence of internal climate variability. Bull. Am. Meteorol. Soc. 2015, 96, 1333–1349. [Google Scholar] [CrossRef]
  59. Zheng, X.T.; Hui, C.; Yeh, S.W. Response of ENSO amplitude to global warming in CESM large ensemble: Uncertainty due to internal variability. Clim. Dyn. 2018, 50, 4019–4035. [Google Scholar] [CrossRef]
  60. Piao, J.; Chen, W.; Chen, S.; Gong, H. Role of the internal atmospheric variability on the warming trends over Northeast Asia during 1970–2005. Theor. Appl. Climatol. 2022, 1–12. [Google Scholar] [CrossRef]
  61. Sardeshmukh, P.D.; Hoskins, B.J. The generation of global rotational flow by steady idealized tropical divergence. J. Atmos. Sci. 1988, 45, 1228–1251. [Google Scholar] [CrossRef]
  62. Takaya, K.; Nakamura, H. A formulation of a phase-independent wave-activity flux for stationary and migratory quasigeostrophic eddies on a zonally varying basic flow. J. Atmos. Sci. 2001, 58, 608–627. [Google Scholar] [CrossRef]
  63. Liu, Y.; Ding, Y.; Song, Y. Relationship between the Meiyu over the Yangtze-Huaihe River Basins and the frequencies of tropical cyclone genesis in the western North Pacific. J. Meteorol. Soc. Jpn. 2011, 89, 141–152. [Google Scholar] [CrossRef]
  64. Huangfu, J.; Tang, Y.; Wang, L.; Chen, W.; Huang, R.; Ma, T. Joint influence of the quasi-biennial oscillation and Indian Ocean basin mode on tropical cyclone occurrence frequency over the western North Pacific. Clim. Dyn. 2022, 1–11. [Google Scholar] [CrossRef]
  65. Li, X.; Lu, R. Breakdown of the summertime meridional teleconnection pattern over the western North Pacific and East Asia since the early 2000s. J. Clim. 2020, 33, 8487–8505. [Google Scholar] [CrossRef]
Figure 1. Basic flow chart of the methodology.
Atmosphere 13 01293 g001
Figure 2. Regressed anomalies of July–mean (a) 200 hPa zonal wind (U200; shading; unit: m s−1); (b) 500 hPa wind field (UV500; vectors; unit: m s−1) and geopotential height (Z500; shading; unit: gpm); and (c) 850 hPa wind field (UV850; vectors; unit: m s−1), with respect to the MWD departure in the YHRB during the period 1980–2016. U200, Z500, and UV850 anomalies that are significant at the 95% confidence level are stippled, and the magenta box denotes the research domain of the YHRB Meiyu region (28° N–34° N, 110° E–122° E) [16].
Atmosphere 13 01293 g002
Figure 3. Regressed anomalies of July–mean (a) vertically integrated WVT (vectors; unit: kg m−1 s−1) and WVT_div (shading; unit: 10−6 kg m−2 s−1); (b) OLR (shading; unit: W m−2); and (c) precipitation (shading; unit: mm day−1), with respect to the MWD departure in the YHRB during the period 1980–2016. U200, Z500, and UV850 anomalies that are significant at the 95% confidence level are stippled, and the magenta box denotes the research domain of the YHRB Meiyu region.
Atmosphere 13 01293 g003
Figure 4. (a) Correlations between the MA–mean Arctic SIA and the MWD departure in the YHRB during 1980–2016. The two red frames in (a) outline the selected domains for calculating the Arctic SIA index (75° N–82° N, 170° E–130° W and 82° N–86° N, 130° W–80° W; the same hereinafter). Correlation coefficients significant at the 95% confidence level are dotted. (b) Time–series of the MWD departure in the YHRB (solid black line; unit: days) and the normalized MA–mean ASIAI (blue dashed line) in the period 1980–2016. The gray horizontal line for the MWD departure in (b) delineates the climatological–mean MWD (viz. 13 July). The numeral at the bottom (red) represents the determination coefficient (R–squared) between MWDs and the MA–mean ASIAI.
Atmosphere 13 01293 g004aAtmosphere 13 01293 g004b
Figure 5. Regressed anomalies of July–mean (a) 200 hPa zonal wind (U200; shading; unit: m s−1); (b) 500 hPa wind field (UV500; vectors; unit: m s−1) and geopotential height (Z500; shading; unit: gpm); and (c) 850 hPa wind field (UV850; vectors; unit: m s−1), with respect to the normalized negative MA–mean ASIAI.
Atmosphere 13 01293 g005
Figure 6. Regressed anomalies of July–mean (a) vertically integrated WVT (vectors; unit: kg m−1 s−1) and WVT_div (shading; unit: 10−6 kg m−2 s−1); (b) OLR (shading; unit: W m−2); and (c) precipitation (shading; unit: mm day−1), with respect to the normalized negative MA–mean ASIAI.
Atmosphere 13 01293 g006
Figure 7. Vertical latitude section (110° E–120° E) of the July–mean (a) vertical velocity (shading; unit: 10−2 Pa s−1) and (b) meridional wind (shading; unit: m s−1) anomalies regressed onto the normalized negative MA–mean ASIAI for the period 1980–2016. Regression coefficients that are significant at the 90% confidence level are stippled. The thick blue horizontal bars superimposed onto the abscissa of panels (a,b) indicate the latitudes bounding the YHRB Meiyu region.
Atmosphere 13 01293 g007
Figure 8. Regression pattern of July–mean (a) vertically integrated vEs (shading; unit: 108 J kg−1); (b) absolute 850 hPa equivalent potential temperature gradient (shading; unit: K km−1); and (c) vertical wind shear (differences between zonal wind at 200 hPa and 850 hPa; shading; unit: m s−1), with regard to the normalized negative MA–mean ASIAI for the period 1980–2016. Regression coefficients that are significant at the 90% confidence level are stippled. The gray shaded area denotes the Tibetan Plateau. The magenta box denotes the research domain of the YHRB Meiyu region.
Atmosphere 13 01293 g008
Figure 9. Correlations between the MA–mean ASIAI and the subsequent MJ–mean (left panel) and July–mean (right panel) Arctic SIA for the period 1980–2016. Correlation coefficients significant at the 95% confidence level are stippled.
Atmosphere 13 01293 g009
Figure 10. Regression map of July–mean 300 hPa RWS (shading; unit: 10−11 s−2) and divergent horizontal wind (vectors; unit: m s−1) onto the normalized negative MA–mean ASIAI for the period 1980–2016. Areas with significant values of RWS exceeding the 90% confidence level are stippled.
Atmosphere 13 01293 g010
Figure 11. Regression map of July–mean Z500 (shading; unit: m) and 500 hPa horizontal WAF (vectors; unit: m2 s−2) onto the normalized negative MA–mean ASIAI for the period 1980–2016. Areas with significant values of Z500 exceeding the 95% confidence level are stippled. The magenta box denotes the research domain of the YHRB Meiyu region.
Atmosphere 13 01293 g011
Figure 12. Composite difference of Z500 (shading; unit: m) in July between five lowest and highest MA–mean ASIAI years during 1920–2005. The results are based on the ensemble mean of 35 members of CESM–LENS historical simulations. The magenta box denotes the research domain of the YHRB Meiyu region.
Atmosphere 13 01293 g012
Figure 13. Anomalies of the MA–mean Arctic SIA in 2019 (left panel) and 2020 (right panel). The base period is 1980–2020.
Atmosphere 13 01293 g013
Publisher’s Note: MDPI stays neutral with regard to jurisdictional claims in published maps and institutional affiliations.

