Abstract
In order to analyze the permeability and particle size distribution of atomized aerosol in different coal particle sizes and to explore the inhibition performance of an atomized inhibitor in different atomization times and positions, the following conclusions are obtained by ultrasonic atomization device: The results of permeability experiment show that the particle size of aerosol decreases with the increase of atomization frequency. In addition, with the particle size of the coal sample decreasing from 5 cm to 0.6 cm, the penetration ratio of aerosol in coal decreases from 64.2% to 15.5% due to the interception of large particle size water mist by dense coal. The aerosol with a particle size of 2~4 μm has better permeability in crushed coal. The flame retardant experiment shows that compared with the raw coal, the aliphatic hydrocarbon of the atomized coal decreases by 75.9%, the aromatic hydrocarbon decreases by 57.5%, and the flame retardant effect is good. Meanwhile, the extension of solution atomization time will further enhance the flame retardant ability of ultrasonic atomized aerosol.
1. Introduction
The spontaneous combustion of coal is one of the main threats to coal mine safety. The fires may cause casualties, resulting in economic losses and environmental pollution [1,2,3,4]. Many scholars have studied the spontaneous combustion of coal, its prevention, and control technologies. Topics covered include the oxygen consumption rate of the remaining coal as well as the distribution of the temperature field [5,6,7]. However, the uncertainty of the location of spontaneous combustion in the goaf brings many difficulties to its prevention and control. Commonly used fire-fighting technologies in goaf are grouting, sealing, gel, inert medium injection, two-phase foam, and three-phase foam [8,9,10,11,12]. The traditional fire-fighting technology is mainly based on plugging to prevent oxygen from contacting and reacting with residual coal. However, due to the large area and complex structure of the goaf, the traditional fire prevention measures cannot completely block the air leakage. Under the above background, “inert gas injection fire prevention” came into being, which can penetrate deep into the goaf, reduce the oxygen concentration in the area, and make the residual coal fundamentally lose its spontaneous combustion ability. Unfortunately, due to the influence of gas mobility in the goaf, it is difficult for the inert gas infiltrated into the gob to stay for a long time, resulting in a decrease in the fire-fighting effect [13,14,15,16]. Materials containing various flame retardants cannot only reach the inside of the goaf but also adhere to the surface of the coal, which makes us consider using flame retardant materials to suppress the spontaneous combustion of coal effectively.
At present, flame retardant materials can be applied to spontaneous combustion areas in goafs through spraying, foam, aqueous solutions, colloids, slurries, and solids. However, due to the volume of the material itself, the fire-fighting effect is not good [17,18]. In addition, due to the small particle size of the aerosol, it has the advantages of good diffusivity and adhesion in the void and crevice structure. By atomizing the flame retardant into aerosol and injecting it into the goaf, it is widely used in various fire prevention and control [19]. Scholars started with equipment parameters (such as working frequency and power consumption) and working parameters (such as flow rate and liquid properties) to explore the influencing factors of aerosol atomization parameters to prepare the best aerosol fireproof materials [20,21]. Luo Zhenmin used a 1 m3 airtight test box to study the inhibitory effect of aerosol fire extinguishing agents on coal fires within a 30-min soaking time. The experimental results showed that the aerosol fire extinguishing agent has a certain inhibitory effect on the combustion of coal and can extinguish the gas-phase combustion flame on the surface of the coal. The aerosol used in the experiment is composed of solid particles with low vapor pressure and slow sedimentation under the action of gravity [22]. Different from traditional atomization, ultrasonic atomization sprays’ fine droplets from the liquid film formed on the ultrasonic vibration surface, thereby atomizing to form aerosol particles with controllable and stable particle size distribution. Ultrasonic atomization can be more energy efficient, only the mechanical vibrations generated by the supplied electrical energy are used to generate droplets. Kooij conducted the first systematic study of the droplet size distribution for different nebulizer technologies and showed that median droplet size varied proportionally with capillary wavelength [23]. Kiran A. Ramisetty found that with increasing ultrasonic intensity, the droplet size distribution changed from a narrow range to a wider range [24]. To verify the predictability of the droplet size produced, Dalmoro, A. used three empirical correlations to predict droplet size that took into account feed solution properties/process parameters [25]. Kudo determined the relationship between droplet size distribution and ultrasonic frequency and proposed the generation mechanism of ultrasonic nano-mist based on the amount of water vapor around the liquid column. The mechanism was to affect the number and size distribution of aerosols by changing the solution density and power intensity of the ultrasonic atomizer [26]. Tang used the aerosol prepared by the ultrasonic atomizer to suppress the spontaneous combustion of coal, and the effect was remarkable [27]. Li prepared iron-based composite adsorbents with biochar as a carrier by coprecipitation and sol-gel methods, indicating that the removal of Hg0 by modified biochar mainly includes adsorption and oxidation processes [28].
Ultrasonic atomization technology is an effective method for preparing cold aerosols. The principle is to convert the specific electrical energy generated by the circuit system into ultrasonic wave energy through the high-frequency oscillation of the atomizing vibrator, thereby atomizing to form aerosol particles with controllable and stable particle size distribution. The ejection of droplets from vibrating surfaces has been explained by the capillary wave hypothesis, which posits that the instability of the surface waves of solutions is due to ultrasonic atomization. When the ultrasonic wave of fixed frequency acts on the interface of gas and liquid, the interface will produce high-frequency vibration. When the surface tension wave increases to a certain amplitude, atomization will be generated at the peak position. The atomization model figure is shown in Figure 1.
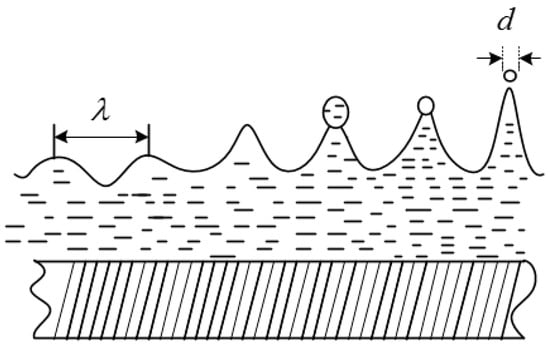
Figure 1.
Atomization model diagram.
In the early ultrasonic atomization research, Lang proposed the ultrasonic capillary wave length formula based on the Kelvin equation [29]:
Assuming that the instantaneous amplitude of the liquid film atomization is proportional to the wavelength of the capillary wave, the ratio is K, and the expression of d is:
where is the surface tension, mN/m; ρ is the density, g/cm3; f is the ultrasonic frequency, MHz. It can be seen that the average particle size is related to liquid surface tension, liquid density, ultrasonic frequency, and capillary wave wavelength.
In summary, scholars have demonstrated that aerosols of chemical inhibitors can play a flame retardant role and also obtained the relevant laws of droplet size distribution. However, there are caving voids in the goaf, which will affect the passage of aerosols of different particle sizes in the gob. There are few studies on the penetration and flame retardant effect of aerosols with different particle sizes under different void structures. Therefore, based on the analysis of the atomization mechanism, we used the permeability experimental device to test the permeability of aerosol particles through coal samples with different particle sizes. At the same time, the flame retardant effect of aerosol under the conditions of different flame retardants and atomization time was analyzed by Fourier transform infrared spectroscopy. This paper proves that the ultrasonic atomized aerosol can pass through the gap between the coal bodies to reach the deep part of the goaf and play a flame retardant effect, which is an effective means to suppress the spontaneous combustion of coal in the gob.
2. Experimental Equipment, Materials and Methods
Figure 2 shows the relationship between the three experiments (i.e., the ultrasonic atomization experiment, the permeability experiment, and the flame retardancy experiment) in this paper. Through experiment 1, the MgCl2 flame retardant solution was atomized into aerosol particles, and then the permeability of the aerosol particles was analyzed through experiment 2. Finally, in experiment 3, the flame retardant properties of aerosol particles on the coal surface were analyzed.
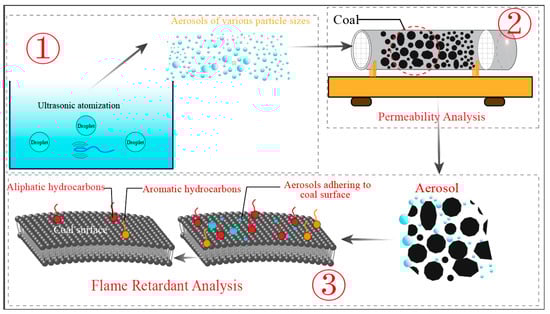
Figure 2.
Experimental flow chart. The experiment 1 is the preparation of aerosol; Experiment 2 is aerosol permeability experiment; Experiment 3 is an aerosol flame retardant experiment.
2.1. Preparation of Coal Samples
Bituminous coal from the Jining mining area in the southwest of Shandong Province was selected as the experimental coal sample. According to the coal particle size classification standard (Table 1), a jaw crusher to crush and sieve the coal samples is used. The flame retardant (MgCl2) used in the experiment was of chemical purity grade (i.e., purity > 99.5%) and was purchased from China Shandong Chemical Reagent Co., Ltd. (Shandong, China).

Table 1.
Coal particle size classification.
2.2. Ultrasonic Atomization
The ultrasonic atomizer used in this experiment is mainly composed of a piezoelectric ceramic vibrator (UL106128AWG) and a small fan (KS-16-3.0BU-PCB). The vibrator (yellow area) atomizes the added flame retardant solution into aerosol particles. The upper left side of the solution is connected to a speed-regulated small fan (driven by a piezoelectric transducer, Shenzhen Youbisheng Technology Co., Ltd., Jinjiang, China), which is used to transfer aerosol particles. The experimental equipment has the function of changing the amplitude of the atomizer and the air volume delivery by adjusting the output power, as shown in Figure 3. The frequency of the ultrasonic atomizer is 3 MHz, according to the previous test.
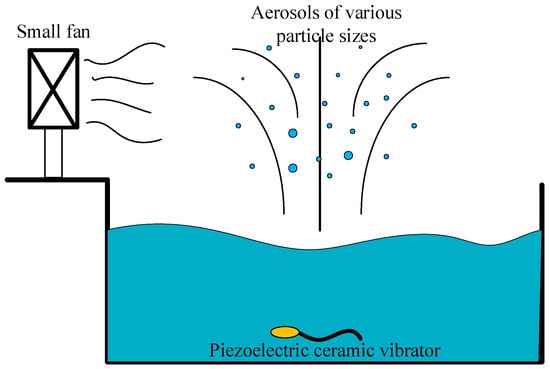
Figure 3.
Ultrasonic atomization device.
2.3. Permeability Test
In order to ensure the flame retardant properties of aerosols, it is necessary to pay attention to the permeability of aerosols in the coal void structure in the goaf. The experiment adopts the self-designed device, which is mainly divided into two parts: the permeation device and the flow meter, as shown in Figure 4. The coal sample tube is placed horizontally, the effective length of the filled coal sample is 40 cm, and the diameter is 7 cm. The particle size distribution of the coal sample is shown in Table 1. Both sides of the coal body are fixed with metal mesh screens to prevent the collapse of the coal body structure. When the aerosol particles generated by the ultrasonic atomization device traveled through the sample tank, some of the aerosol particles were trapped by the coal sample filled inside. By recording the mass of aerosol particles before and after passing through the sample tank, we tested their permeability through coal samples of different particle sizes. So as to avoid the influence of other factors, pure water was selected as the atomization solution, the atomization frequency was 3 MHz, and the atomization time was 10 min.
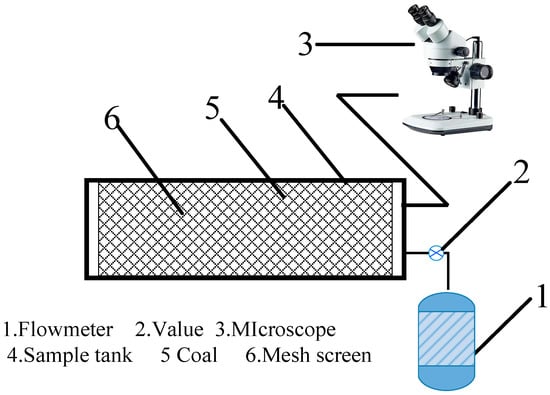
Figure 4.
Schematic diagram of the device.
Specific steps are as follows:
- (1)
- The aerosol produced by the ultrasonic atomizing device was passed through the device shown in Figure 4, and its air tightness was tested;
- (2)
- Turned on the switch of the atomization device and first tested the particle size of the aerosol droplets in the front and rear of the empty pipe (without coal sample);
- (3)
- The coal sample was tightly filled into the test section tube, and the two sides were fixed with metal mesh sieves to test the particle size change of aerosol after passing through the coal sample;
- (4)
- The same group of experiments was tested three times, and the test data were recorded;
- (5)
- Changed the particle size of the filled coal sample, and tested the particle size of 3.0–2.5, 2.5–2.0, 2.0–1.5, 1.5–1.0, 1.0–0.6, and <0.6, respectively;
- (6)
- Summarized and organized test data and conducted data analysis.
2.4. CCD Image Acquisition System
In order to determine the changing rule of atomized particle size at different levels, a layer of petroleum jelly was evenly daubed on the glass slide and passed through the aerosol atomization field at a uniform speed at the back of the coal sample tank. Then, the slide was moved to the microscope for observation, and the image was transferred to the computer through the CCD image acquisition system (QA3020CNC (T) including microscope, image acquisition card, and computer), as shown in Figure 5. Image processing using image-Pro Plus software.
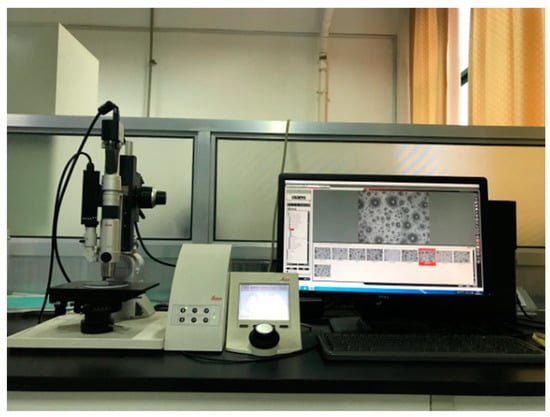
Figure 5.
CCD image acquisition system.
Details of how images are processed:
- ①
- Read image;
Opened Image-Pro Plus software and imported the images to be processed. The image was in tif format with 1600 × 1200 pixels.
- ②
- Add ruler;
According to the pixel and size of the picture, it can be calculated that 3.8 pixels correspond to a length of 1 μm, and the scale parameters were set: the length is 20 μm, as shown in Figure 6.
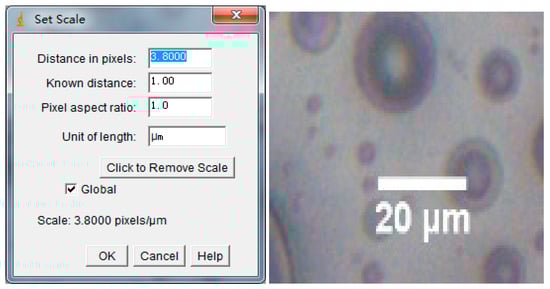
Figure 6.
Set the scale.
- ③
- Select the area to be processed;
The processing area is selected by calling rectangle, ellipse, and irregular tools. The selected area needs to be fresh and bright, and the color contrast is distinct, which can clearly show the outline of the droplets, as shown in Figure 7.
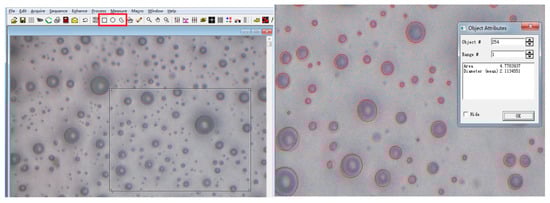
Figure 7.
Calling the tool.
- ④
- Droplet boundary selection;
Droplet boundaries were selected by setting a threshold.
- ⑤
- Smooth border;
When the boundary of droplet particle size was selected to be irregular, the boundary can be made regular by smoothing the curve.
- ⑥
- Particle size measurement and output.
2.5. Flame Retardant Test
In order to test the flame retardant properties of the aerosol, 200 mL of MgCl2 solution with a concentration of 15% was selected, and the atomization time was set to 30 min and 60 min, in turn. Since MgCl2 is easily soluble in water and easily atomized by an ultrasonic atomizing device, MgCl2 was selected as the inhibitor in the experiment. The MgCl2 was atomized by an ultrasonic atomizer, and the formed droplets entered the coal sample tank with the help of the airflow of the fan of the atomization device and then were discharged from the outlet of the coal sample tank. The size of the coal sample is 0.5−0.7 cm, and the atomization frequency is 3 MHz. Next, the coal sample was taken from the front and rear ends of the coal sample tank, placed in a vacuum drying oven, dried at 40 °C for 24 h, and then mixed with KBr at a mass ratio of 1:100, dispersed and ground in an agate mortar for about 3 min. The mixture was pressed into flakes under the pressure of 20 MPa, and the pressing time was 1~2 min. Then the knob was rotated to release the pressure, and the coal sample was taken out to obtain a thin sheet with a diameter of 0.9 mm and a thickness of 0.1 mm. The transmission spectrum of the coal sample slices was obtained using a NicoletiS10 Fourier (Beijing Jinli Tongjian Environmental Technology Co., Ltd., Beijing, China.) transform infrared spectrometer. The analyzer has a standard scan error of 4 cm−1. The obtained spectral range is 400−4000 cm−1, and the number of scans for both background and sample is 64. The flame retardant properties of MgCl2 aerosols were analyzed by the absorption peaks of the obtained spectra.
3. Results
3.1. The Influence of Frequency on Atomized Particle Size
In the experiment, pure water was used as the atomization object, and the ultrasonic atomization device (Figure 3) and CCD image acquisition system (Figure 5) were used to measure the aerosol particle size at different frequencies. The particle size distribution is shown in Figure 8. As shown in the figure, as the atomization frequency increases, the atomization particle size map gradually shifts to the left, the droplet particle size peak gradually decreases, and the distribution range also shrinks.
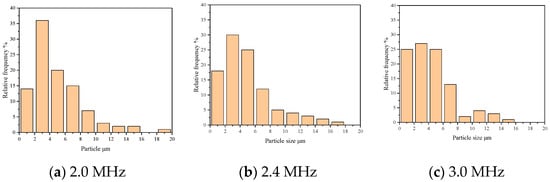
Figure 8.
Histogram of frequency particle size distribution. (a) is the atomization frequency of 2.0 MHz; (b) is the atomization frequency of 2.4 MHz; and (c) is the atomization frequency of 3.0 MHz.
According to the particle size distribution histogram, each characteristic particle size was calculated, see Table 2. As the frequency increases from 2.0 MHz to 3.0 MHz, D32, D43, D10, D50, D90 decrease from 5.35, 7.55, 1.59, 3.73, 10.92 μm to 4.01, 6.24, 1.55, 2.96, 9.4 μm, respectively. It can be seen that the particle size produced by high-frequency microwave atomization was small, and the concentration of the range is conducive to diffusion.
Table 2.
Results of particle size.
3.2. Analysis of Aerosol Permeability
3.2.1. Aerosol Permeation Flow Analysis
By replacing coal samples with different particle sizes for testing, we used a self-designed ultrasonic atomization device (Figure 4) to obtain changes in aerosol permeability and retention rate, as shown in Figure 9.
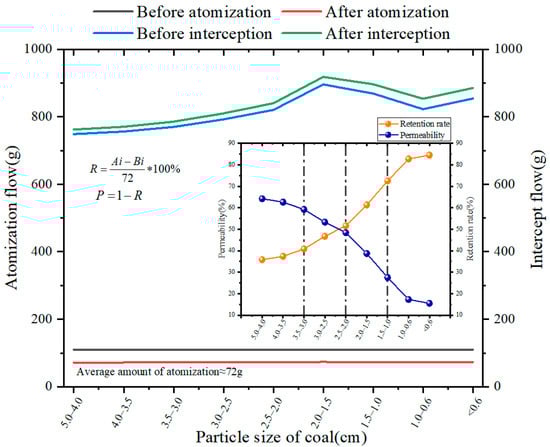
Figure 9.
Aerosol diffusion effect diagram.
As can be seen from Figure 9, microwave atomized particles can pass through the pipe smoothly under the condition of an air pipe, and the particle passing rate is 95.6%. These results indicate that microwave atomized aerosol particles have good diffusivity in free space.
As the diameter of filled coal particles in the pipeline decreases from 5 cm to less than 0.6 cm, the diffusion effect of aerosol through the coal particle space becomes worse, and the proportion of aerosol interception increases from 35.8% to 84.5%. The permeability of sol particles decreases greatly due to the influence of the void structure between coal particles.
Among them, under different particle sizes, the penetration rules of atomized particles are as follows:
- (1)
- The coal sample was composed of middle lump coal with a large void structure, the interception ratio increased from 35.8% to 40.8%, and the infiltration ratio decreased from 64.2% to 59.2%.
- (2)
- In the process of coal sample accumulation from medium block to small block, the slope of the rejection curve changed rapidly, and the interception ratio increased from 40.8% to 51.6%.
- (3)
- The coal sample accumulated from small pieces to granular coal, the pore structure decreased sharply, and the space allowing aerosol to pass shrunk. The interception ratio rose from 51.6% to 82.7%. At this stage, the slope of the curve changed fastest, but aerosol can still penetrate.
- (4)
- At this time, the coal sample was formed by the accumulation of pulverized coal, and the void structure was small. The proportion of interception increased from 82.7% to 84.5%, and the proportion of penetration decreased from 17.3% to 15.5%. Aerosol permeability changed gently.
The void fraction of the goaf changes dynamically with the spatial location, which in turn affects the aerosol passing ability. The atomization device developed in this paper can generate aerosol particles with a controllable particle size distribution, which can penetrate the dense space and attach to the coal to play a role of resistance so that it can achieve a wide range of flame retardants in the goaf.
The void fraction of the goaf changes dynamically with the spatial location, which in turn affects the aerosol passing ability. The atomization device developed in this paper can generate aerosol particles with a controllable particle size distribution so that the large particle size droplets stay in the area with high porosity while the small particle size droplets can enter the deep part of the goaf and attach to the coal, the flame retardant of the goaf can be achieved in a wide range.
3.2.2. Analysis of Aerosol Permeable Particle Size
Considering the influence of microwave atomized particle size on permeability, the difference in particle size distribution at the outlet of the pipe was compared when the air duct was in operation. In the experiment, the CCD image system was used to collect fog droplet images at the inlet and outlet positions by using slides, and the images were transmitted to the computer to test the particle size distribution of fog droplets under different conditions, as shown in Figure 10. Images were analyzed and processed by image-Pro Plus software.
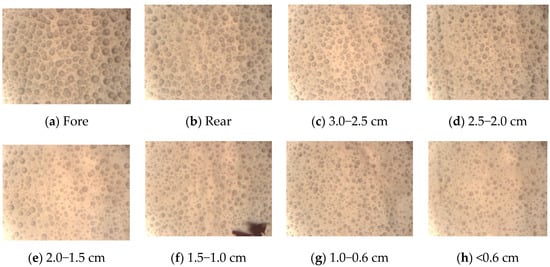
Figure 10.
Particle size test diagram. (a) is the droplet at the entrance of the empty pipe; (b) is the droplet at the exit of the empty pipe; (c) is the exit droplet with a particle size of 3.0−2.5 cm; (d) is the exit droplet with a particle size of 2.5−2.0 cm; (e) is the exit droplet with a particle size of 2.0−1.5 cm; (f) is the exit droplet with a particle size of 1.5−1.0 cm; (g) is the exit droplet with a particle size of 1.0−0.6 cm; and (h) is the exit droplet with a particle size of <0.6 cm.
Use Image-Pro Plus software to count the aerosol particle size, as shown in Figure 10. Figure 10a,b is the aerosol particle size distributions at the inlet and outlet in the case of empty pipes, and Figure 10c–h is the aerosol particle size distributions at the outlet with different coal-sample void structures.
- (1)
- From the particle size distribution (Figure 10a,b and Figure 11a,b), it can be seen that during the movement of the droplets in the free space of the empty tube, the atomized particle size at the inlet was mainly concentrated in the range of <10 μm. The particle size increased slightly in the range of 16−18 μm, which may be affected by the collision and fusion of glass droplets. After the atomized particles ran for a certain distance in the pipeline, the particle size distribution within the range of <10 μm became more concentrated at the exit, which showed that the particle size at the exit decreased. The particle size of 2−4 μm increased significantly, and the particle size of >10 μm decreased significantly, indicating that the larger particle size was more lost due to gravity sedimentation during the operation of fog droplets above the particle size.
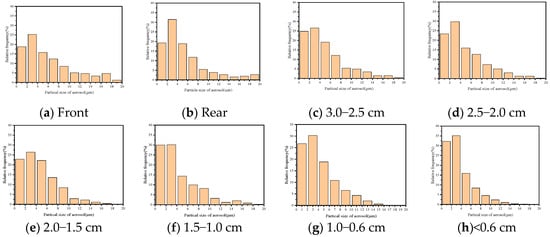 Figure 11. Aerosol particle size distribution under different void structures. (a) is the droplet at the entrance of the empty pipe; (b) is the droplet at the exit of the empty pipe; (c) is the exit droplet with a particle size of 3.0−2.5 cm; (d) is the exit droplet with a particle size of 2.5−2.0 cm; (e) is the exit droplet with a particle size of 2.0−1.5 cm; (f) is the exit droplet with a particle size of 1.5−1.0 cm; (g) is the exit droplet with a particle size of 1.0−0.6 cm; and (h) is the exit droplet with a particle size of <0.6 cm.
 - (2)
- With the decrease of particle size of broken coal filling in the tube, the peak particle size of fog droplets at the exit gradually shifted to the right. The proportion of aerosol particles larger than 8 μm decreased from 27.7% to 8.2%, especially those larger than 14 μm, which decreased from 9.4% to 0.4%. The aerosol particles less than 4 μm increased most significantly, from 44.0% to 67.3%.
These results indicate that when the aerosol passes through the dense coal structure, the aerosol particles with larger particle sizes are more likely to be trapped. Affected by the particle size of pulverized coal in the tube, the decrease of aerosol particles is most obvious in the range of 10~20 μm. The 0−4 μm aerosol particles increase with the decrease of the particle size of the crushed coal particles in the tube, which indicates that the atomized particles in this range have good permeability, as shown in Figure 11 and Figure 12.
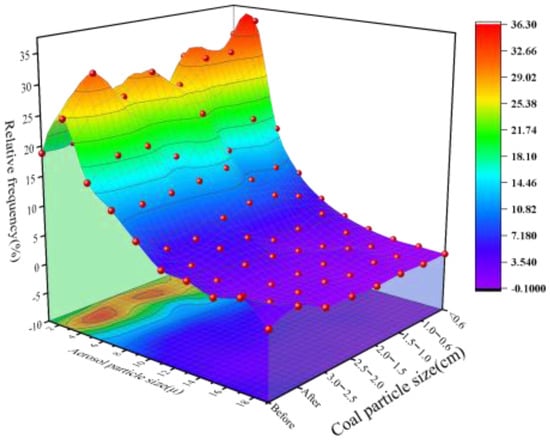
Figure 12.
Statistical chart of particle size.
According to the particle size map, the statistical Sauter average particle size and characteristic particle size were mainly D10, D50, and D90, as shown in Figure 13. When aerosol passes through the space where coals of different particle sizes are stacked, the aerosol particle size will change. As a whole, as the particle size of the filled coal decreased, the aerosol particle size decreased accordingly.
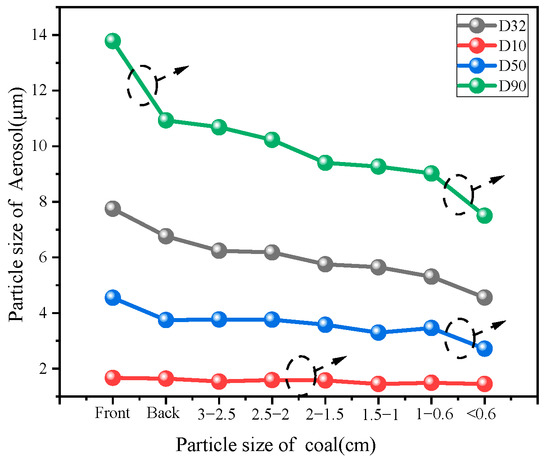
Figure 13.
Change of characteristic particle size.
- (1)
- In the front and rear of the empty tube test particle size, greater than 10 μm aerosol particles due to its sedimentation, more easily deposited on the wall, and smaller particle size aerosols are more likely to float outside the tube.
- (2)
- From the perspective of particle size classification, the D10 particle size curve does not change with the decrease of coal particle size, indicating that aerosol particles smaller than 2 μm can pass through the denser coal structure without being affected by it.
- (3)
- The median particle size D50 decreases from 4.55 μm to 2.72 μm with the decrease of coal particle size, showing a downward trend. When the coal particle size is less than 0.6 cm, the downward trend is more obvious. At this time, the spatial structure of the coal is denser, allowing aerosol particles to pass through a narrower space, and large aerosol particles are more easily intercepted.
- (4)
- With the decrease of the particle size of the piled coal, the D90 particle size changes more obviously. When the coal particle size is less than 0.6 cm, the D90 particle size is reduced from 9.02 μm to 7.50 μm. Due to the dense coal space structure, most of the aerosol particles larger than 7 μm are intercepted by the coal.
3.3. Analysis of Aerosol Resistance
MgCl2 solution was used as the atomization object, and the wettability and surface tension of the MgCl2 aqueous solution was decreased. An ultrasonic atomization device was used to generate aerosols and test coal samples. The atomization time was set to 30 min and 60 min, respectively. After atomization, the coal sample was cooled and dried and then tested and analyzed by infrared spectrum, as shown in Figure 14.
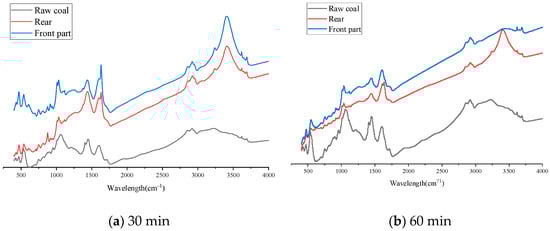
Figure 14.
Schematic diagram of infrared spectrum of MgCl2. (a) is the infrared spectrum when the atomization time is 30 min; and (b) is the infrared spectrum when the atomization time is 60 min.
In Figure 14, 3407 cm−1 is the attribution peak of hydroxyl, 2858 cm−1 and 2923 cm−1 are the asymmetric vibration of methyl and methylene, respectively, the stretching vibration of the carboxyl functional group near 1627 cm−1, and the shear vibration of methylene are 1435 cm−1.
Compared with the raw coal sample, the absorption peak of −OH is obviously enhanced. This is because the MgCl2 inhibitor has water absorption and is very easy to absorb water in the air so that the water content in the coal increases and the absorption peak of −OH increases. Methylene and methyl groups are relatively high activity and are easy to react with oxygen to produce unstable intermediate active groups. Due to the substitution of methylene and methyl H+, the absorption peaks of the above two groups decreased significantly. The absorbance of the functional group corresponding to C=O is also significantly reduced. This is mainly because Mg2+ in the absorbent salt inhibitor MgCl2 is more likely to complex with coal molecules in a high-temperature environment, which reduces the carbonyl group in coal and results in a significant decrease in carbonyl content.
In considering the influence of different atomization positions and atomization time on coal’s resistance performance, the functional group analysis of the infrared spectrograph is shown in Figure 15. When the atomization time is 30 min, compared with raw coal, the atomized aliphatic hydrocarbons and aromatic hydrocarbons of coal show a step-type law of decline. In space, the peak area of functional groups of the front coal sample decreased faster than that of the raw coal sample and the rear coal sample. Compared with raw coal fat, the fat and aromatic hydrocarbons in the front coal samples decreased by 75.9% and 57.5%, respectively. Compared with raw coal, aliphatic hydrocarbons and aromatic hydrocarbons in rear coal samples decreased by 32.6% and 14.0%, respectively. This indicates that MgCl2 aerosol has a large amount of intercepting in the front part and a good blocking effect, while at the back of the coal sample tank, due to the short passage time of atomized aerosol and low blocking amount, MgCl2 has a reduced blocking effect on coal and fewer changes in functional groups.
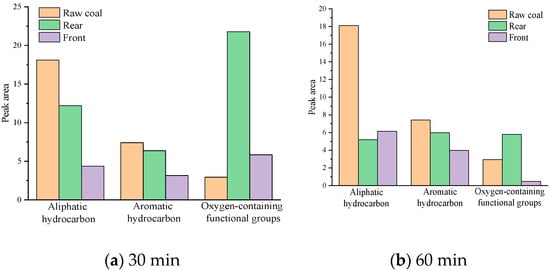
Figure 15.
Variation of functional group content. (a) is the functional group content when the atomization time is 30 min; and (b) is the functional group content when the atomization time is 60 min.
When the atomization time was extended to 60 min, the peak areas of aliphatic hydrocarbons and aromatic hydrocarbons in the coal sample decreased significantly compared with the raw coal sample. Compared with raw coal, aliphatic hydrocarbons and aromatic hydrocarbons of the rear coal sample decreased by 71.3% and 19.6%, respectively. It is speculated that the flame retardant solution is more, and the atomization is not complete in a short time. With the passage of time, the solution can be atomized more thoroughly to produce more aerosol particles, resulting in enhanced flame retardant. This indicates that the longer atomization time will promote the flame retardant solution to produce more aerosol so that it can reach the rear of the coal sample tank through the gap of the coal body and play a role in inhibiting the coal sample.
4. Conclusions
The permeability and barrier properties of aerosols were investigated. This development not only analyzes the permeability of aerosols under different pore structures and the residence of inhibitors in penetrating coal seams but also obtains the temporal and spatial variation of the resistance. It has been proven that ultrasonic atomized aerosol is an effective means of suppressing spontaneous combustion of coal in goafs. The specific conclusions are as follows:
- (1)
- As the particle size of the test coal decreases from 5.0 cm to below 0.6 cm, the permeability of microwave atomized droplets decreases from 64.2% to 15.5%. When the coal particles are less than 0.6 cm, the aerosol permeability is less than 15%, and a large number of aerosols are retained in the coal.
- (2)
- When aerosols passed through the space of coal with different particle sizes, the particle sizes of trapped aerosols differed greatly and generally became smaller with the smaller particle sizes of filled coal. The average particle size D50 decreased with the decrease of coal particle size, and the D10 particle size curve changed little with the decrease of coal particle size, indicating that aerosol particles less than 2−4 μm can pass through the dense coal structure smoothly.
- (3)
- Infrared spectroscopy analysis showed that the content of functional groups in the coal sample after ultrasonic atomization treatment was greatly reduced compared with the uninhibited raw coal. When the atomization time was extended from 30 min to 60 min, the peak areas of aliphatic hydrocarbons and aromatic hydrocarbons in the rear coal sample decreased significantly compared with the original coal sample. This indicates that the smaller particles can penetrate the broken coal voids well, thus realizing the flame retardancy of the MgCl2 aerosol on the deep coal body.
Author Contributions
Methodology, W.Z.; software, F.L.; validation, B.L. and Y.L.; formal analysis, F.L.; investigation, H.C.; resources, Q.T.; data curation, B.L.; writing—original draft preparation, B.L.; writing—review and editing, F.L. and B.L.; visualization, F.L.; supervision, W.Z.; project administration, W.Z.; funding acquisition, J.W. All authors have read and agreed to the published version of the manuscript.
Funding
This work was supported by the National Natural Science Foundation (52174193 and 51974179).
Institutional Review Board Statement
The study does not require ethical approval.
Data Availability Statement
Not applicable.
Acknowledgments
We thank Wenbin Zhao for his technical and theoretical guidance on this paper.
Conflicts of Interest
The authors declare that they have no known competing financial interest or personal relationship that could have appeared to influence the work reported in this paper. The funders had no role in the design of the study; in the collection, analyses, or interpretation of data; in the writing of the manuscript, or in the decision to publish the results.
References
- Lang, L.; Fu-bao, Z. A comprehensive hazard evaluation system for spontaneous combustion of coal in underground mining. Int. J. Coal Geol. 2010, 82, 27–36. [Google Scholar] [CrossRef]
- Deng, J.; Xiao, Y.; Li, Q.; Lu, J.; Wen, H. Experimental studies of spontaneous combustion and anaerobic cooling of coal. Fuel 2015, 157, 261–269. [Google Scholar] [CrossRef]
- Xia, T.; Zhou, F.; Wang, X.; Zhang, Y.; Li, Y.; Kang, J.; Liu, J. Controlling factors of symbiotic disaster between coal gas and spontaneous combustion in longwall mining gobs. Fuel 2016, 182, 886–896. [Google Scholar] [CrossRef]
- Shi, Q.; Qin, B.; Liang, H.; Gao, Y.; Bi, Q.; Qu, B. Effects of igneous intrusions on the structure and spontaneous combustion propensity of coal: A case study of bituminous coal in Daxing Mine, China. Fuel 2018, 216, 181–189. [Google Scholar] [CrossRef]
- Qin, Y.; Liu, W.; Yang, C.; Fan, Z.; Wang, L.; Jia, G. Experimental study on oxygen consumption rate of residual coal in goaf. Saf. Sci. 2012, 50, 787–791. [Google Scholar] [CrossRef]
- Cheng, W.; Hu, X.; Xie, J.; Zhao, Y. An intelligent gel designed to control the spontaneous combustion of coal: Fire prevention and extinguishing properties. Fuel 2017, 210, 826–835. [Google Scholar] [CrossRef]
- Lu, Y. Laboratory Study on the Rising Temperature of Spontaneous Combustion in Coal Stockpiles and a Paste Foam Suppression Technique. Energy Fuels 2017, 31, 7290–7298. [Google Scholar] [CrossRef]
- Dong, S.; Lu, X.; Wang, D.; Wang, H.; Zheng, K.; Shi, Q.; Chen, M. Experimental investigation of the fire-fighting characteristics of aqueous foam in underground goaf. Process Saf. Environ. Prot. 2017, 106, 239–245. [Google Scholar] [CrossRef]
- Lu, X.; Zhu, H.; Wang, D.; Hu, C.; Zhao, H.; Huo, Y. Flow characteristic investigation of inhibition foam used for fire extinguishment in the underground goaf. Process Saf. Environ. Prot. 2018, 116, 159–168. [Google Scholar] [CrossRef]
- Lu, Y.; Shi, S.; Yang, F.; Zhang, T.; Niu, H.; Wang, T. Mo-doping for improving the ZrF4 coated-Li[Li0.20Mn0.54Ni0.13Co0.13]O2 as high performance cathode materials in lithium-ion batteries. J. Alloy. Compd. 2018, 767, 23–33. [Google Scholar] [CrossRef]
- Shan, B.; Wang, G.; Cao, F.; Wu, D.; Liang, W.; Sun, R. Mercury emission from underground coal fires in the mining goaf of the Wuda Coalfield, China. Ecotoxicol. Environ. Saf. 2019, 182, 109409. [Google Scholar] [CrossRef] [PubMed]
- Shi, Q.; Qin, B. Experimental research on gel-stabilized foam designed to prevent and control spontaneous combustion of coal. Fuel 2019, 254, 115558. [Google Scholar] [CrossRef]
- Xu, Y.-L.; Wang, D.-M.; Wang, L.-Y.; Zhong, X.-X.; Chu, T.-X. Experimental research on inhibition performances of the sand-suspended colloid for coal spontaneous combustion. Saf. Sci. 2012, 50, 822–827. [Google Scholar] [CrossRef]
- Dou, G.; Wang, D.; Zhong, X.; Qin, B. Effectiveness of catechin and poly(ethylene glycol) at inhibiting the spontaneous combustion of coal. Fuel Processing Technol. 2014, 120, 123–127. [Google Scholar] [CrossRef]
- Tang, Y. Experimental investigation of applying MgCl2 and phosphates to synergistically inhibit the spontaneous combustion of coal. J. Energy Inst. 2018, 91, 639–645. [Google Scholar] [CrossRef]
- Xue, D.; Hu, X.; Cheng, W.; Wei, J.; Zhao, Y.; Shen, L. Fire prevention and control using gel-stabilization foam to inhibit spontaneous combustion of coal: Characteristics and engineering applications. Fuel 2020, 264, 116903. [Google Scholar] [CrossRef]
- Qin, B.; Jia, Y.; Lu, Y.; Li, Y.; Wang, D.; Chen, C. Micro fly-ash particles stabilized Pickering foams and its combustion-retardant characteristics. Fuel 2015, 154, 174–180. [Google Scholar] [CrossRef]
- Tang, Y.; Wang, H. Experimental investigation on microstructure evolution and spontaneous combustion properties of secondary oxidation of lignite. Process Saf. Environ. Prot. 2019, 124, 143–150. [Google Scholar] [CrossRef]
- Li, M.; Wang, D.; He, S.; Shao, Z.; Shen, Y. Experimental study on foaming properties of anion-cation compound foaming agent to prevent coal spontaneous combustion. Colloids Surf. A Physicochem. Eng. Asp. 2019, 581, 123847. [Google Scholar] [CrossRef]
- Sijs, R.; Kooij, S.; Holterman, H.J.; van de Zande, J.; Bonn, D. Drop size measurement techniques for sprays: Comparison of image analysis, phase Doppler particle analysis, and laser diffraction. Aip Adv. 2021, 11, 15315. [Google Scholar] [CrossRef]
- Im, J.; Park, I.; Shin, D. Effect of atomization methods on the size and morphology of Gd0.1Ce0.9O2-delta powder synthesized by aerosol flame synthesis. Ceram. Int. 2012, 38, 2051–2058. [Google Scholar] [CrossRef]
- Min, L.Z.; Zhao, Z.X.; Jun, D.; Ming, C.F. Experimental Study on Aerosol Fire—Extinguishing Agent to Inhibit Coal Combustion. Saf. Coal Mines 2010, 41, 11–14. [Google Scholar]
- Kooij, S.; Astefanei, A.; Corthals, G.L.; Bonn, D. Size distributions of droplets produced by ultrasonic nebulizers. Sci. Rep. 2019, 9, 6128. [Google Scholar] [CrossRef]
- Ramisetty, K.A.; Pandit, A.B.; Gogate, P.R. Investigations into ultrasound induced atomization. Ultrason. Sonochem. 2013, 20, 254–264. [Google Scholar] [CrossRef]
- Dalmoro, A.; Barba, A.A.; d’Amore, M. Analysis of Size Correlations for Microdroplets Produced by Ultrasonic Atomization. Sci. World J. 2013, 2013, 482910. [Google Scholar] [CrossRef]
- Kudo, T.; Sekiguchi, K.; Sankoda, K.; Namiki, N.; Nii, S. Effect of ultrasonic frequency on size distributions of nanosized mist generated by ultrasonic atomization. Ultrason. Sonochem. 2017, 37, 16–22. [Google Scholar] [CrossRef]
- Tang, Y.; Guo, Q.; Yerman, L. Experimental Investigation on Using Chloride/Hydroxide Aerosol to Control Spontaneous Combustion of Lignite in Underground Coal Mines. Energy Fuels 2020, 34, 10607–10618. [Google Scholar] [CrossRef]
- Jia, L.; Yu, Y.; Li, Z.P.; Qin, S.N.; Guo, J.R.; Zhang, Y.Q.; Wang, J.C.; Zhang, J.C.; Fan, B.G.; Jin, Y. Study on the Hg(0) removal characteristics and synergistic mechanism of iron-based modified biochar doped with multiple metals. Bioresour Technol. 2021, 332, 125086. [Google Scholar] [CrossRef]
- Lang, R.J. Ultrasonic atomization of liquids. J. Acoust. Soc. Am. 1962, 34, 6–8. [Google Scholar] [CrossRef]
Publisher’s Note: MDPI stays neutral with regard to jurisdictional claims in published maps and institutional affiliations. |
© 2022 by the authors. Licensee MDPI, Basel, Switzerland. This article is an open access article distributed under the terms and conditions of the Creative Commons Attribution (CC BY) license (https://creativecommons.org/licenses/by/4.0/).