1. Introduction
When dealing with the environmental impact issues related to the emission of air pollutants from industrial activities (production of energy, production and processing of minerals, metals production, etc.), a number of fugitive dust sources must be taken into consideration, in addition to typical conveyed sources. In fact, those industrial plants often comprise outdoor facilities where the handling, transportation, and storage of bulk materials take place. Depending on the mineralogical and physical properties of the materials involved in the process (raw materials, semi-products, end-products and waste materials), some concerns may arise about the emission of Particle Matter (PM) and the consequent impact on the atmosphere. In fact, fine (d < 10 µm) and ultra-fine fractions (d < 4 µm) of PM might be embodied in the granular material under consideration and released into the air to be transported at long distances from the emission source.
Although it is relatively easy to estimate the Emission Factors (EFs) of conveyed sources, the characterization of fugitive dust sources is rather complicated in relation to the many variables on which the emission phenomenon depends: physical properties of the bulk materials involved in the production processes, transportation cycle and type of earth-moving machinery in use, state of unpaved roads and storage practices, as well as the meteorological conditions of the specific site under consideration.
The availability of consistent site-specific algorithms to be used as input parameters in the prediction of PM dispersion into the air represents, in fact, an essential issue in the Environmental Impact Assessment studies (EIA Directive [
1]), which commonly require the implementation of air dispersion codes to estimate the impact at the receptors and validate the effectiveness of risk reduction measures [
2,
3]. The accuracy of the environmental impact evaluation (i.e., air dispersion simulation) strongly depends on the consistency of the EFs representing the fugitive dust sources under investigation.
This article specifically deals with the emission of PM from the open storage of solid bulk materials exposed to wind erosion (i.e., industrial wind erosion).
Apart from the typical anemological conditions of the site under consideration, a number of physical variables affect a stockpile emission potential, such as the pile′s dimension, shape and orientation, the size distribution of the elementary particles or particles aggregates (PSD or ASD respectively) that form the granular material, and its silt and moisture content. According to the United States Environmental Protection Agency (US-EPA) [
4], a substantial difference occurs between stockpiles with limited and unlimited erosion potential. Stockpiles of nonhomogeneous material with non-erodible elements (i.e., particles or particles aggregates larger than 1 cm) have limited erosion potential: when the wind speed exceeds the characteristic threshold friction velocity of the erodible particles/particle aggregates, the pile surfaces are rapidly deprived of their erosion potential until a mechanical disturbance occurs and new erodible elements emerge to be removed by the succeeding erosion event. Stockpiles of homogeneous fine material, on the other hand, may provide a continuous flow of dust aerosol, unless natural or artificially induced crusting binds the erodible grains together. Typical examples of unlimited dust sources are the wide and flat surfaces of the tailing basins (i.e., deposits of metallurgical processing residue) [
5,
6].
This research deals with the emission of dust from the surfaces of nonhomogeneous material (i.e., limited erosion potential) stacked up against three walls (i.e., open bay storage), which is a storage configuration commonly adopted to prevent raw material contamination (i.e., preserve product requirements) and, at the same time, enables the loading/dumping operations by means of earth-moving vehicles [
7].
The simplest and most widely used model to estimate the emission of PM from the open storages of bulk material was developed by the US-EPA [
4]. The EPA model (Emission Factor for industrial wind erosion) is based on the results of experimental tests and provides an estimate of the emission potential (P), which depends on the wind field near the pile surfaces. However, only two simple configurations are analyzed by EPA, a flat-top oval stockpile and a conical stockpile. Hence, in order to apply the EPA procedure to different and more complex geometries, the wind field around the stockpile needs to be derived. The pioneering work by Badr and Harion [
8] shows how this objective can be pursued by means of numerical simulations. Despite the limitations of this procedure, the feasibility to apply a CFD approach combined with the EPA methodology is meaningful since in operative contexts it would be unfeasible, yet more accurate, to physically test real configurations. A considerable number of recent studies have applied the CFD approach to investigate the effect on the emission of different features in the stockpile set-up. Various stockpile properties and layouts have been analyzed: the impact of pile height for oblong sharp-crested stockpiles [
8], the differences in the emission potential of sharp-crested and flat-top heap [
9], as well as the emission properties of semi-circular shaped heaps [
10].
In particular, the combined implementation of the CFD approach and the EPA methodology has been applied to evaluate the effectiveness of mitigation measures for erosion prevention and control: Santiago et al. [
10] investigated the reduction in the emission potential provided by straight and curved windbreak fences, and Cong et al. [
11] tested the sheltering effect of multiple stockpiles configurations. Some authors have analyzed the protective effect of porous barriers [
12,
13,
14,
15], whereas the effect of the open bay walls on the emission potential has not yet been addressed. Numerical simulations and the EPA emission model (Emission Factor for Industrial wind erosion [
4]) are hereby applied to quantify the erosion potential of open bay storage of metal sulphides. Different open bay geometries and variable volumes of bulk material are taken into account. The results show a great variability in the erosion potential depending on the wind direction. The outcomes of the simulations were also analyzed to define a methodology to be easily customized to specific industrial sites, aiming at defining the best storage configuration for PM emission prevention and control, as well as operative protocols to selectively apply traditional protective measures, such as surface watering and particles binding treatments.
2. Materials and Methods
The research study hereby discussed includes some preliminary activities that were mainly focused on the acquisition of relevant information about the case study: the characterization of the two ores under investigation (lead and zinc sulphides) and the definition of the typical and more representative stockpile geometries. As regards the bulk materials, in particular, laboratory tests were performed to derive all physical parameters affecting the erosion/emission phenomenon. Representative samples of lead and zinc sulphides were provided by a major industrial company that operates in the commodity sector for the production of non-ferrous metals. Many details about the materials under investigation and the typical stockpiles configurations were directly acquired by means of field surveys.
The succeeding fundamental phase of the research activity includes the numerical simulation, which was first performed on the EPA reference case (oval flat-topped pile) and then with the 4 realistic open storage configurations.
2.1. EPA Methodology
According to USEPA [
4] (AP42—Compilation of air pollutant emission factors-13.2.5 Industrial wind erosion), the particle flow from a dry surface with limited erosion potential (i.e., finite availability of erodible material) can be estimated by means of Equation (1):
where
EF (Emission Factor) is expressed in terms of mass emitted by surface unit per year [g/m
2yr], k is the particle size multiplier (PM30; PM15; PM10 and PM2.5),
N is the number of mechanical disturbances per year, which restore the surface emission potential, and
P is the emission potential corresponding to the observed (or probable) wind fastest mile in the
i-th period between succeeding mechanical disturbances. The emission potential
P is expressed in terms of dust emitted per surface unit [g/m
2] by Equation (2):
where
is the friction velocity and
is the threshold friction velocity of the bulk material under investigation, which is calculated by means of Equation (3):
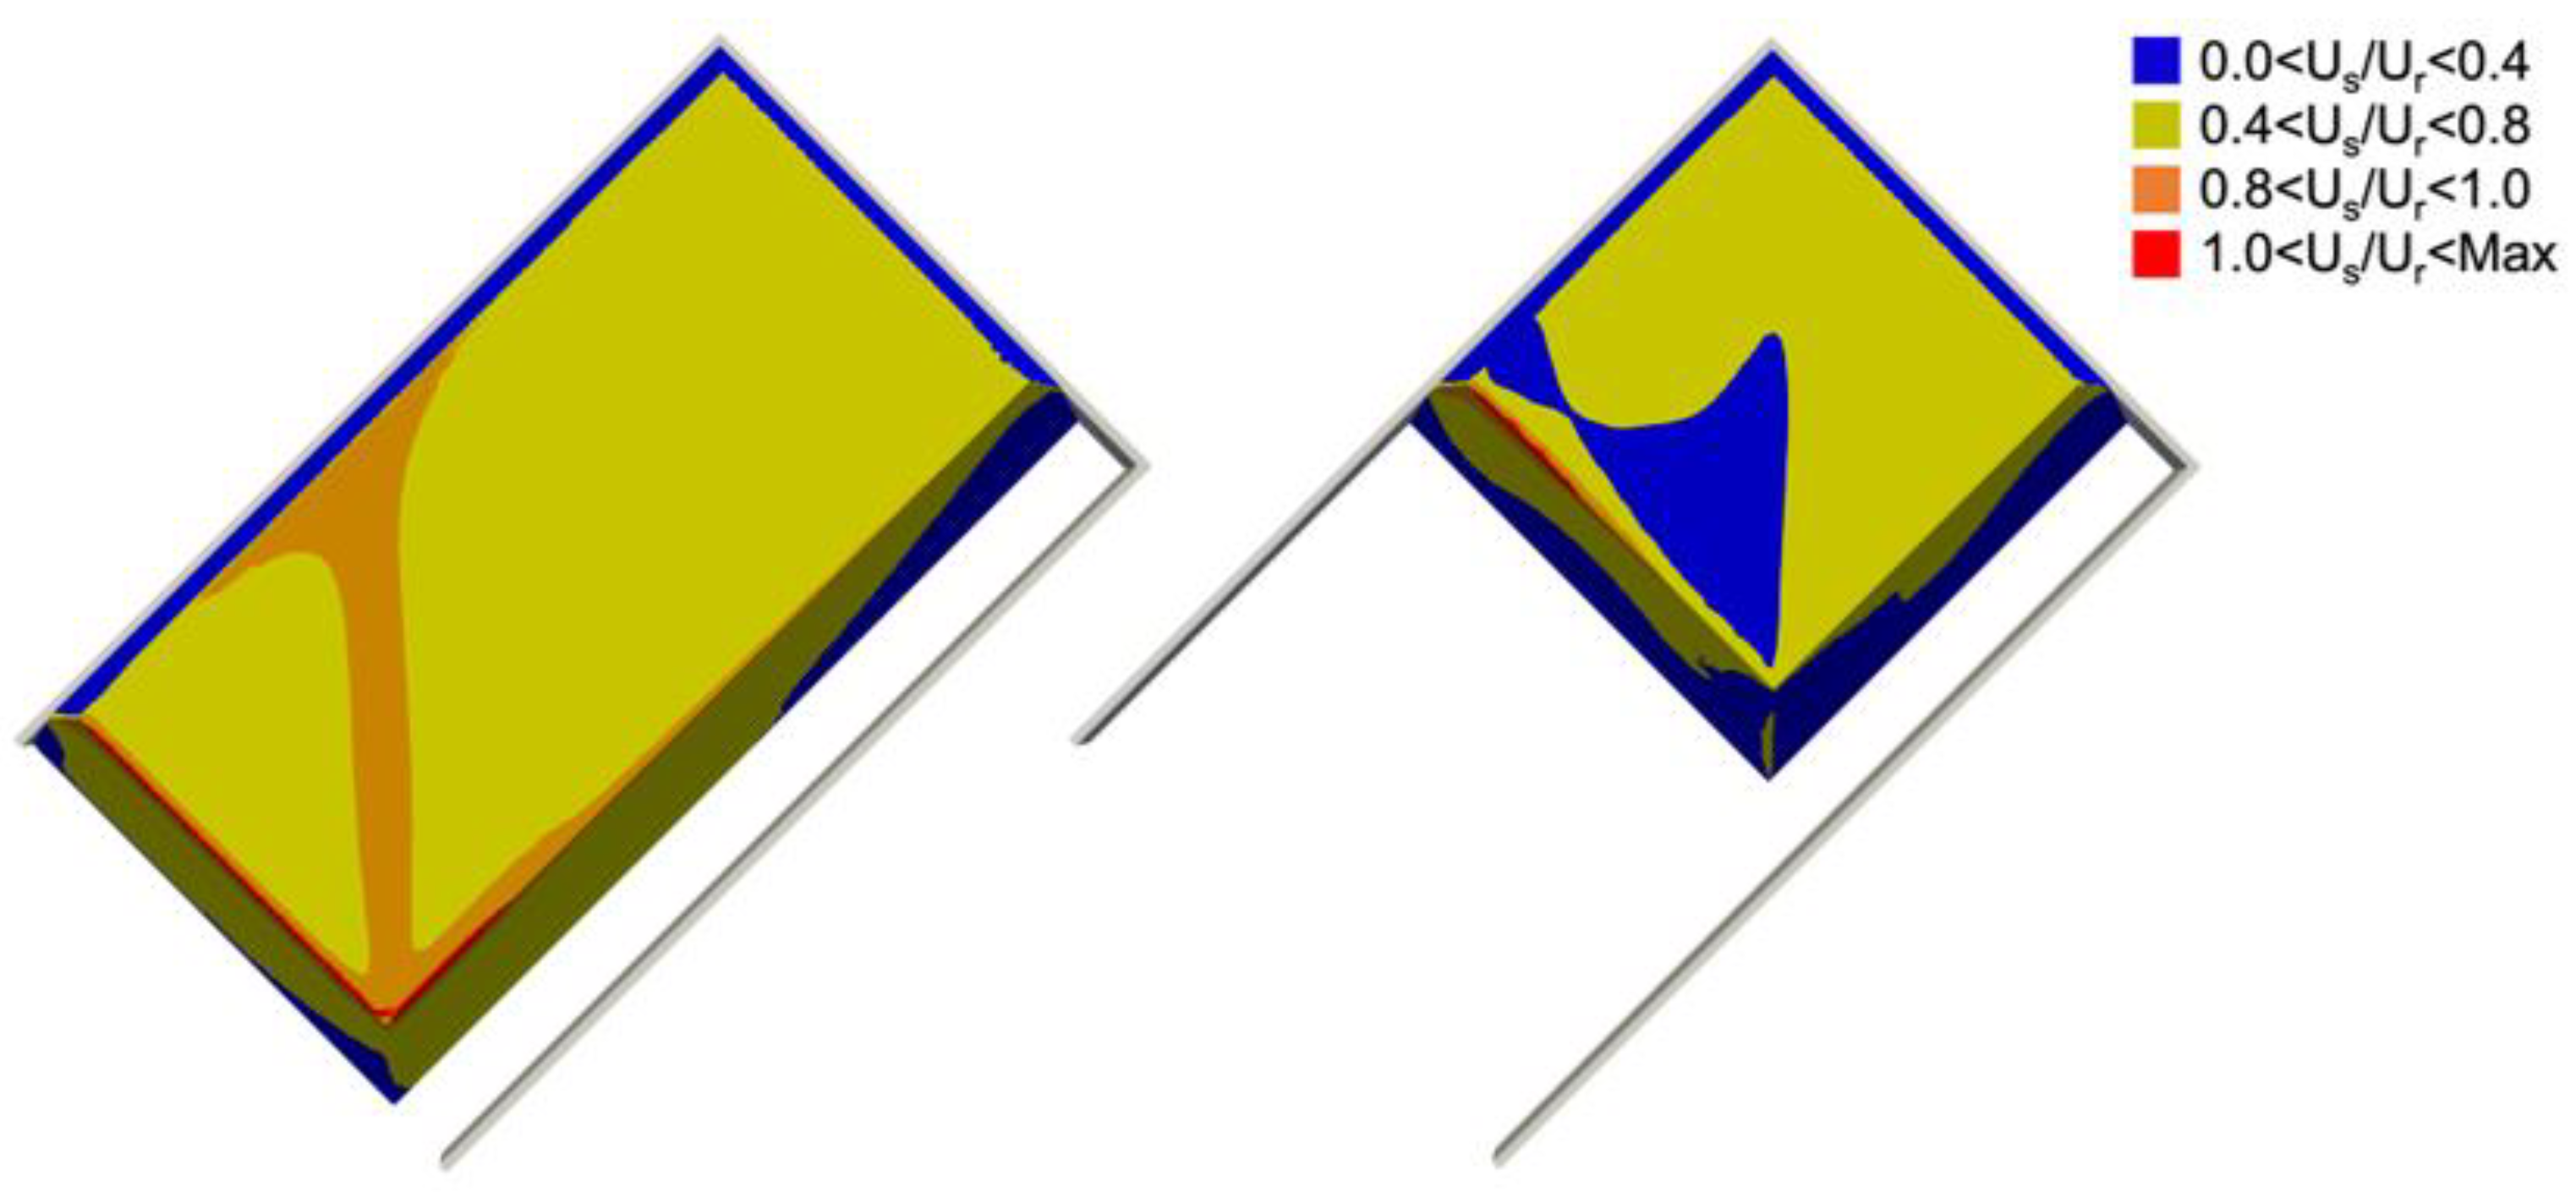
The use of Equation (2) requires the knowledge of the normalized wind speed contours, expressed as the ratio of the average speed at 25 cm (us) from the exposed heap surfaces to the average speed of the wind at 10 m (ur). For two ordinary pile shapes (conical and oval with flat top, with 37° of side slope), EPA provides the required wind contours and thus, the possibility of estimating the overall PM emission over a year time.
2.2. Numerical Simulations
Numerical simulations were performed to solve the flow around different pile configurations and subsequently apply the EPA method. Specifically, the three-dimensional Reynolds Averaged Navier–Stokes (RANS) equations were solved using the open source CFD library OpenFOAM, which has been extensively and successfully used to perform numerical simulations of the wind flow around obstacles both in urban and industrial environments [
16,
17,
18,
19,
20]. The model numerically solves equations of mass and momentum conservation:
where
is the mean velocity component along the
i direction,
is the average pressure,
is the density, and ν is the kinematic viscosity of the airflow. In order to model the turbulent Reynolds stresses,
, the two-equations
k-
ε closure is adopted. SimpleFoam, a steady state solver for incompressible turbulent flow, based on the SIMPLE algorithm, is applied. Second order schemes for discretization are adopted, and a threshold of 10
−6 for scaled residuals is chosen as a convergence criterion [
8].
Before applying the numerical model to compute the flow around the configurations of interest (as described in
Section 3.2), the model was validated in one of the two simple case studies experimentally investigated by EPA [
4]: an oval flat topped pile (coded B1).
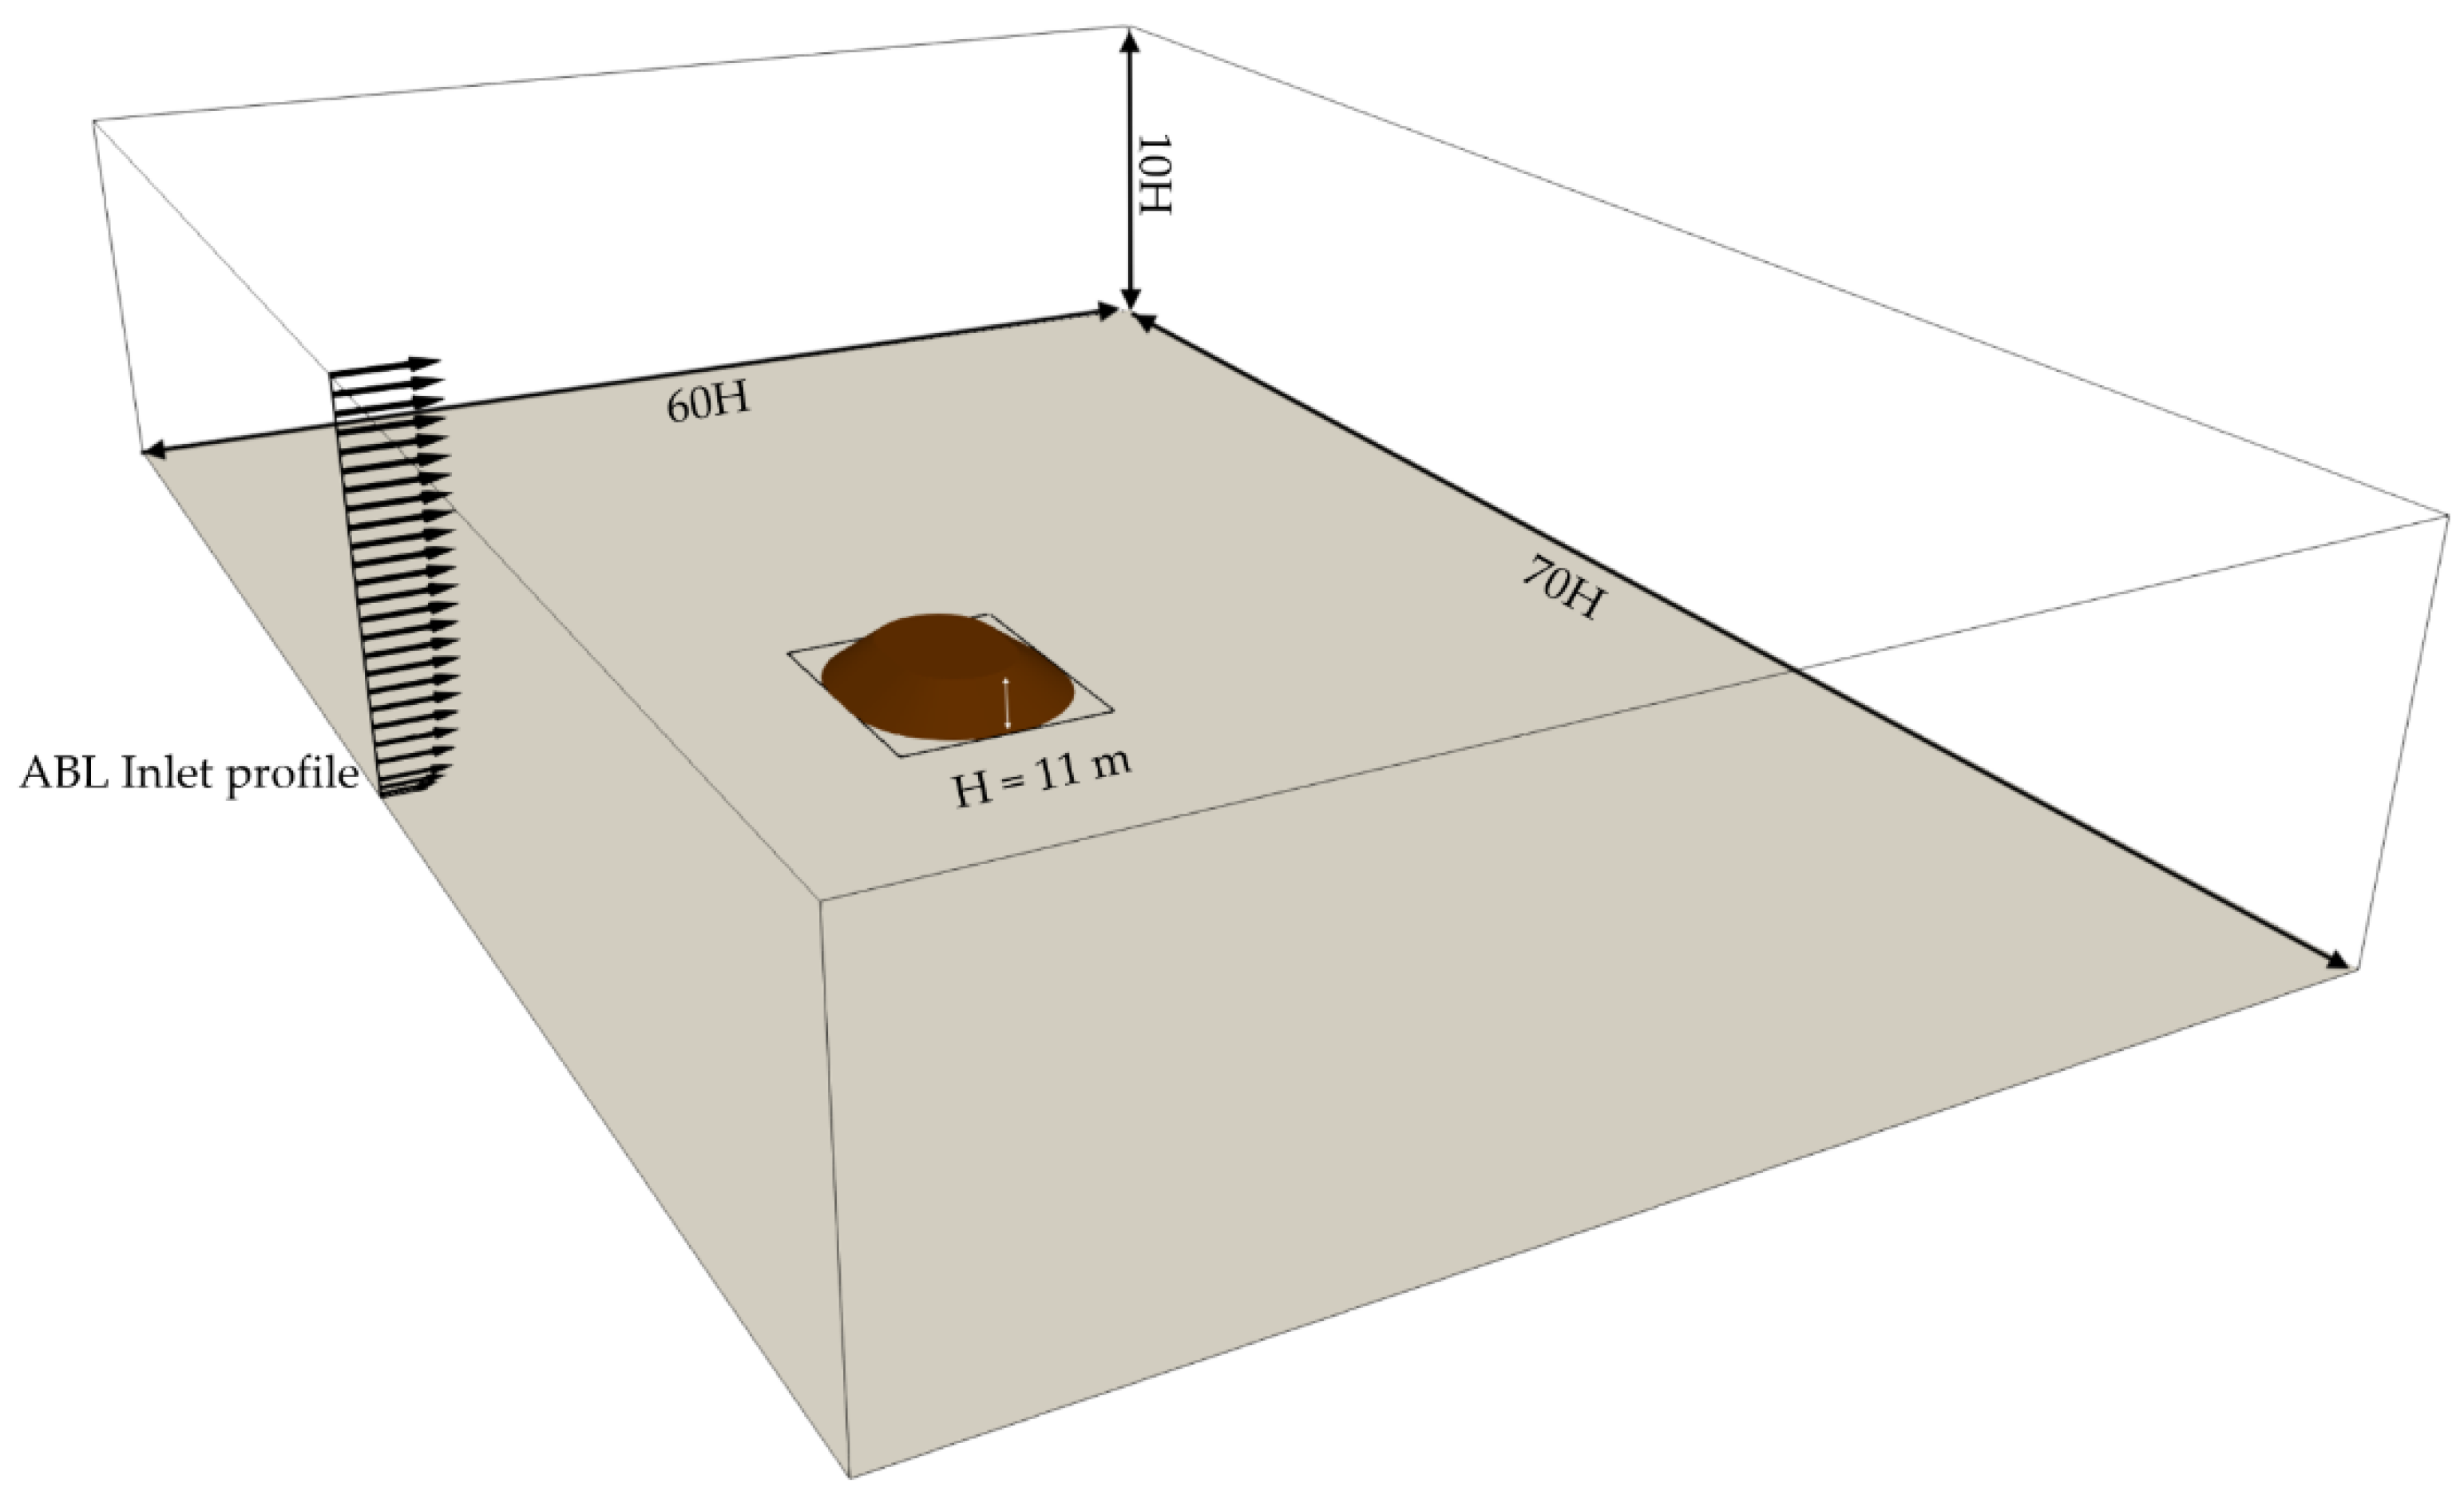
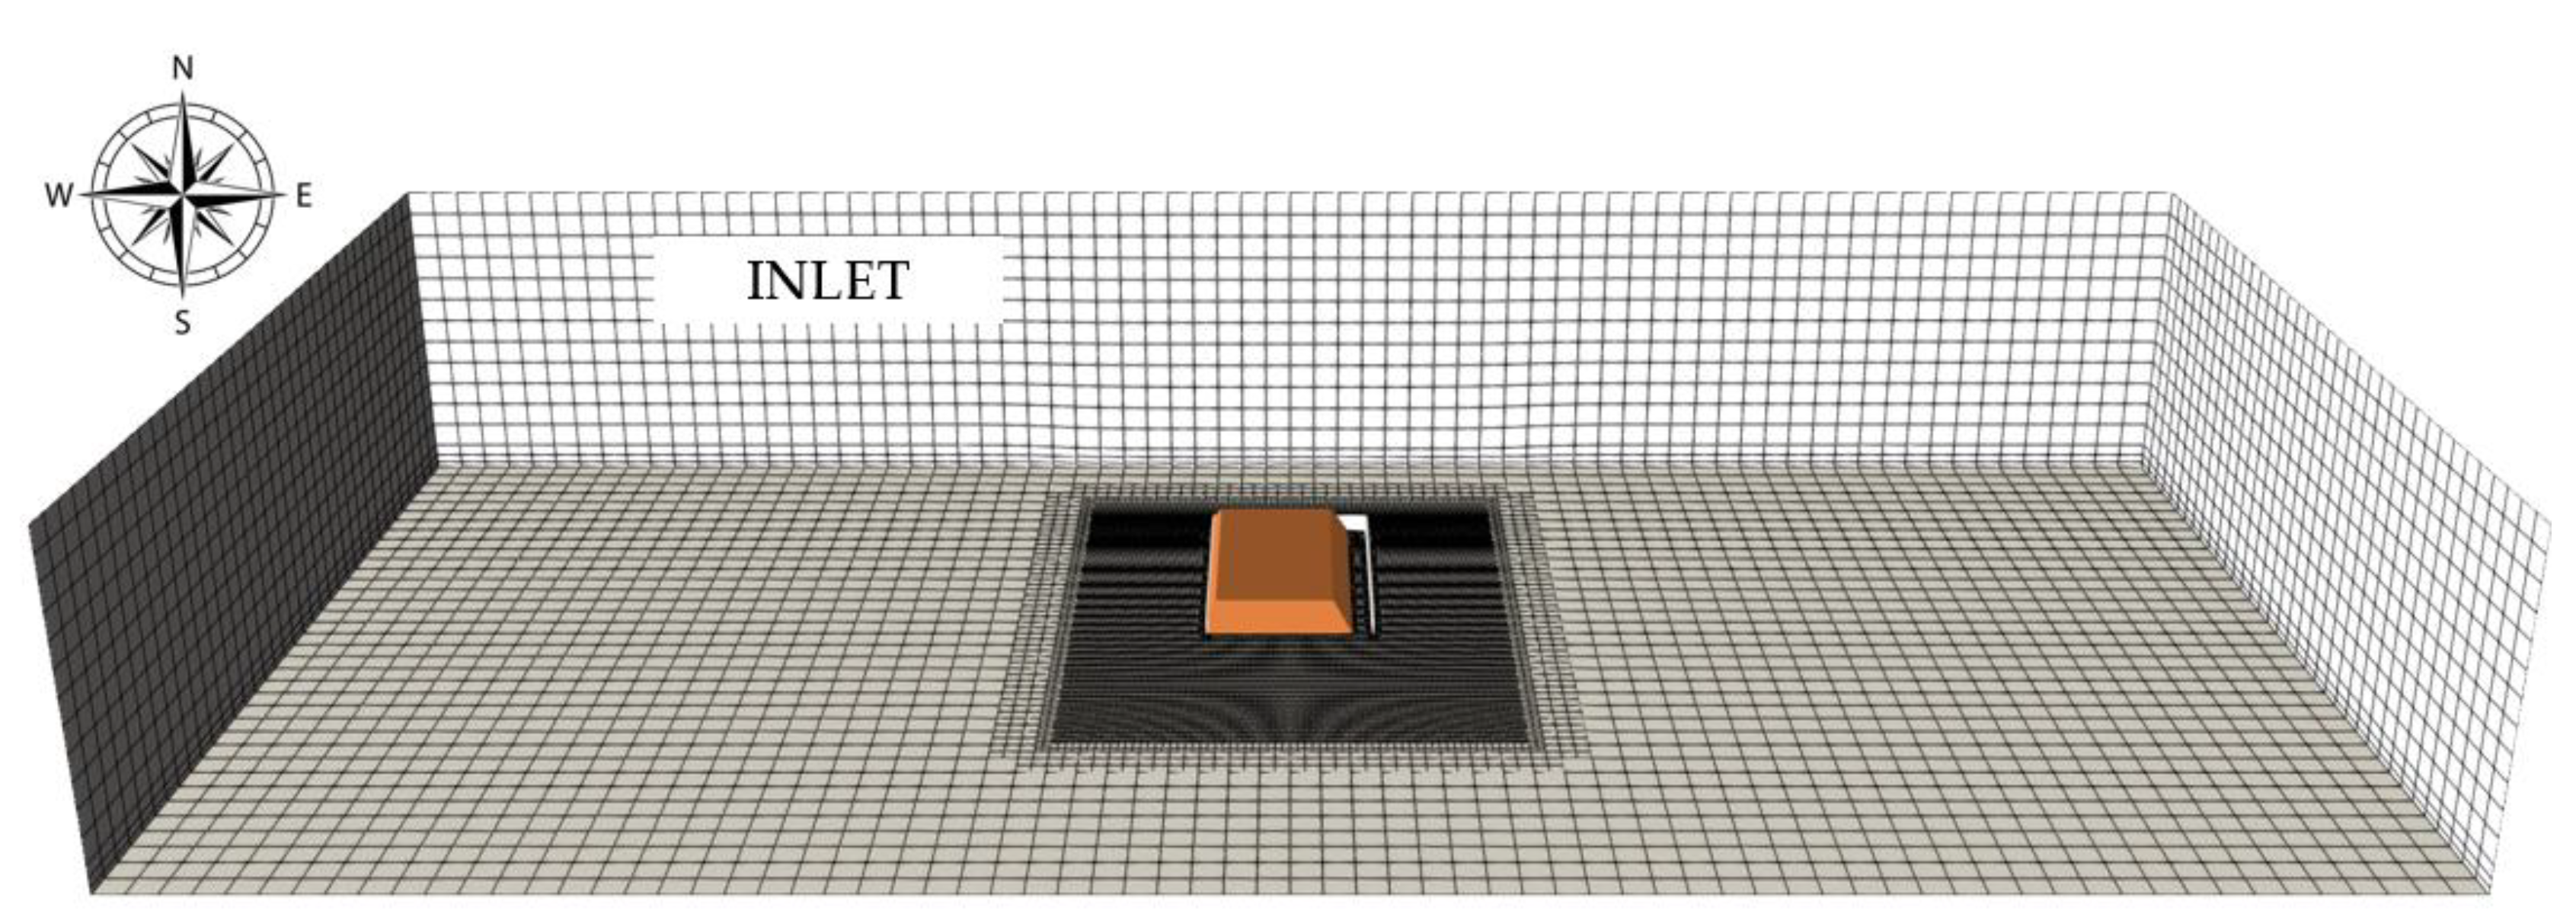
Specifically, each of the tested configurations is considered as isolated inside a domain whose dimensions are set according to the literature prescriptions [
21], which are aimed at avoiding unwanted acceleration over and around the obstacle. Namely, a directional blockage ratio not exceeding 17% is set in both vertical and horizontal directions. The inlet is 5
Hmax upstream the obstacle (
Hmax is the pile height), and the outlet is placed 15
Hmax downstream the pile to allow for the correct wake development. The domain height is 6
Hmax (
Figure 1).
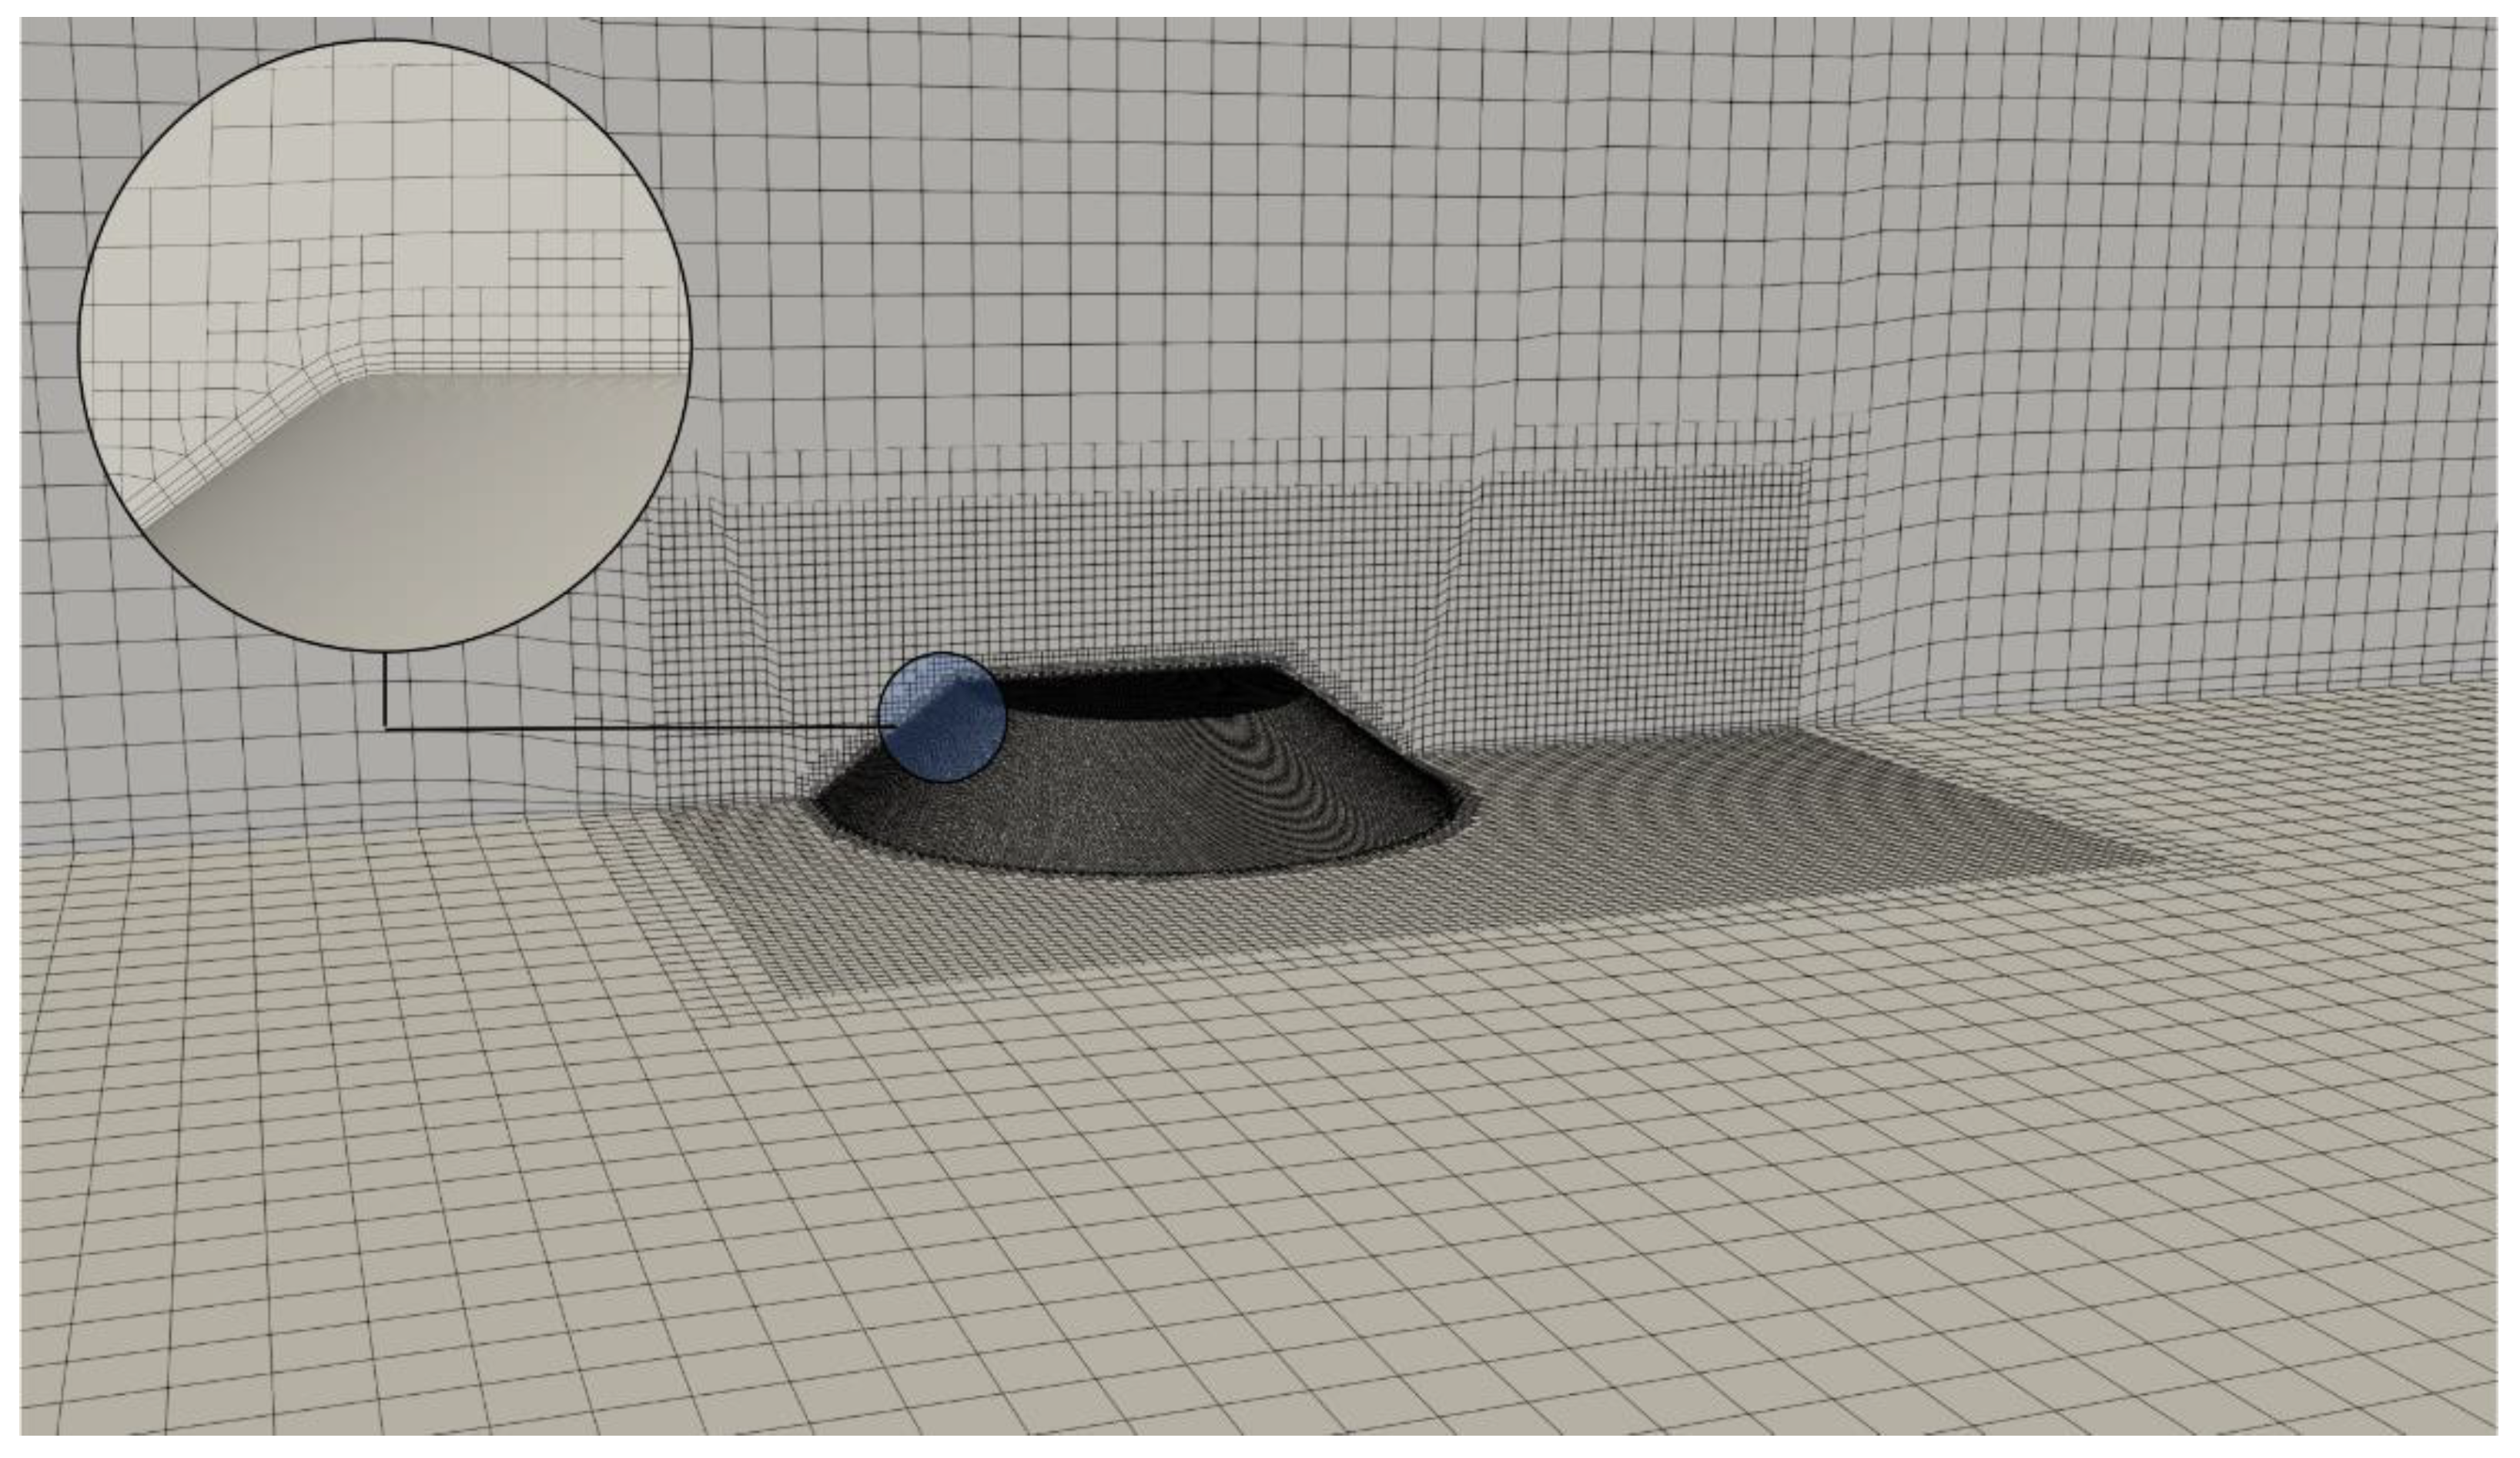
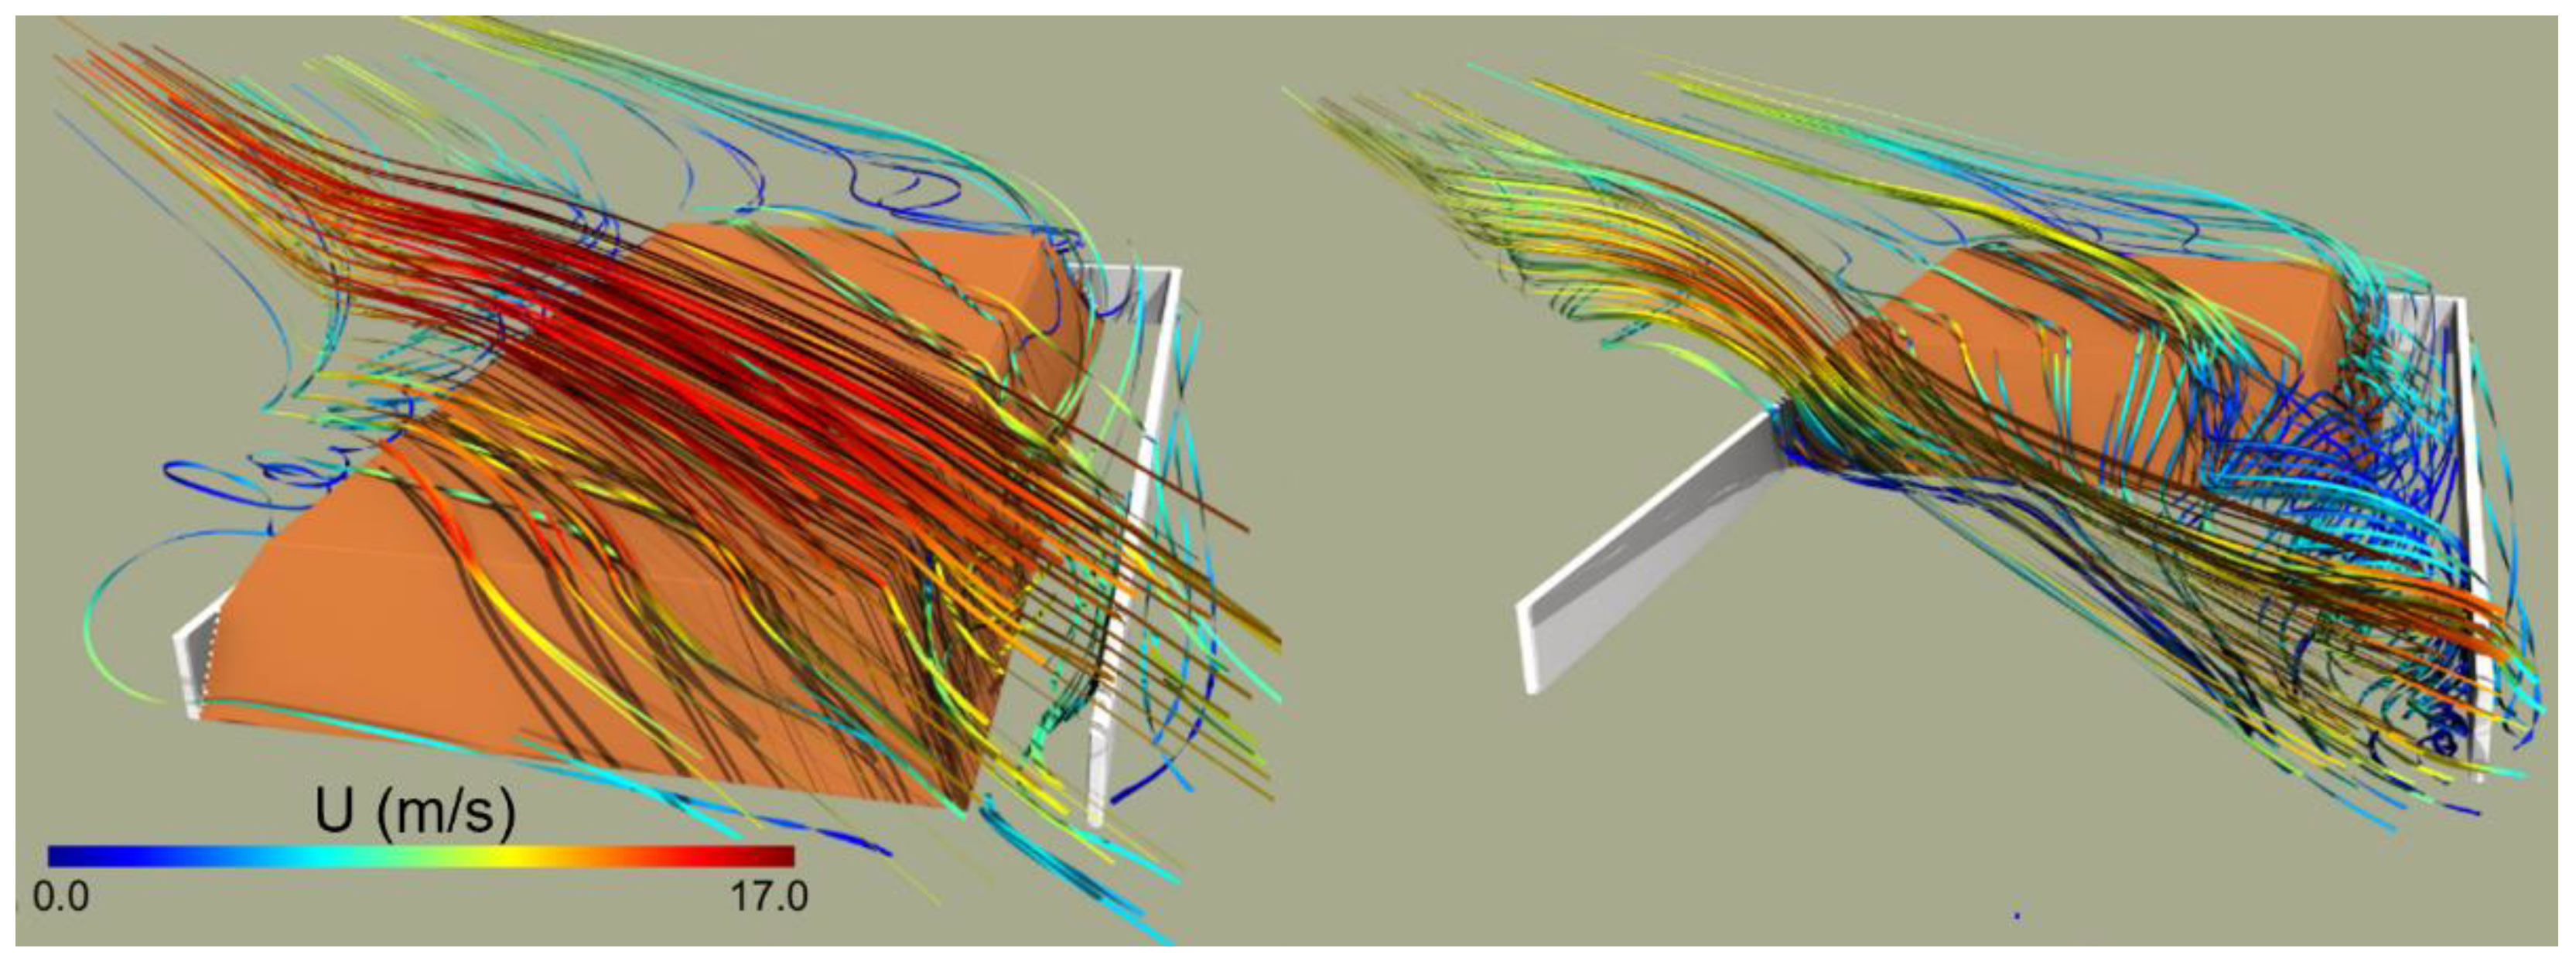
As for boundary conditions, an atmospheric logarithmic profile is imposed at the inlet (corresponding to a velocity equal to 13.7 m/s at 10 m in height), a zero-gradient condition at the outlet, and no-slip condition at the walls and on the pile. The near-wall region of the turbulent boundary layer is fully modelled via the use of wall-functions and not resolved explicitly due to the high Reynolds number of the flow, in order to relax the mesh resolution requirement at the wall and reduce the computational effort requested by the model. SnappyHexMesh was used to obtain a body conformal hex-dominant mesh, with local surface and volume refinements (
Figure 2). A grid sensitivity test was performed to assess the robustness of the model. For the validation configuration, the adopted computational grids ranged from 0.8 to 3.8 million of cells.
The CFD results, which are not reported here for the sake of brevity, were compared with the EPA experimental results in terms of qualitative airflow, wind exposure, and emission potential. The numerical computation provides a good representation of the flow around the pile and, albeit some inevitable differences in the isosurface of the
us/
ur ratios, the simulation provides comparable results in terms of emission potential,
P, with an overestimation of
P lower than 10%. This result is comparable to other numerical studies [
10,
11].
Hence, despite the inherent limitations of the numerical approach (discussed in
Section 4), the model can be considered reliable to assess the airflow around stockpiles and subsequently apply the EPA algorithms to estimate the emission potential (
P). Accordingly, the numerical setup adopted for the validation case was applied to the case-studies under investigation (i.e., open bay storages).
2.3. Case Study: Material Characterization
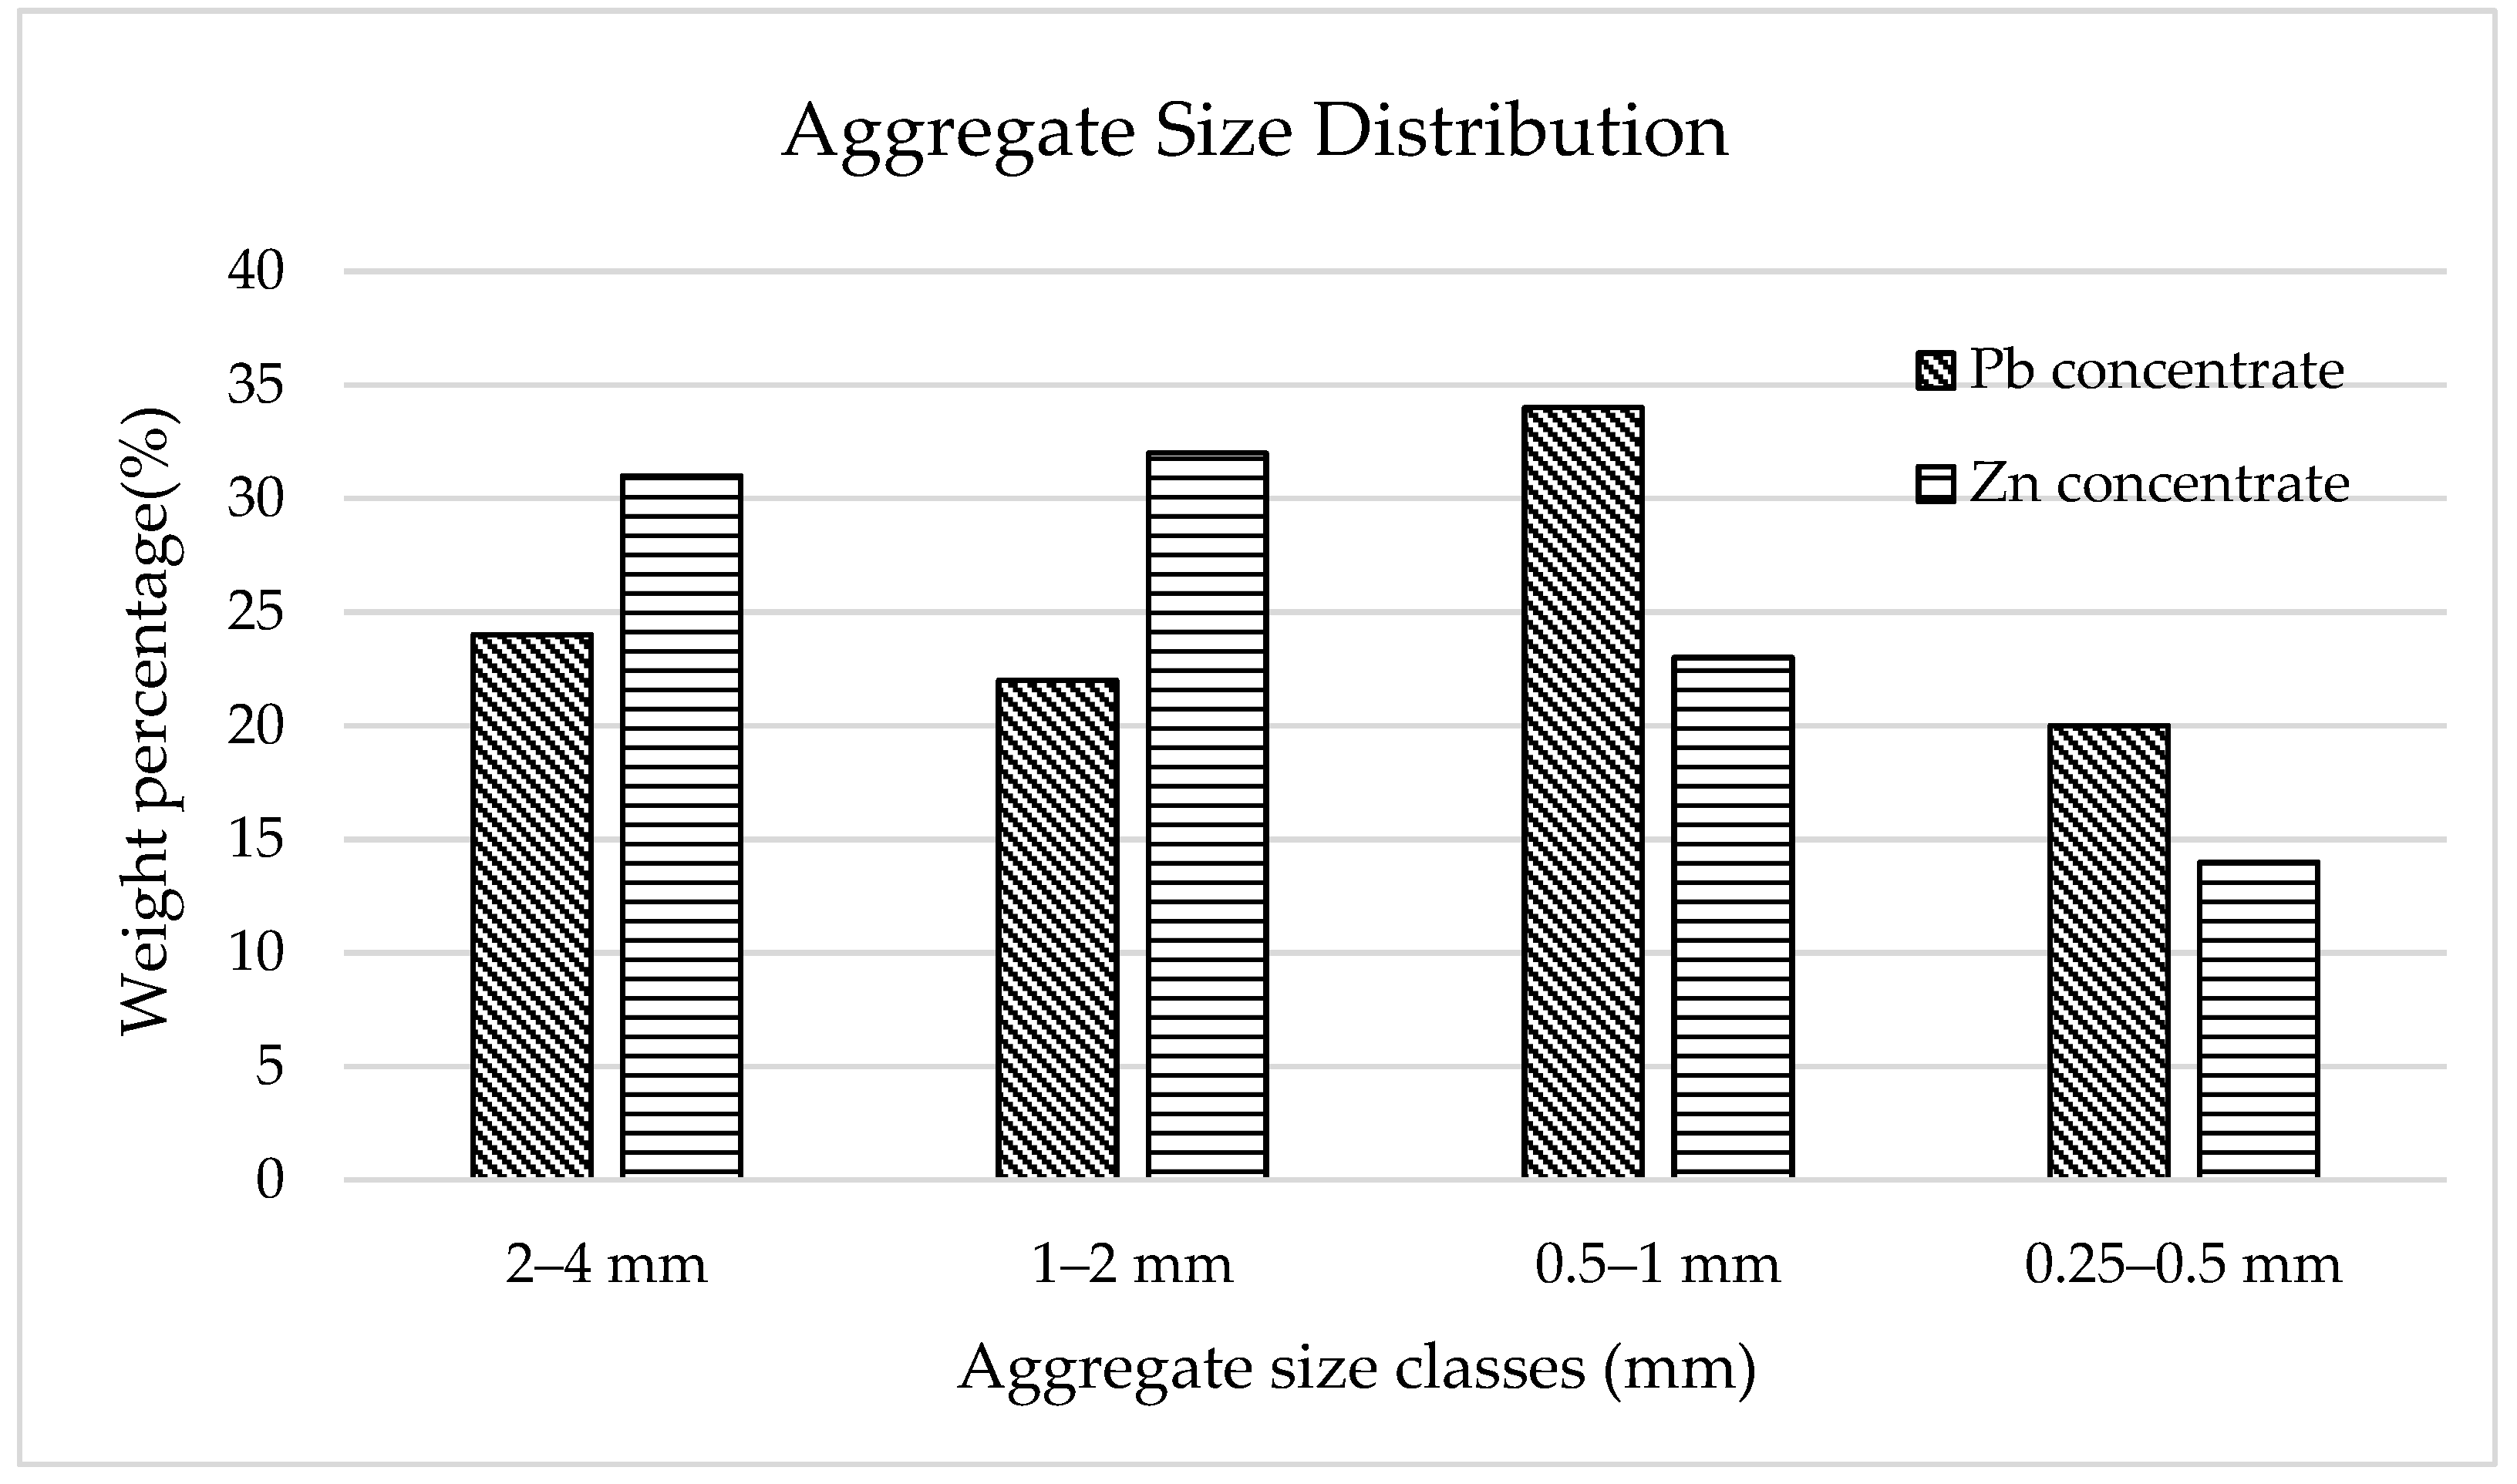
Lead glance (PbS) and zinc blende (ZnS) are two metal sulphides used as raw materials for the production and processing of lead and zinc. The main physical properties of the two materials under investigation were derived from representative samples of 30 × 30 cm, deprived of their coarser fraction (particle aggregates with diameter larger than 1 cm), and oven-dried for 48 h at 40 °C up to a 3% residual moisture content (assumed as dry condition). A nest of sieves with openings of 4, 2, 1, 0.5, and 0.25 mm was used to perform the aggregate size analysis, according to the procedure suggested by EPA [
4]. The histogram in
Figure 3 represents the mean aggregate size distribution (ASD) for the two ores. The results of the ASD analysis show that the lead glance contains a higher percentage of small aggregates (i.e., lower mode) compared to the zinc blend: this outcome can be explained by the greater cohesion energy of the zinc blende elementary particles [
22].
Table 1 reports the relative quantities of catch within each sieve, the ASD mode, and the inferred threshold friction velocity (
) [
4,
23], and shows that lower values of
are associated to the lead glance, with a resulting
(PbS)/
(ZnS) ratio of 0.72.
In addition to the ASD analysis, PM emission tests were carried out in the Environmental Wind Tunnel (EWT) recently designed and set up in the laboratories of Cagliari University: PM concentration values were measured at 2.0 cm from the ore samples for increasing wind velocity, by means of an optical analyzer (DUSTTRAK DRX 8533).
Table 2 reports the mean values of the threshold velocity at 2.0 cm (
ut2.0) for the two materials under investigation and the corresponding values at 25 cm (
ut25), which were derived from the wind profiles simulated in the tunnel [
6]. The ratio
(PbS)/
(ZnS) obtained from the tunnel tests is roughly 0.76, and thus in agreement with the ratio
(PbS)/
(ZnS) derived from the ASD analysis (
Table 1).
Table 2 also reports the density of the two materials (from the technical data sheets) and the dispersiveness class reported by the IPPC Reference document (Integrated Pollution Prevention and Control) [
7], in accordance to the classification suggested by Netherland Emission Guidelines for air [
24], which indicates a higher dispersion hazard for the lead glance (S2—highly drift sensitive) compared to the zinc blende (S4—moderately drift sensitive). The higher emission potential of the lead glance is also confirmed by the results of a recent study on the effect of the material physical properties on the erosion/emission mechanisms [
22].
2.4. Case Study: Stockpiles Configurations
According to the IPPC Reference document [
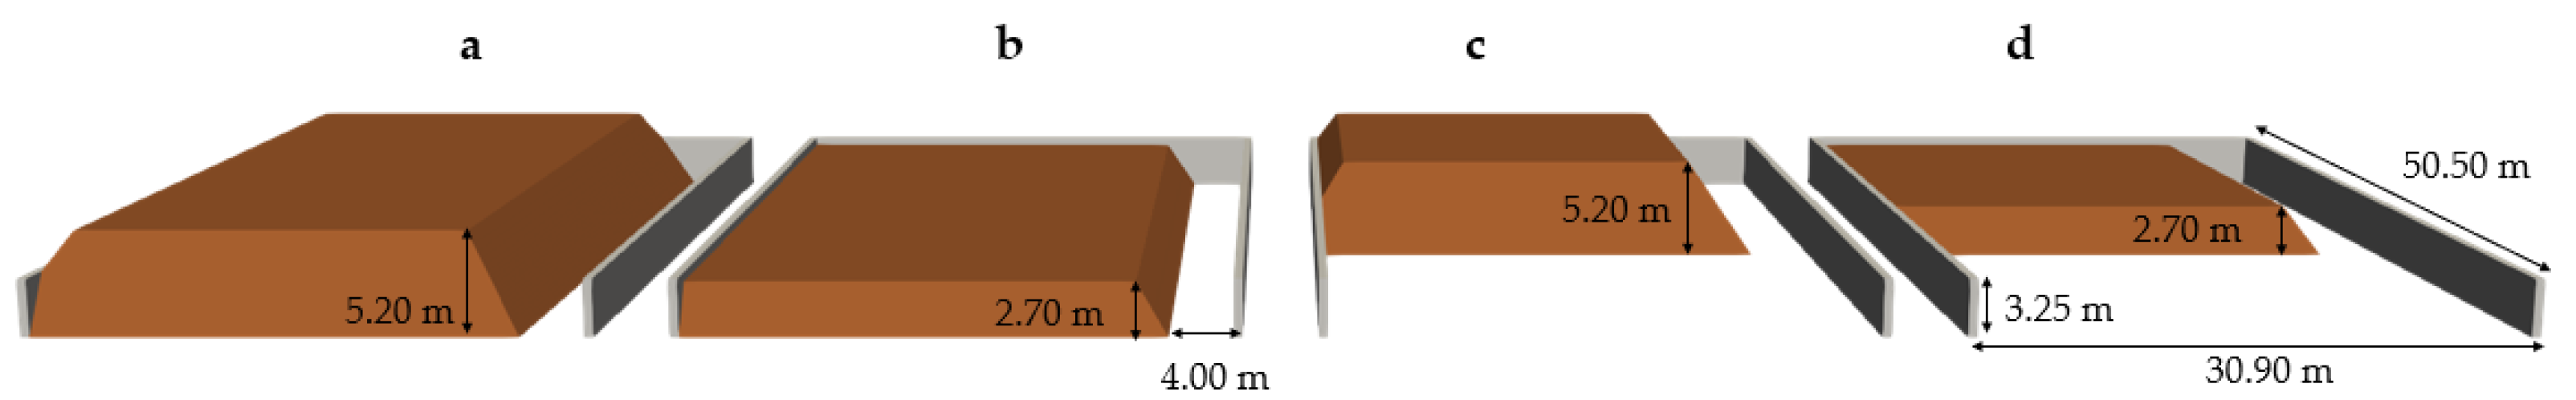
7], open bays are defined as heaps enclosed within three walls and are commonly used for storage of ore and concentrates in the production and processing of metals. The four open bay configurations represented in
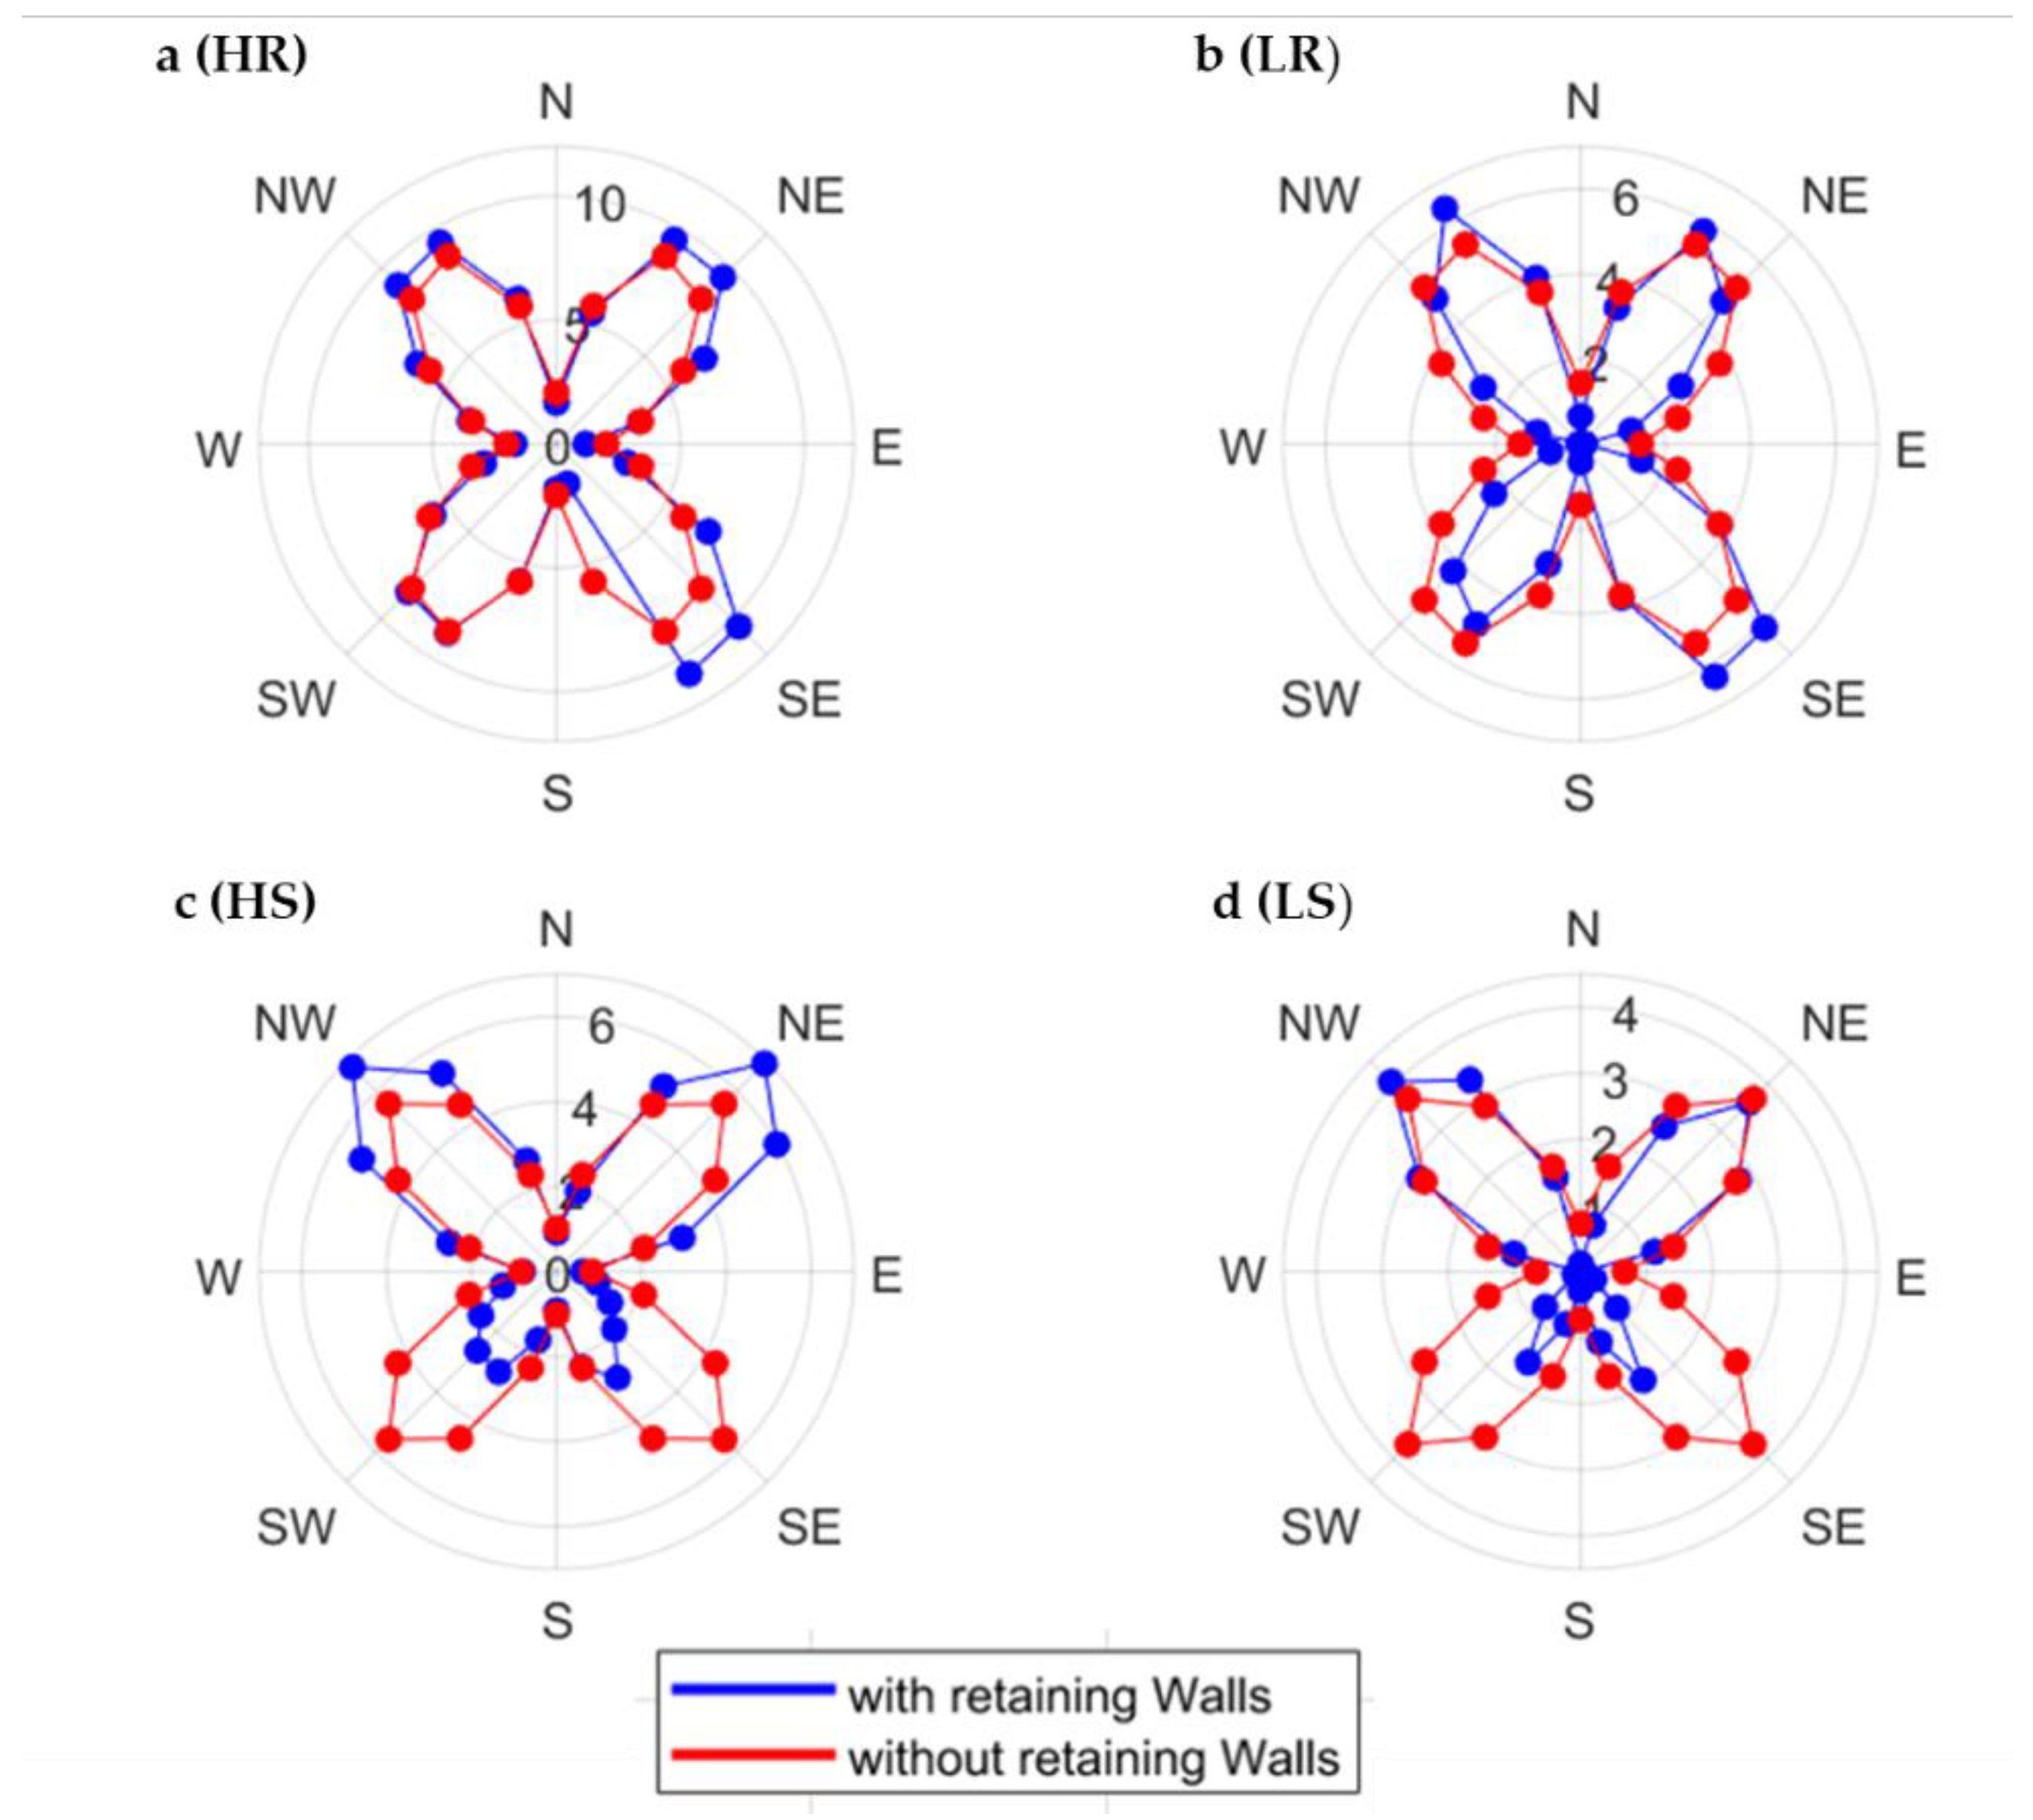
Figure 4 were hereby analyzed (two planar footprints and two pile heights): a high rectangular pile (HR, plot a), a low rectangular pile (LR, plot b), a high square pile (HS, plot c), and a low square pile (LS, plot d).
The adopted configurations allow for the understanding of the effectiveness of the enclosing walls in different operative conditions: fully (a and b plots) and partially filled (c and d plots) bays and height of stacked material exceeding (a and c cases, Hmax = 5.20 m), or not (b and d cases, Hmax = 2.70 m), the bay walls (H = 3.00 m). The numerical simulations were performed with and without U-shape enclosing walls, while the open bay was rotated inside the domain to consider 24 incoming wind directions. The variation of the wind direction allows in fact a comprehensive analysis of the wall effectiveness under different exposure conditions. This may be useful to assess the best stockpile orientation with respect to the prevailing winds or, if coupled to a wind rose of a specific site, to assess the overall potential erosion risk according to the local meteorological conditions.
In order to simulate the flow field inside a fixed domain (i.e., fixed dimension for all the cases under investigation) and, at the same time, maintain the blockage ratio adopted for the validation case, the size of the numerical domain was defined on the basis of the diagonal dimension (L
max = 59.2 m ≈ 60 m) and the maximum height (H
max = 5.2 m ≈ 6 m) of the heap. As shown in
Figure 5, the conservativeness of the condition on the directional blockage ratio determines a wider domain in the spanwise than in the streamwise direction.
An incoming logarithmic profile was simulated, with
Uref = 13.5 m/s at
zref = 10 m (i.e.,
U10) and roughness height
z0 = 0.5 m on the bottom, which corresponds to rough terrain (i.e., industrial settlements), according to the Davenport-Wieringa classification [
25]. This profile corresponds to turbulent conditions, with a Reynolds number (based on the inlet velocity at the obstacle height) greater than the critical condition for the flow to be independent of the Reynolds number (i.e., 15,000 [
26]). This guarantees the normalized wind speed ratios,
us/
ur, to be independent of the wind speed of the incoming flow,
U10.
4. Discussion: Limitations and Practical Implications
The study is affected by some inherent limitations. Although friction velocity on the stockpile surface can be directly computed from shear stresses obtained from the simulation, the choice of applying the simplified EPA relationship (Equation (3)) was preferred, since
us/ur ratio are less dependent on the simulation setup, and more coherent results with the EPA validation case were obtained when applying the same procedure. Moreover, the presence of other obstacles or buildings, as well as the shadow effect in case of layouts with multiple stockpiles highly affect the flow patterns, exerting a different effect according to the wind direction [
9,
11]. Nonetheless, the choice of examining isolated stockpiles and modelling the incoming flow over a homogeneous terrain without explicitly considering other nearby obstacles or orographic effects was here motivated by the aim of isolating the sole contribution of the enclosing walls on the reduction of pile fugitive emission.
It is also worthwhile recalling that other factors highly affect the emission, such as the type of material, the moisture content, and the presence of crusts or of film protection. Emissions from operative tasks such material stacking and reclaiming operations, as well as deposition on the yard (around the pile) and re-lifting [
27] are not considered, since they are not accounted by the EPA model, although Furieri et al. [
28] demonstrated their important contribution to the total emission of an open storage yard.
Even though a more accurate numerical modeling approach, such as Large Eddy Simulations, may be applied, RANS is still considered to be an appropriate computational technique for engineering evaluations [
21].
Despite these inherent simplifications, the analysis hereby proposed gives an insight on the effect of heap position and filling on the emission potential, and provides a measure of the protective role of enclosing walls for different wind directions.
Apart from the scientific interest of understanding the complex modification of the flow field depending on the specific operating conditions, and consequent emission potential outcomes, results are important also in view of the need of guidelines and practical methods to assess the effectiveness of structural protection/pile configuration and their integration with temporary measures. Even though the numerical results of this study have to be applied to other configurations with caution, the proposed procedure (including polar plots of emission potential and CDF velocity threshold computation) can also be applied to specific industrial sites. This would require an explicit modelling of the heaps together with the surroundings, as well as the characterization of the solid bulk material under consideration. Results can be used both to optimize the pile orientation with respect to the prevailing winds (also considering the relative location of sensible receptors) and provide useful indications to implement selective mitigation measures. Specifically, the integration of temporary/active protective measures of risk reduction, such as surface moistening and treatment with dust binding substances, could be triggered by the implementation of wind speed monitoring devices, which allow a selective action over specific pile areas when the wind speed threshold is reached.


