Article

Comparisons of the Synoptic Characteristics of 14-Day Extreme Precipitation Events in Different Regions of Eastern China

1
Key Laboratory of Meteorological Disaster, Ministry of Education (KLME)/Joint International Research Laboratory of Climate and Environment Change (ILCEC)/Collaborative Innovation Center on Forecast and Evaluation of Meteorological Disasters (CIC-FEMD)/Jiangsu Key Laboratory of Meteorological Observation and Information Processing/Jiangsu Technology & Engineering Center of Meteorological Sensor Network/School of Electronic & Information Engineering, Nanjing University of Information Science & Technology, Nanjing 210044, China
2
School of Remote Sensing and Geomatics Engineering, Nanjing University of Information Science & Technology, Nanjing 210044, China
*
Author to whom correspondence should be addressed.
Atmosphere 2022, 13(8), 1310; https://doi.org/10.3390/atmos13081310
Submission received: 8 July 2022 / Revised: 10 August 2022 / Accepted: 13 August 2022 / Published: 17 August 2022
(This article belongs to the Special Issue Extreme Weather Events and Atmospheric Circulation)

Abstract

:
How to predict and study persistent extreme precipitation events (PEPEs) with a prediction period of 1–2 weeks is an important scientific problem faced by the meteorological circles at home and abroad. Based on the accurate description of the flood range caused by 14-day PEPEs, the comprehensive analysis method was used to obtain the weather characteristics related to 14-day PEPEs (including abnormal trough/ridge, westerly jet, atmospheric river (AR) activity, teleconnections, etc.). First, we selected three regions in China, North China (NC), the Yangtze River valley (YRV), and South China (SC), analyzed their 14-day PEPEs in summer (June to August), and composited them into an average circulation (500 hPa geopotential height field) to compare the weather patterns related to PEPEs in these regions. Then, several variables are composited to understand the evolution of the atmospheric state before and during the occurrence of PEPEs. Finally, potential applications of several teleconnection types and composites in advance prediction are studied. The main findings include: the common weather signals during the occurrence of PEPEs are characterized by obvious and continuous a high-low-high saddle field circulation configuration (conducive to the formation of frequent heavy rainfall), active westerly jet (westerly jet is the controlling factor of precipitation), and enhanced water vapor transport (significantly increased atmospheric river activity). In this study, some key characteristics and development of PEPEs were identified, the formation mechanism of China’s 14-day PEPEs was revealed, the role of ARs in PEPEs was recognized, and the PEPEs precursor signal was extracted. Furthermore, PEPEs in different regions were also compared, which played an important role in understanding and predicting similar events.

1. Introduction

Persistent weather anomalies can cause a variety of serious meteorological hazards, and persistent extreme precipitation events (PEPEs) are one of the important ones. Especially, events longer than two weeks are more destructive. In the last 60 years, such events have shown a trend of increasing frequency, intensity, and impact [1]. According to preliminary statistics, from 1951 to 2005, there were 17 persistent rainstorm processes lasting more than 3 days in the Huaihe River basin, 40 in the middle and lower reaches of the Yangtze River, and 18 in southern China [2]. For example, in the summer of 1998, the Yangtze River valley sustained heavy precipitation for up to 40 days, with two occurrences of 10 days and 6 days, respectively, especially a sustained rainstorm that occurred from July 20 to 25, 1998, with a total rainfall of 655 mm in 3 days (20 to 22), causing the Dongting Lake system to experience the second most serious mega-flood of the 20th century. According to the statistics of the State General Administration of Defense, basin-wide flooding caused direct economic losses of 250 billion RMB and more than 3000 deaths [3]. The increasing threat of PEPEs invokes the need for a detailed understanding of the physical processes responsible for its occurrence. It is helpful to extend the forecast time of this kind of high impact events and improve the forecast accuracy [3].
China is located in the East Asian monsoon region, and the characteristics of precipitation variability vary from place to place. Many previous studies have discussed the possible causes of precipitation variability in China [4,5,6]. A large number of previous studies have shown that the occurrence of persistent heavy precipitation is often directly related to persistent anomalies in the large-scale circulation [3]. For example, ref. [7] classified persistent rainstorms into meridional and latitudinal types. He pointed out that the occurrence of persistent torrential rain requires the maintenance of certain large-scale circulation conditions conducive to the formation of torrential rain (especially the sustained and stable strong blocking high in the middle and high latitudes and the Western Pacific subtropical high in middle and low latitudes [7,8,9,10,11,12]). If there is a meridional pattern, its circulation is characterized by a stable confrontation between the Japan Sea high and the Qinghai Tibet high. At this time, cold air continuously flows into the high trough or shear line between the two high pressures along the front of Lake Baikal high pressure [7]. If there is a zonal pattern, its circulation conditions are mainly manifested in the continuous intersection of the cold air under the southeast split from the broad Siberian trough and the warm and humid air flow on the west side of the subtropical high, forming a continuous rainstorm [7]. It is also pointed out that the variability of extreme precipitation in northern and southern China is very different [13,14,15,16,17,18].
Previous studies of PEPEs have focused on specific case studies, and research has focused on improving the prediction and understanding of specific characteristics. Theoretical studies on the mechanism and forecasting of PEPEs have lacked insight. These case studies focus on improving the prediction and understanding of specific features. A study by [19] examined the continuous rainfall and floods in South Carolina in October 2015, and it was believed that the hurricane delayed the progress of the upper trough and enhanced the diabatic process of the jet stream in the southeast of the United States. As a result, too much water vapor flows into the region to form persistent heavy rainfall. In [20], extreme precipitation events in Tennessee and Kentucky in May 2010 were studied. It was found that those systems with weak low pressure and longer slot can well simulate and predict this event in the European center medium range weather prediction system. A study by [21] believes that in the future climate change, similar events similar to May 2010 can be attributed to the increase of water vapor content and strong convective updraft. These analyses have identified some important processes and characteristics related to persistent extreme events, which can provide important help for Pepe’s understanding and prediction. In the continental United States and several sub regions, some studies have identified the key characteristics of daily to weekly extreme precipitation (e.g., [22,23,24,25,26,27,28]). These studies point out some special atmospheric patterns that affect extreme precipitation events, such as abnormal geopotential height or increased water vapor transmission. In a study of similar events, ref. [29] found that the characteristic atmospheric pattern of the rainy season in the Great Plains of the United States is driven by synoptic scale processes. In many similar studies, a recurring theme is that water vapor and its transport mechanism play an important role in these events. Therefore, they suggested that atmospheric rivers (AR) be studied as an important medium for water vapor transmission [30,31,32,33].
Chinese meteorologists and hydrologists have recognized that the intensity, magnitude, and persistence of water vapor transport plays a key role in the process of extreme rainstorms, and this water vapor conveyor belt is the AR mentioned above. ARs are a conveyor belt of narrow, deep water vapor layers located in the lower troposphere flowing rapidly from the tropics or subtropics to mid-latitudes, and they continuously transport abundant water vapor to storm areas, leading to intense and persistent precipitation events [34]. ARs play a very important role in the global water cycle as well as in regional weather climatology and hydrology.
In middle and high latitudes, 30% to 50% of extreme storm events (strong weather events with rainfall in the top 2%) are closely related to ARs [34,35]. A statistical study of the European region shows that there were 19 of the strongest storm events in the last 20 years, each of which caused at least $1 billion in economic damage, and 14 of these 19 events were inextricably linked to AR processes. Therefore, the future characteristics of ARs will determine the characteristics of water circulation and energy transport in the whole Earth’s climate system, and their activities are closely related to extreme weather processes, and the changes of ARs will also determine the frequency and intensity of future extreme events [35]. To date, there is little international research on ARs affecting Asia, especially in East Asia or China. Whether AR is an important factor affecting PEPEs remains to be confirmed in China. We lack a comprehensive understanding of the role of AR in PEPEs, and its role in PEPEs remains to be quantified.
In general, it seems that although China has started to explore the development of extended-period forecasting techniques [36,37,38,39,40], the research on the mechanism and forecasting theory for persistent major weather anomalies still lacks profound understanding. PEPEs are related to the type of atmospheric remote correlation, but whether the remote correlation index has precursor signals for PEPEs has not been analyzed in depth.
In this paper, we will focus on the following three issues:
(a) When major persistent weather anomalies occur, the corresponding atmospheric circulation anomalies also remain stable, and this persistence makes forecasting for more than 1 week more feasible. Persistent major weather anomalies usually occur against a background of persistent large-scale circulation anomalies that are conducive to their formation, with frequent activity of weather-scale systems capable of producing heavy precipitation and the formation of dynamical, thermal, and moisture conditions that are conducive to the generation and development of heavy precipitation weather systems.
(b) The monsoon moisture conveyor belt in the summer wind flow in East Asia has stronger, wider, and more persistent moisture transport characteristics than the general ARs, and its influence location can reach the northeastern part of China as the seasonal monsoon rain belt pushes northward, thus producing more persistent and intense monsoon precipitation and heavy rainfall under the interaction with cold air in the middle and high latitudes. This study intends to further investigate the role and specific quantification of ARs in PEPEs.
(c) By means of synthetic analysis, i.e., the day-by-day standardized anomalies of different variables are synthesized and then the geopotential use of synthetic modes in advance prediction is investigated. The role of several atmospheric teleconnection patterns in PEPEs is also examined. There are four main teleconnection patterns that were discussed in our studies, including the East Asia-Pacific pattern (EAP) [41], Madden–Julian Oscillation (MJO) [42], Pacific-North America (PNA) [43], and Western Pacific (WP) [43]. The aim is to give clear precursor signals for the diagnosis of PEPEs and to learn more about the actual predictability of these events.
PEPEs are often the result of a variety of spatial-temporal scales and external forcing factors, which makes it very difficult to accurately predict persistent severe abnormal weather [3]. To make forecasts of PEPEs lasting more than 1~2 weeks, it is necessary to gain insight into the causes of 14-day PEPEs and to grasp the anomalous characteristics of key influencing factors. In addition to this, we need to extend the forecast time and improve the forecast accuracy as much as possible. According to the practice of [44], a 14-day cumulative period is the beginning of the sub-seasonal time frame, so it is selected as the object of the sub-seasonal extreme precipitation survey.
This manuscript is organized as following. The data and analysis methods used in this study are presented in the next two sections (Section 2). The results of the synthetic analysis of the weather features associated with these events, including anomalous troughs, ridges, and AR activity are presented in Section 3. The precursor signals of the 14-day PEPEs and their association with atmospheric teleconnection pattern changes are presented in Section 4. In the last section, a summary and final conclusions are provided.

2. Data and Methods

2.1. Data

NCEP-DOE reanalysis II (NCEP 2) [45], which was provided by the NOAA PSL, Boulder, CO, USA (https://psl.noaa.gov, accessed on 10 August 2021), is the reanalysis data used in this study. We can get NCEP 2 reanalysis data from 1979 onwards. NCEP 2 reanalysis (2.5° × 2.5°) can be assumed as a reasonable representation of the observed record for our study. The main reason is that the NCEP 2 reanalysis uses an updated forecast model, updated data assimilation system, improved diagnostic outputs, and fixes for known processing problems [45]. The variables used in this study include geopotential height, zonal wind, and specific humidity. These variables were selected to investigate the synoptic and precursory characteristics associated with the 14-day PEPE. Zonal wind and specific humidity are used to calculate the integrated vapor transport (IVT). IVT is a measure of vertically integrated transport of moisture, and it is calculated following the method of [46] and others:
IVT = 1 g 1000 hPa 200 hPa ( q × V h ) d p
where V h is the horizontal wind, q is specific humidity, and g is the acceleration due to gravity. In order to explore the contribution of ARs to 14-day PEPEs, this study uses the significant positive anomaly of IVT as an obvious feature to identify whether AR activity is prevalent in a region. High IVT abnormalities are usually closely related to AR activity.
As a characteristic quantity of temperature and humidity reflecting the unstable energy of the atmosphere, the potential pseudo-equivalent temperature ( θ se ) is a powerful tool for rainstorm diagnosis and prediction. A great deal of the literature shows that the θ se is widely used in determining the position of the front, discussing the energy development, and judging the stability of atmospheric convection. θ se is a physical quantity that integrates temperature, pressure, and humidity to characterize the energy distribution in the atmosphere. Following [47], we defined the θ se . θ se as
θ se ( p , t , q ) = t × exp [ 0.28568 × a log ( 1000.0 / p ) + w ] , w = 2500.0 × q / [ 338.52 0.24 × t + 1.24 × ( t d 273.16 ) ]
where p , t , and q represent pressure, temperature, and specific humidity at each standard isobaric layer; t d denotes the dewpoint temperature, which is obtained by an iteration method.
In addition to reanalysis data, gridded precipitation data provided by the NOAA Climate Prediction Center (CPC) is also being used (referred to as CPC Global Precipitation; https://psl.noaa.gov/data/gridded/data.cpc.globalprecip.html, accessed on 10 August 2021). Its resolution is 0.5° by 0.5°. This dataset is also deduced from 753 operational surface stations of the China Meteorological Administration by an ordinary kriging interpolation, with small interpolation errors in the eastern part of China owing to the high station density. This spatial-temporal resolution is enough to analyze 14-day PEPEs and their weather characteristics. In the teleconnection analysis, the NCEP2 reanalysis daily 500 hPa geopotential height dataset was selected in order to calculate the teleconnection indices (EAP, PNA, and WP). The MJO index developed by [48] can be downloaded from the Australia Meteorological Bureau (http://www.bom.gov.au/climate/mjo/, accessed on 10 August 2021).

2.2. Analysis Domains

Most of the persistent rainstorms in China occur in the summer months of June to August, and almost no local persistent rainstorms occur in winter [2]. Therefore, we only study the occurrence of local persistent rainstorms in China during June to August in the summer.
To obtain a more complete understanding of these PEPEs and identification of their precursor signals for different regions in eastern China is our primary goal; therefore, we chose three typical representative regions according to previous studies, i.e., North China, Jianghuai, and South China. In terms of the climatology of heavy rainfall, ref. [49] studied the climatic distribution of heavy rainfall in China during the 1950s and 1970s and pointed out that heavy rainfall in the climatic sense mainly occurred in three latitudinal belts of North China, Jianghuai, and South China. In July, local persistent rainstorms occurred in the Yangtze River valley and southern China, and in August, local persistent rainstorms occurred in the coastal areas of southern China, whereas local persistent rainstorms occurred in the north [2]. In view of the above reasons, three subregions (Figure 1) were selected for comparison:
(a)
North China (NC); includes areas within 36.5° N–40° N, 110° E–117° E.
(b)
the Yangtze River valley (YRV); includes areas within 26.5° N–31° N, 115° E–120° E.
(c)
South China (SC); includes areas within 21.5° N–25° N, 110° E–117° E.

2.3. Defining 14-Day Extreme Precipitation Events

To study PEPEs in eastern China, we used an algorithm which [44] recently developed to identify these events. First, we use a 14-day moving window from 1980 to 2019 to calculate the distribution of the total 14-day precipitation accumulation at each point. We chose the 95th percentile of the distribution as the threshold to define the extreme precipitation at each site. The use of the 95th percentile is a common threshold in studies investigating extreme precipitation and allows us to investigate events of influence [28,50,51].
First, reasonable area thresholds are designed with the aim of enabling close sample sizes for different regions and facilitating comparison of anomalous modal characteristics associated with 14-day PEPEs in different regions. Then, two exclusion criteria are set for the events: (a) exclusion if the average precipitation exceeds 10 mm/day for less than 5 days to ensure that there are consecutive days [28,50,51] of precipitation during this period. This can ensure the continuity of precipitation during this period, and (b) exclude if the day with the highest precipitation plus the day before and after represents more than 50% of the total cumulative precipitation for the 14-day period to avoid time-scale events being the main driver. Finally, if any 14-day period overlaps with another event window, select the one with a larger cumulative precipitation, making sure that none of the selected events overlap.
This method deepens the understanding of regional PEPEs that are temporally continuous and spatially close to each other with high causality and certain influence range. Finally, on this basis, we further discover commonalities and analyze climate changes characteristics of PEPE.

2.4. Compositing Methods

Different combinations of climate variables were used to identify significant anomalous modes in different regions. Three different time periods were selected for synthesis: before the event (−10 to −6 days), before the event (−5 to −1 days), and during the event (+1 to +14 days). The modalities identified in the event window help characterize the regional features of the 14-day PEPE. The identification of modalities prior to event onset is explored to understand their utility in predicting such events using different cues.

3. Characteristics of 14-Day Extreme Precipitation Events

In order to better understand the circulation background of the occurrence of 14-day PEPEs in China from a common perspective and to objectively describe the characteristics of the occurrence of 14-day PEPEs in China in the past 40 years, we use the daily precipitation grid data in this period to analyze the large-scale circulation background of the occurrence of 14-day PEPEs in China.

3.1. Synoptic Composites

To study the state of the atmosphere during 14-day PEPEs, we developed composite daily standardized anomalies for several variables over the entire 14-day period for all events. These variables were normalized by subtracting the daily mean from the reanalysis values and dividing the subsequent values by the long-term (1980–2019) standard deviation.
The results of a large number of studies [52,53,54,55] indicate that the basic conditions for the formation of regional PEPEs in mid-latitudes include relatively stable large-scale weather system configuration structure, continuous water vapor supply, strong and persistent upward motion, repeated reconstruction of convective environment, and the repeated reconstruction of the convective environment, etc.
Synthetic analysis of storm events with similar circulation backgrounds can better reveal their common characteristics [56]. Therefore, the next analysis focuses on the synthetic field distribution of variables such as geopotential height, wind field, vertical integration of water vapor flux, and potential pseudo-equivalent temperature.

3.1.1. Average 500 hPa Geopotential Height Standardized Anomalies

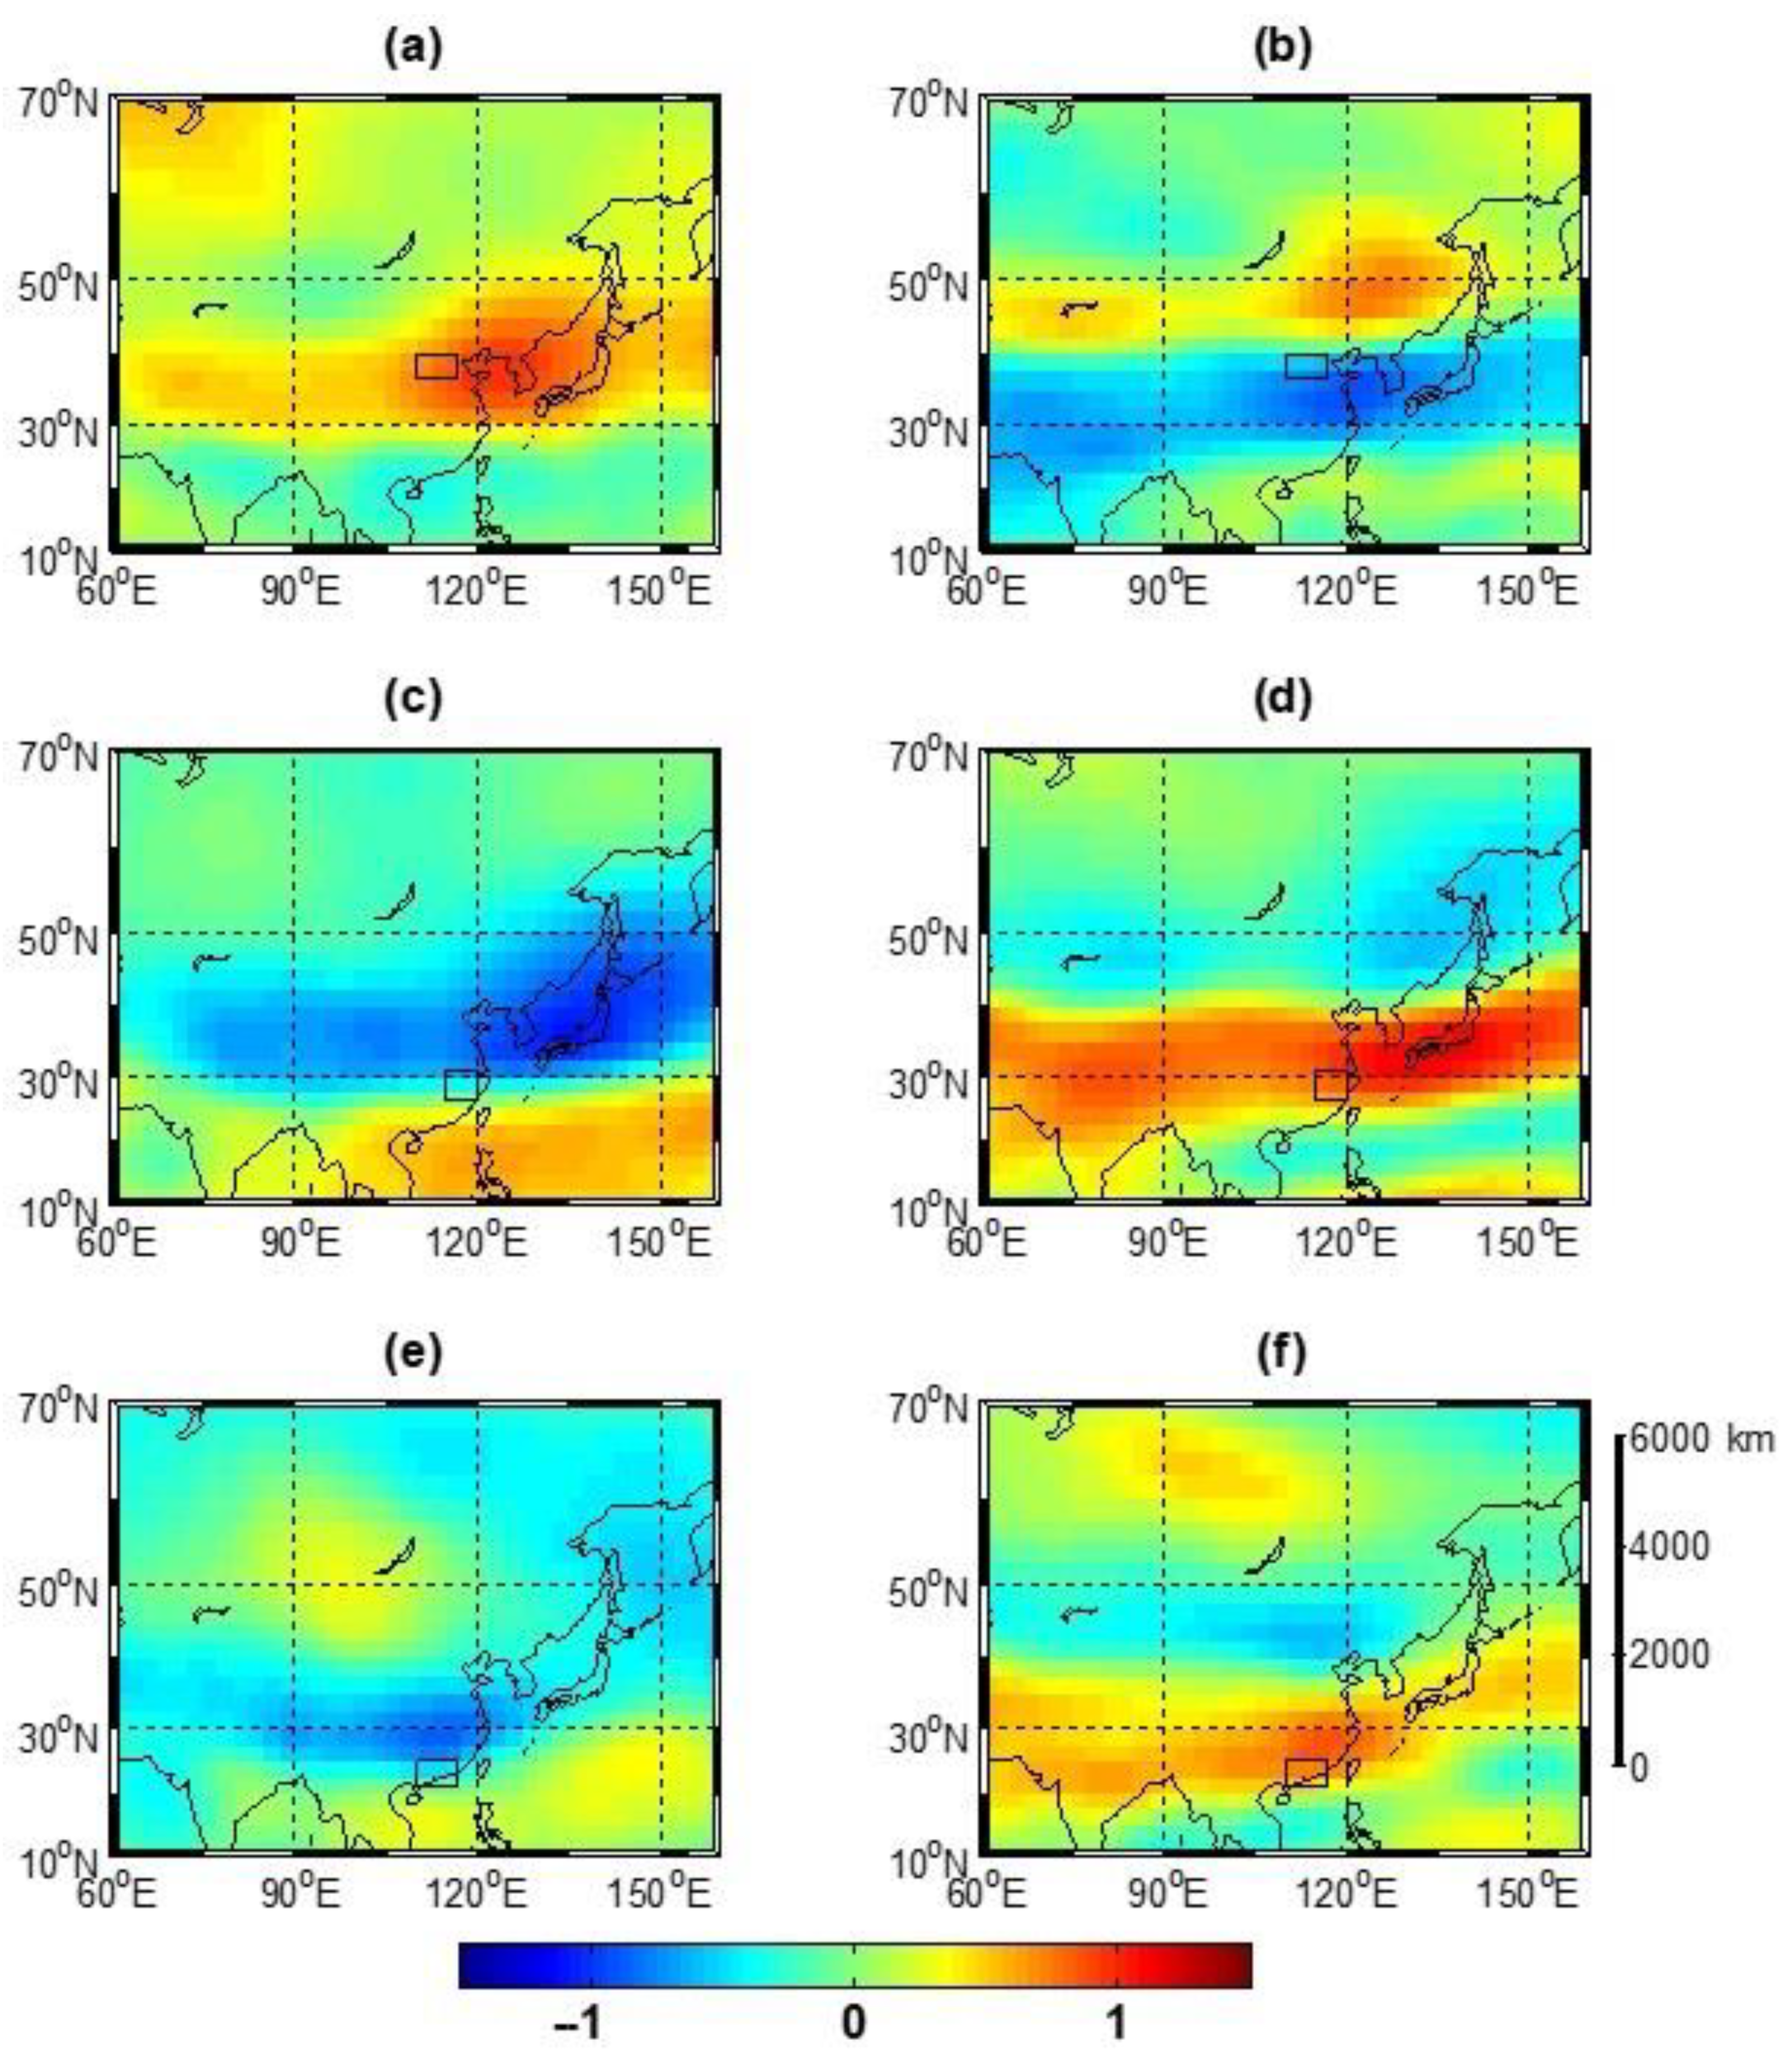
The left column of Figure 2 shows the synthetic mean circulation (500 hPa geopotential height standardized anomalies) of the 14-day PEPE process in summer (June–August) in three different regions.
From Figure 2a, it can be seen that the center of high pressure on the geopotential height field (the western Pacific subtropical high pressure is latitudinal and extends westward to the east-central region of China) is stable near the Bohai Sea and the Korean Peninsula, and its northwest side is a shallow trough in the westerly wind belt (the negative geopotential height level is small, and the main body of cold air is north of 40 °N), and its south side is an active tropical low pressure system on the ocean surface [56].
Figure 2c allows for observing the atmospheric circulation situation of persistent heavy rainfall events in the Yangtze River basin. The northern edge of the western Pacific subtropical high pressure is stable in the Jiangnan region. Position of the subalpine determines the fallout area of the persistent rainstorm, and its stability facilitates the maintenance of the rainstorm. The northern side of the subalpine is a wide and deep low pressure trough. To the north of the trough, the Okhotsk Sea blocking high pressure appears. Together they form a stable saddle field, and rainstorms fall in the south side of the saddle center in the subtropical southwest flow [2].
The northern edge of the subtropical high pressure in Figure 2e is stable in South China. In the middle and lower reaches of the Yangtze River, there is a broad low pressure trough. The latitudinal circulation is mostly of the west-high-east-low type around 40°N. The cold air required for heavy rainfall in South China mostly comes from the East Asian trough of the west-high-east-low circulation type. Under such circulation conditions, the cold air in the East Asian low pressure trough often penetrates deep into the south of the Yangtze River, where it meets with the southwestern warm and humid air flow. Persistent rainstorms occur in the warm and humid airflow where the cold and warm air meets [2].
Circulation situations in the three different regions of all the characteristics are of a high-low-high saddle field. Therefore, the circulation situation (500 hPa geopotential height field) in all regions during the 14-day PEPE will show a favorable pattern. It can be inferred that a stable large-scale circulation situation is a necessary condition for the persistence of heavy rainfall and is likely to be constrained by the climatic background.

3.1.2. Total Event Composite of 200 hPa Zonal Wind Standardized Anomalies

From the 200 hPa upper air rapidly (Figure 2b), persistent heavy rainfall tends to occur on the south side of the entrance area of the upper air rapidly [56].
On the high altitude rapids (Figure 2d), the center of the rapids is mostly located near the south of Japan when the persistent rainstorm occurs. The fall zone of persistent rainstorm is located at the south side of the rapid inlet area. Most of cold air of persistent rainstorms comes from a wide low pressure trough at mid-latitudes. The area where the southwestern warm and humid airflow meets the northern cold air is the fallout area of persistent rainstorms [2].
Most of the rapid flow centers are located in Jiangnan and South China at the time of heavy rainfall (Figure 2f). The fallout area of persistent rainstorm is located in the south side of the central area of rapid flow. The relationship between rainstorms and rapids is not as close as the other two regions [2].
The above results indicate that significant zonal wind anomalies occur over a large area during 14-day PEPEs, implying that enhanced zonal wind are important. A similar configuration of upper zonal wind and mid-level geopotential height exists in all three different regions, and this configuration provides a favorable dynamical configuration for PEPEs.
The fall zone of persistent heavy rainfall is located south of the rapids or rapid inlet zone. This means that the dispersion of the upper layers favors the convergent upward motion of the lower atmosphere, which is consistent with the principle of climate science [56].

3.1.3. Total Event Composite of Standardized Integrated Vapor Transport (IVT) Anomalies

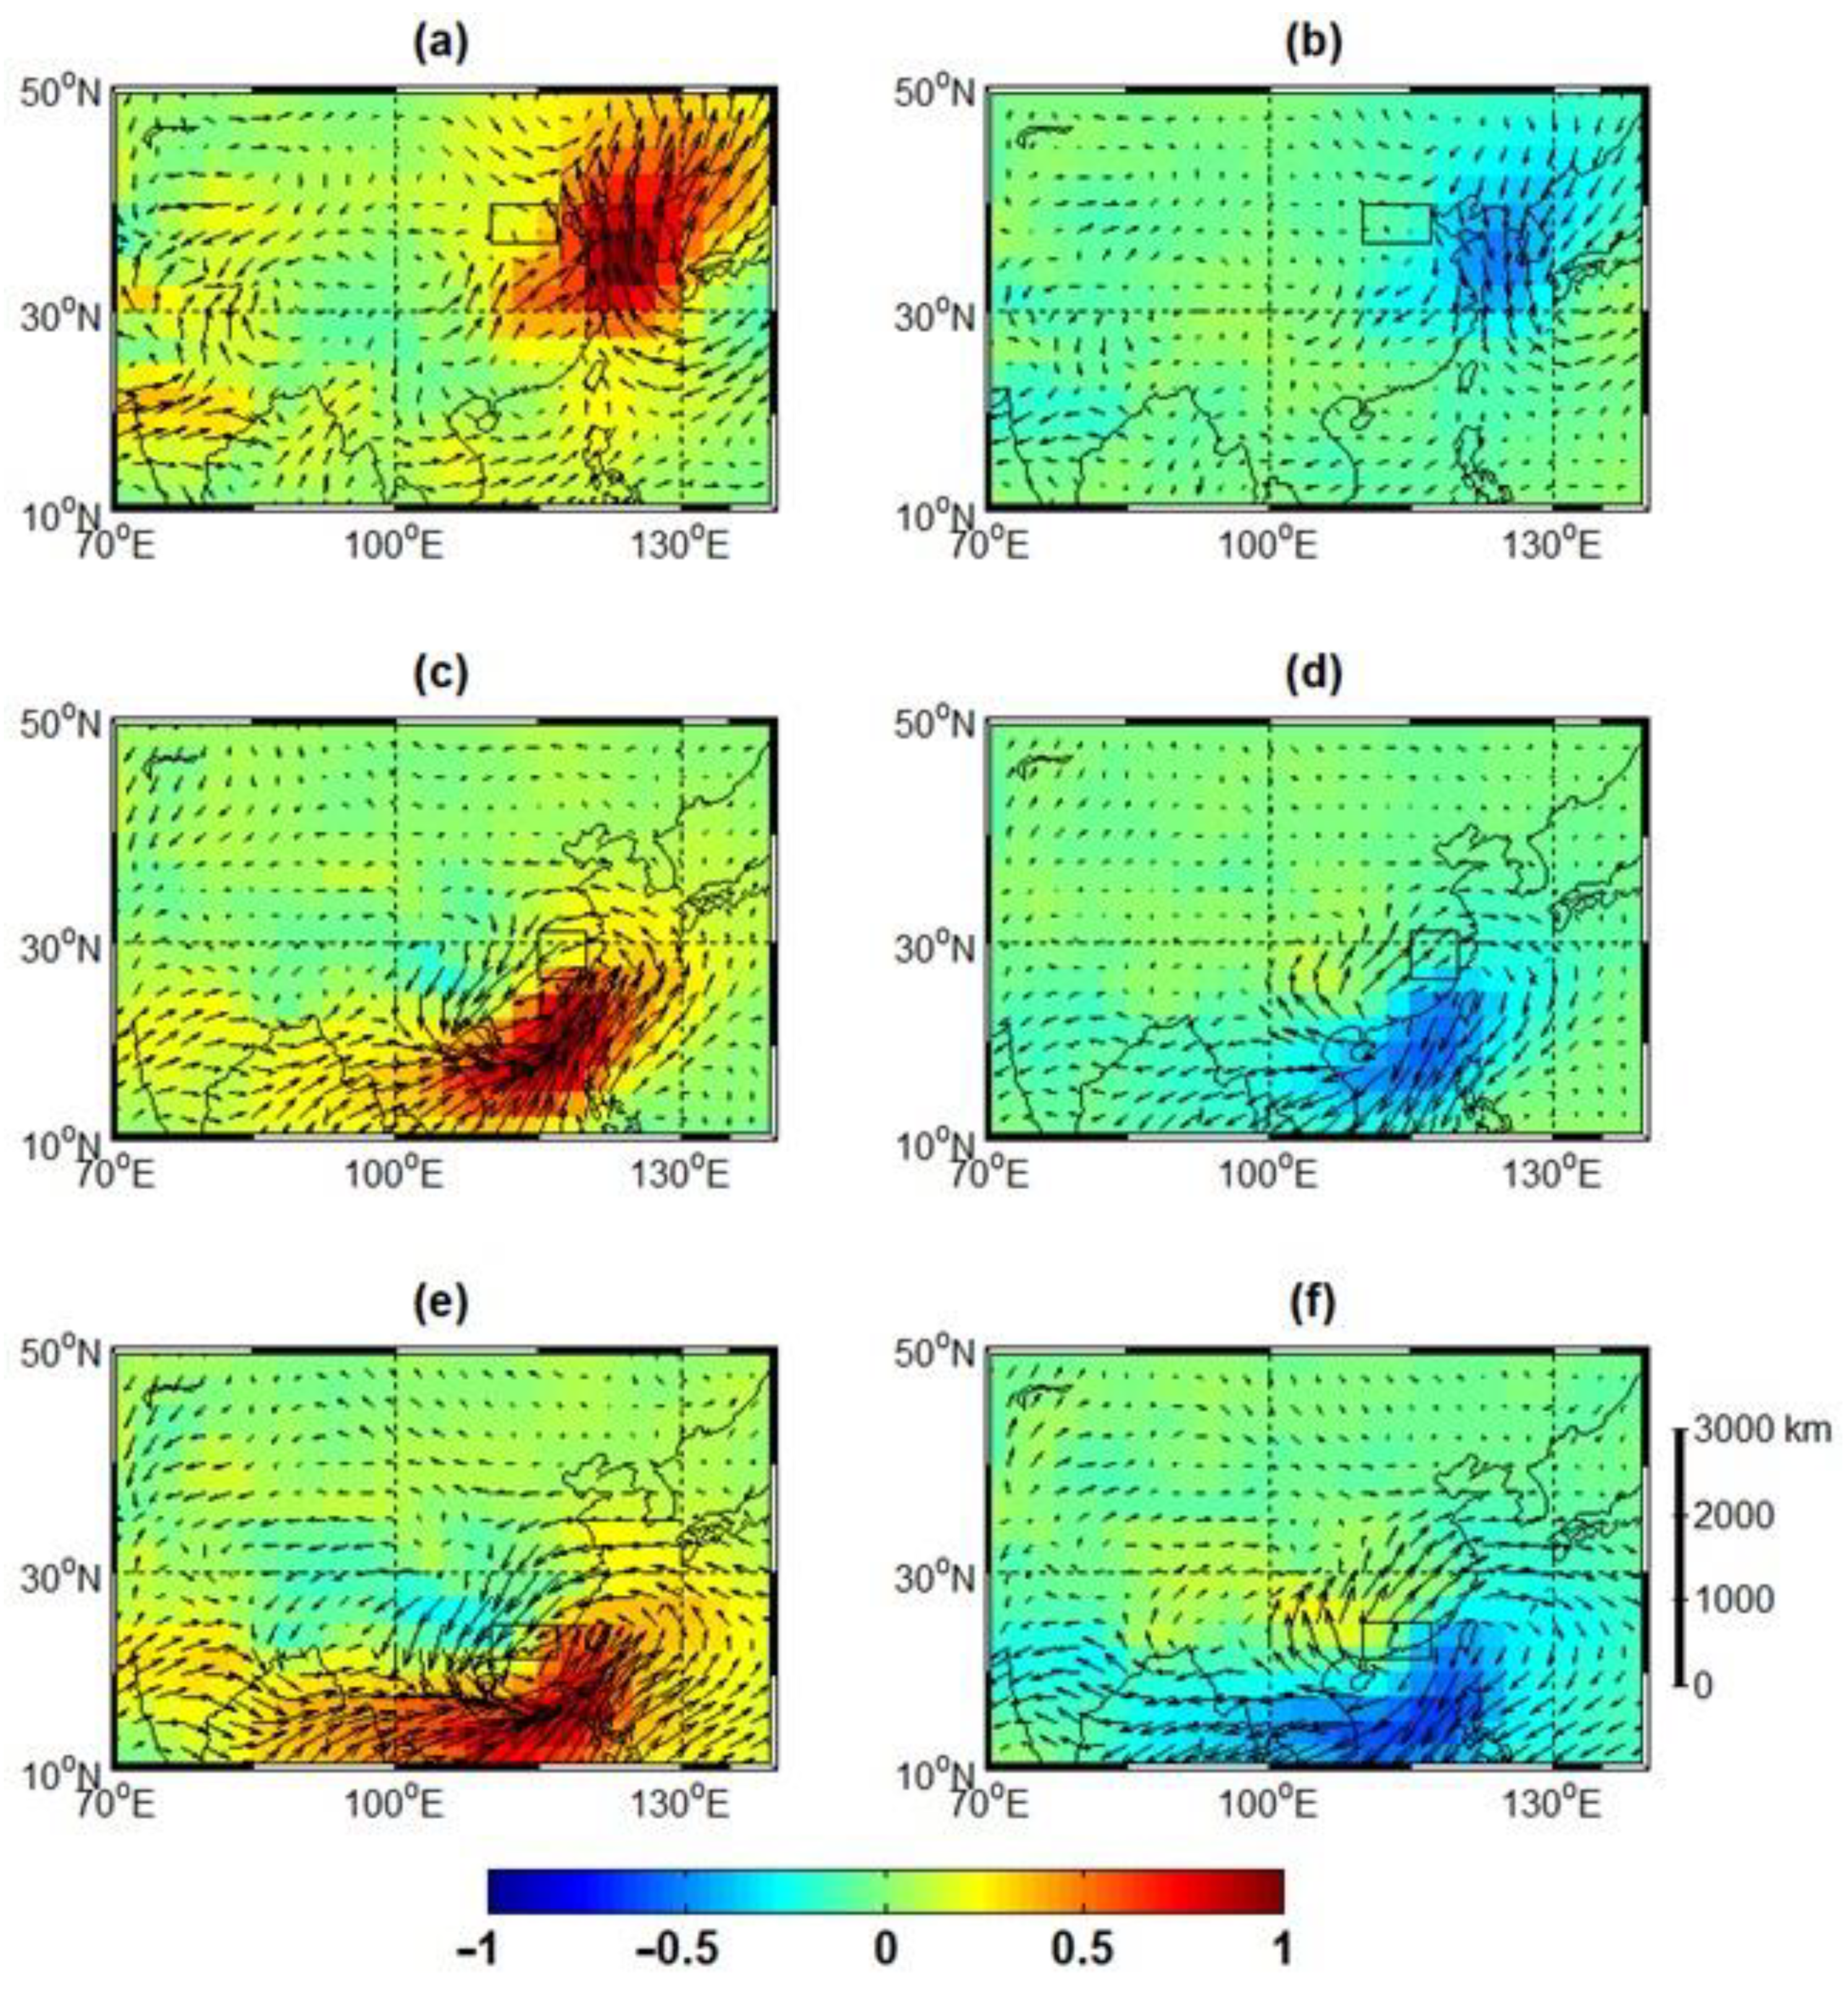
Enhanced water vapor transport is also a key feature of the 14-day PEPE. The left column of Figure 3 shows the synthetic field of standardized IVT anomalies. Typically, positive IVT anomalies indicate increased water vapor transport in a region during a 14-day PEPE.
As can be seen in Figure 3a, the anomalous easterly airflow area between the subtropical high pressure and the tropical low pressure system (30° N–40° N) corresponds to a positive water vapor flux anomaly. This warm and humid easterly airflow is favorable for water vapor transport in North China, and the tropical depression activity is also favorable for high pressure stabilization around the Bohai Sea and the Korean Peninsula. The water vapor contribution to persistent extreme rainstorms in the North China region is mainly transported to the storm area in the northwest Pacific Ocean along the periphery of subtropical high pressure [56].
The corresponding water vapor flux from the southwestern direction of the warm and humid airflow zone is a positive anomaly. Both are conducive to the transport of water vapor in the storm area. Unlike North China, the water vapor contribution to persistent extreme rainstorms in Yangtze River and South China mainly comes from the southwesterly warm and humid airflow in the Bay of Bengal and the southerly warm and humid airflow in the South China Sea.

3.1.4. The Total Event Composite of Standardized Potential Pseudo-Equivalent Temperature Anomalies

The potential pseudo-equivalent temperature ( θ se ), as a temperature and humidity characteristic quantity reflecting the atmospheric instability energy, is a powerful tool for storm diagnosis and forecasting. A large amount of literature shows that the θ se has a wide range of uses in determining the location of fronts, discussing energy development, and judging the stability of atmospheric convectivity.
The θ se positive distance level zone is narrow and deep, as can be seen from Figure 4d. The anomalous upward motion corresponds to the storm area, and the subsidence flow anomalies are located north of 45° N and south of 32.5° N, respectively [56].
Similar to North China, the θ se positive pitch level in Yangtze River and South China is also very narrow, with a negative pitch level zone on each of its north and south sides.
The above results show that the variation of the θ se can reflect the activity of cold and warm air during the rainstorm. The fallout area of persistent rainstorm is located at or close to the positive 850 hPa level zone. Therefore, the movement and trend of the center of the level are closely related to the rainfall area and the stage of rainstorm development.

3.2. Trough–Ridge Patterns

From the previous analysis, it can be seen that a clear high-low-high saddle field can be found in the 500 hPa geopotential height synthesis field in all three regions, implying that the particular circulation anomaly situation is very important for the 14-day PEPE. To observe this prominent feature more closely, we constructed trough/ridge indices in each of the three different regions according to the method of [44]. The influence of different types of trough-ridge configurations on 14-day PEPEs was then examined.

3.2.1. Indices for Standardized Geopotential Height Anomalies in Trough and Ridge Maxima Regions

A rectangular box was selected with the lowest (high) value of the synthetic trough (ridge) distance from the flat field at the center, respectively.
Then, the average value of the area in the rectangular box was calculated day by day to form a 35-day time series (14 days before, 14 days during, and 7 days after the end of the 14-day PEPE). The results are shown in Figure 4.
In the North China region, the standard geopotential height anomaly in the composite trough index (Figure 4a) is positive and decreases slightly during the 14-day PEPE. This indicates that the region is characterized by high ridges. The standard geopotential height anomaly in the composite ridge index (Figure 4b) gradually increases before the start of the event, rises significantly during the event, and rapidly decreases after the end of the event.
In contrast to northern China, the standard geopotential height anomaly of the composite ridge index (Figure 4h) in southern China rises slightly during the event, indicating that southern China is characterized by a predominantly low trough. The standard geopotential height anomaly in the composite trough index (Figure 4a) is negative, and the magnitude of the negative value increases significantly during the 14-day PEPE and becomes smaller rapidly after the event ends, but there is a not very obvious precursor signal before the event.
In the Yangtze River Valley (Figure 4d,e), both the composite trough index and the composite ridge index increase significantly during the 14-day PEPE, and both indices have obvious precursor signals before the event.
The above results imply that the early change of trough-ridge index can be used as a precursor signal of the 14-day PEPE. That is, the occurrence of the 14-day PEPE can be reflected in these two indices in advance.

3.2.2. Percentage of Occurrence of Trough and Ridge Days for Event and Nonevent Days
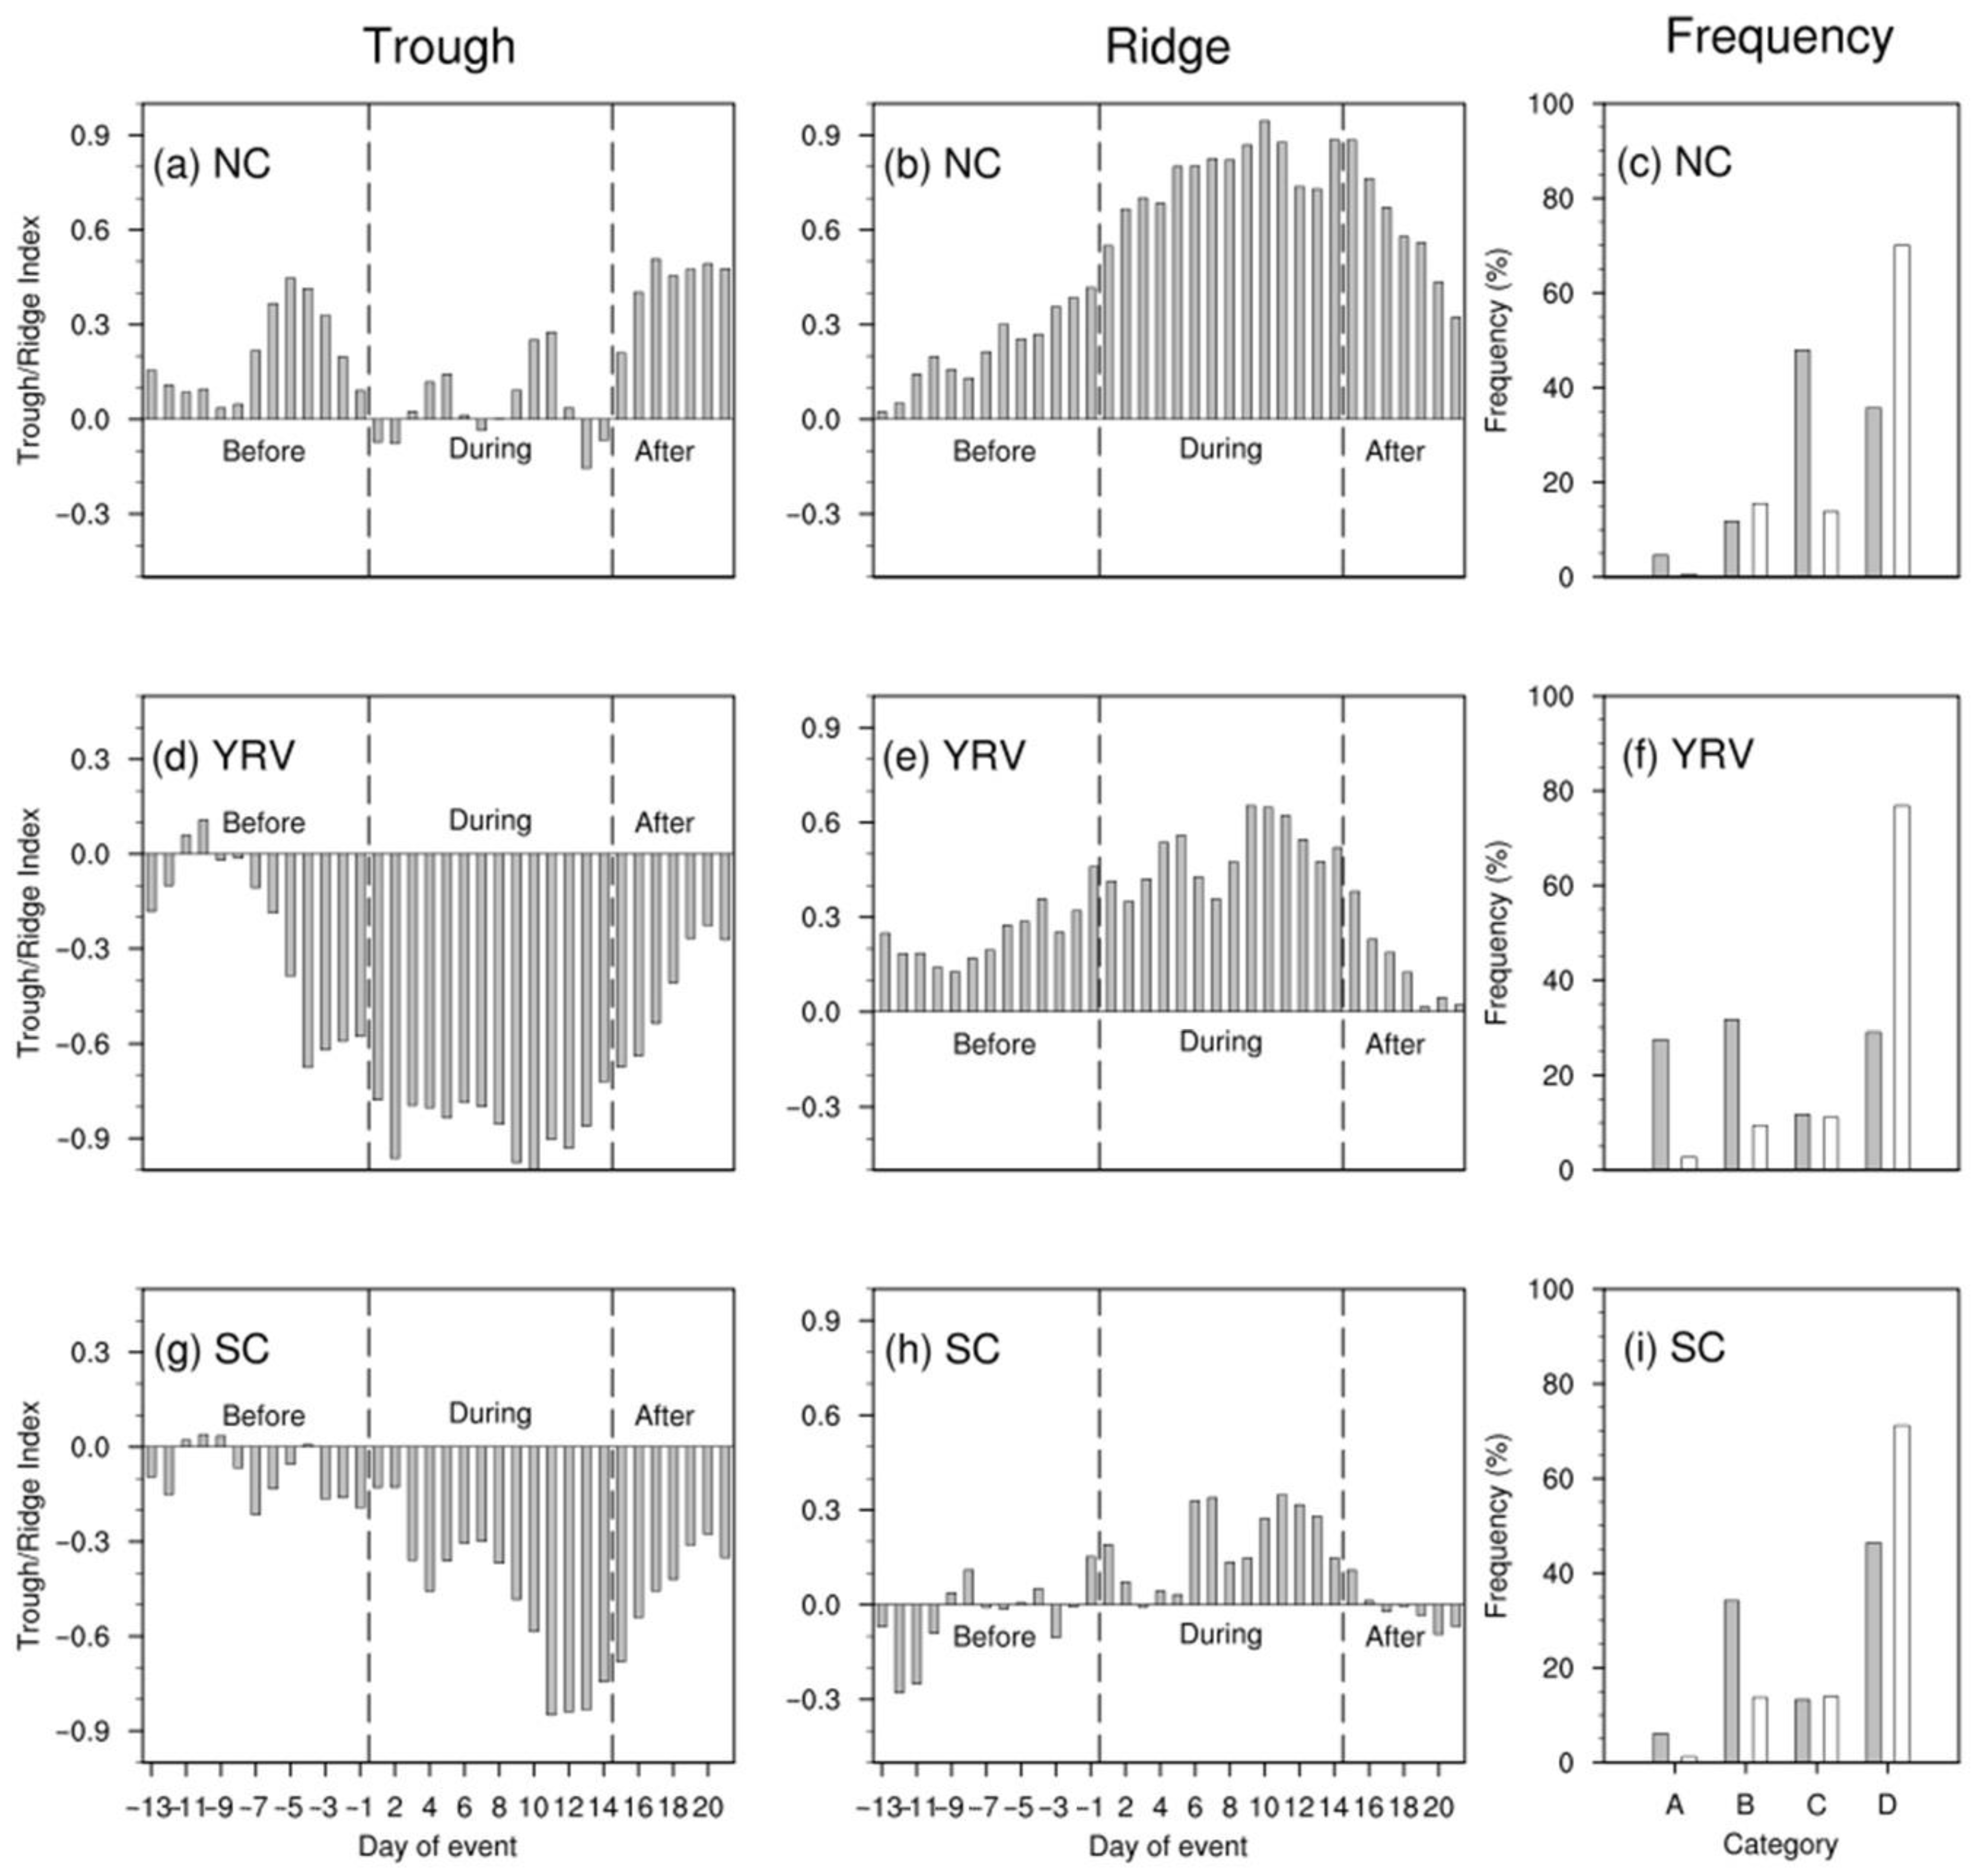
To quantify the impact of different types of trough and ridge configurations on the 14-day PEPE, we do so by counting the percentage occurrence of the trough and ridge days for both event and non-event days (Figure 4c,f,i). There are two states of whether the absolute values of the trough and ridge indices exceed their standard deviations, respectively, which can be combined to obtain four different types, with both trough and ridge magnitudes exceeding the standard deviation, noted as category A. If the amplitude of the trough exceeds the standard deviation but the amplitude of the ridge does not exceed it, it is classified as category B. A ridge whose amplitude exceeds the standard deviation but the amplitude of the trough is not exceeded is classified as category C. Both trough and ridge amplitudes did not exceed the standard deviation and were recorded as category D. The frequency statistics of events and non-events in each of the four types are shown in Figure 4c,f,i.
In North China, the highest frequency of event days occurs in category C (ridge days), implying the importance of the subsurface for 14-day PEPEs in North China. In the Yangtze River basin, 14-day PEPEs occur least in category C (ridge days) and more frequently and with equal chance in the other three categories, suggesting that the importance of the subalpine for the Yangtze River valley is not as pronounced as for North China. In South China, the frequency of 14-day PEPEs is highest in category D (non-ridge and non-trough), followed by category B, indicating that the low-pressure trough is more important, but not necessary, for 14-day PEPEs in South China.
For non-event days, the three regions show a common feature that the frequency of non-events is the highest in category D. It indicates that the probability of non-events is the highest when no saddle-type circulation situation occurs, and this rule is applicable to all three regions.
Figure 4. Eulerian trough and ridge statistics based on the area average of geopotential-height anomalies in the boxes in Figure 2. A time series of composites for the standardized anomalies for the (ac) NC, (df) YRV, and (gi) SC ridge areas before, during, and after events. There are four different types, with both trough and ridge magnitudes exceeding the standard deviation, noted as category A. If the amplitude of the trough exceeds the standard deviation but the amplitude of the ridge does not exceed it, it is classified as category B. A ridge whose amplitude exceeds the standard deviation but the amplitude of the trough is not exceeded is classified as category C. Both trough and ridge amplitudes did not exceed the standard deviation and were recorded as category D.
Atmosphere 13 01310 g004

3.3. Atmospheric Rivers

According to [34], the forecast of persistent strong rainstorms needs to focus on two aspects. On the one hand, we should pay attention to the circulation type that is prone to produce heavy rain, and more importantly, we should pay attention to the establishment of a strong monsoon moisture conveyor belt or AR.
Next, we will explore the contribution of ARs to 14-day PEPEs in different regions. It has been previously understood in Figure 4 that one of the common features of 14-day PEPEs when they occur is the presence of anomalies in the IVT of the storm area. A study by [30] suggested that this event is closely related to the AR. ARs were not selected according to [44] because there were very few eligible ones in the study area. To be illustrative, we took a clustering approach and clustered the IVT into two main categories, with positive IVT anomalies (corresponding to ARs) occurring near the study area in category 1. Class 2 shows negative IVT anomalies (corresponding to non-AR) near the study area. In the figure, it can be seen that there are two main sources of AR water vapor in North China; one is the western Pacific Ocean and the other is the South China Sea. Additionally, AR water vapor in the Yangtze River and South China both comes from the Bay of Bengal and the South China Sea.
Then, the frequency of AR activity during event days and non-event days (all other dates not marked as event days) was calculated separately (Figure 5). As stated by [44], we compare event AR days with non-event AR days to better understand the changes in AR frequency. The frequency of AR activity was higher in all regions on extreme event days (65.9%, 61.7% and 56.5%) than on non-event days (34.7%, 59.4% and 48.8%). The greatest difference in frequency was found in North China, indicating that the increase in AR frequency was greatest in North China. The above results indicate that the active AR is a very important feature of the 14-day PEPE.

4. Precursors to 14-Day Extreme Precipitation Events

So far, we have examined the basic atmospheric characteristics that occur during 14-day PEPEs in various regions. After understanding these basic characteristics, the next task is to analyze whether there are significant precursors to these 14-day PEPEs in order to improve the prediction skill of these events. In this section, we first analyze the lagged combinations of several climate variables. Then we investigate whether there is a predictive signal for 14-day PEPEs in several atmospheric teleconnection patterns.

4.1. Synoptic Lag Composites

4.1.1. Standardized 500 hPa Geopotential Height Anomalies Lagged Composites

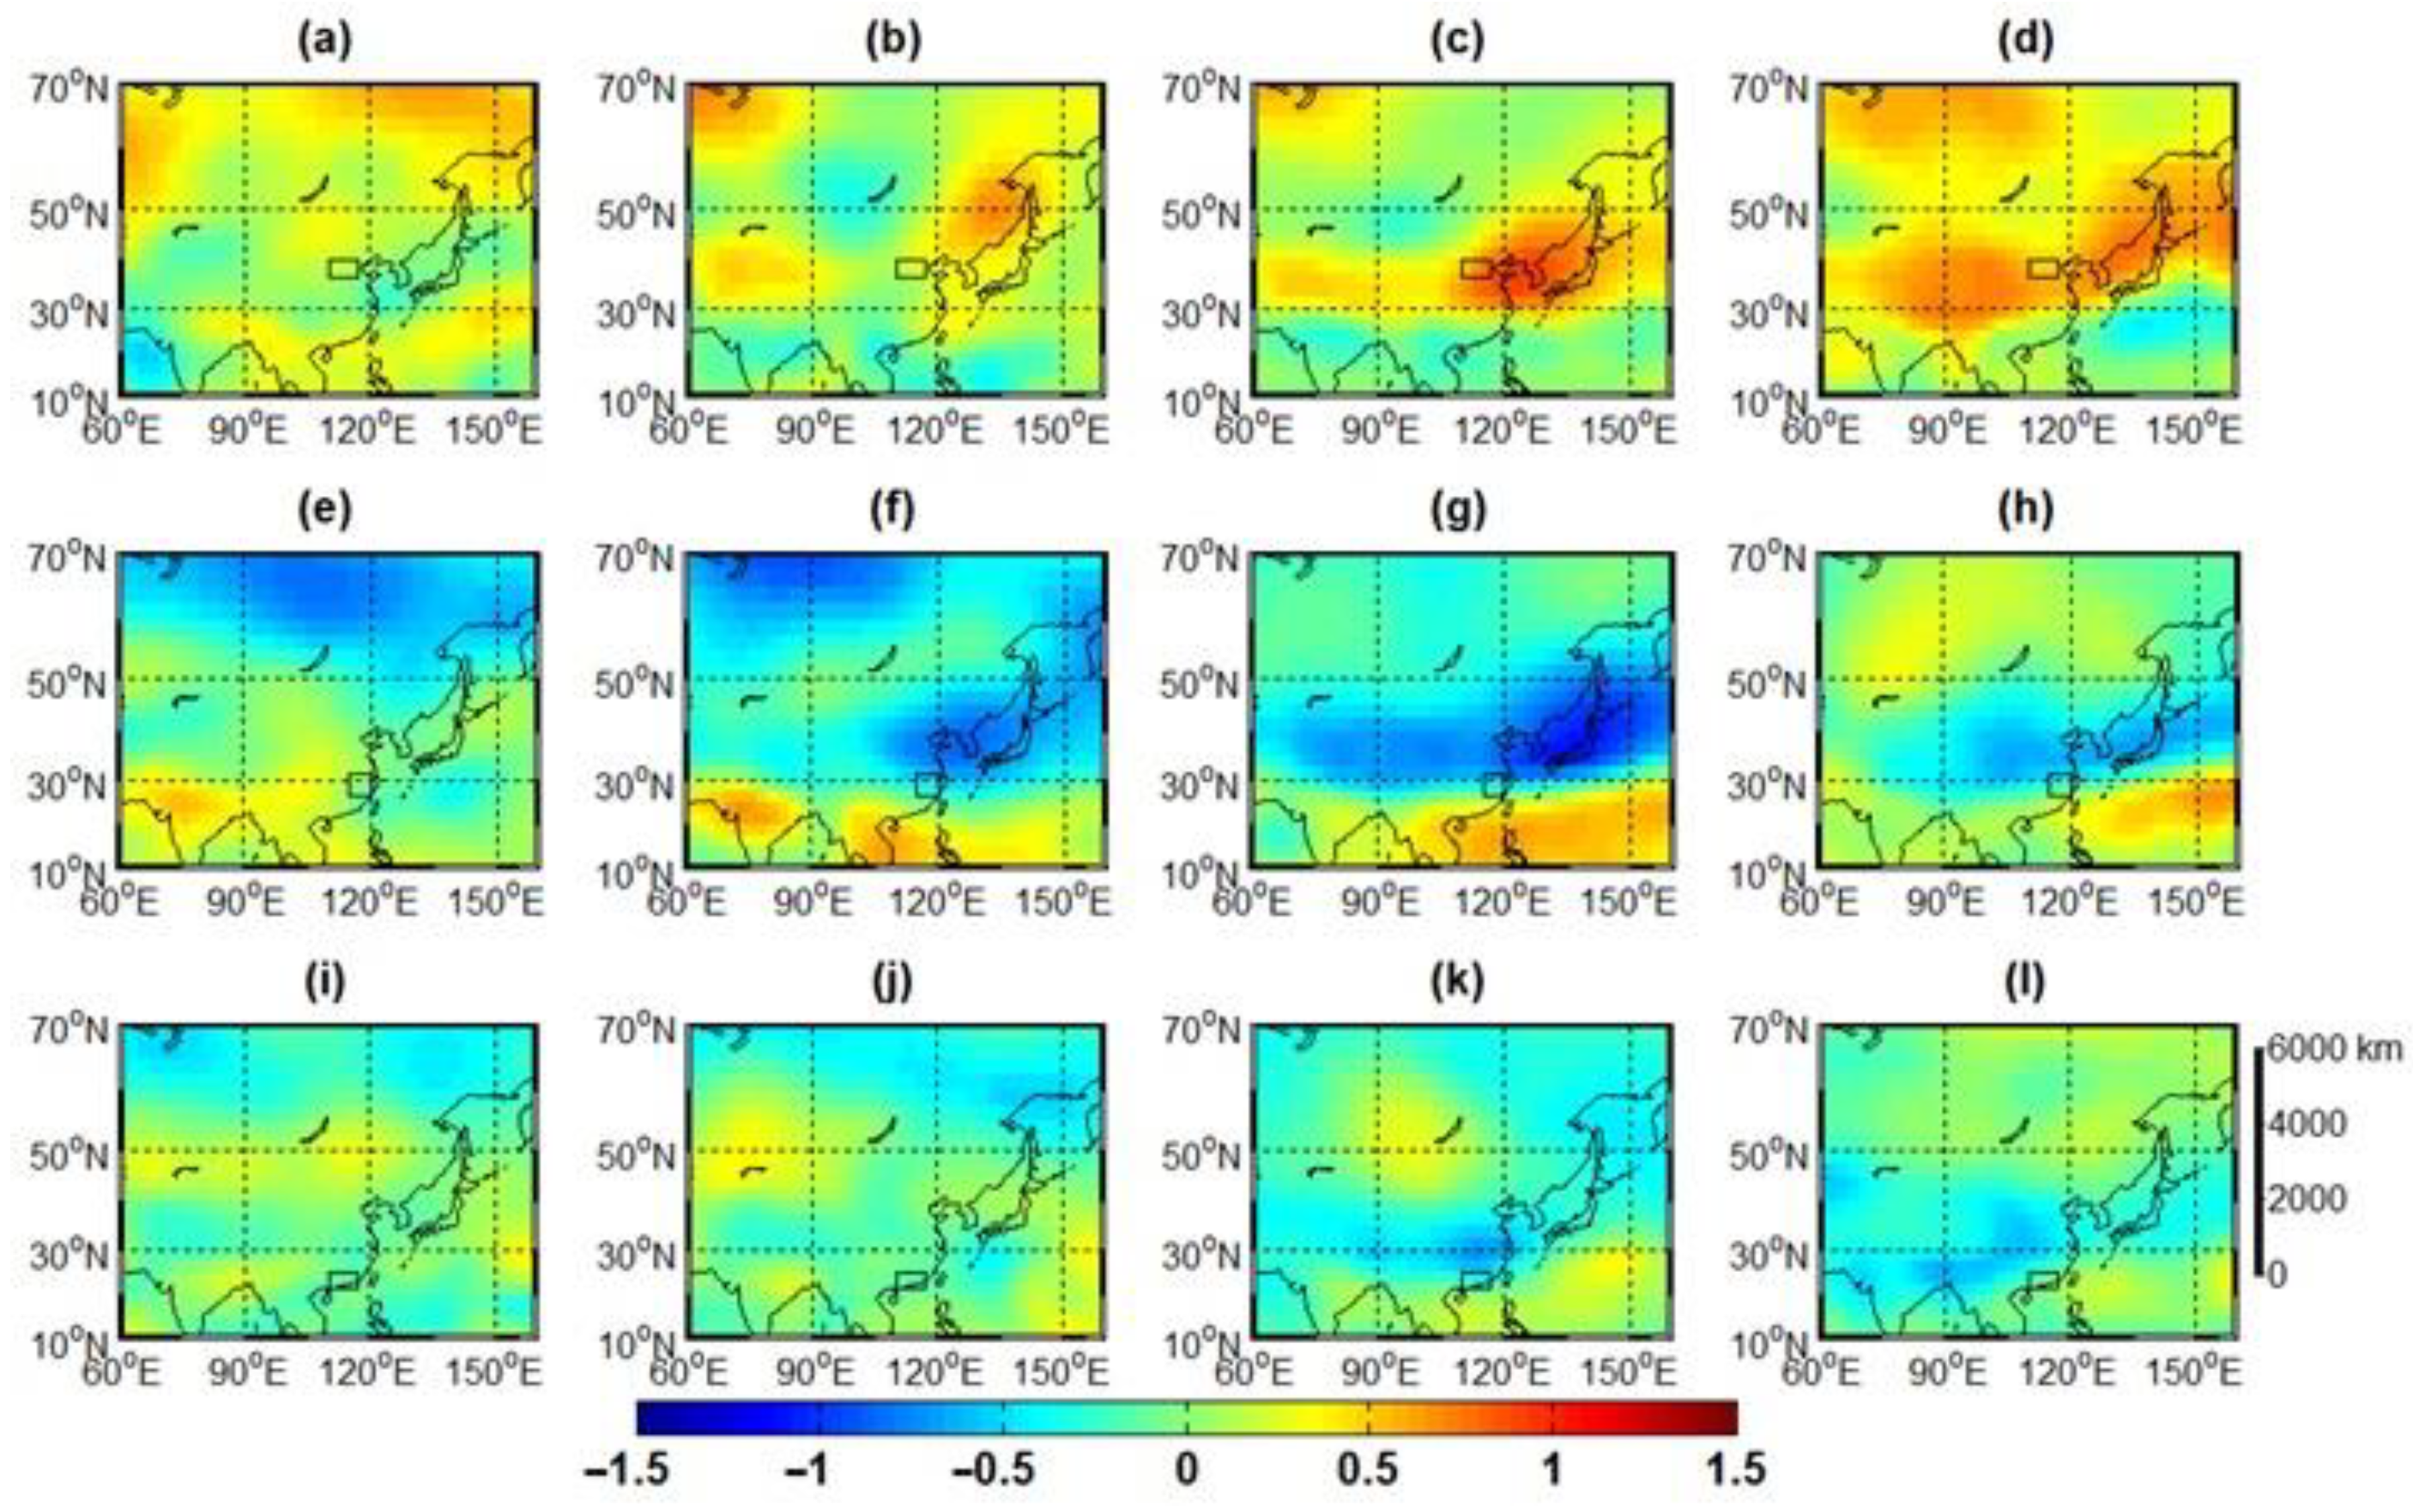
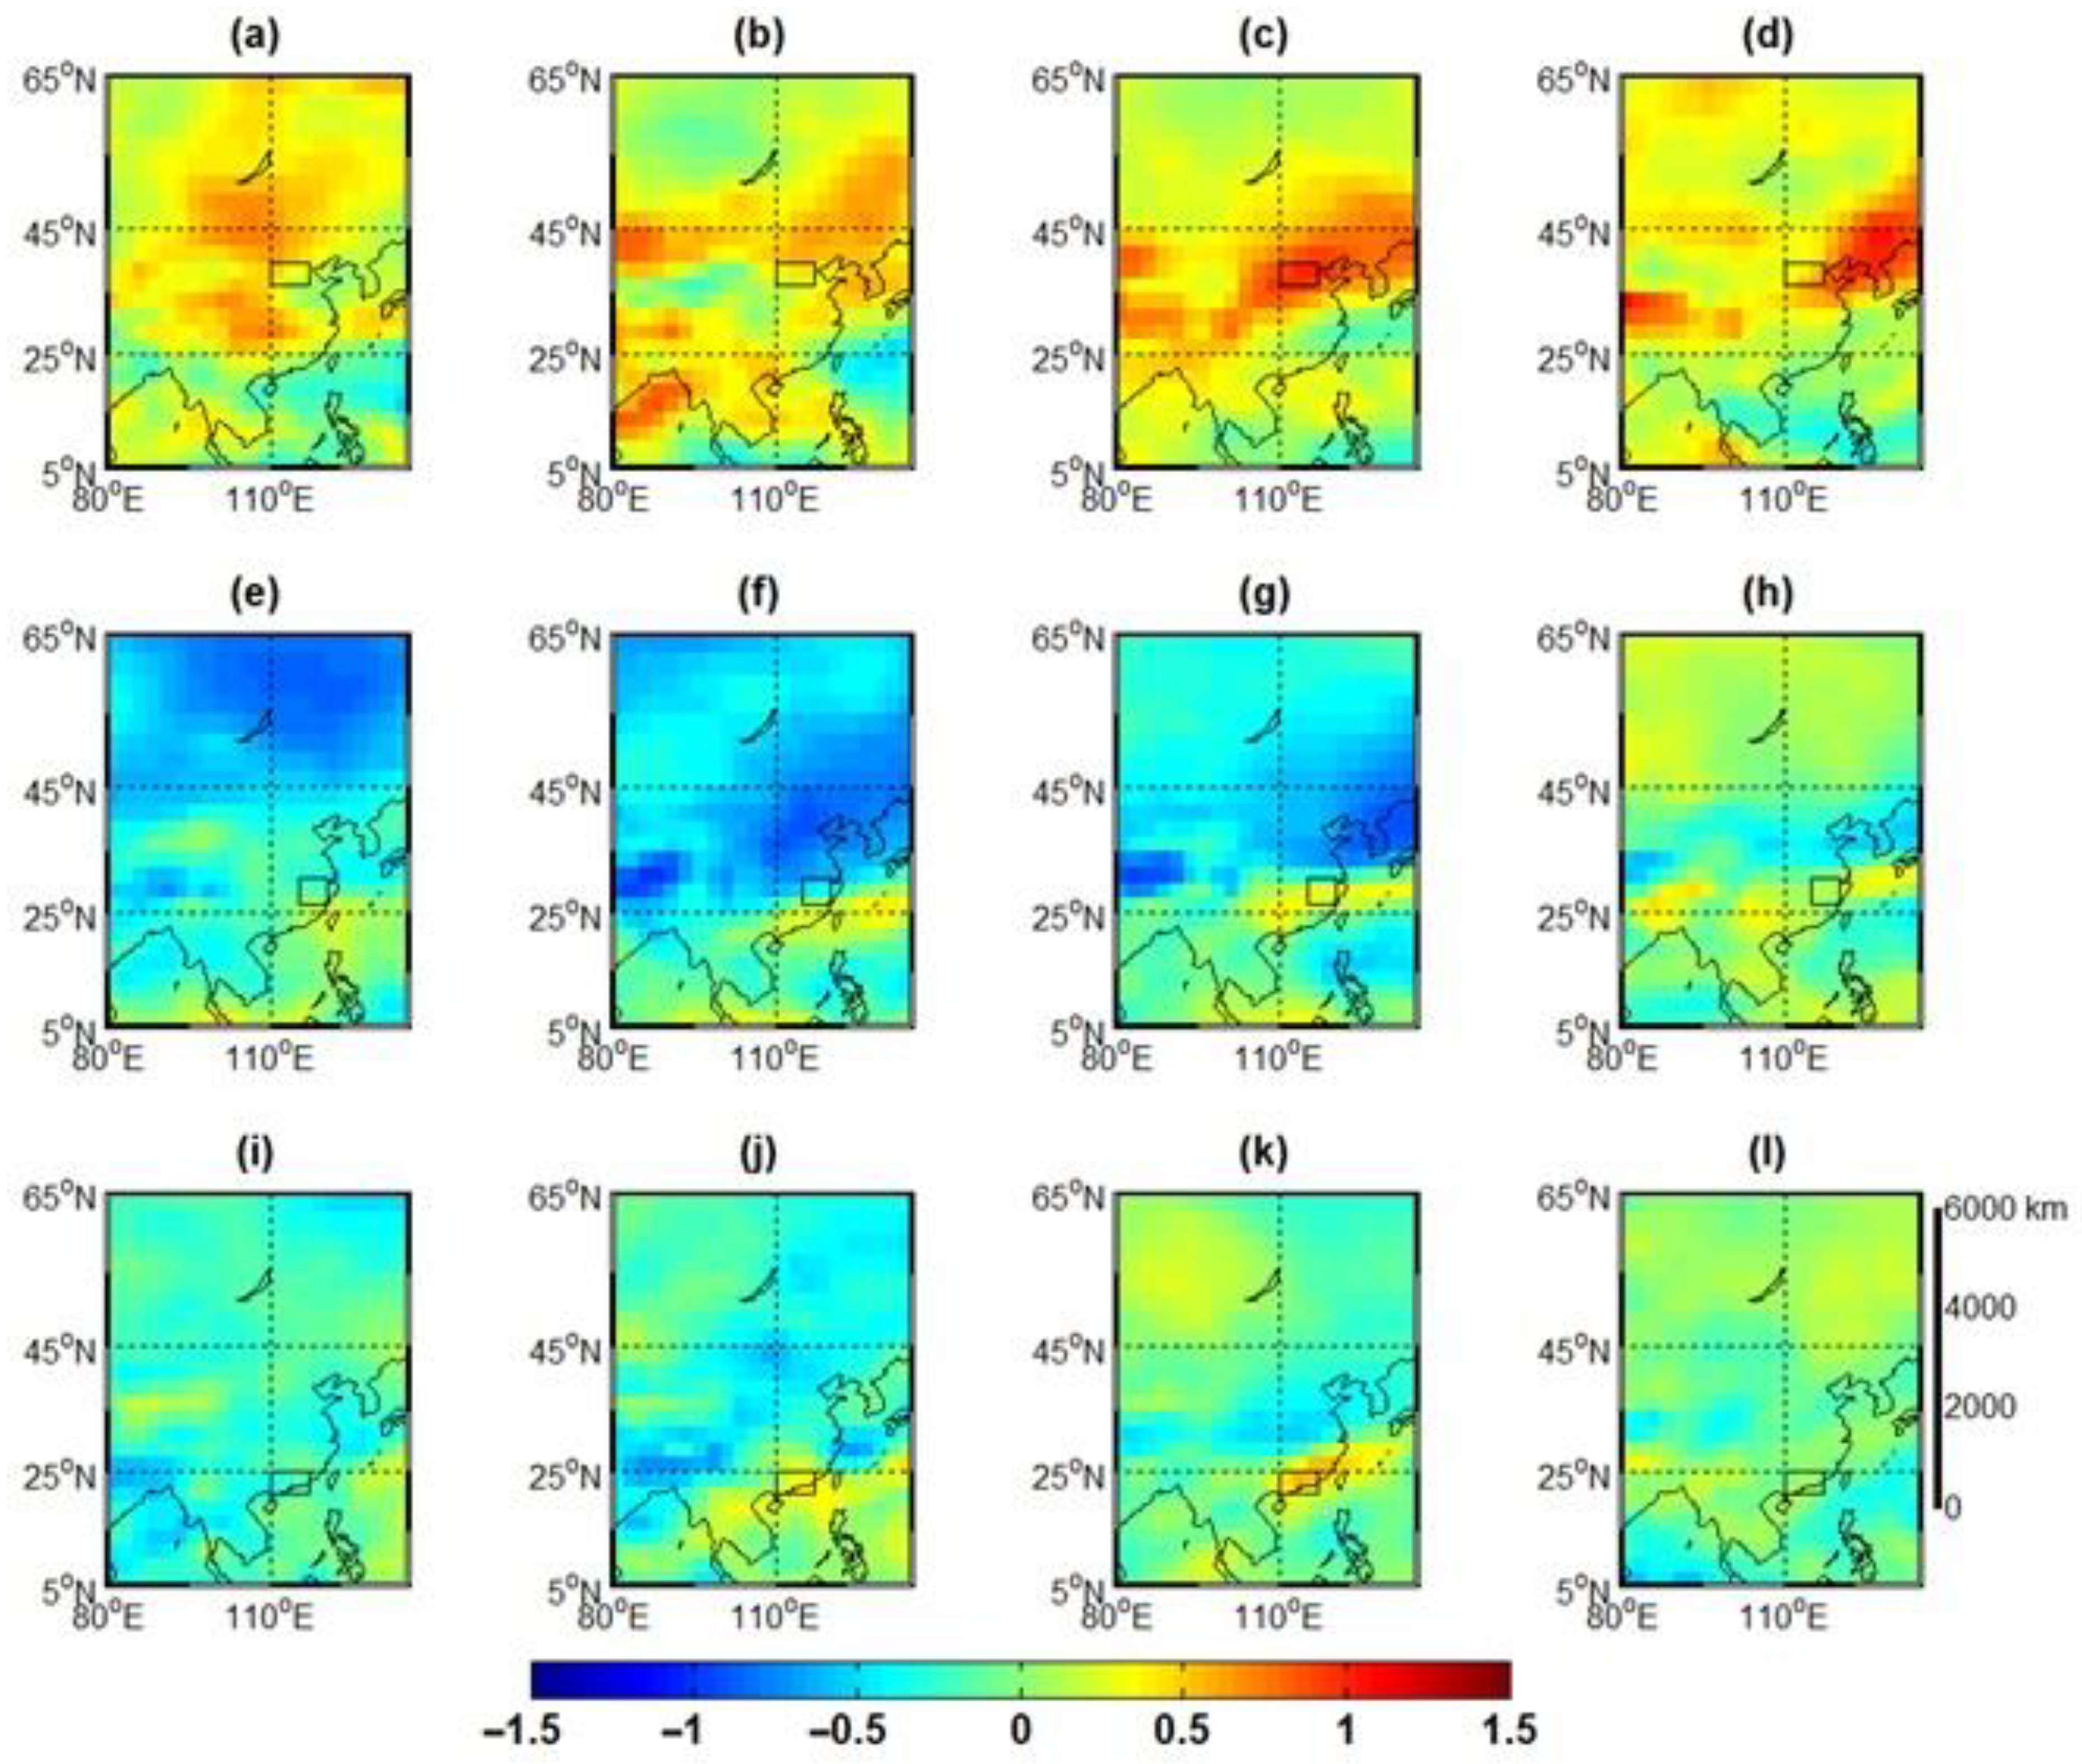
Figure 6 shows the four stages of the evolution of the standardized anomaly of the 500 hPa geopotential height. These four phases are (1) −10 to −6 days, (2) −5 to −1 days, (3) 1 to 14 days, and (4) 15 to 21 days. Among them, day −1 represents the day before the start of the 14-day PEPE.
In the time window of days −5 to −1, the circulation situation synthesis in several regions is similar to that during the 14-day event (Figure 6b,f,j). All three regions have circulation situations with saddle trough ridge anomalies similar to their event compositions. However, their locations and shapes are slightly different. The common feature of all regions at this stage is that the prototype of the saddle trough ridge anomaly has been basically formed, only in a slightly deviated position.
In the time window from −10 to −6 days (Figure 6a,e,i), no significant anomalies are found in the circulation situation synthesis in several regions. The ridge-dominated circulation situation in North China, the trough-dominated circulation situation in South China, and the ridge-trough co-existence circulation situation in the Yangtze River valley are not shown in this period. Therefore, it is difficult to capture a clear precursor signal in the time window of days −10 to −6.
A very pronounced saddle-type circulation situation is formed in each region during 1–14 days (Figure 6c,g,k), which is very favorable for the occurrence of the 14-day PEPE and its maintenance for a long period of time. The meridional distribution of the low pressure trough (long low pressure band) is very favorable to the southward movement of cold air from the north, and the stability of the subtropical high pressure in a specific area is favorable to the continuity of the rainstorm occurrence. Southwest warm and humid airflow is able to move northward along the edge of the sub high and meet the cold air from the north continuously at the northern edge of the sub high, which is the location of the continuity of the rainstorm occurrence.
The 14-day event is followed by the 15–21 day one (Figure 6d,h,l), when the saddle field cannot be maintained and thus the region collapses. The circulation situation at this stage is no longer conducive to the maintenance of persistent rainstorms, and the 14-day PEPE ends at this stage.

4.1.2. Standardized 200 hPa Zonal Wind Anomalies Lagged Composites

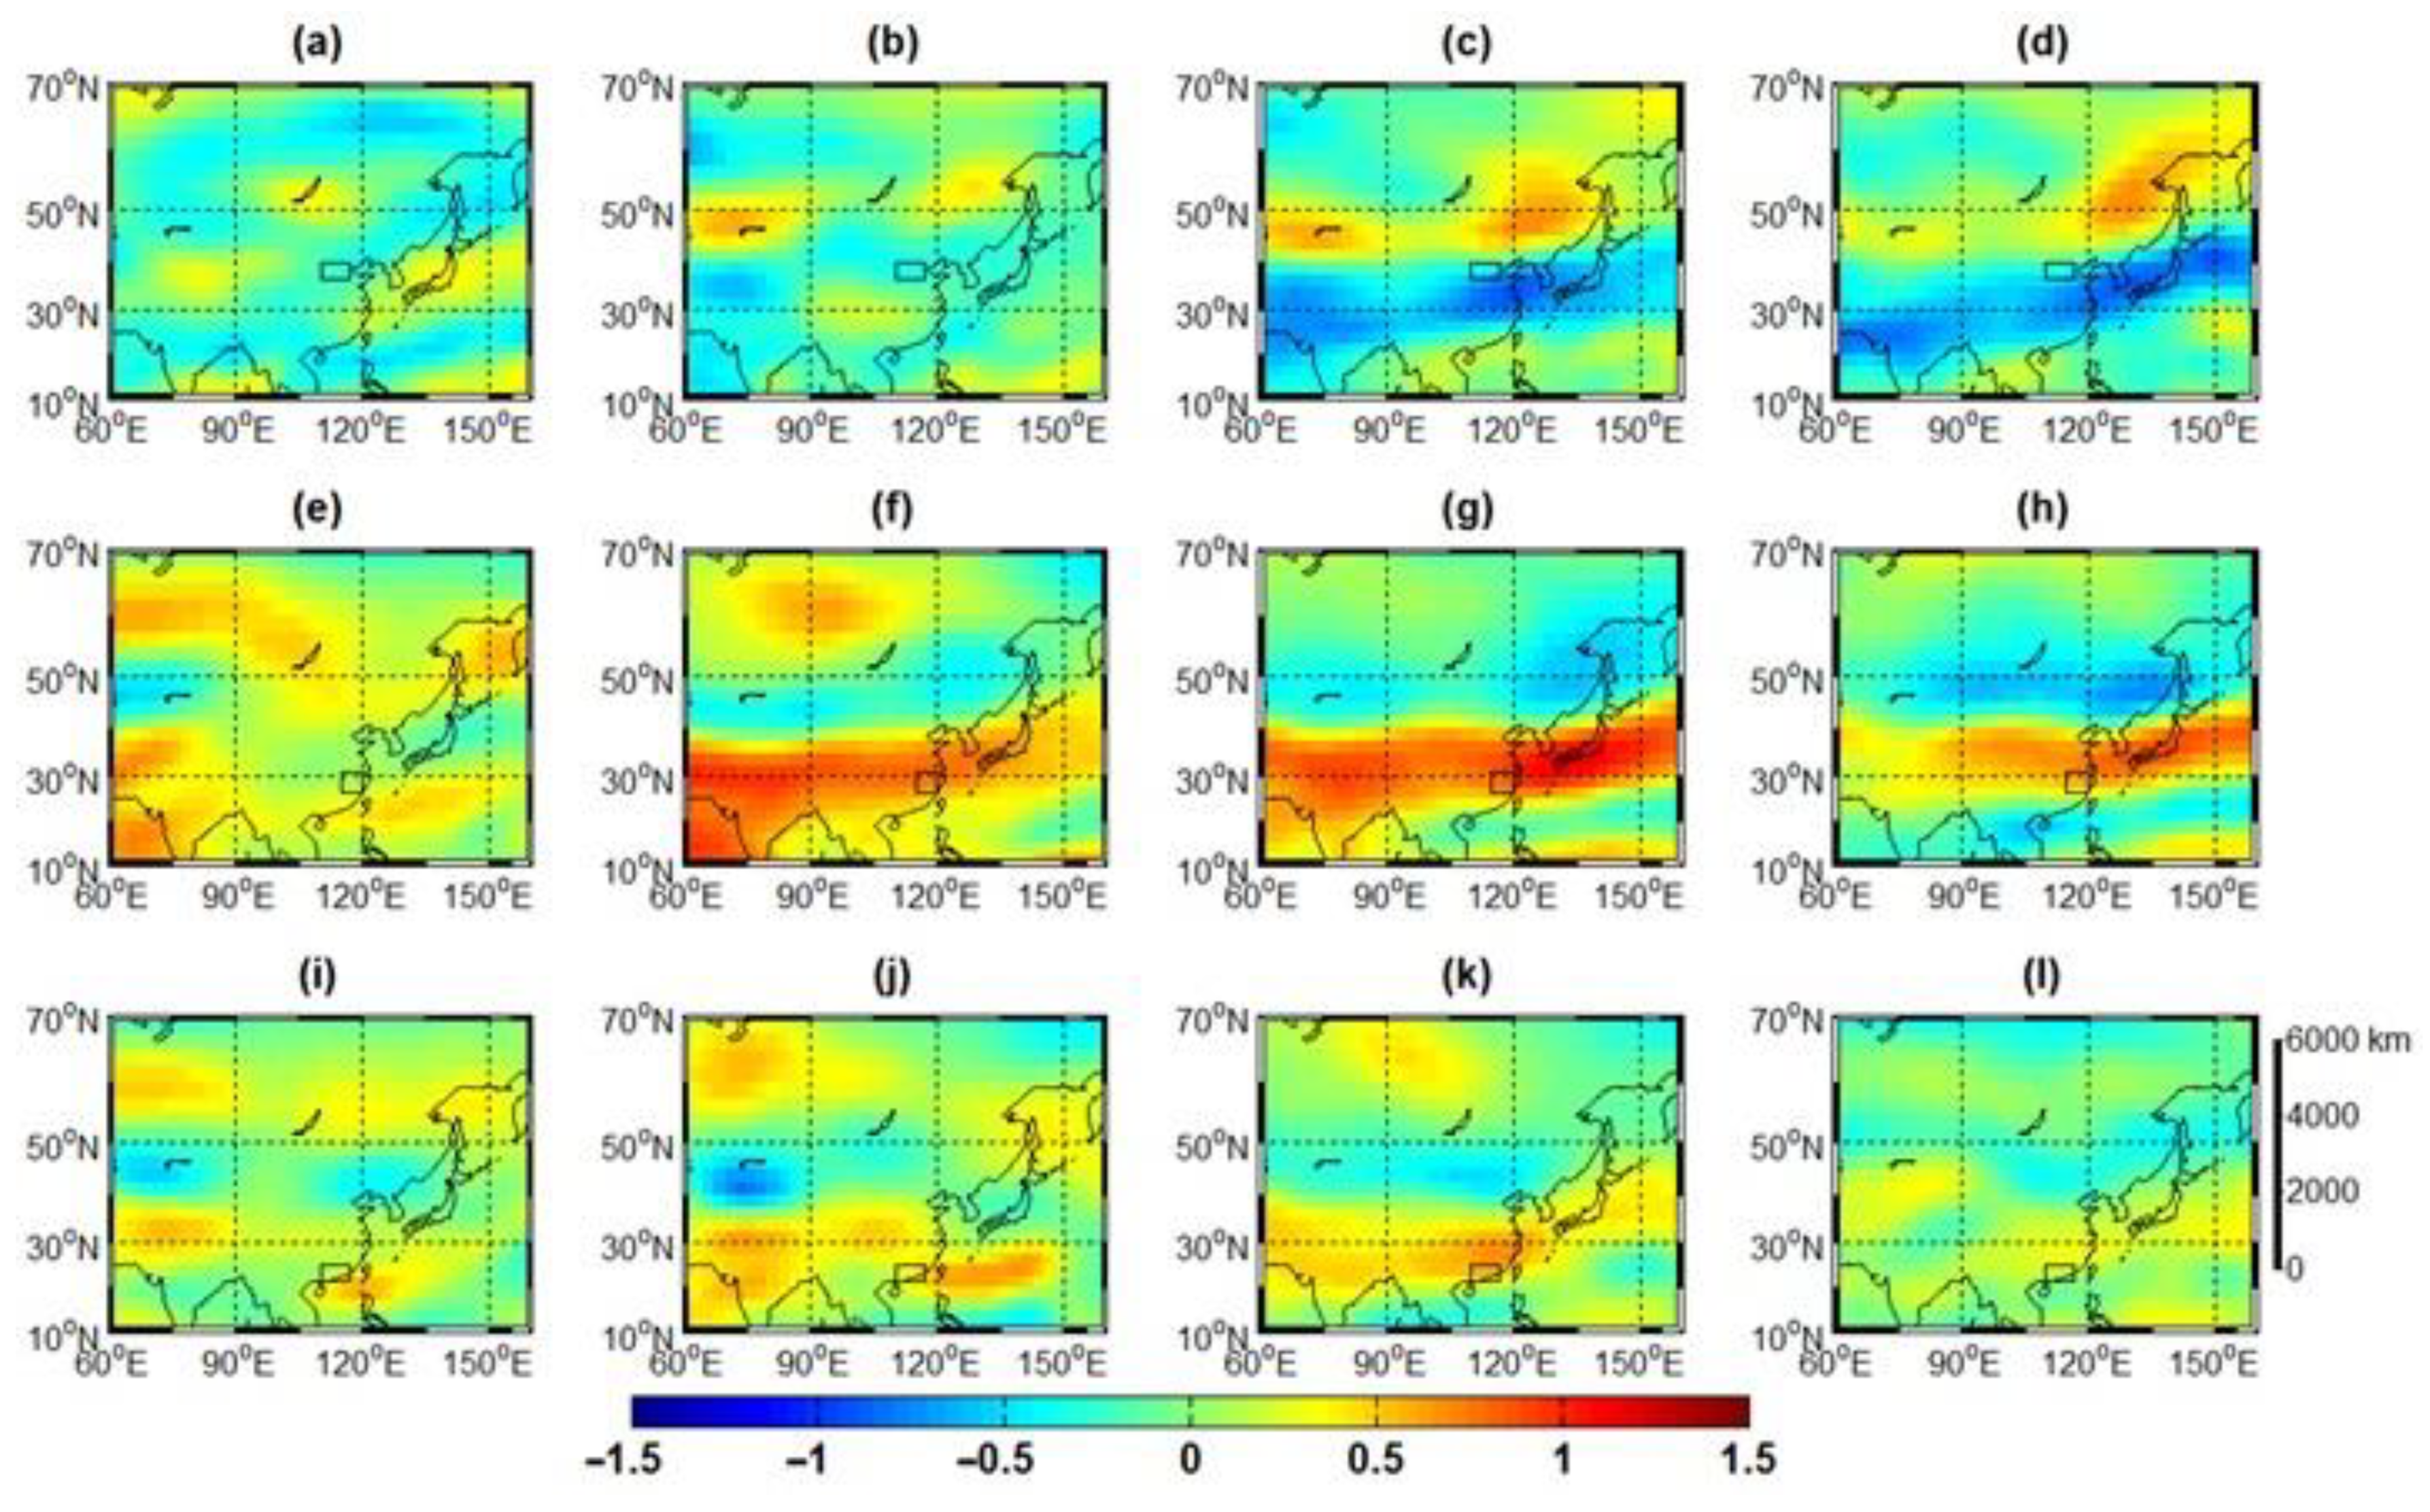
The same lagged synthesis analysis was performed in the 200 hPa zonal wind (Figure 7). Similar to the results for the geopotential height, the zonal wind synthesis in several regions was closest to that during the 14-day PEPE in the time window from day −5 to −1. During this period, positive zonal wind anomalies were observed in the stormy areas of the Yangtze River valley and southern China, except for northern China. This is a favorable signal for precipitation. During the time window from day −10 to −6, the zonal wind anomalies in several regions are relatively disorganized and no obvious precursor features are found. On days 15 to 21, positive zonal wind anomalies have moved away from the storm area or have disappeared and no longer have the conditions to sustain 14-day PEPE.
Figure 8 shows the evolution of the standardized anomaly of the pseudo comparable potential temperature on the 850 hPa isobaric surface in four stages. In the time window from day −10 to −6, several regions of the θ se do not show significant signals. In the time window of days −5 to −1, a clear signal of formation has been generated and can be considered as the brewing stage of the storm. The warm and humid air carried by the low-level southerly wind piles up near the storm area and the θ se gradually increases. The high value of the θ se represents a high-energy, high-moisture, unstable warm and humid airflow, which is able to transport a large amount of water vapor and unstable energy to the storm area. However, no significant cold and warm air convergence has been formed at this stage, and the storm has not yet started.
In days 1 to 14, very obvious cold and warm air convergence is formed in each area, which can be regarded as the development and maintenance stage of the rainstorm. The position of the hypothetical equivalent temperature reflects the interplay and confrontation between cold air and warm and humid air during the rainstorm. The rainstorm occurs near the high value of the θ se on the 850 hPa isobar. On the 15th to 21st day, it is the weakening and stopping stage of the rainstorm. At this time, the unstable energy has been fully released, the high value center of the θ se gradually weakens until it disappears, and the rainstorm area turns into a low-energy area, and rainfall gradually stops.

4.2. Modes of Climate Variability

To examine the role played by teleconnection patterns in forecasting 14-day PEPEs, we performed a lagged integrated analysis for several major atmospheric teleconnection pattern normalized indices affecting climate change in China (Figure 9).
For the EAP (Figure 9a), it rises early in the Yangtze River basin, then rises gradually throughout the event period and decreases early just before the end of the time. South China changed from positive to negative in advance and then slowly increased during the event. There is no clear precursor signal for North China; instead, the EAP is a few days later than the PEPEs.
For the MJO (Figure 9b), the Yangtze River valley and South China are similar in that both have an early signal, with South China being more pronounced. The MJO indicator starts to increase before the start of the extreme event and decreases after the end of the event. The signal is not obvious in North China.
For the PNA (Figure 9c), the precursor signal is obvious in South China. The signal is more lagging in North China. The Yangtze River valley is almost synchronous.
For the WP (Figure 9d), both North and South China have precursor signals, and the precursor signal in South China is more obvious. For the Yangtze River valley, there is no obvious signal.

5. Summary and Conclusions

Persistent extreme precipitation events (PEPEs) have a huge social impact on society and therefore need to be better understood and better predicted. The research on forecasting with a prediction time limit of 1 to 2 weeks can be of great value to society by understanding the extent to which the earth system can be predicted, thus bridging the gap between weather and climate predictions. To address the scientific problems and technical difficulties in the forecasting of PEPEs, the identification techniques of 14-day PEPEs are studied. Based on the accurate delineation of the extent of flooding caused by PEPE, the weather characteristics associated with 14-day PEPEs (including anomalous troughs, ridges, AR activity, teleconnections, etc.) are derived using composite analysis methods.
To investigate the differences among different regions, 14-day PEPEs in summer (June to August) in three different regions of North China, the Yangtze River valley, and South China were selected and synthesized into the mean circulation (500 hPa geopotential height field) in this paper. It is found that the circulation situations in the three different regions show the characteristics of a high-low-high saddle field. Therefore, it can be concluded that the representative weather pattern of the 14-day PEPE is the 500 hPa ridge-trough-ridge circulation configuration. The occurrence of this circulation situation is very favorable for PEPE.
In addition to the favorable circulation situation, another important factor is the anomalous increase of 200 hPa zonal wind. Significant zonal wind anomalies in three different regions occur over a large area during 14-day PEPEs. This configuration of upper zonal wind and high mid-level potential provides a favorable dynamical configuration for the 14-day PEPE.
Typically, positive IVT anomalies indicate increased water vapor transport in a region during a 14-day PEPE. Thus, enhanced water vapor transport is also a major feature of 14-day PEPEs. In North China, the anomalous easterly flow area corresponds to a positive water vapor flux anomaly. In the Yangtze River valley and southern China, the water vapor flux corresponding to the warm and humid airflow area from the southwest is a positive anomaly. These results suggest that many external factors are conducive to the transport of water vapor to the rainstorm area during the 14-day PEPE.
The potential pseudo-equivalent temperature ( θ se ), as a temperature and humidity characteristic quantity reflecting the unstable energy of the atmosphere, is a powerful tool for storm diagnosis and forecasting. In the three regions, the persistent rainfall areas are located at or close to the 850 hPa θ se positive distance level. It is shown that the variation of the θ se can reflect the activity of cold and warm air during the rainstorm.
To explore the contribution of ARs to 14-day PEPEs in different regions, we calculated the frequency of AR occurrence in each of the three regions. The results show that there is a significant rise in ARs in each region during the occurrence of 14-day PEPEs. This implies that the active AR is a very important feature of the 14-day PEPEs.
To analyze whether there are significant precursors to the 14-day PEPE, we analyzed lagged combinations of several climate variables. In the time window of day −5 to −1, the variable fields such as 850 hPa geopotential height, 200 hPa zonal winds, and θ se on the 850 hPa isobaric surface have all produced clear signals of formation, which can be regarded as the brewing stage of heavy rain.
In order to analyze whether there are precursors to longer-term extreme precipitation events, we conducted a lagged composite analysis of several major atmospheric remote correlation-type standardized indices that affect climate change in China. It was found that the three regions behaved completely differently. In North China, there were obvious precursor signals except for EAP. In the Yangtze River basin, EAP and MJO had more obvious precursor signals. The PNA and WP precursors are not obvious. In South China, all indices have obvious precursor signals.
Considering the increasing emphasis on the prediction skills of PEPEs and the high impact of PEPEs, our research focuses on the basic characteristics of the 14-day PEPEs (including circulation configuration, westerly jet, water vapor transport, etc.), as well as the possible links with large-scale atmospheric teleconnection. In addition, our study also analyzed the role of ARs in PEPEs, and extracted the precursor signals of PEPEs. The research of this paper comprehensively considers many factors: the identification technology of PEPEs events, the comprehensive analysis of weather characteristics, the possible relationship with PEPEs and the predictability of PEPEs. Through these works, we can fully understand the utility of using different clues in predicting such events. Our research provides a reference for the establishment of physical and statistical prediction theories and methods of PEPEs in China. It is of great value to society to understand the degree to which persistent extreme precipitation can be predicted, so as to bridge the gap between weather and climate prediction.

Author Contributions

Conceptualization, X.S.; project administration, X.S.; supervision, Y.W.; validation, X.S.; writing—original draft, Y.W.; writing—review and editing, X.S. All authors have read and agreed to the published version of the manuscript.

Funding

This research was funded by the China Postdoctoral Science Foundation, Grant No. 2018M632334.

Institutional Review Board Statement

Not applicable.

Informed Consent Statement

Not applicable.

Data Availability Statement

NCEP/DOE Reanalysis II data provided by the NOAA PSL, Boulder, Colorado, USA, from their website at https://psl.noaa.gov (accessed on 10 August 2021). CPC Global Unified Gauge-Based Analysis of Daily Precipitation data provided by the NOAA PSL, Boulder, Colorado, USA, from their website at https://psl.noaa.gov (accessed on 10 August 2021). MJO index can be downloaded from the Australia Meteorological Bureau (http://www.bom.gov.au/climate/mjo/, accessed on 10 August 2021). NCEP/DOE Reanalysis II data provided by the NOAA PSL, Boulder, Colorado, USA, from their website at https://psl.noaa.gov (accessed on 10 August 2021).

Acknowledgments

This work was supported by the China Postdoctoral Science Foundation (Grant No. 2018M632334). NCEP/DOE Reanalysis II data provided by the NOAA PSL, Boulder, Colorado, USA, from their website at https://psl.noaa.gov (accessed on 10 August 2021). CPC Global Unified Gauge-Based Analysis of Daily Precipitation data provided by the NOAA PSL, Boulder, Colorado, USA (https://psl.noaa.gov, accessed on 10 August 2021). MJO index was provided by Australia Meteorological Bureau (http://www.bom.gov.au/climate/mjo/, accessed on 10 August 2021).

Conflicts of Interest

The authors declare no conflict of interest. The funders had no role in the design of the study; in the collection, analyses, or interpretation of data; in the writing of the manuscript; or in the decision to publish the results.

References

  1. Chen, D.L.; Ou, T.H.; Gong, L.B.; Xu, C.Y.; Li, W.J.; Ho, C.H.; Qian, W.H. Spatial interpolation of daily precipitation in China: 1951–2005. Adv. Atmos. Sci. 2010, 27, 1221–1232. [Google Scholar] [CrossRef]
  2. Bao, M. The statistical analysis of the persistent heavy rain in the last 50 years over China and their backgrounds on the large scale circulation. Chin. J. Atmos. Sci. 2007, 31, 779–792. (In Chinese) [Google Scholar]
  3. Zhai, P.M.; Ni, Y.Q.; Chen, Y. Mechanism and forecasting method of persistent extreme weather events: Review and prospect. Adv. Earth Sci. 2013, 28, 1177–1188. (In Chinese) [Google Scholar]
  4. Yu, R.C.; Wang, B.; Zhou, T.J. Tropospheric cooling and summer monsoon weakening trend over East Asia. Geophys. Res. Lett. 2004, 31, L22212. [Google Scholar] [CrossRef]
  5. Yu, R.C.; Zhou, T.J. Seasonality and three-dimensional structure of interdecadal change in the East Asian monsoon. J. Clim. 2007, 20, 5344–5355. [Google Scholar] [CrossRef]
  6. Zhou, T.J.; Gong, D.Y.; Li, J.; Li, B. Detecting and understanding the multi-decadal variability of the East Asian summer monsoon—Recent progress and state of affairs. Meteorol. Z. 2009, 18, 455–467. [Google Scholar] [CrossRef]
  7. Tao, S.Y. The Torrential Rain in China; Science Press: Beijing, China, 1980; p. 225. [Google Scholar]
  8. Ye, D.Z.; Zhu, B.Z. Some Fundamental Problems on General Circulation of Atmosphere; Science Press: Beijing, China, 1958; p. 159. [Google Scholar]
  9. Tao, S.Y. A synoptic and aerological study on a cold wave in the far east during the period of the break down of the blocking situation over Euroasia and Atlantic. Acta Meteorol. Sin. 1957, 28, 63–74. [Google Scholar]
  10. Zhang, J.J. A qualitative analysis on the activity of the ultra-long wave. Chin. J. Atmos. Sci. 1979, 3, 99–108. [Google Scholar]
  11. Tao, S.Y.; Zhang, X.L.; Zhang, S.L. Study of Meiyu Front Induced Storm Rainfall along the Yangtze River; China Meteorological Press: Beijing, China, 2004; pp. 91–102. [Google Scholar]
  12. Ding, Y.H.; Wang, Z.Y.; Song, Y.F. Causes of the unprecedented freezing disaster in January 2008 and its possible association with the global warming. Acta Meteorol. Sin. 2008, 66, 808–825. [Google Scholar]
  13. Zhai, P.M.; Sun, A.J.; Ren, F.M.; Liu, X.N.; Gao, B.; Zhang, Q. Changes of climate extremes in China. Clim. Change 1999, 42, 203–218. [Google Scholar] [CrossRef]
  14. Zhai, P.M.; Wang, C.C.; Li, W. A review on study of change in precipitation extremes. Adv. Clim. Change Res. 2007, 3, 144–148. (In Chinese) [Google Scholar]
  15. Zhai, P.M.; Zhang, X.B.; Wan, H.; Pan, X.H. Trends in total precipitation and frequency of daily precipitation extremes over China. J. Clim. 2005, 18, 1096–1108. [Google Scholar] [CrossRef]
  16. Yan, Z.W.; Yang, C. Geographic patterns of extreme climate changes in China during 1951–1997. Clim. Environ. Res. 2000, 5, 267–272. (In Chinese) [Google Scholar]
  17. Qian, W.H.; Fu, J.L.; Zhang, W.W.; Lin, X. Changes in mean climate and extreme climate in China during the last 40 years. Adv. Earth Sci. 2007, 22, 673–684. (In Chinese) [Google Scholar]
  18. Ren, G.Y.; Feng, G.L.; Yan, Z.W. Progresses in observation studies of climate extremes and changes in mainland China. Clim. Environ. Res. 2010, 15, 337–353. (In Chinese) [Google Scholar]
  19. Marciano, C.G.; Lackmann, G.M. The South Carolina flood of October 2015: Moisture transport analysis and the role of Hurricane Joaquin. J. Hydrometeorol. 2017, 18, 2973–2990. [Google Scholar] [CrossRef]
  20. Lynch, S.L.; Schumacher, R.S. Ensemble-basedanalysis of the May 2010 extreme rainfall in Tennessee and Kentucky. Mon. Weather Rev. 2014, 142, 222–239. [Google Scholar] [CrossRef]
  21. Lackmann, G.M. The south-central U.S. flood of May 2010: Present and future. J. Clim. 2013, 26, 4688–4709. [Google Scholar] [CrossRef]
  22. Zhao, S.; Deng, Y.; Black, R.X. A dynamical and statistical characterization of U.S. extreme precipitation events and their associated large-scale meteorological patterns. J. Clim. 2017, 30, 1307–1326. [Google Scholar] [CrossRef]
  23. Touma, D.; Michalak, A.M.; Swain, D.L.; Diffenbaugh, N.S. Characterizing the spatial scales of extreme daily precipitation in the United States. J. Clim. 2018, 31, 8023–8037. [Google Scholar] [CrossRef]
  24. Konrad, C.E. The most extreme precipitation events over the eastern United States from 1950 to 1996: Considerations of scale. J. Hydrometeorol. 2001, 2, 309–325. [Google Scholar] [CrossRef]
  25. Schumacher, R.S.; Johnson, R.H. Characteristics of U.S. extreme rain events during 1999–2003. Weather Forecast. 2006, 21, 69–85. [Google Scholar] [CrossRef]
  26. Moore, B.J.; Mahoney, K.M.; Sukovich, E.M.; Cifelli, R.; Hamill, T.M. Climatology and environmental characteristics of extreme precipitation events in the southeastern United States. Mon. Weather Rev. 2015, 143, 718–741. [Google Scholar] [CrossRef]
  27. Chiodi, A.M.; Bond, N.A.; Larkin, N.K.; Barbour, R.J. Summertime rainfall events in eastern Washington and Oregon. Weather Forecast. 2016, 31, 1465–1480. [Google Scholar] [CrossRef]
  28. Collow, A.B.M.; Bosilovich, M.G.; Koster, R.D. Largescale influences on summertime extreme precipitation in the northeastern United States. J. Hydrometeorol. 2016, 17, 3045–3061. [Google Scholar] [CrossRef]
  29. Flanagan, P.X.; Basara, J.B.; Furtado, J.C.; Xiao, X. Primary atmospheric drivers of pluvial years in the United States Great Plains. J. Hydrometeorol. 2018, 19, 643–658. [Google Scholar] [CrossRef]
  30. Newell, R.E.; Newell, N.E.; Zhu, Y.; Scott, C. Tropospheric rivers?—A pilot study. Geophys. Res. Lett. 1992, 19, 2401–2404. [Google Scholar] [CrossRef]
  31. Gershunov, A.; Shulgina, T.; Ralph, F.M.; Lavers, D.A.; Rutz, J.J. Assessing the climate-scale variability of atmospheric rivers affecting western North America. Geophys. Res. Lett. 2017, 44, 7900–7908. [Google Scholar] [CrossRef]
  32. Wick, G.A.; Neiman, P.J.; Ralph, F.M. Description and validation of an automated objective technique for identification and characterization of the integrated water vapor signature of atmospheric rivers. IEEE Trans. Geosci. Remote Sens. 2013, 51, 2166–2176. [Google Scholar] [CrossRef]
  33. Dong, L.; Leung, L.R.; Song, F.; Lu, J. Roles of SST versus internal atmospheric variability in winter extreme precipitation variability along the U.S. West Coast. J. Clim. 2018, 31, 8039–8058. [Google Scholar] [CrossRef]
  34. Ding, Y.H.; Liu, Y.J.; Song, Y.F. East Asian summer monsoon moisture transport belt and its impact on heavy rainfalls and floods in China. Adv. Water Sci. 2020, 31, 629–643. [Google Scholar]
  35. Guan, B.; Waliser, D.E. Detection of atmospheric rivers: Evaluation and application of an algorithm for global studies. J. Geophys. Res. Atmos. 2015, 120, 12514–12535. [Google Scholar] [CrossRef]
  36. Chao, J.; Guo, Y.; Xing, R. A theory and method of longrange numerical weather forecast. J. Meteorol. Soc. Jpn. 1982, 60, 282–291. [Google Scholar] [CrossRef]
  37. Shi, J. The application and uncentainty of the probability and statistics in meteorology. Chin. J. Appl. Probab. Stat. 1981, 4, 26–37. [Google Scholar]
  38. Zhang, P.Q.; Chou, J.F. A method improving monthly extended range forecasting. Plateau Meteorol. 1997, 16, 376–388. [Google Scholar]
  39. Sun, G.W.; Xin, F.; Kong, C.Y.; Chen, B.M.; He, J.H. Atmospheric low-frequency oscillation and extended range forecast. Plateau Meteorol. 2010, 29, 1142–1147. [Google Scholar]
  40. Qian, W.H.; Shan, X.L.; Zhu, Y.F. Capability of regional-scale transient wind anomalies to indicate regional heavy rains. Chin. J. Geophys. 2012, 55, 1513–1522. [Google Scholar]
  41. Huang, G. An Index Measuring the Interannual Variation of the East Asian Summer Monsoon-The EAP Index. Adv. Atmos. Sci. 2004, 21, 41–52. [Google Scholar] [CrossRef]
  42. Madden, R.A.; Julian, P.R. Observations of the 40–50-Day Tropical Oscillation—A Review. Mon. Weather Rev. 1994, 122, 814–837. [Google Scholar] [CrossRef]
  43. Wallace, J.M.; Gutzler, D.S. Teleconnections in the geopotential height field during the Northern Hemisphere winter. Mon. Weather Rev. 1981, 109, 784–812. [Google Scholar] [CrossRef]
  44. Jennrich, G.C.; Furtado, J.C.; Basara, J.B.; Martin, E.R. Synoptic Characteristics of 14-Day Extreme Precipitation Events Across the United States. J. Clim. 2020, 33, 6423–6440. [Google Scholar] [CrossRef]
  45. Kanamitsu, M.; Ebisuzaki, W.; Woollen, J.; Yang, S.K.; Hnilo, J.J.; Fiorino, M.; Potter, G.L. NCEP–DOE AMIP-II Reanalysis (R-2). Bull. Am. Meteorol. Soc. 2002, 83, 1631–1643. [Google Scholar] [CrossRef]
  46. Dettinger, M.D.; Ralph, F.M.; Rutz, J.J. Empirical return periods of the most intense vapor transports during historical atmospheric river landfalls on the U.S. West Coast. J. Hydrometeorol. 2018, 19, 1363–1377. [Google Scholar] [CrossRef]
  47. Wu, B.; Wang, J.; Walsh, J. Possible Feedback of Winter Sea Ice in the Greenland and Barents Seas on the Local Atmosphere. Mon. Weather Rev. 2003, 132, 1868–1876. [Google Scholar] [CrossRef]
  48. Wheeler, M.C.; Hendon, H.H. An all-season real-time multivariate MJO index: Development of an index for monitoring and prediction. Mon. Weather Rev. 2004, 132, 1917–1932. [Google Scholar] [CrossRef]
  49. Tao, S.Y.; Ding, Y.H. Observational evidence of the influence of the Qinghai -Xizang (Tibet) Plateau on the occurrence of heavy rain and severe convective storms in China. Bull. Am. Meteorol. Soc. 1981, 62, 23–30. [Google Scholar] [CrossRef]
  50. Alexander, L.V.; Zhang, X.; Peterson, T.C.; Ceasar, J.; Gleason, B.; Klein Tank, A.M.G.; Haylock, M.; Collins, D.; Trewin, B.; Rahimzadeh, F. Global observed changes in daily climate extremes of temperature and precipitation. J. Geophys. Res. 2006, 111, D05109. [Google Scholar] [CrossRef]
  51. Frei, A.; Kunkel, K.E.; Matonse, A. The seasonal nature of extreme hydrological events in the northeastern United States. J. Hydrometeorol. 2015, 16, 2065–2085. [Google Scholar] [CrossRef]
  52. Ding, Y.H. Summer monsoon rainfalls in China. J. Meteorol. Soc. Jpn. 1992, 70, 373–396. [Google Scholar] [CrossRef]
  53. Tang, Y.B.; Gan, J.J.; Zhao, L.; Gao, K. On the climatology of persistent heavy rainfall events in China. Adv. Atmos. Sci. 2006, 23, 678–692. [Google Scholar] [CrossRef]
  54. Sun, J.H.; Zhang, X.L.; Wei, J.; Zhao, S.X. A study on severe heavy rainfall in North China during the 1990s. Clim. Environ. Res. 2005, 10, 492–506. (In Chinese) [Google Scholar]
  55. Lei, L.; Xing, N.; Zhou, X.; Sun, J.S.; Zhai, L.; Jing, H.; Guo, J.L. Study on the warm-sector torrential rainfall during 15–16 July 2018 in Beijing area. Acta Meteor. Sin. 2020, 78, 1–17. (In Chinese) [Google Scholar]
  56. Zhou, X.; Sun, J.S.; Zhang, L.N.; Chen, G.J.; Cao, J.; Ji, B. Classification characteristics of continuous extreme rainfall events in North China. Acta Meteorol. Sin. 2020, 78, 761–777. [Google Scholar]
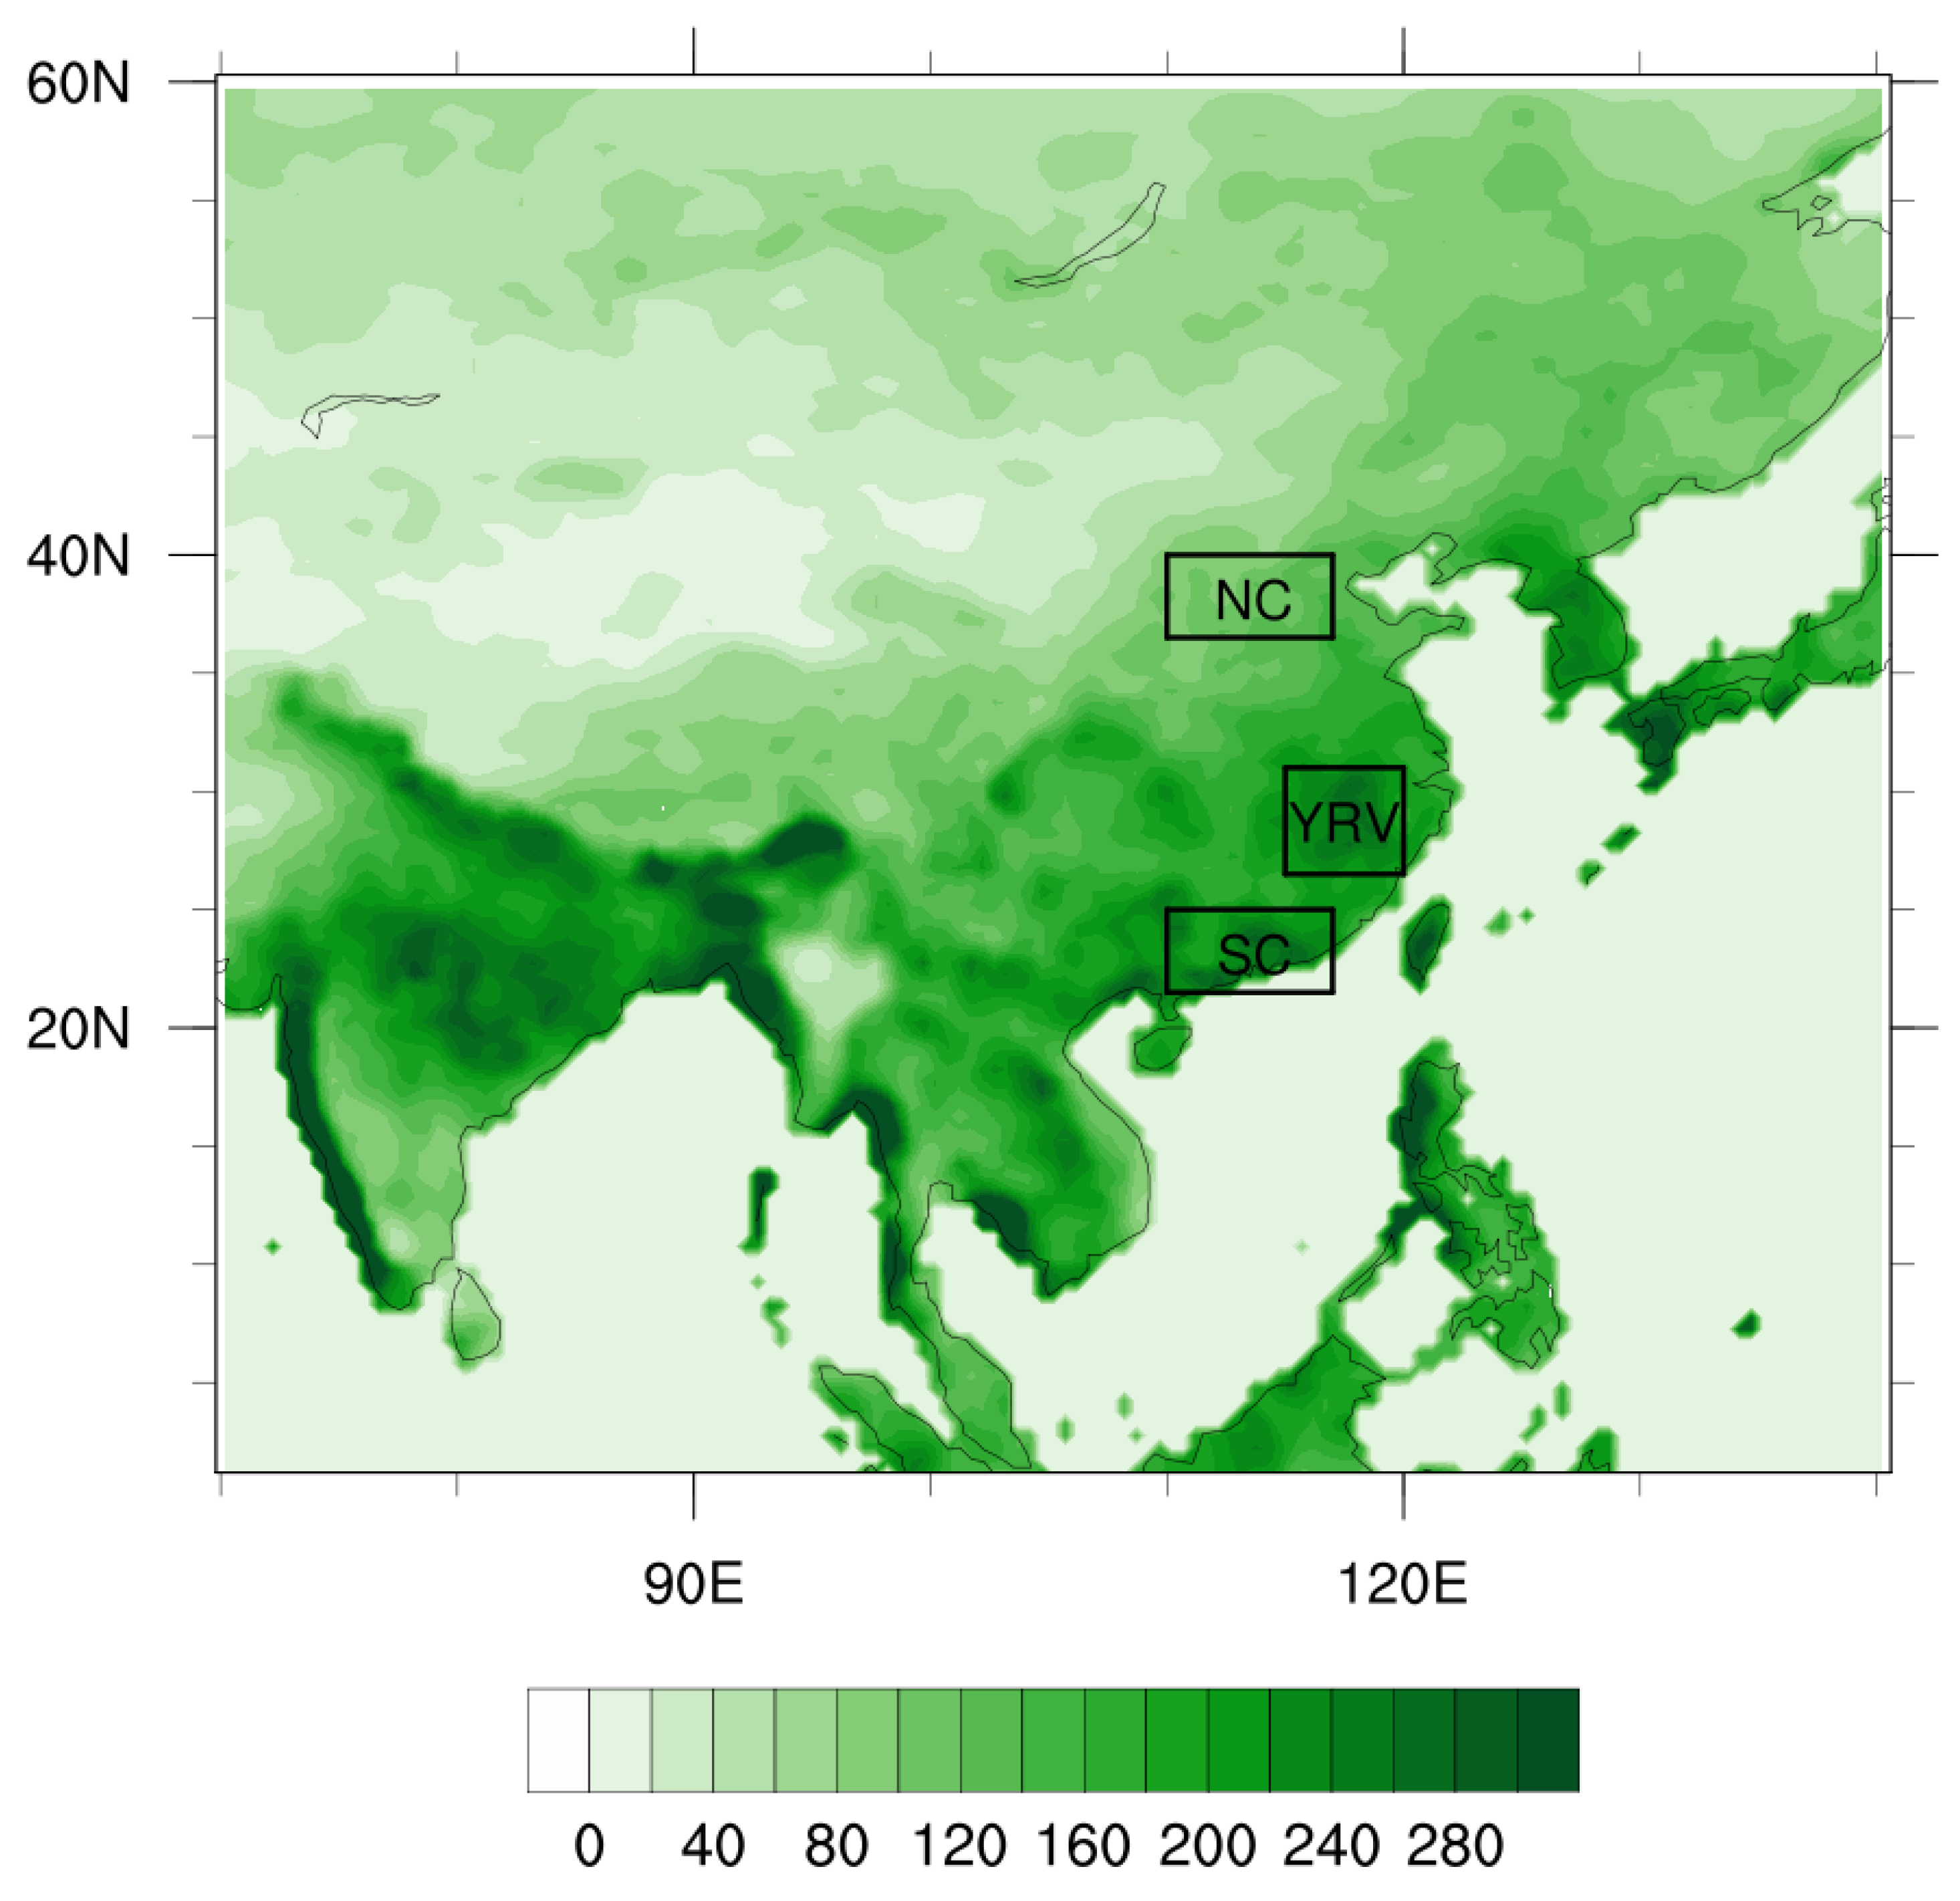
Figure 1. The 95th percentile (mm) of the distribution for 14-day precipitation totals from 1980 to 2019. The three regions (a) North China (NC), (b) Yangtze River Valley (YRV) and (c) South China (SC) of study for the Eastern China are delineated by the black-outlined polygons.
Atmosphere 13 01310 g001
Figure 2. Composite of NCEP2 500-hPa geopotential-height standardized anomalies (left column) and 200-hPa zonal winds standardized anomalies (right column) for extreme event days in (a,b) North China (NC), (c,d) Yangtze River Valley (YRV), and (e,f) South China (SC) for JJA 1980–2019.
Atmosphere 13 01310 g002
Figure 3. Composite of standardized anomalies of IVT magnitude for extreme event days in each region (shading) (left column) and standardized potential pseudo-equivalent temperature ( θ se ) anomalies (right column) for extreme event days in (a,b) North China (NC), (c,d) Yangtze River Valley (YRV), and (e,f) South China (SC) for JJA 1980–2019. Vectors (in (a,c,e)) depict the standardized anomalies of the u and v components of IVT.
Atmosphere 13 01310 g003
Figure 5. Results of clustering of IVT standardized anomalies using k-means method in (a,b) North China (NC), (c,d) Yangtze River Valley (YRV), and (e,f) South China (SC) for JJA 1980–2019. Type 1 (left column) represents AR days. Type 2 (right column) represents non-AR days.
Atmosphere 13 01310 g005
Figure 6. Composite of 500-hPa geopotential-height standardized anomalies for lagged windows of −10 to −6 (first column), −5 to −1 days (second column), 1 to 14 days (third column), and 15 to 21 days (forth column). Each row represents a region (Small black rectangular in the figure), from top to bottom, NC, YRV, and SC. (ad) North China (NC), (eh) Yangtze River Valley (YRV), and (il) South China (SC).
Atmosphere 13 01310 g006
Figure 7. As in Figure 6, but for 200-hPa zonal winds. (ad) North China (NC), (eh) Yangtze River Valley (YRV), and (il) South China (SC).
Atmosphere 13 01310 g007
Figure 8. As in Figure 6, but for potential pseudo-equivalent temperature ( θ se ). (ad) North China (NC), (eh) Yangtze River Valley (YRV), and (il) South China (SC).
Atmosphere 13 01310 g008
Figure 9. Lag composite time series for the atmospheric teleconnection Patterns (standardized) before, during, and after 14-day PEPEs. (a) East Asia-Pacific pattern (EAP), (b) Madden–Julian Oscillation (MJO), (c) Pacific-North America (PNA), and (d) Western Pacific (WP).
Atmosphere 13 01310 g009
Publisher’s Note: MDPI stays neutral with regard to jurisdictional claims in published maps and institutional affiliations.