Article

A Parameterized Design Method for Building a Shading System Based on Climate Adaptability

1
School of Architecture, Xi’an University of Architecture and Technology, Xi’an 710064, China
2
Department of Architecture & Environment, Xi’an Fine Art Academy, Xi’an 710065, China
3
School of Economics, Sichuan Agricultural University, Chengdu 625014, China
*
Authors to whom correspondence should be addressed.
Atmosphere 2022, 13(8), 1244; https://doi.org/10.3390/atmos13081244
Submission received: 26 June 2022 / Revised: 31 July 2022 / Accepted: 2 August 2022 / Published: 5 August 2022
(This article belongs to the Special Issue Numerical Simulations of Building Thermal and Indoor Air Quality)

Abstract

:
The relationship between environmental factors and the indoor physical environment is very close, and external shading is considered an effective way to adjust the interaction between the indoor and outdoor environment. However, determining how to set up an external shading system remains a notable issue. In the early design stage, architects have adopted the process of designing the form and function first and then checking whether those characteristics meet the energy-saving specifications. However, this process involves a great deal of repetitive and inefficient work and cannot meet the requirements of energy savings and emission reductions in a global context. Therefore, it is particularly important to seek a design method that combines energy-saving design with form-based design. This paper takes a construction project in Northwest China as its research object. In this study, typical parametric models for external shading are designed. Furthermore, indoor performance objectives based on light environment analysis are proposed, and Ladybug Tools and the genetic algorithm (GA) are used for optimization and verification. The optimization results show that the adaptive shading system can significantly reduce the total cooling energy consumption per unit area in summer by 20% and 15%, respectively. The comfort level throughout the year improved by 14.8% (air conditioning on) and 4.7% (air conditioning off). This study proposes a fast and effective shading parametric design method for architects in the early stage, improving the efficiency and accuracy of performance-based design.

1. Introduction

In China, the indoor performance of buildings is affected by a series of urban problems such as urban high density [1] and the urban heat island effect [2], as well as the policy requirements of “carbon neutrality” and “peak carbon dioxide emissions“ for energy conservation and emission reductions. In addition, the excessive pursuit of large-area glass curtain wall skin exposes people to negative thermal environments. This type of design can only maintain the comfort of the indoor thermal environment by consuming a large amount of energy [3,4], which is not conducive to the sustainability of the building. Performance-based design approaches include optimizing building performance in terms of energy consumption and thermal comfort using building design [5], and shading design is an important content of building design.
The above problems place higher requirements on the performance-based design of urban buildings. Therefore, it is very important to study related performance indicators. Architectural design is an effective measure to improve performance, and shading design is important in building design. Shading design is not only directly related to indoor comfort but also directly influences the expression of architects’ architectural concepts [6]. Previous work explored whether research on building shading can help design low-cost ways to reduce building energy consumption and improve the indoor living environment [7]. In real projects, architects often do not have extensive knowledge of building physics, leading to a separation between building design and performance analysis. Usually, building design solutions reach the construction drawing stage before professionals, such as HVAC engineers, perform performance simulations. However, many academics have noted the greater benefits of performance optimization during the early stages of design [8,9]. There is an urgent need for an automated approach to strengthen the link between building design and performance optimization.

1.1. The Importance of Building Shading

Many scholars believe that external shading facilities play an obvious role in improving indoor comfort and reducing building energy consumption [8,9] and have conducted in-depth studies on how to rationally utilize the effects of solar radiant heat gain [10], as well as reduce the adverse factors caused by thermal radiation. Rana Abdollahi Rizi et al. [11] studied the lighting performance of a typical building in Malaysia and found that simple improvements to window glass and shading facilities could significantly improve the lighting quality of the tropical region and enhance visual comfort. Ng Wai Tuck et al. [12,13] combined a roof cover with natural indoor ventilation to cost-effectively increase indoor thermal comfort and reduce indoor energy demand. Luo et al. [14] designed an effective energy-saving sunshade and heat collection device. The test results showed a linear relationship between the sunshade reflector’s sectional size, plate spacing, and local latitude. Huo et al. [15] argued that meteorological parameters are the main factors related to the shading effect. Through a sensitivity analysis of comprehensive factors affecting the shading effects of the external louvers of buildings, a regression equation was established and used to guide the shading design of different regions in China. Zhang et al. [16] explored a determination method for the outdoor calculation parameters of building shading design and discussed the shading effect and shading design calculations of buildings. Marco et al. [17] genetically optimized south-facing window settings to ensure summer sun protection while minimizing impacts on winter heat demand. The above research on adjusting the form of sunshade components to reduce building energy consumption has helped architects determine the problem and put forward optimization suggestions based on analyses. However, the method adopted in these studies extends from design to validation, starting with parametric shading design followed by a performance simulation of energy consumption and thermal comfort. This method’s lack of a clear design direction and ideas based on a climate environment perspective cannot effectively guide architects to design facade shading in the early stages of design.

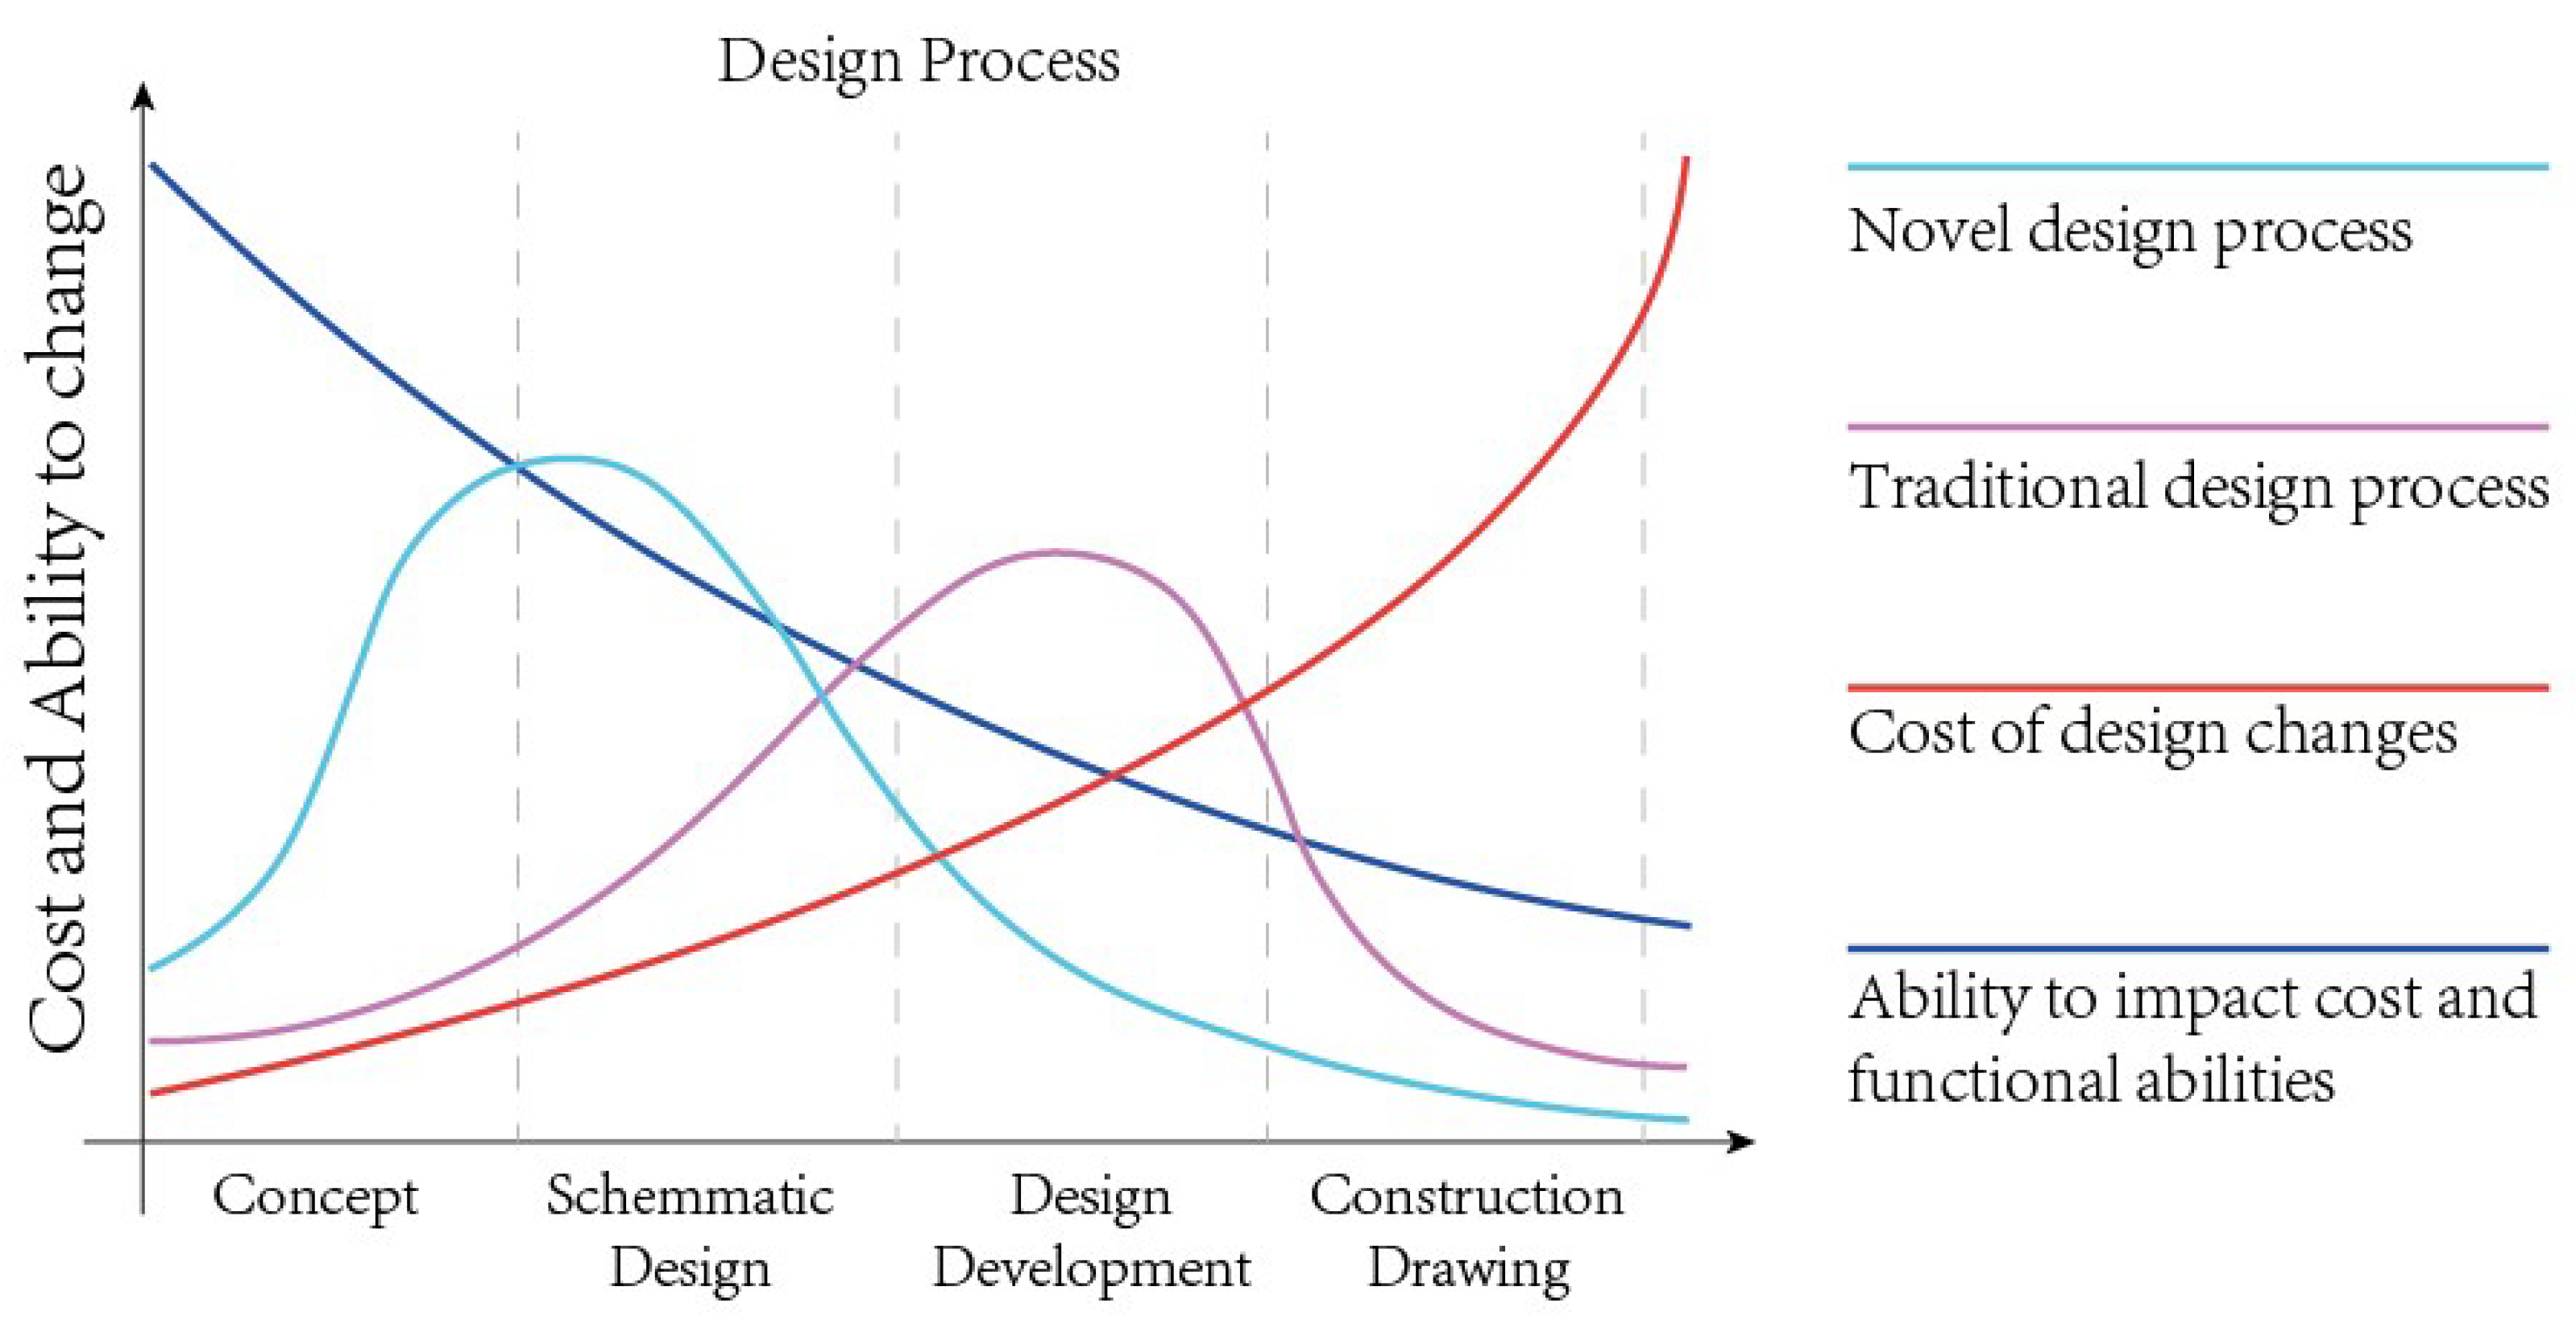
1.2. The Application of Parametric Design

The term “parametric” originates from mathematics and refers to using certain parameters or variables that can be modified. The principle of parametric design can be defined as mathematical design in which the design parameters control design elements by changing these parameters while creating new shapes. Parametric design uses specific software such as Rhino/Grasshopper to effectively modify and improve a design by simultaneously integrating and coordinating design components. As a result, any changes in parameters such as editing or development are automatically and immediately updated in the model, which makes the design process precise and efficient [18]. In recent years, parametric design tools have been increasingly applied in architectural design [19]. Ellika Taveres-Cachat et al. [20] proposed a multi-objective optimization method to improve the performance of photovoltaic shading devices; this method combined parametric design with genetic optimization to reduce indoor energy demand while maximizing solar energy utilization. Likai Wang et al. [21] discussed the synergy of building massing and facade design, generating solutions through parametric design and using evolutionary algorithms to filter the best performing solutions to support the early stages of design. Ali Ahmed Salem Bahdad et al. [22] parametrized the light-shelf design process and tested the sensitivity of the design parameters to the visual comfort and energy performance of the interior. Compared to traditional design methods, the application of new technologies, especially digital ones, greatly impacts the “input–output” ratio for the whole life cycle of a building. Although the initial investment time and cost can be considerable, this approach has significant sustainability benefits for the building (Figure 1). At present, parametric design has made great progress in building form, deep learning networks and building skin [23], performance index, and use cost analysis [24]. Thus, this type of design is playing a significant role in the renewal and optimization of buildings. However, in practical engineering, designers choose parametric design tools largely for diversified aesthetic needs and have realized preliminary integration of the performance-based architectural design concept and traditional architectural design through building performance simulation technology. However, this design process is only a “post-evaluation” of building performance, ignoring the advantages of coping with the climate environment [25]. However, even when a performance simulation is carried out, designers are still accustomed to the thinking mode of “scheme design–simulation research–scheme design” [26], which involves strong subjective judgment and weakens the correlation with the climate environment.

1.3. Aims and Motivation
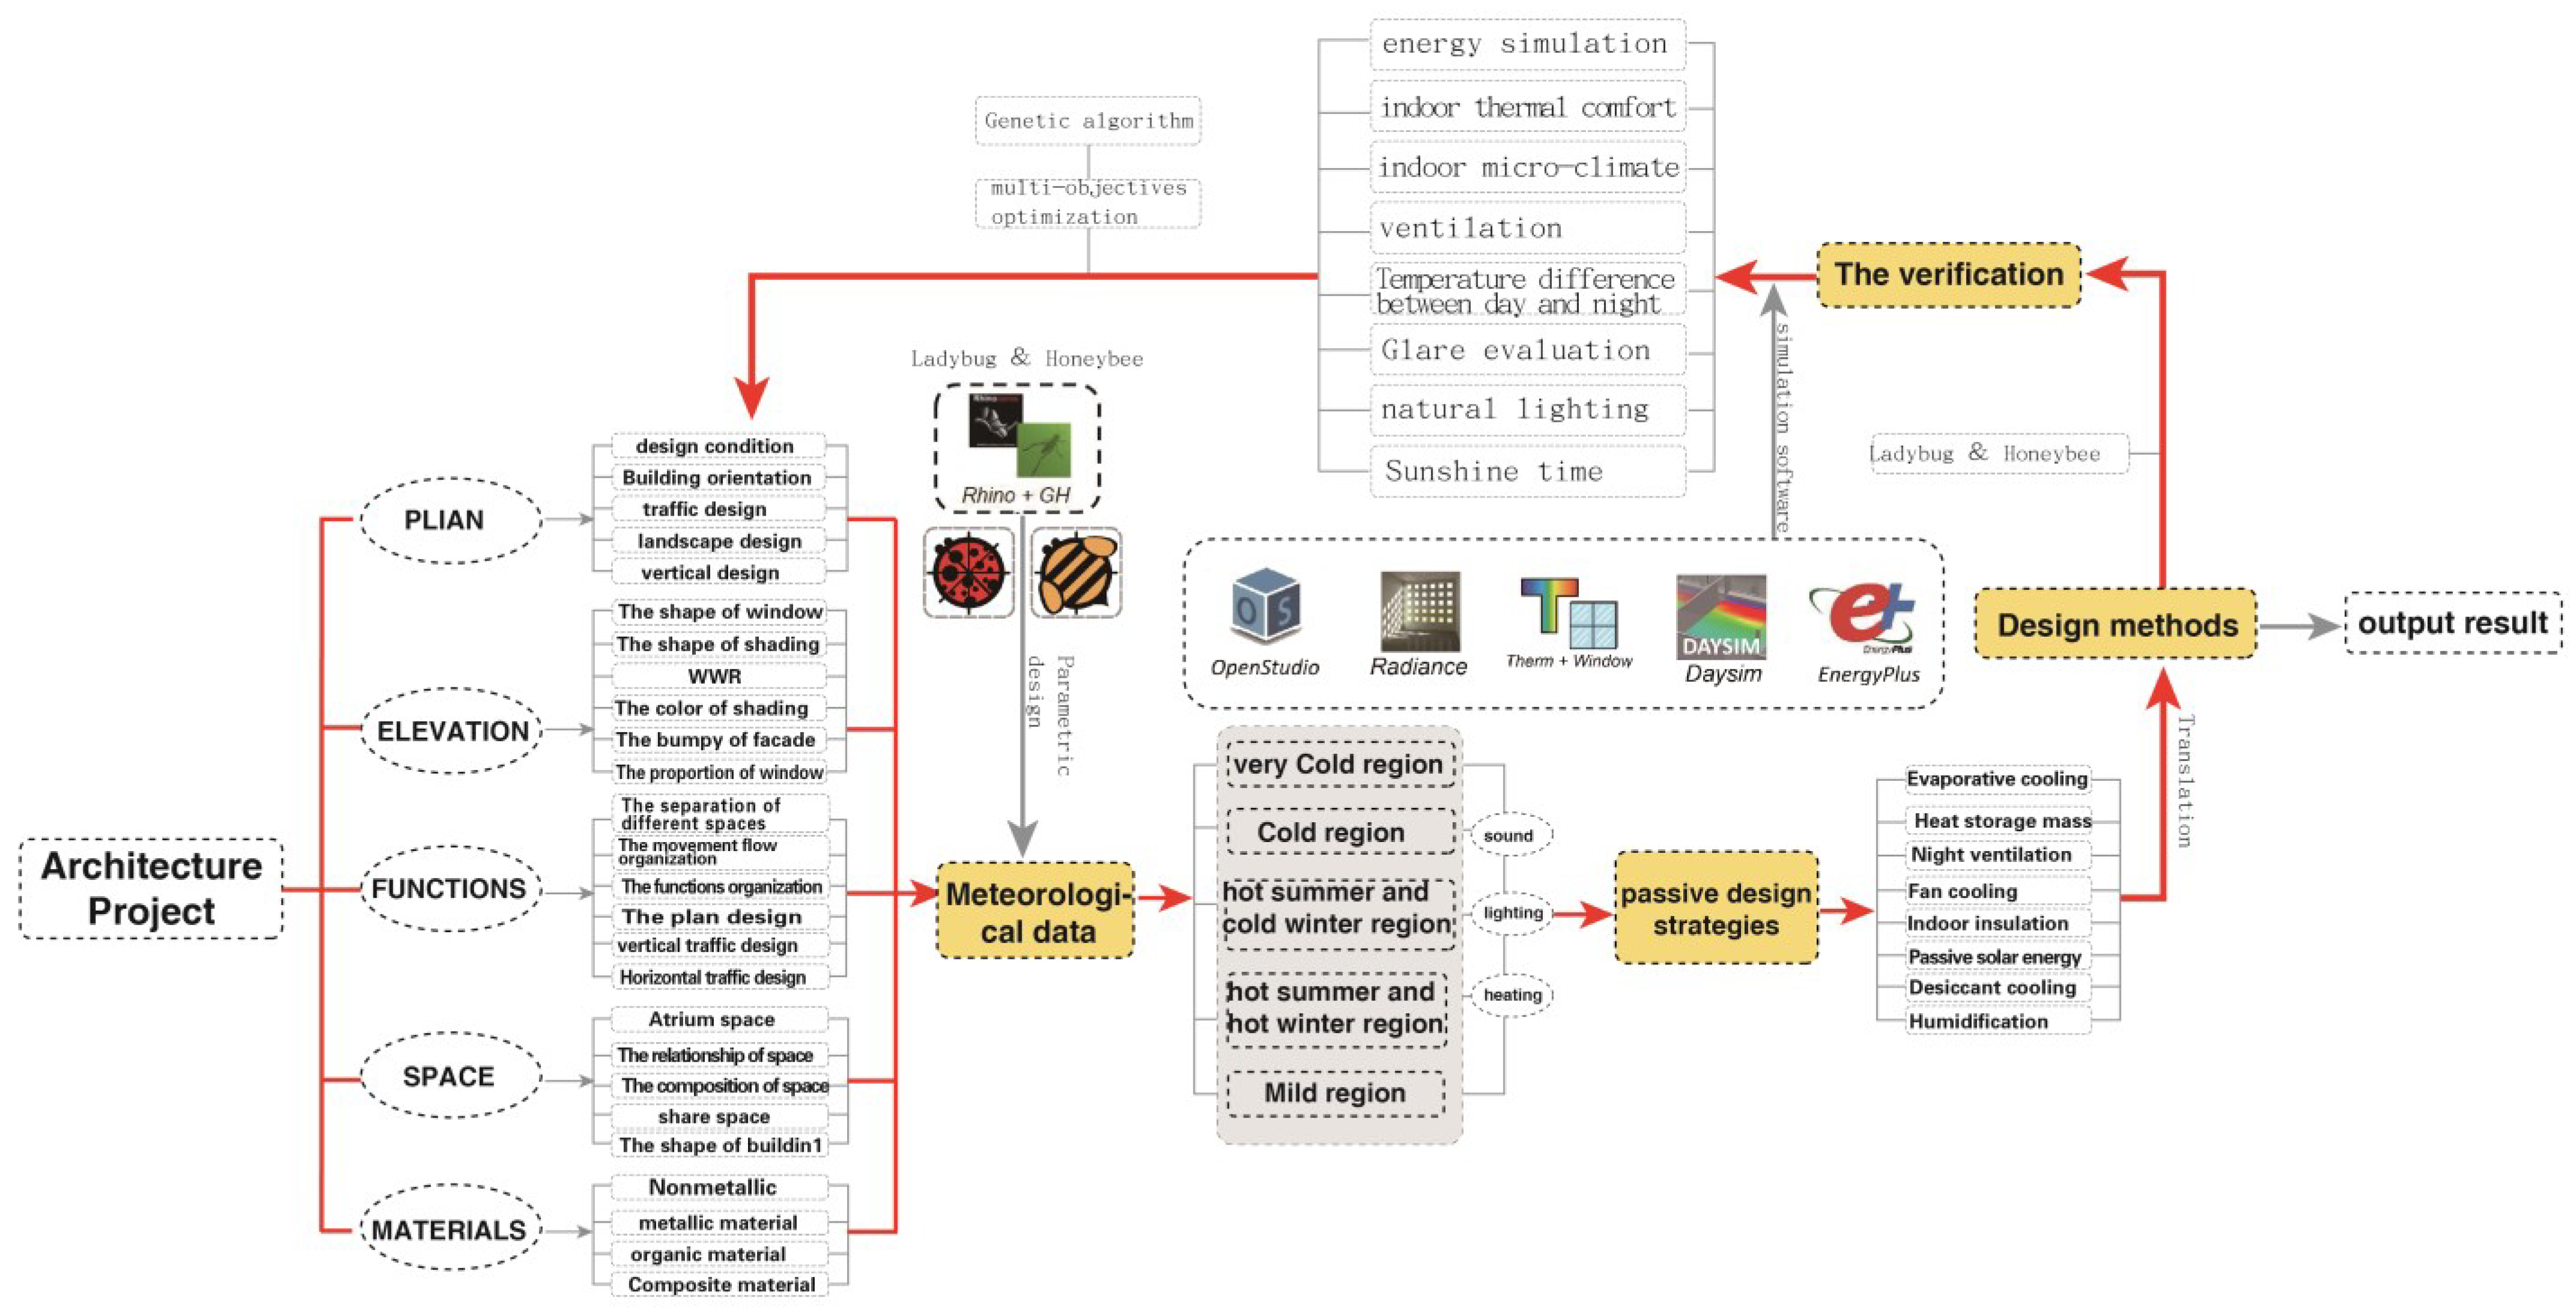
Considering the above analysis, the participation of parametric design in architectural performance-based design is still not sufficient, largely due to workflow defects. Based on an analysis and discussion of the early performance-based design method of a project case in Northwest China, the present study focuses on the optimization method and effects of the performance-based design workflow, taking facade design as the research object. Relevant descriptions are carried out from four perspectives: (1) analysis of climatic environment characteristics; (2) performance-based design target setting; (3) the workflow of Ladybug Tools; and (4) the verification of simulation results. Therefore, this paper seeks a more effective workflow method and uses Ladybug Tools and GA to propose a design route of “simulation + facade design”. At the same time, the Grasshopper parameterization platform offers visualization, data classification, and processing capabilities that can further edit the generated coloring forms to help architects complete the facade design.

2. Methodology

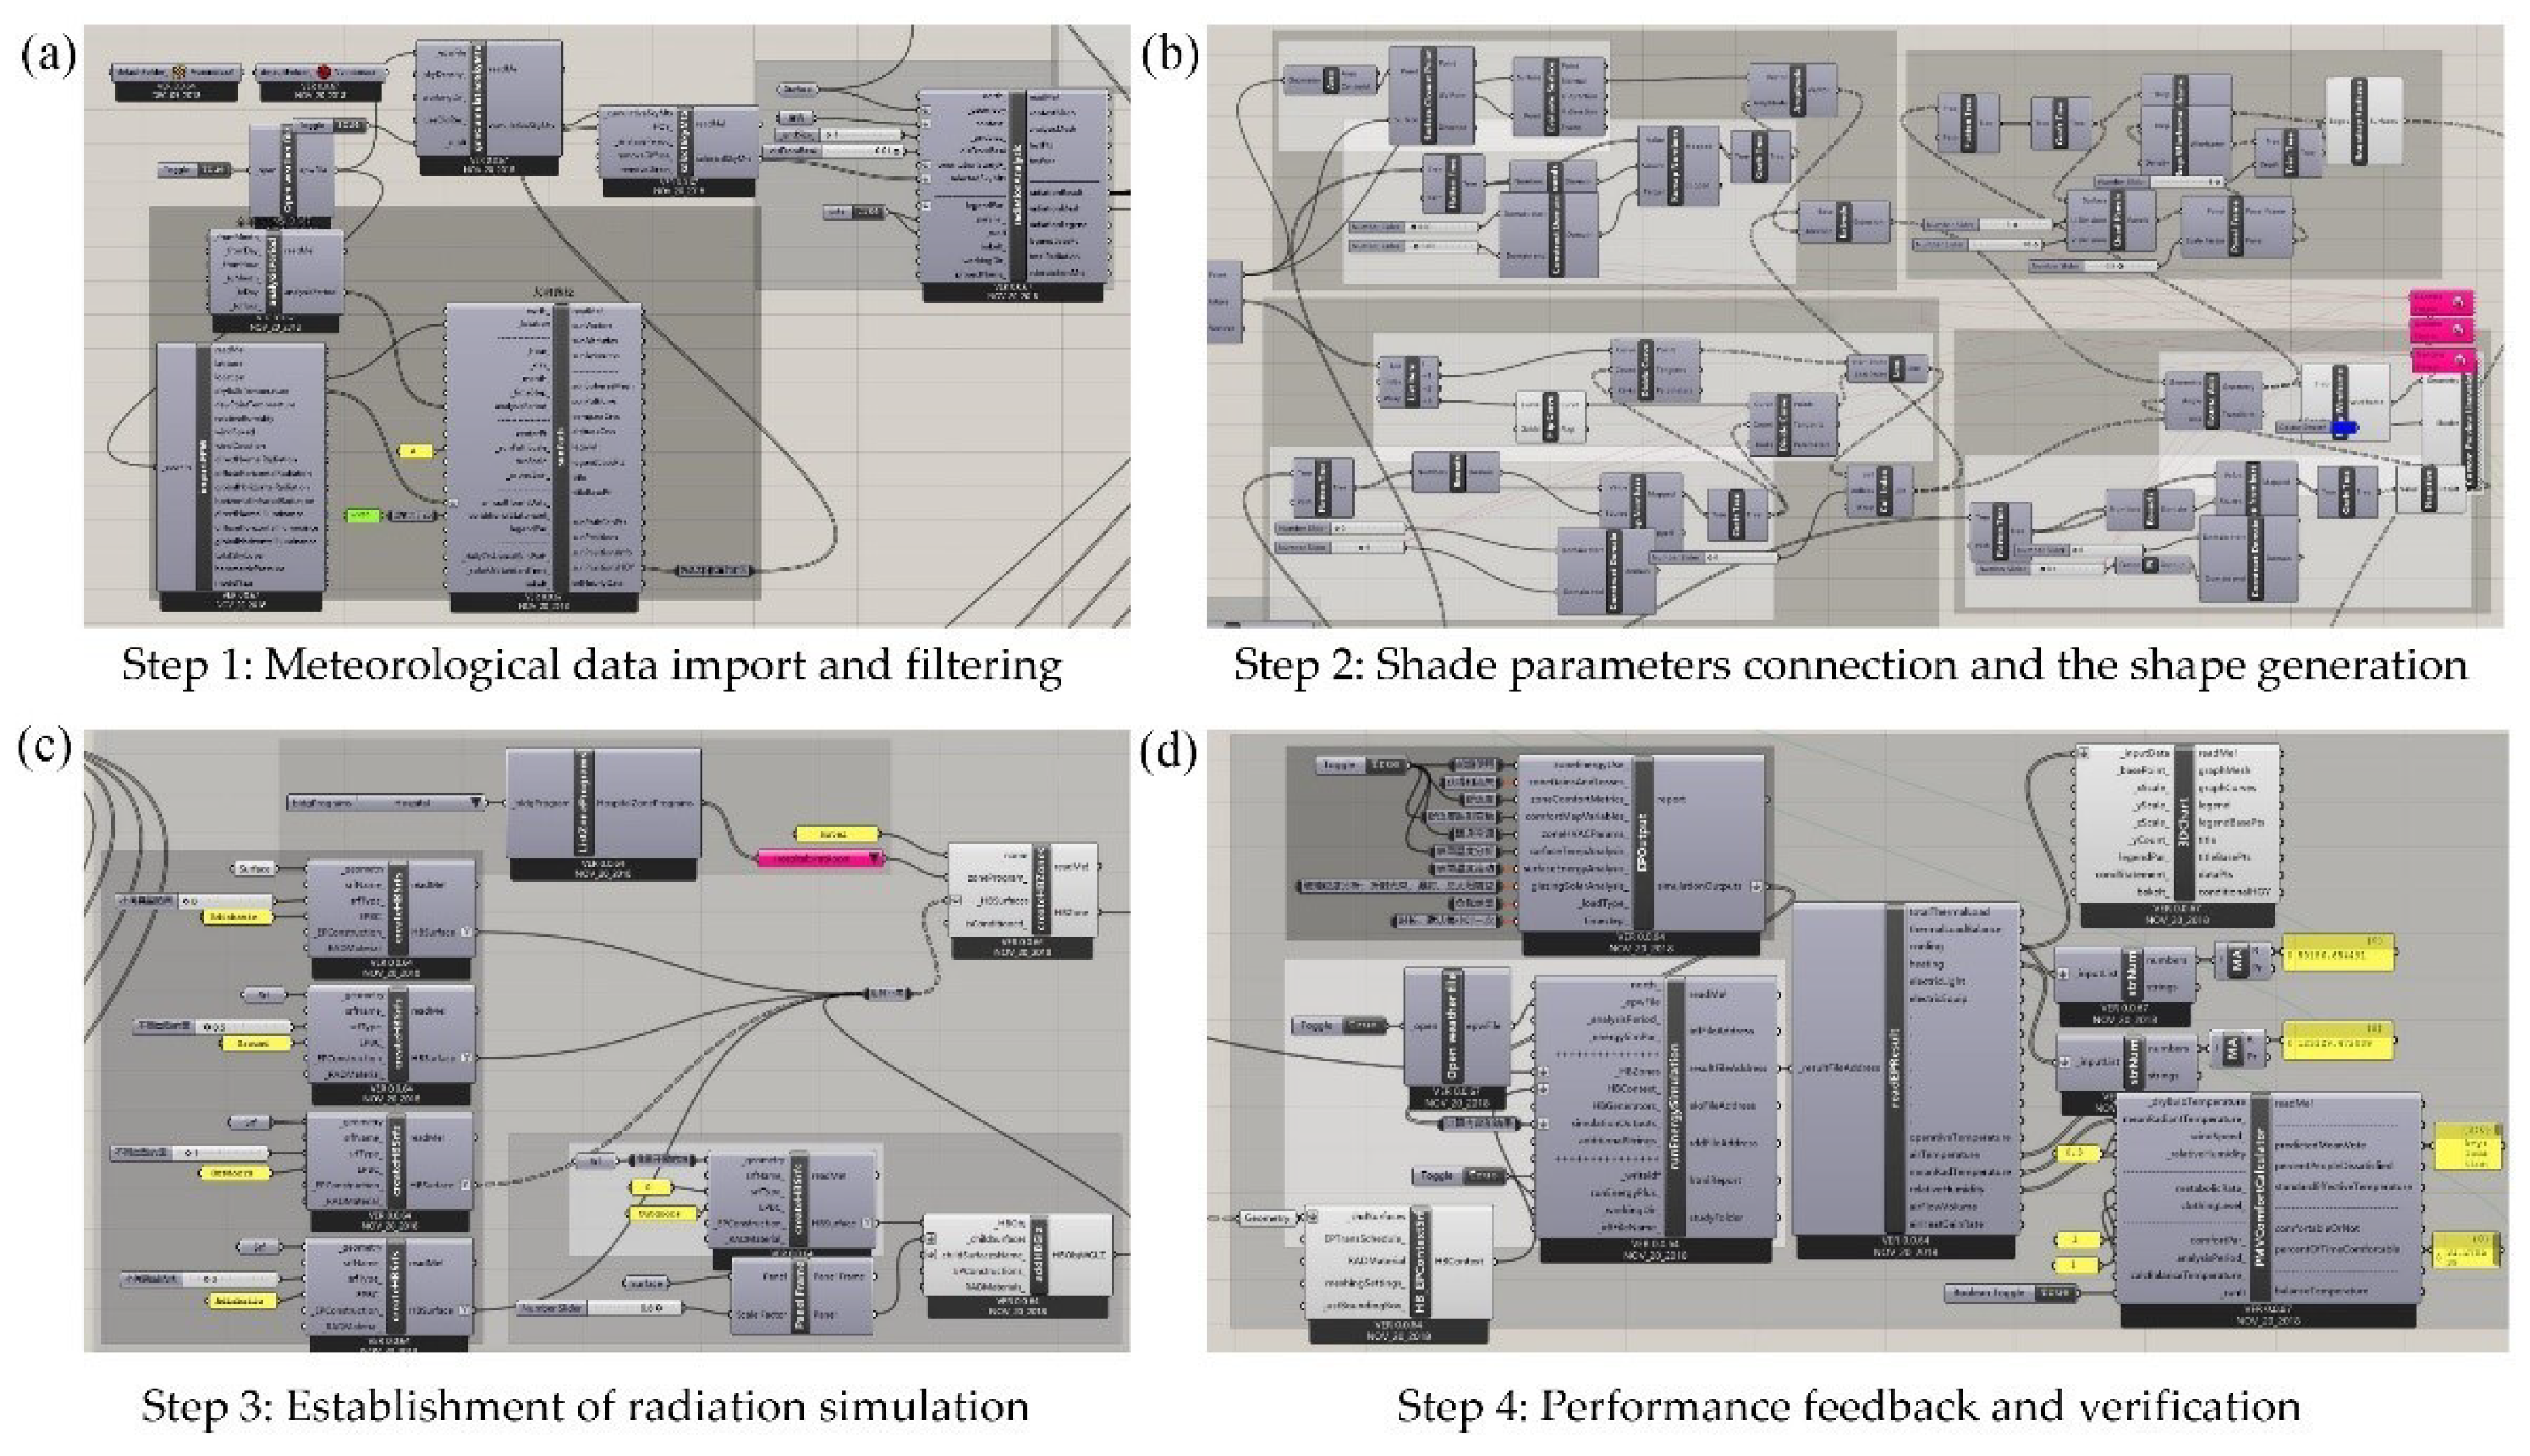
2.1. The Experimental Tools of Ladybug and Honeybee (L&H)

L&H was invented by Mostapha Sadeghipour Roudsari (Chicago, IL, USA) [27]. L&H uses the mainstream performance analysis software DAYSIM, Radiance, and EnergyPlus as a simulation engine to determine the amount of solar radiation and energy consumption and provides a user-friendly interface. L&H has been extensively validated for buildings, neighborhoods, and cities [28,29,30]. Although less extensible, and providing less freedom to set parameters, than classical numerical simulation software such as Fluent and Comsol, the greatest advantage of L&H is its ability to work in synergy with parametric design. There are some other advantages of L&H compared to other simulation software. L&H adopts a multi-objective optimization algorithm model, takes the comprehensive performance index as the evaluation method, sets the control logic to let the computer automatically complete the complex calculation and optimization process, and obtains the optimal result under specific logic in a short time. The following are some advantages of L&H compared to other methods:
(1)
Good software compatibility: The developers of L&H are architects. Thus, the software is fully based on the needs of building simulation and data generation and is efficient, simple, and comprehensive. Moreover, L&H is plug-in software for Rhinoceros that enables better synchronization of 3D building models and simulation analysis.
(2)
The input interface is logical: The L&H and Grasshopper (GH) parametric platforms are closely related and have the same scripting logic and input modes. The algorithmic software logically performs complex building performance analysis, and the ideas are organized and clear. Moreover, this software can engage in multi-input and multi-factor limited building performance analysis.
(3)
The analysis results have good visibility: L&H offers a customized display mode, with good visualization of meteorological data and building performance.
GA is a parallel search algorithm based on biological laws and natural genetic mechanisms. In 1975, Professor J. Holland first proposed “the adaptability of natural combinatorial artificial intelligence systems”, which is a multi-parameter and multi-combination optimization method, simulating “the principle of “survival of the fittest by” natural selection” observed in natural evolution [31]. The Grasshopper platform’s genetic algorithm plugin Octopus features a built-in Strength Pareto Evolutionary Algorithm (SPEA-2) and Hypervolume Estimation Algorithm (HypE) algorithms to make the best choices between different search objectives, which are widely used for multi-objective optimization in the field of building performance [32].
The present study’s parametric shading design method, L&H, was selected as simulation software, and Octopus was used as the optimization software. By accessing Octopus, our chosen parametric shading design method, L&H, was selected as the simulation software, and Octopus was used as the optimization software. By accessing Octopus, the optimization process has the following characteristics: (1) the process is good at using algorithms to express architectural geometry and can generate specific shapes by changing parameters under specific conditions [33]; (2) the process has strong internal logic of automatic optimization in the generation processes of parametric buildings, as well as a strong ability to find the optimal global solution; (3) this process has a high degree of integration and automation, strong operability, and the ability to meet various performance requirements in the design of adaptive passive buildings.

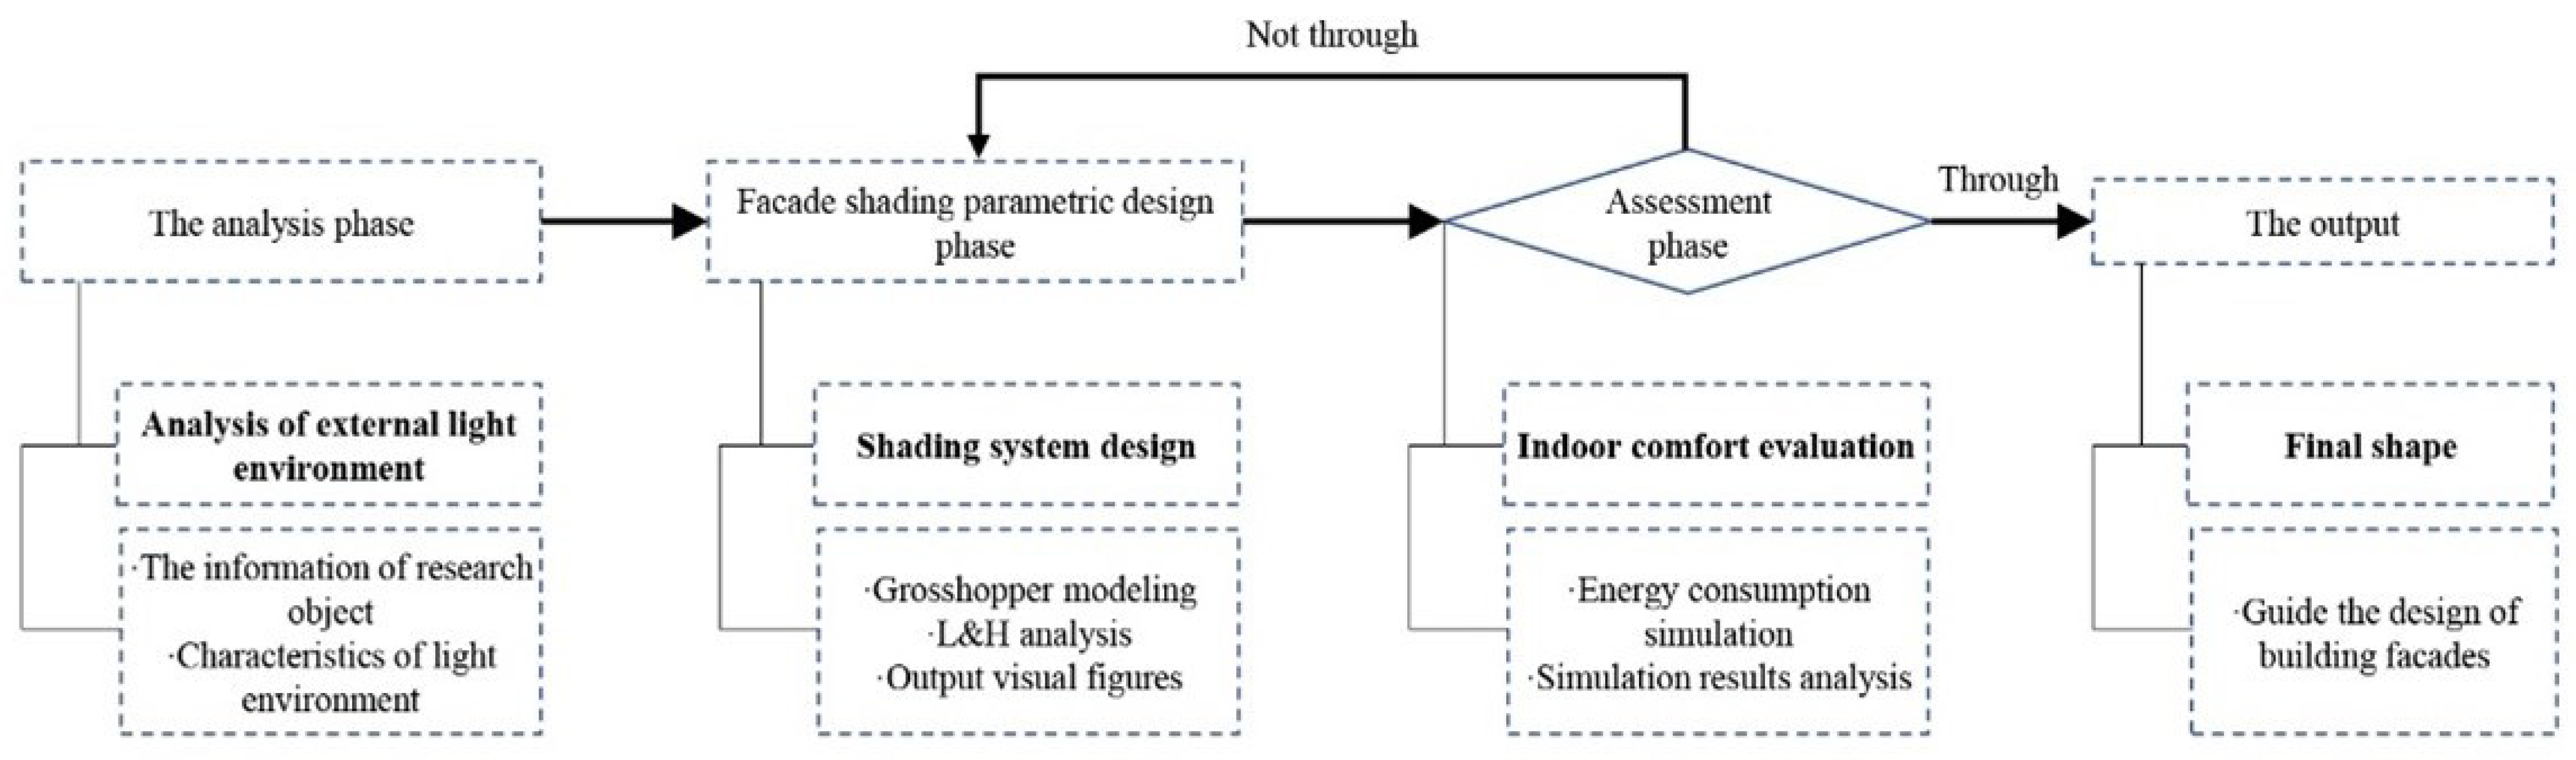
2.2. The Experimental Method

In this paper, the local climate and surrounding environment were analyzed using L&H. Based on the analysis results, appropriate indoor performance targets were selected, and parametric shading systems were designed according to the sunshine requirements of different orientations. Octopus was used to optimize the facade forms of different orientations to obtain an indoor environment with good thermal comfort and reduce building energy consumption. To ensure the integrity of this research route, we combined parameterized design with thermal comfort evaluation as the research concept. The research flow chart is shown in Figure 2. In the first step, we analyzed the current light environment of the target building; in the second step, we designed a parametric shading system and used L&H to evaluate the indoor visual comfort and energy consumption of the shading solution; in the third step, we used Octopus to optimize the parametric shading system. If the performance requirements were met, the solution was output. If not, the Octopus controlled the parametric shading solution for regeneration; in step four, the final design was obtained. Through this dynamic simulation process, the optimization of the building facade shading method was ultimately achieved and able to meet the design requirements of indoor thermal comfort.

3. Research Object Climate Simulation Analysis

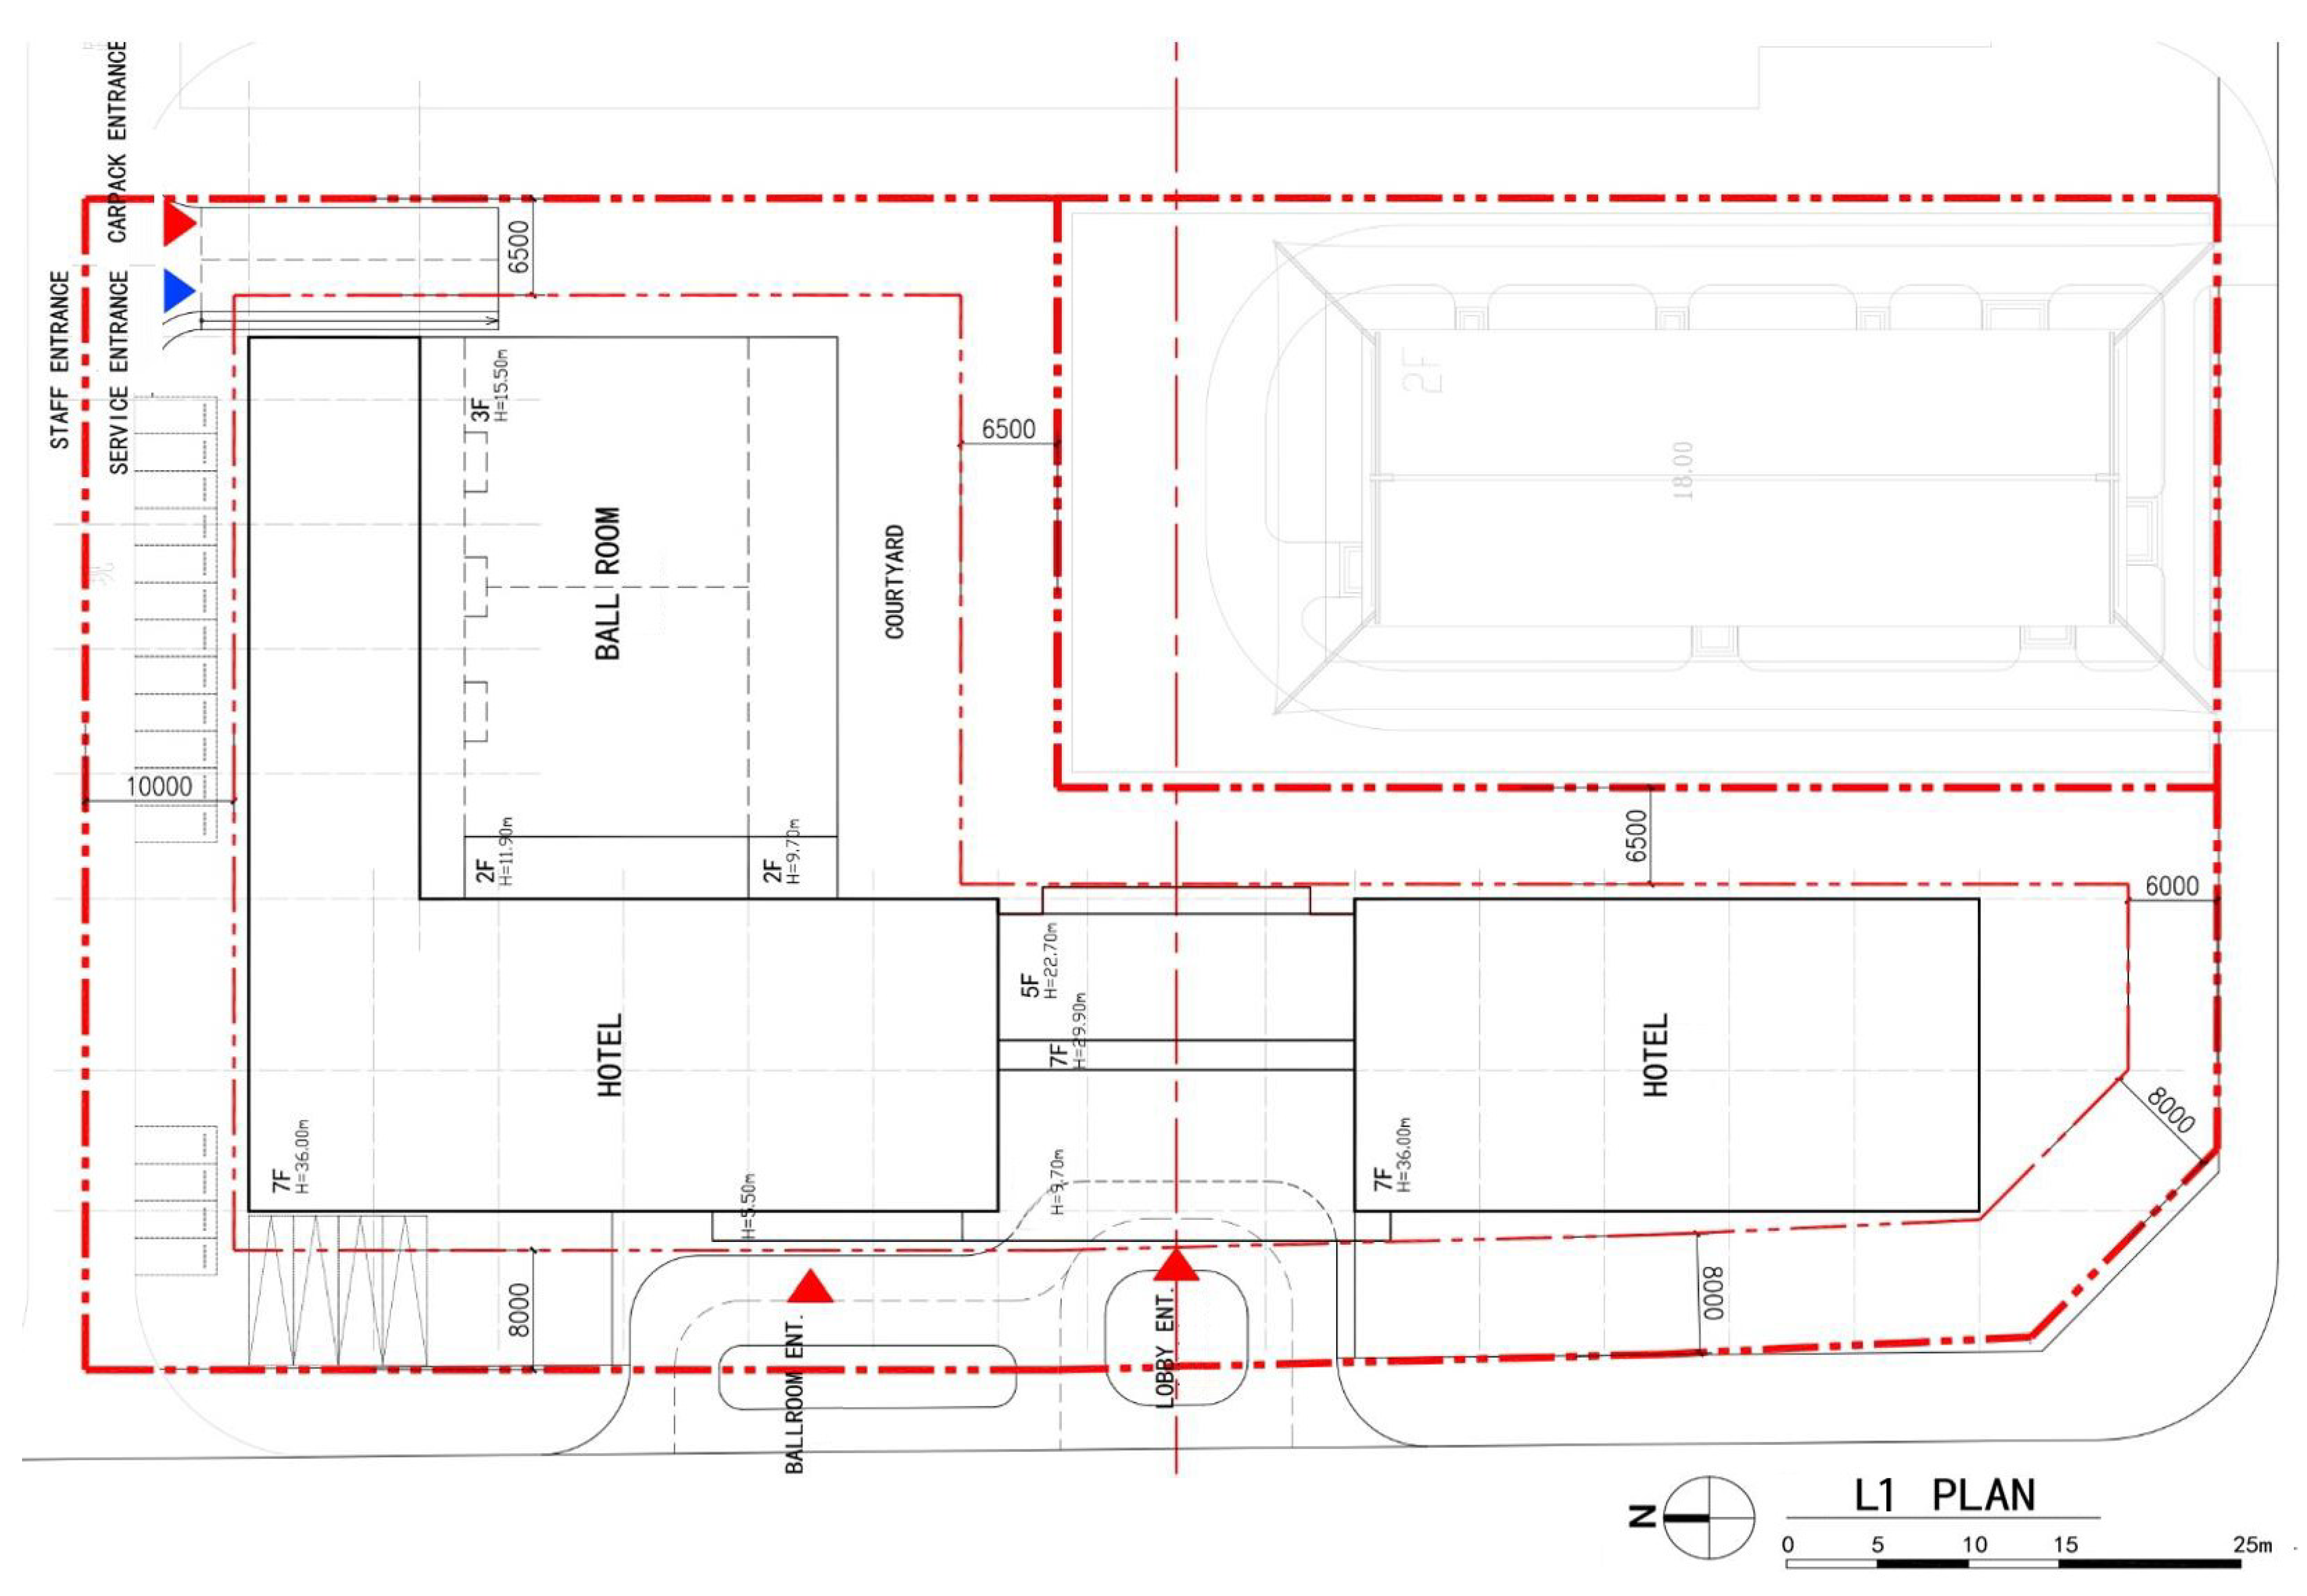
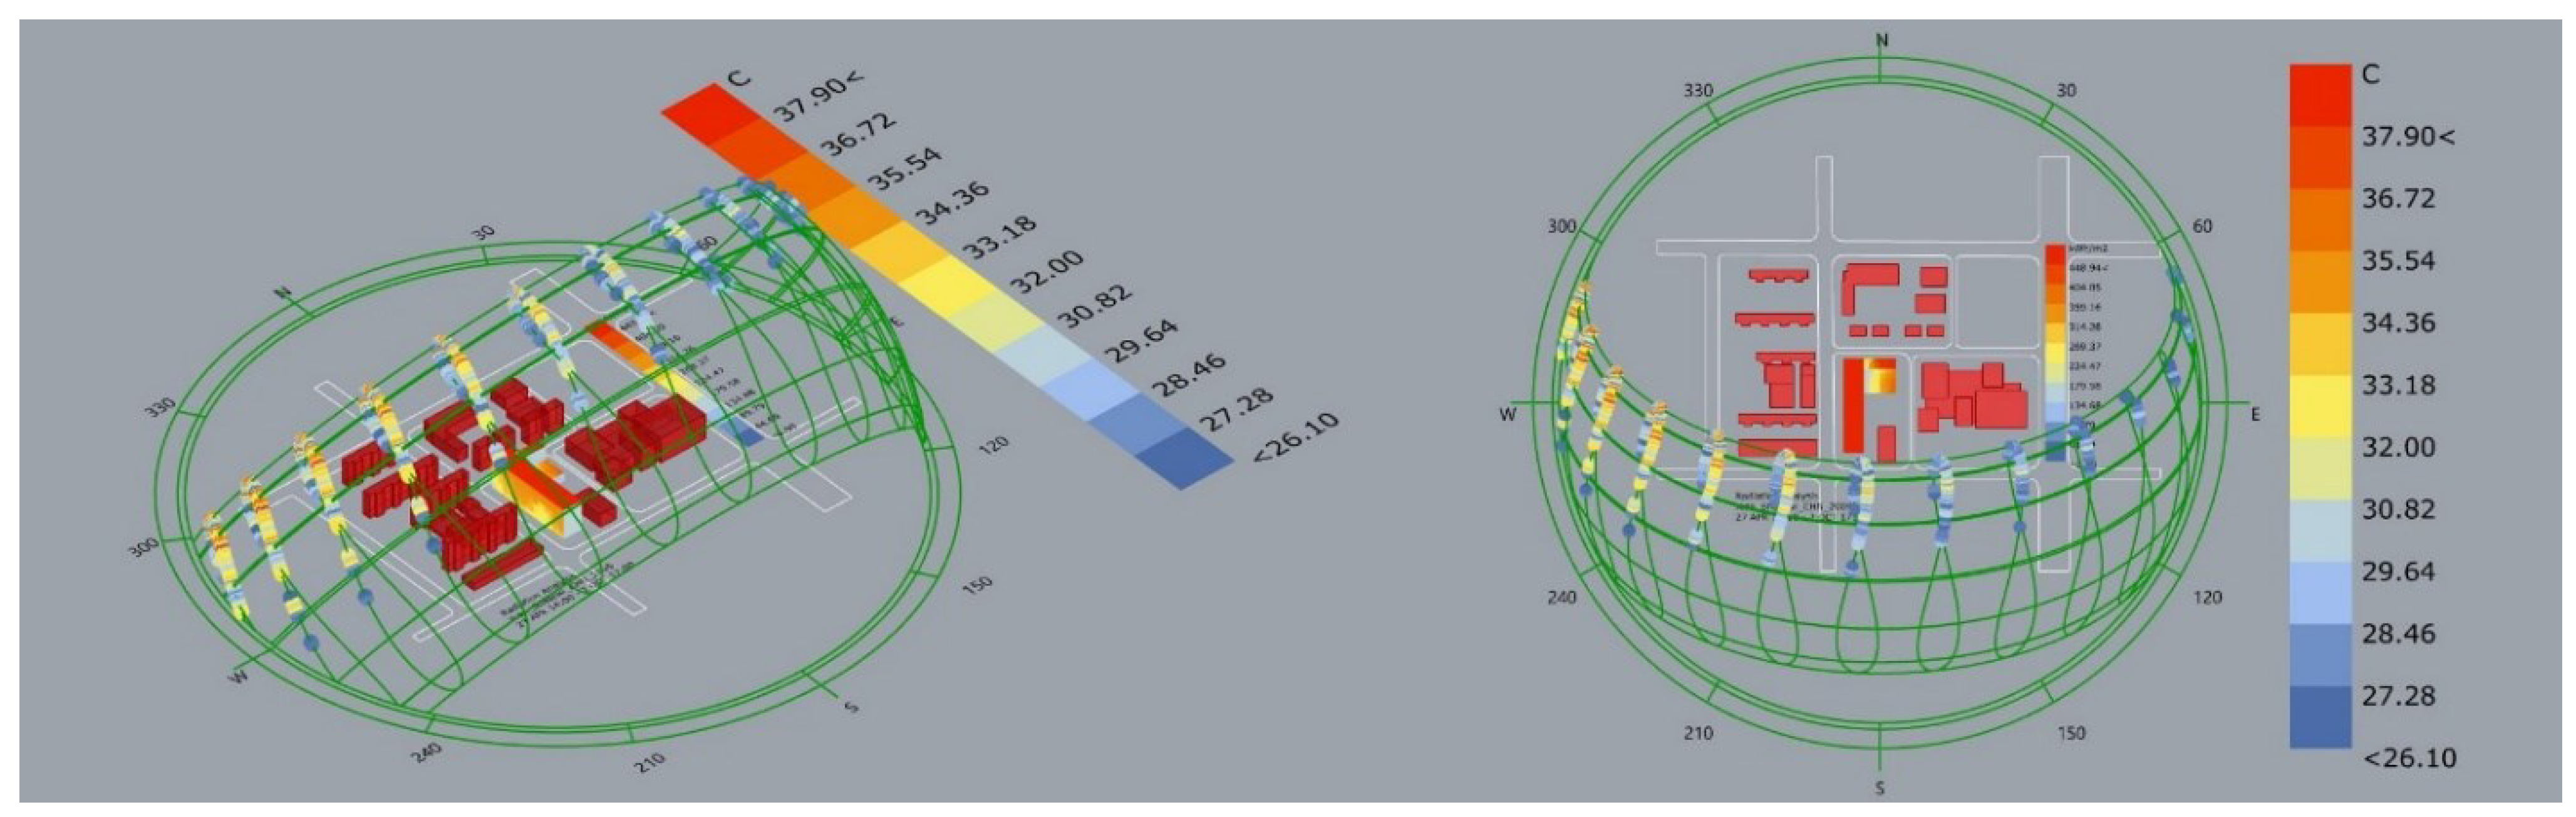
3.1. The Information on the Research Object

The research object of this paper is a tourist hotel in Xi’an (cold region), China, which is currently under construction. The latitude and longitude coordinates of the target building are 112°42′48.06″ and 25°26′59.78″, respectively. Basic information on the hotel is provided in Table 1. Restricted by the terrain, the building is L-shaped in plan (Figure 3), the main facade is oriented east–west, and the guest rooms are mainly arranged on the east and west sides (Figure 4). The construction party requires the facade of the building to be covered with a glass curtain wall (the material is sunshade-type low-radiation insulating glass: 6 mm + 12A + 6 mm, and the comprehensive sunshade coefficient is 0.4). Due to the peak tourist season and the custom of visitors staying in the building, as well as the Design Standard for Energy Efficiency of Public Buildings (GB50189-2015), the hourly occupancy rate (%) of room personnel in hotel buildings is 50% from 08:00 to 18:00. The hourly occupancy rate (%) of room personnel in hotel buildings is 50% from 08:00 to 18:00. Based on observations of the hotel, the actual occupancy rate is far less than 50%. Therefore, we can assume that the internal personnel density is low during the day. Moreover, air conditioning is disabled during the day, and solar radiation will lead to a rapid rise in indoor temperature. Thus, a large area of glass will lead to an obvious indoor greenhouse effect, increasing the load of the refrigeration system. When tourists return to the hotel at night, the personnel density increases dramatically. The indoor comfort is very poor as the room temperature drops slowly at night. A similar problem exists in winter. Therefore, to obtain the target indoor performance requirements, we convert meteorological data into architectural design language through parametric design in passive performance-based design and design a targeted shading system while considering facade aesthetics [34].

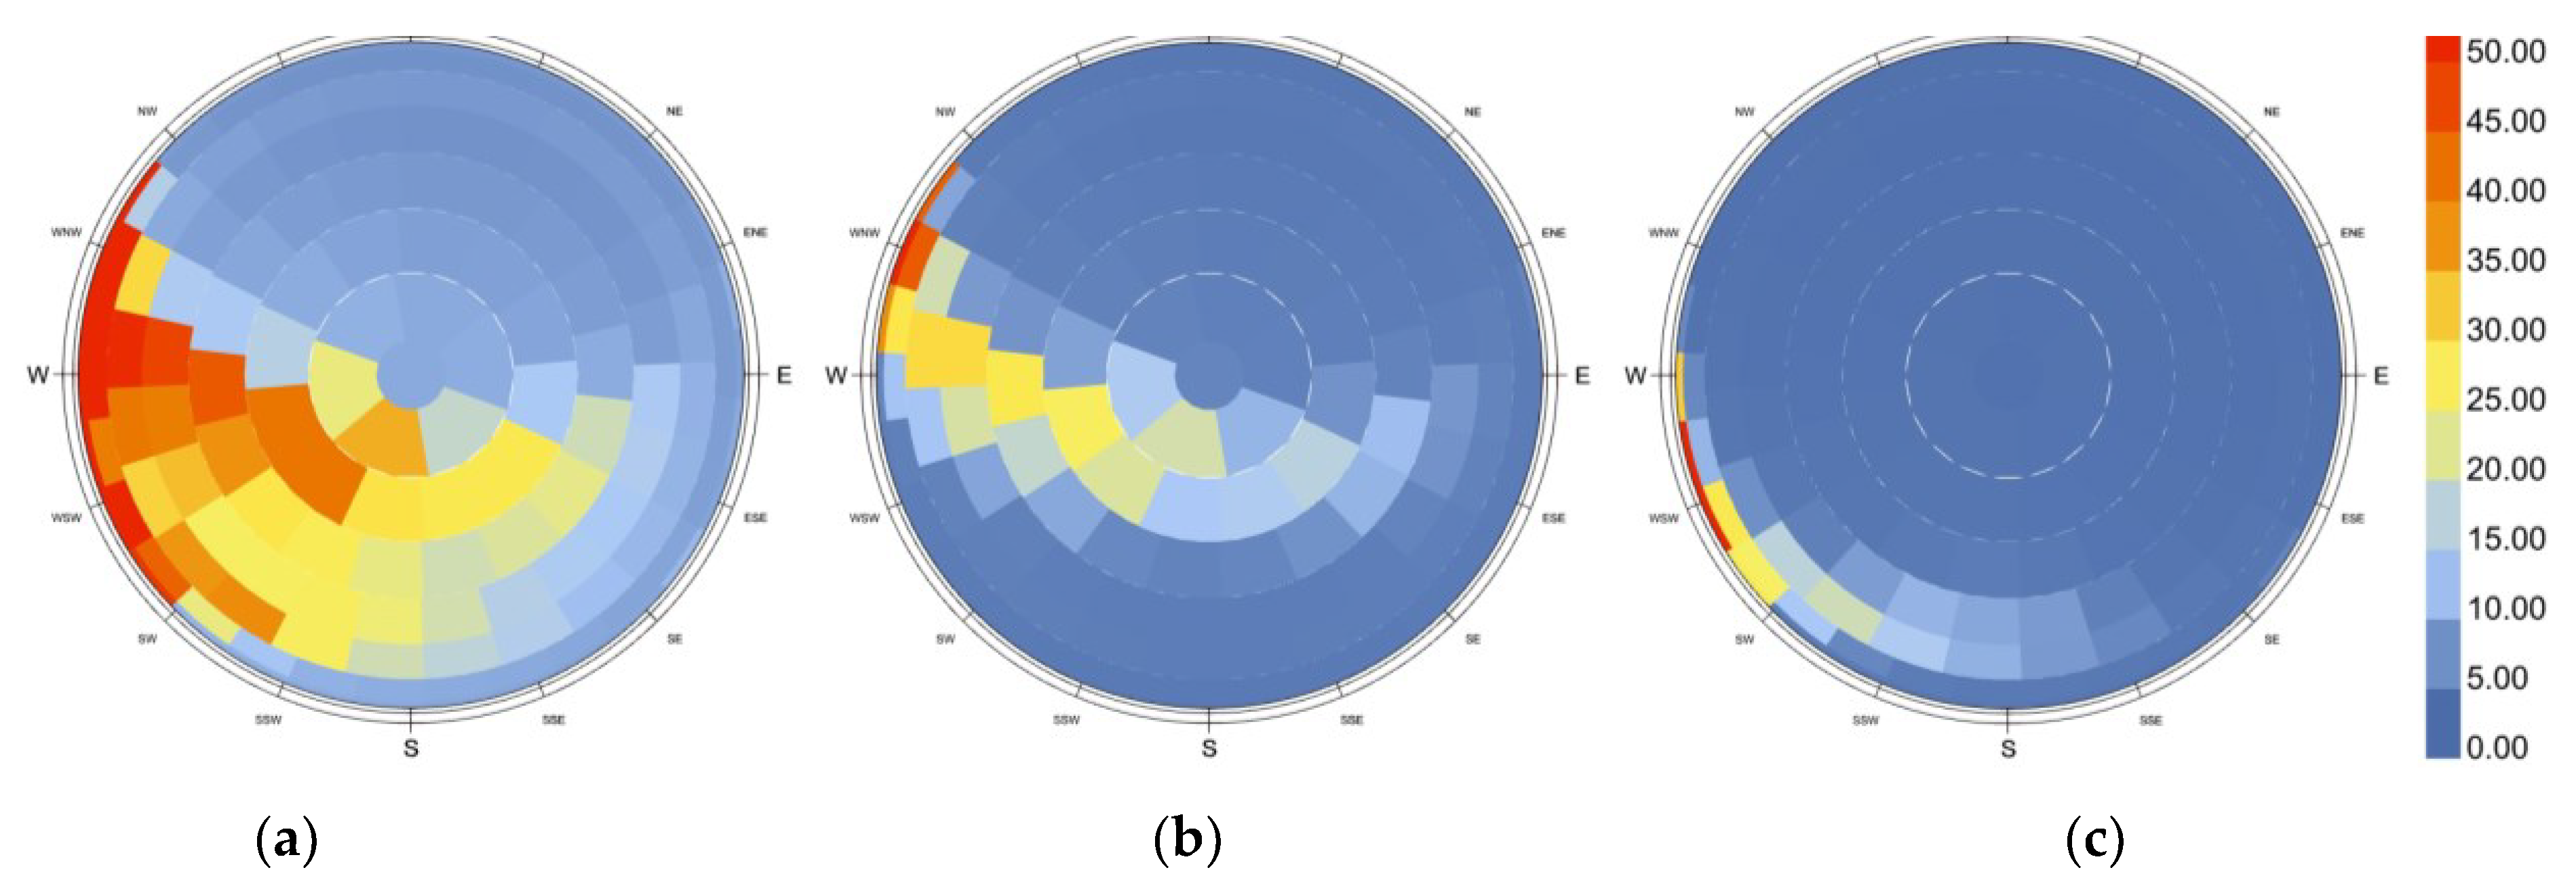
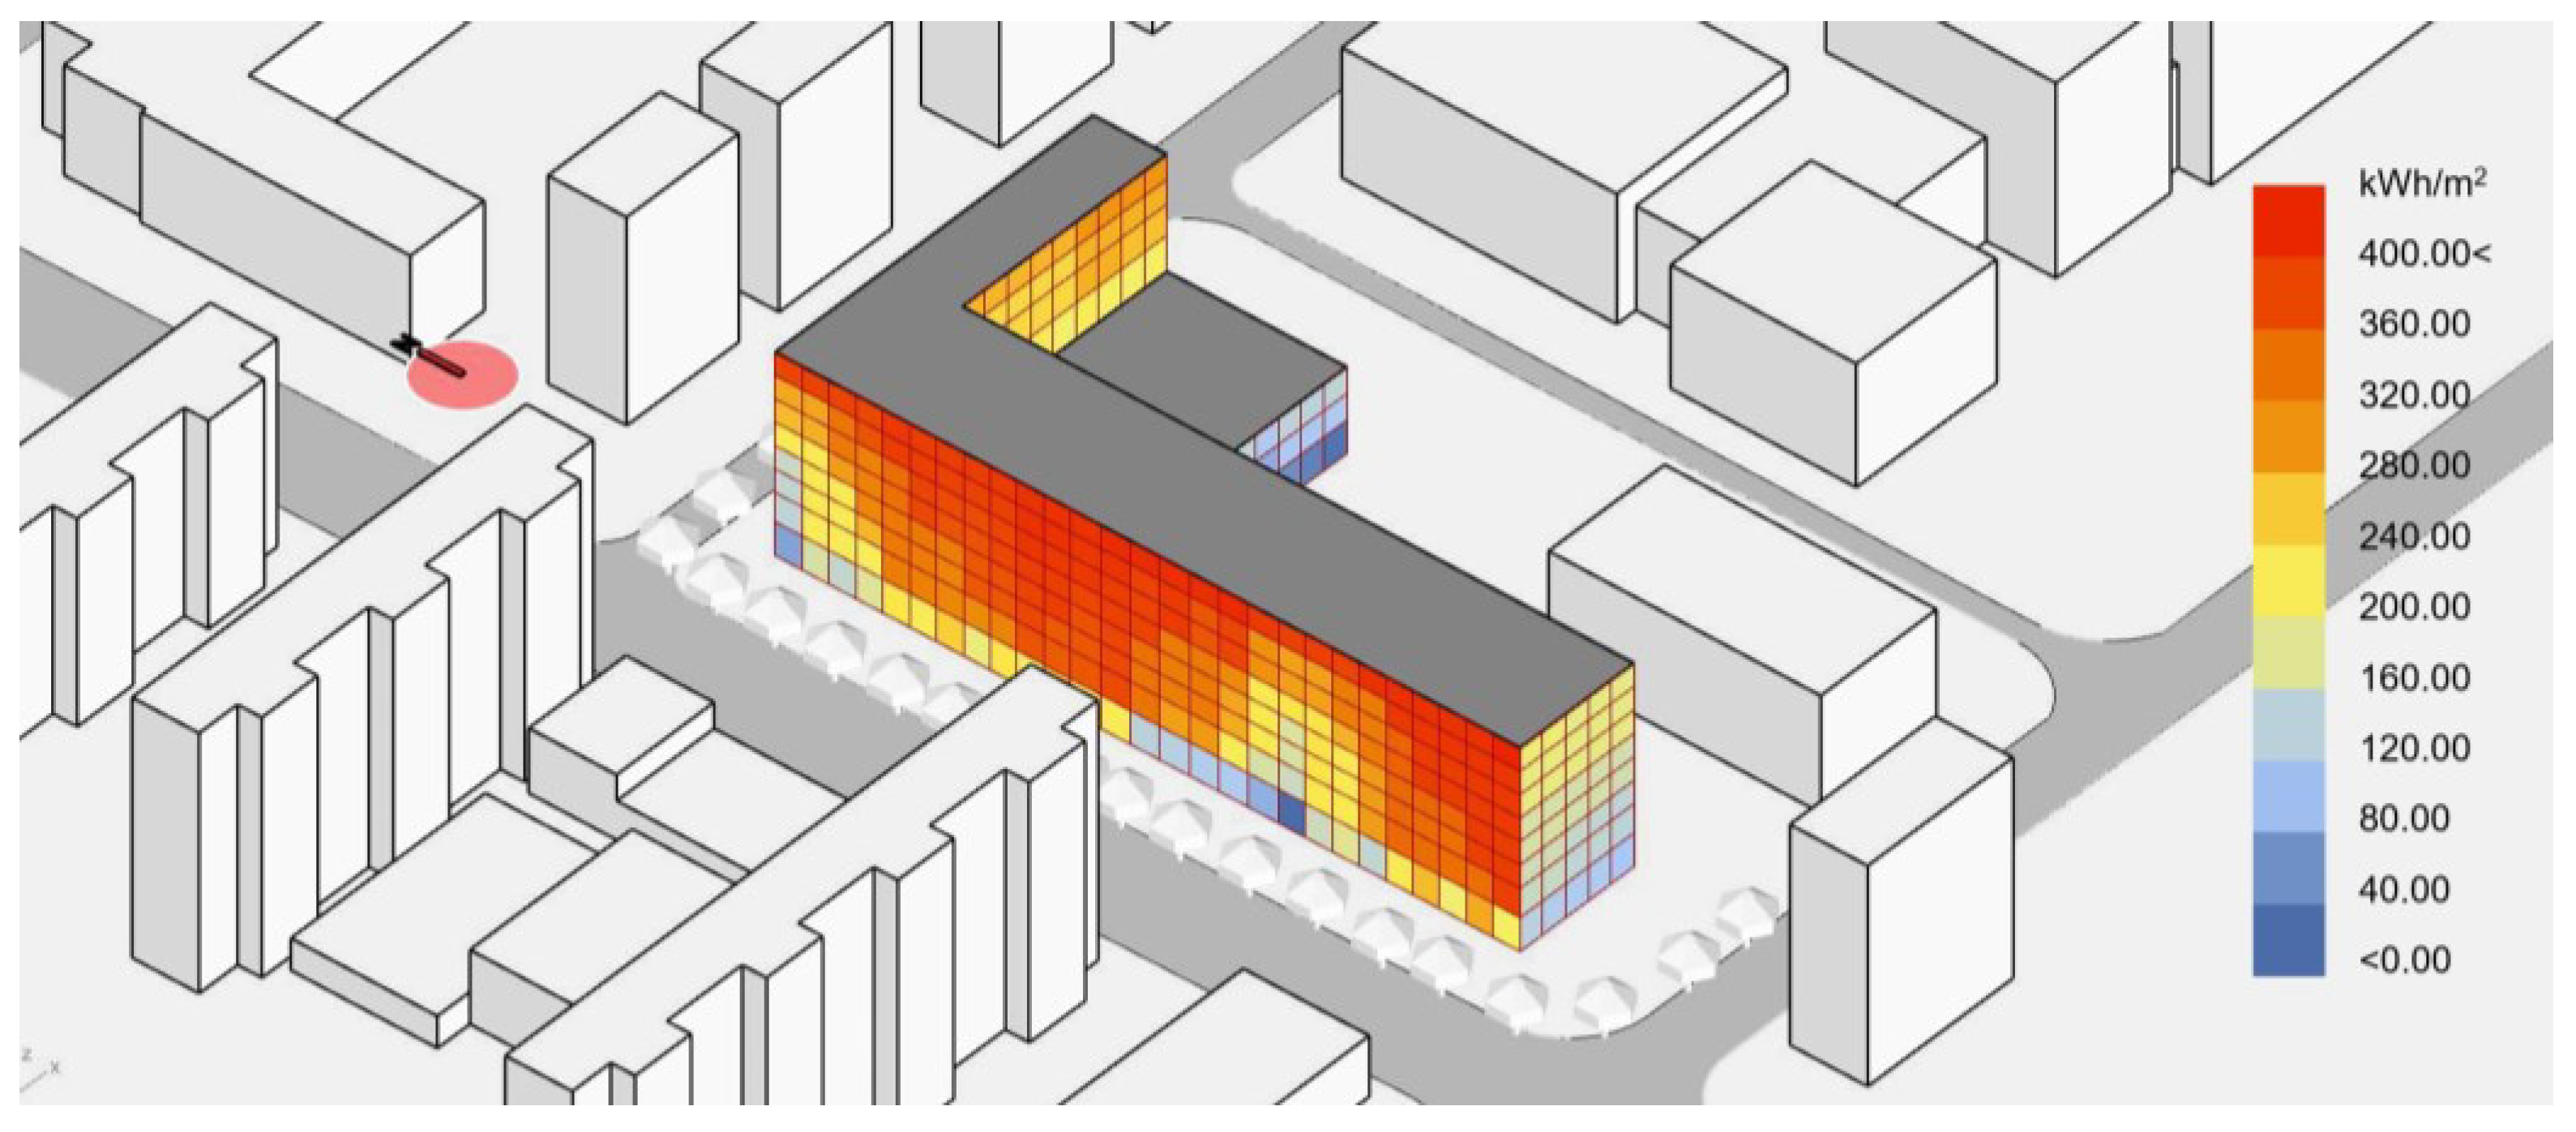
3.2. Light Environment Characteristics Analysis

The meteorological data for the solar radiation and energy consumption simulations are derived from the epw file [35] for Xi’an, which provides Typical annual meteorological data from the local weather station number 570,360 statistics. The epw file is the EnergyPlus weather format developed by the U.S. Department of Energy (DOE) and includes dry bulb temperature, wet bulb temperature, relative humidity, wind speed, wind direction, direct normal radiation, diffuse horizontal radiation, etc. L&H analyzed the solar radiation distribution of the sky dome of Xi’an city to obtain the light environment characteristics of the site. The solar radiation intensity distribution was calculated for the whole year, as well as summer (June–August) and winter (December–January). A colored mesh representing the intensity of radiation for each of the sky patches within the sky dome is shown. In the area of the project, Xi’an city was measured by L&H for the whole year (Figure 5a). Analysis of the sky radiation status model on the hottest days (01–07) (Figure 5b) and coldest days (01–12) (Figure 5c) showed the following: The intensive sky radiation for the whole year was concentrated in the range of 240°–270°, the intensive sky radiation in summer was concentrated in the range of 250°–270°, and the intensive solar radiation in winter was concentrated in the range of 210°–230°. According to Thermal Comfort Requirements and Evaluation for indoor Environment (GB/T 33658-2017), the indoor target temperature is set at 26 °C in summer and 18 °C in winter.
To further locate the solar position accurately under high temperature and radiation, a visual analysis was conducted on the solar path and position during the annual high temperature weather (>26 °C) in Xi’an (Figure 6). The green line in the diagram indicates the solar track, which is the year-round distribution of solar altitude angle and azimuth angle determined by the latitude and longitude of the site. The colored dots indicate the sun’s position when the temperature exceeded 26 degrees Celsius, and the corresponding RGB color represents the temperature at that moment. The results showed that the annual high temperature weather was concentrated from June to September, while the solar track throughout the day showed that high temperatures (>30 °C) mostly occurred after noon. Simulations to determine the amount of solar radiation were carried out using L&H on the facade of the target building, considering the influence of the surrounding environment on the building. The simulation periods were then set as summer and winter. The grid size was set to 1 m to balance calculation accuracy and cost. Figure 7a,b present solar radiation distribution maps obtained by building facades on high-temperature (>26 °C) and low-temperature days (<18 °C), respectively. The results show that shading should be considered above three floors and on the roofs of buildings in summer to reduce the amount of solar radiation acquisition. Solar radiation acquisition should be increased on the first floor and some areas of the second and third floors during winter. The building also showed that the influence of the surrounding environment generates uneven solar radiation.
Solar radiation directly affects the design of the shading system in the following three ways: (1) solar radiation passes through windows and changes the indoor temperature. Especially in the hot summer, the indoor temperature increases, and indoor thermal comfort decreases. (2) The facades in different directions are exposed to different solar radiation. The most intense summer radiation comes from the west, and the most intense winter radiation comes from the south. The radiation exchanged with the surrounding environment in the same direction is also uneven, so the shading requirements are also uneven. (3) The amount of solar radiation entering the indoor space differs between winter and summer. In winter, more solar radiation is required to maintain indoor temperatures, while in summer, less solar radiation is required to reduce the possibility of overheating. In shading design, the winter radiation entering the indoor space should be increased as much as possible to increase thermal comfort. In summer, shading designs should prevent as much solar radiation as possible from entering the room. However, Figure 7 shows that the radiation intensity is unevenly distributed on the west side due to the surrounding buildings. Therefore, adaptive shader components should be designed based on the radiation distribution in shader design. Areas with high radiation intensity need higher shading density, while areas with low radiation intensity need lower shading density.

4. Parametric Optimization Design Process for an External Shading System

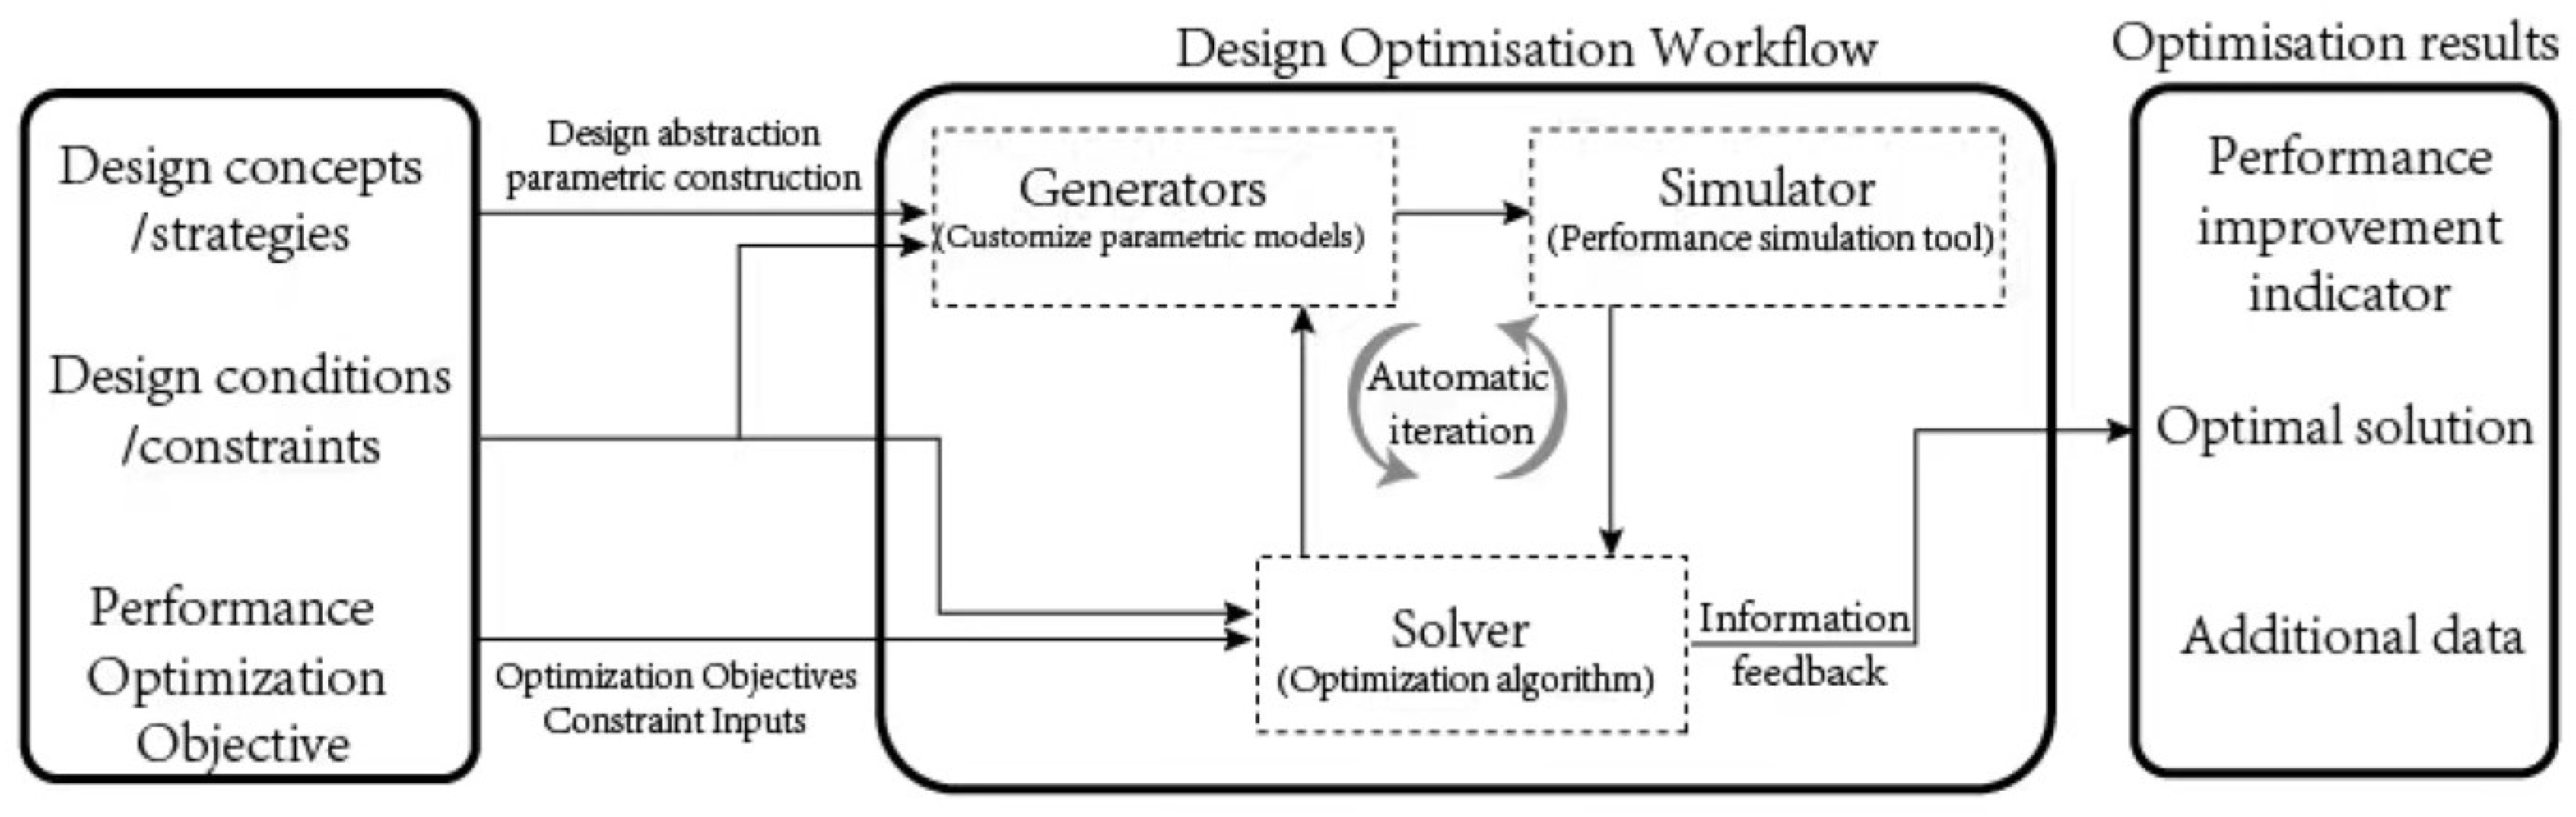
4.1. Identify Performance-Based Design Process

Performance optimization based on an optimization algorithm and parametric model requires multiple “translations” of different information between the architect and computer. The basic workflow when using this technique is shown in Figure 8 and includes the following:
(1)
Designers conduct abstract and parametric modelling according to the design objectives and design concepts;
(2)
Based on the design conditions, optimization objectives, and design concepts,” a “design optimization operation process” that can be automatically executed by the computer, including performance evaluation and design optimization, is constructed;
(3)
Finally, after the computer completes the design optimization process with a certain number of iterations, the results are analyzed to extract the required design information [24].

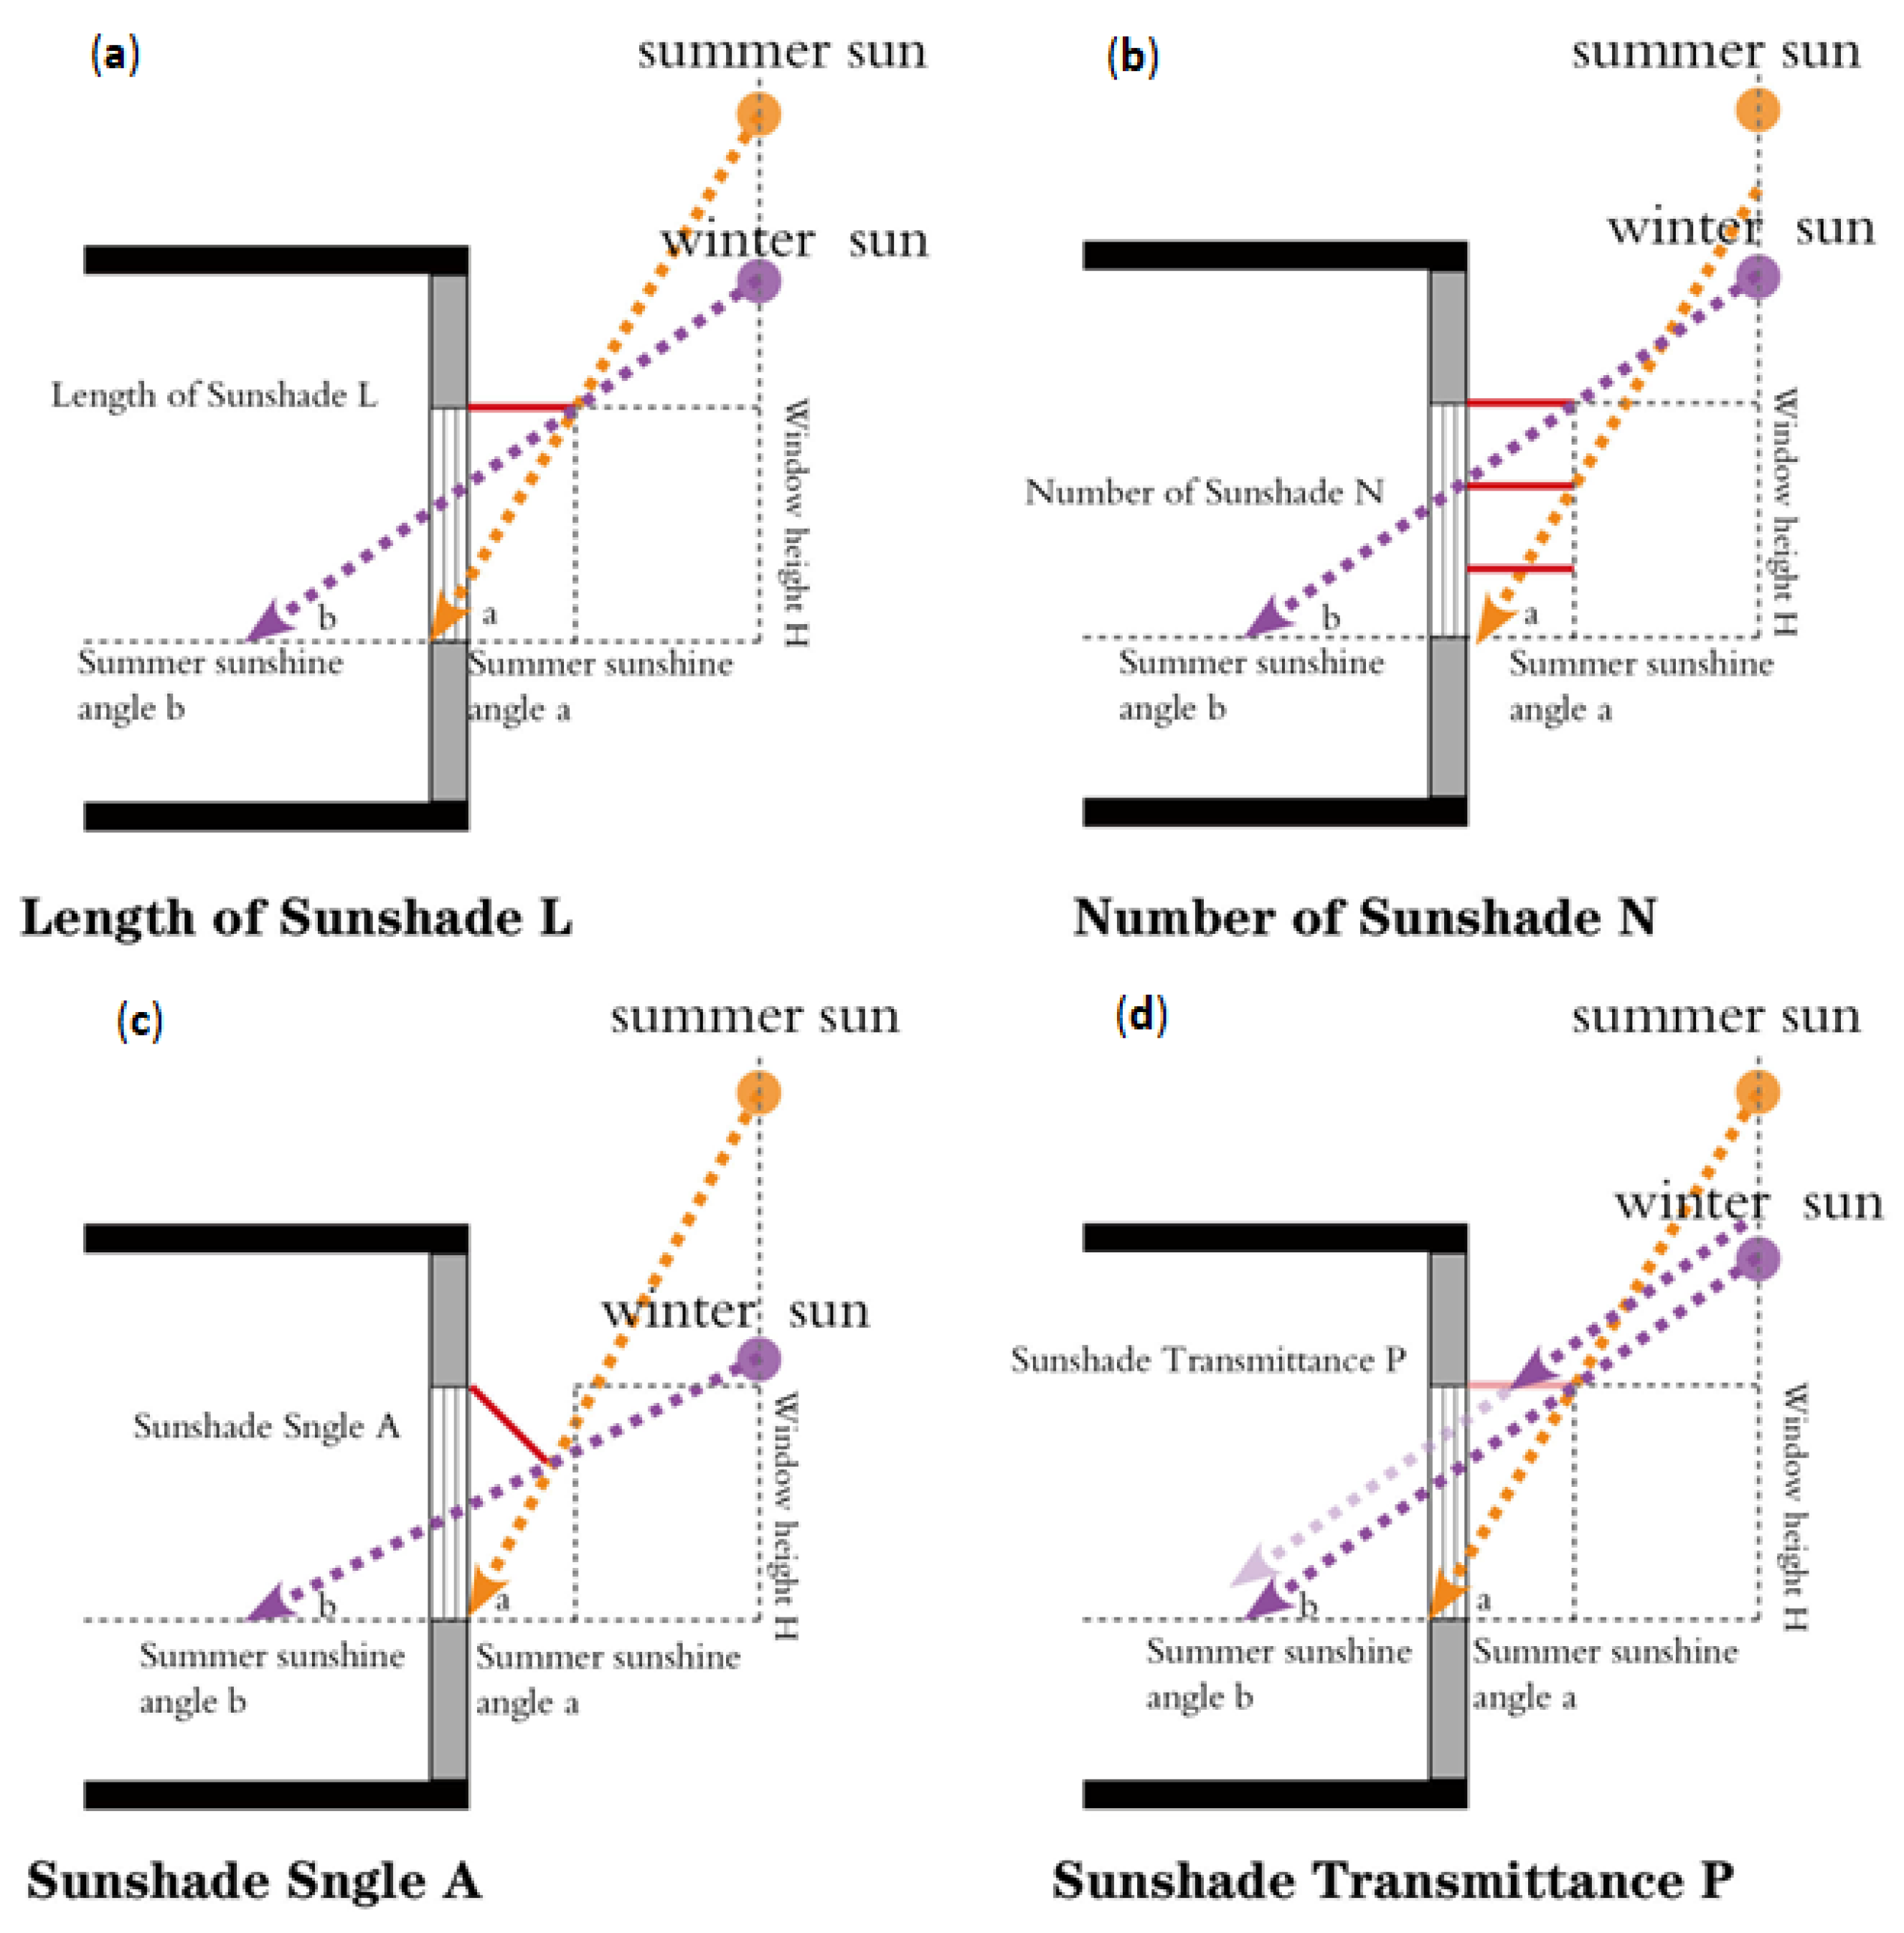
4.2. Relationship between Shading Components and Sunlight

Indoor performance indicators include physical environment indicators (such as noise, lighting, temperature, and humidity) and subjective feeling indicators (visibility, glare, etc.). Different types of buildings have different performance requirements. Relevant studies show that the optimization of the shading model, with the minimization of total energy consumption (TEC) and the maximization of effective sunshine brightness (UDI) as the main objective function, can save up to 14% energy and reduce the cooling load by 35%. Therefore, the design of the shading system remains a process of contradiction and compromise. Shading intensity is controlled by four parameters (Figure 9), and the principle of the shading system is shown in Figure 9. The orange line indicates the outdoor sunlight in summer, the purple line indicates the outdoor sunlight in winter, and the red line represents the shading elements installed in the building windows (1. length of sunshades L; 2. several sunshades N; 3. sunshade angle A; 4. transmittance of sunshades (P)). Here, the longer the length of the visor, the better the shading effect. Increasing the number of sunshades can also increase the shading effect. When the length and number of sunshades remain unchanged, the shape of the sunshade can be adjusted by changing the angle of the sunshade to impact the sunshade effect. In this study, the epw file of Xi’an city was used as meteorological data to simulate the above process using L&H. The intensity of the amount of solar radiation received by the building facade was first calculated, followed by a simulation of the shadows formed by parametrically generated shading panels on the building facade. Finally, the thermal comfort and building energy consumption inside the building were simulated. The four parameters (L, N, A, and P) of the shading version ultimately affected the shape of the shadows, the thermal comfort of the interior, and the building’s energy consumption.

4.3. Performance Metrics and Optimization Objective

For different design problems, operational design optimization techniques have different levels of applicability. A clear performance-based design goal is the premise of parametric shading design based on the L&H tool. Performance objectives from the design stage to the equipment installation stage involve a great deal of content [36], but even under the same performance objectives, due to the impact of the climate environment, there are still differences in the target settings for different areas of the building interior. Similarly, more accurate performance goals can be set to optimize the design according to the various functional requirements. Therefore, for the outdoor light environment, thermal comfort, useful daylight illumination (UDI), building energy consumption, and visual perception are the main factors to be considered for optimization from the perspective of users’ physiological and psychological needs (Table 2).

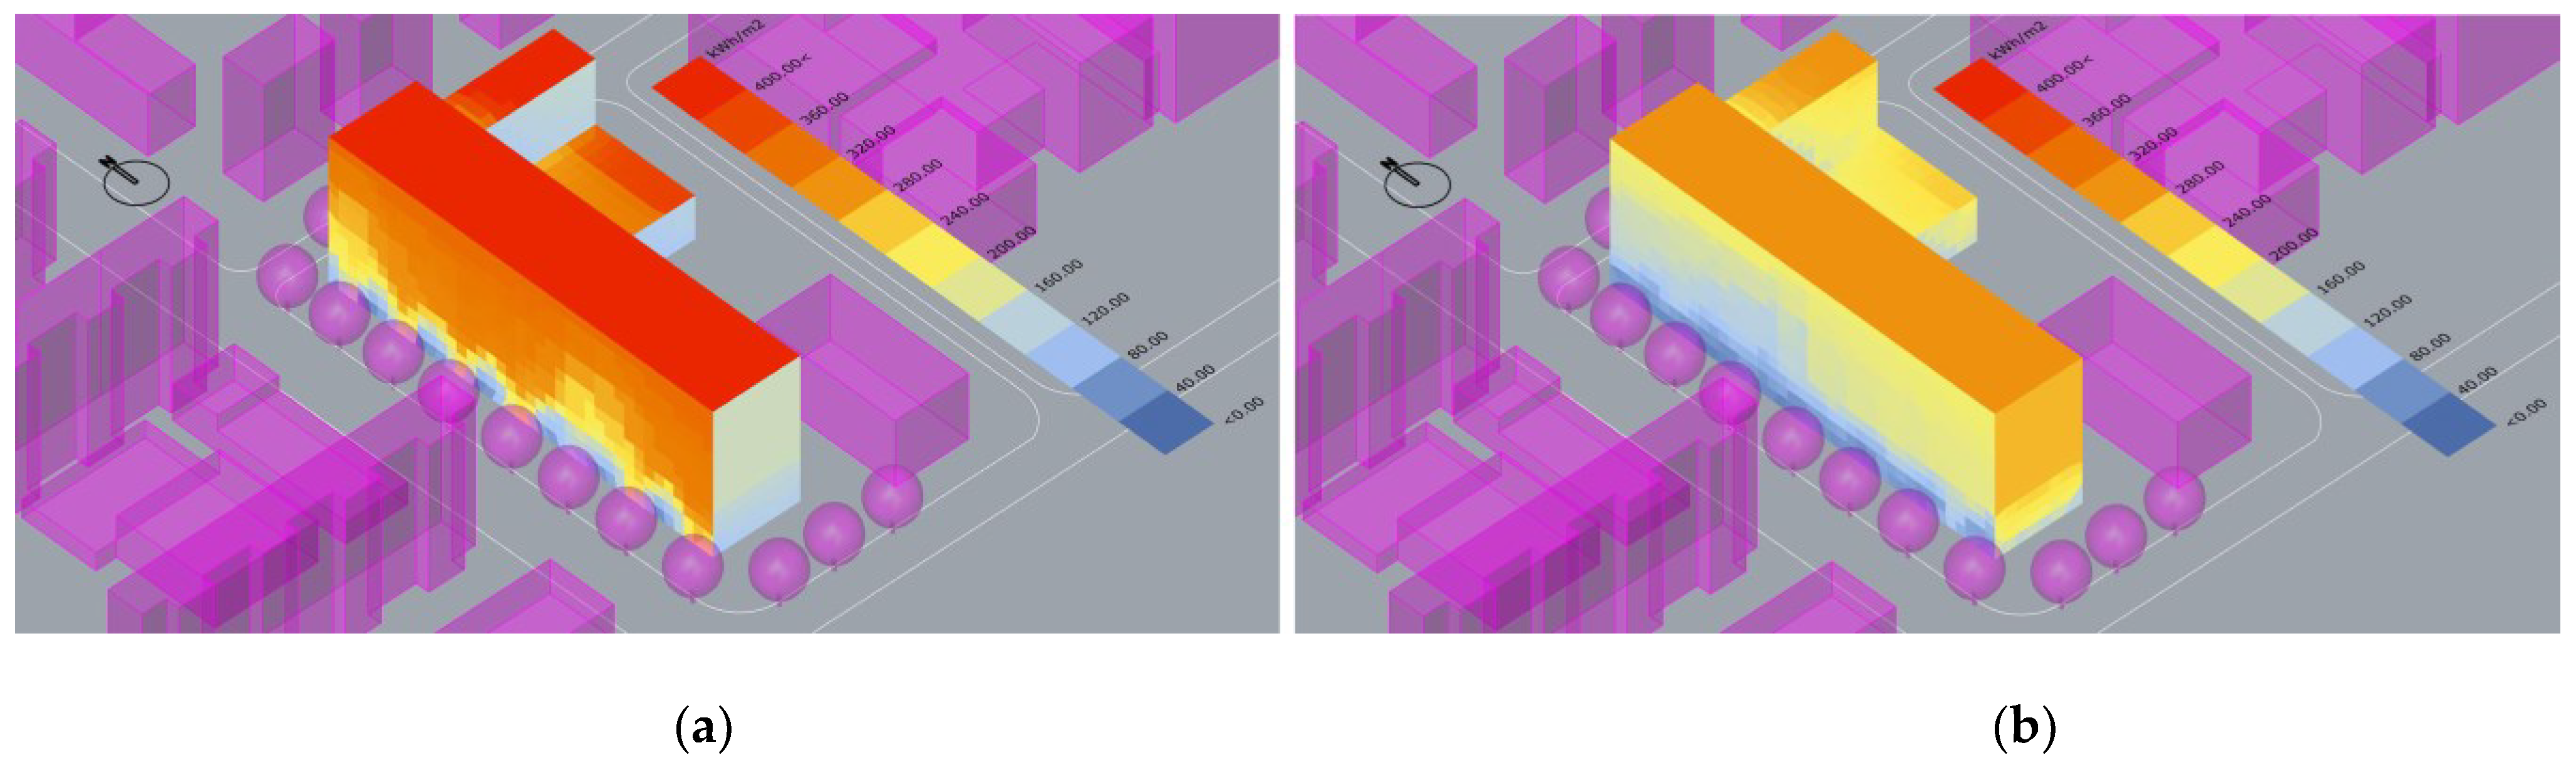
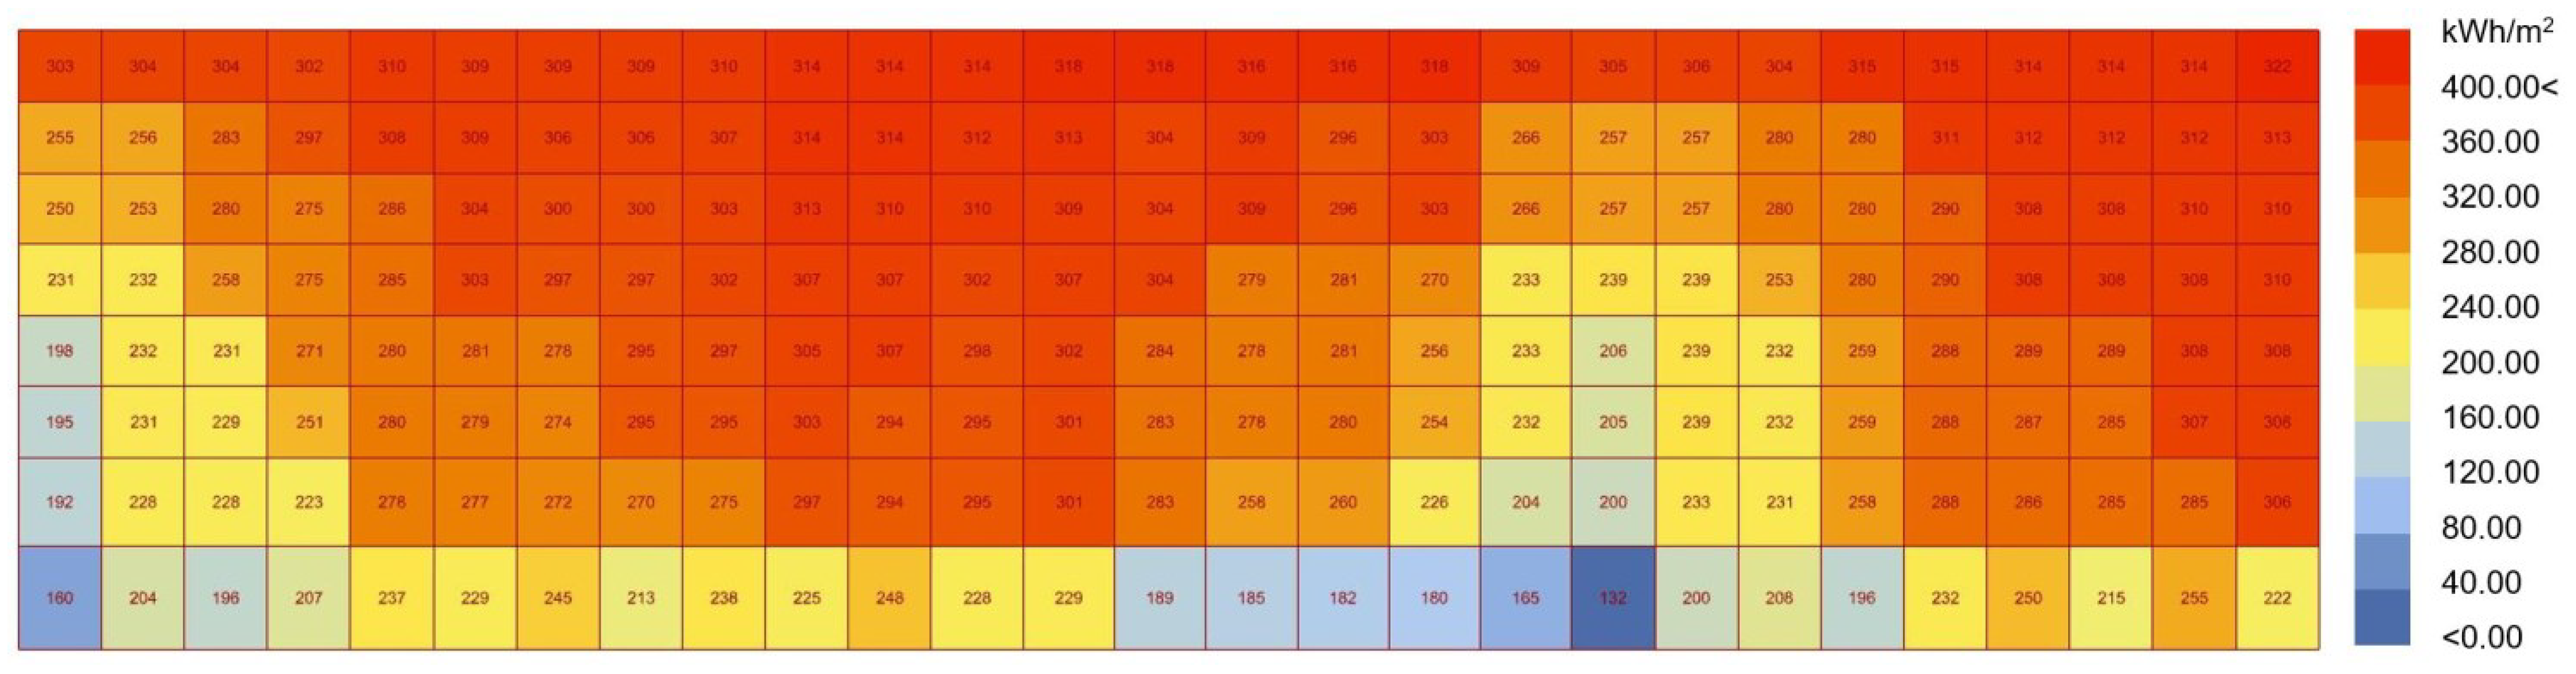
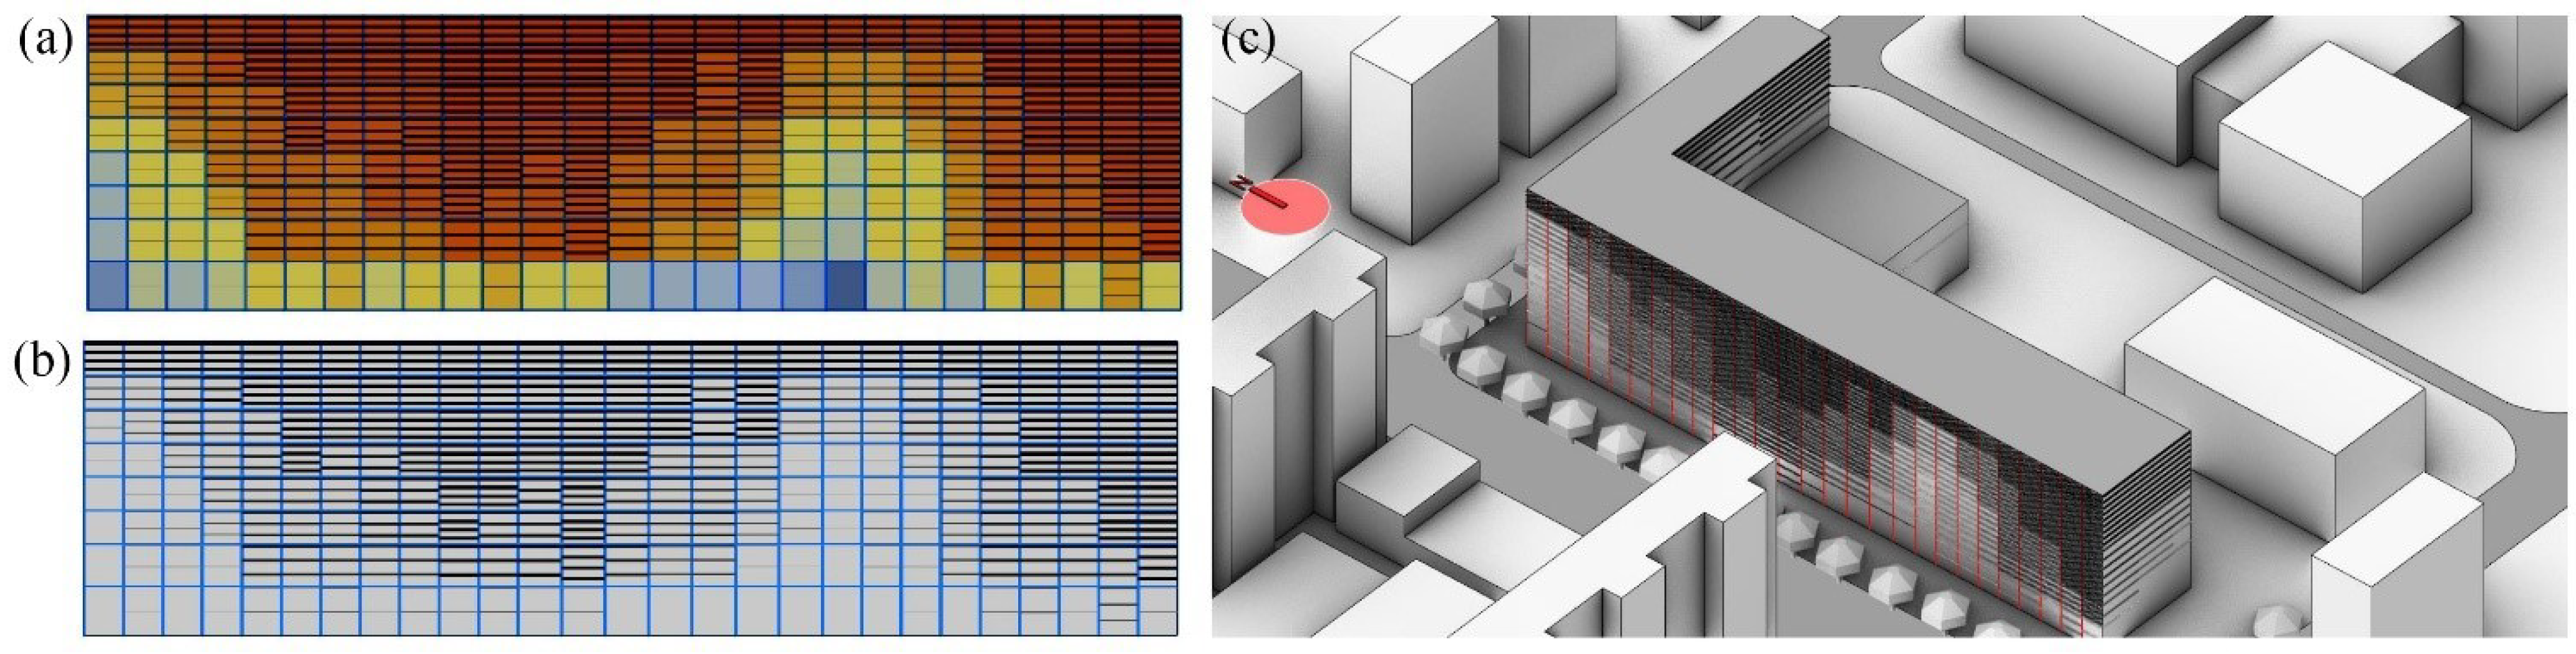
4.4. Analysis of Solar Intensity Distribution on the Facade

The adaptive shading system based on the outdoor light environment needs to accurately analyze the solar radiation distribution on the exterior surface of the building before carrying out targeted design according to the distribution. L&H is used to simulate the amount of solar radiation (kWh/m2) on the exterior walls of buildings throughout the year so that the distribution of radiation intensity on the facade in summer can be analyzed, and the radiation intensity can be subdivided according to a 3 m grid. Finally, the radiation intensity distribution map can be formed, as shown in Figure 10 and Figure 11. Unlike Figure 7, Figure 10 uses a 3 m grid to remain consistent with the parametric design of the shading system. This grid size is also used as the base setting for the subsequent optimization of the shading system. Heterogeneous radiation intensity will inevitably lead to differences in shading intensity requirements. Then, performance targets can be set according to these requirements to generate a shading system.
As seen from the simulation results in Figure 10, for solar radiation distribution over a whole year, the average solar radiation in the western orientation of the building is the largest. In contrast, the average amount of solar radiation in other directions is relatively low. Due to the climate regulation of surrounding buildings and greening, irradiance distribution increases with height. Therefore, the interior facing the west of the building has the worst physical performance in summer and represents the key area for designing a shading system. The south facade of the building should be properly shaded to reduce the strong solar radiation in winter, while the north and east facades should reduce the impact of solar radiation in summer. The annual distribution of solar radiation values on the west facade (Figure 11) can effectively help architects carry out targeted shading designs.

4.5. Automatic Optimization Process for Parametric Shading Systems

(1)
Logical relationship between facade-generation-related factors
There are three main factors related to facade generation: meteorological data, shading forms, and performance objectives. Meteorological data are derived from the climate environment. The sun shading forms can be produced through the translation of meteorological data. Two parametric styles of shading systems were designed: vertical fixed shades and horizontal fixed shades. These systems were designed as a 3 m grid, consistent with the grid used for the solar radiation analysis illustrated in Figure 11. The amount of solar radiation determines the sparsity of the shading panels within each grid. Figure 12 shows a parametric sunshade design flow with indoor thermal comfort and building energy consumption optimization objectives. Under the guidance of the above logical relationship, the computer can automatically complete the optimization process for shading in a short time by setting the relevant parameters of shading design and displaying the design in a visual form. The climate-driven facade forms results from the interaction between the building and its environment. This process represents an important passive design method for regulating solar radiation and improving building performance (Figure 12). Therefore, the generating logic for building facades is an algorithmic equation of elements related to “environmental climate”, “building language”, and “thermal performance”.
(2)
Set performance goals
Table 2 in Section 4.1 shows that performance objectives are a prerequisite for early performance-based design. According to the relevant information of the case study, statistics were produced for the relevant performance targets (Table 3):
  • The analysis period was set as summer and winter according to the climate characteristics of Xi’an;
  • The control content is related to the parameters of the shading components;
  • The control conditions are the national standard and local standard;
  • The performance objective is to reduce the adverse effects of solar radiation in summer with due consideration of the gain effects of solar radiation in winter. At the same time, indoor thermal comfort needs should be met for most of the year.
(3)
Ladybug Tool parameter input and running the software
The procedure for parameterizing performance analysis using Ladybug Tools consists of four main steps (Figure 13): (1) Meteorological data import and filtering; (2) shade parameter connection and shape generation; (3) establishment of the radiation simulation; and (4) performance feedback and verification. The software’s internal operation logic is as follows: input parameters to generate simulation results; then, generate results after feedback, modify the parameters again, and finally provide the optimal result output. The computer algorithm completes the whole process automatically, and the detailed simulation ensures accuracy and reliability optimization. More importantly, parametric design logic transforms abstract processes into clear, logical diagrams, which can help architects who want to quickly design buildings according to performance requirements. The development of digital technology changes the architectural design process from “separation of data and shape” to “fusion of data and shape” and extends the modelling object from “architectural geometry” to “information architecture (including architectural geometry, materials, and construction)” [37]. This design method overturns the traditional “point, line, and plane” modelling process and breaks through traditional form- and function-oriented design methods.
(4)
Generating visual facades and simulation verification
The computer calculation results are presented to the architect in a visual form. An example of a shading system solution is shown in Figure 14, which is based on the results of a simulation of the solar radiation intensity inside a building during the summer (Figure 11), resulting in a design solution that minimizes the building’s energy consumption and maximizes the building’s indoor comfort. The model includes the distribution of solar radiation in the sky, the distribution of solar radiation intensity in the grid of the building surface, and the optimal shading form of the building. At the same time, the building facade can be further designed under the guidance of the form of shading to ultimately generate a building facade form corresponding to the design concept. Moreover, the related simulation verification stage should occur earlier than the formation of the building facade form. This order of operations ensures that performance-based design content is not lost on the architect in subsequent designs.

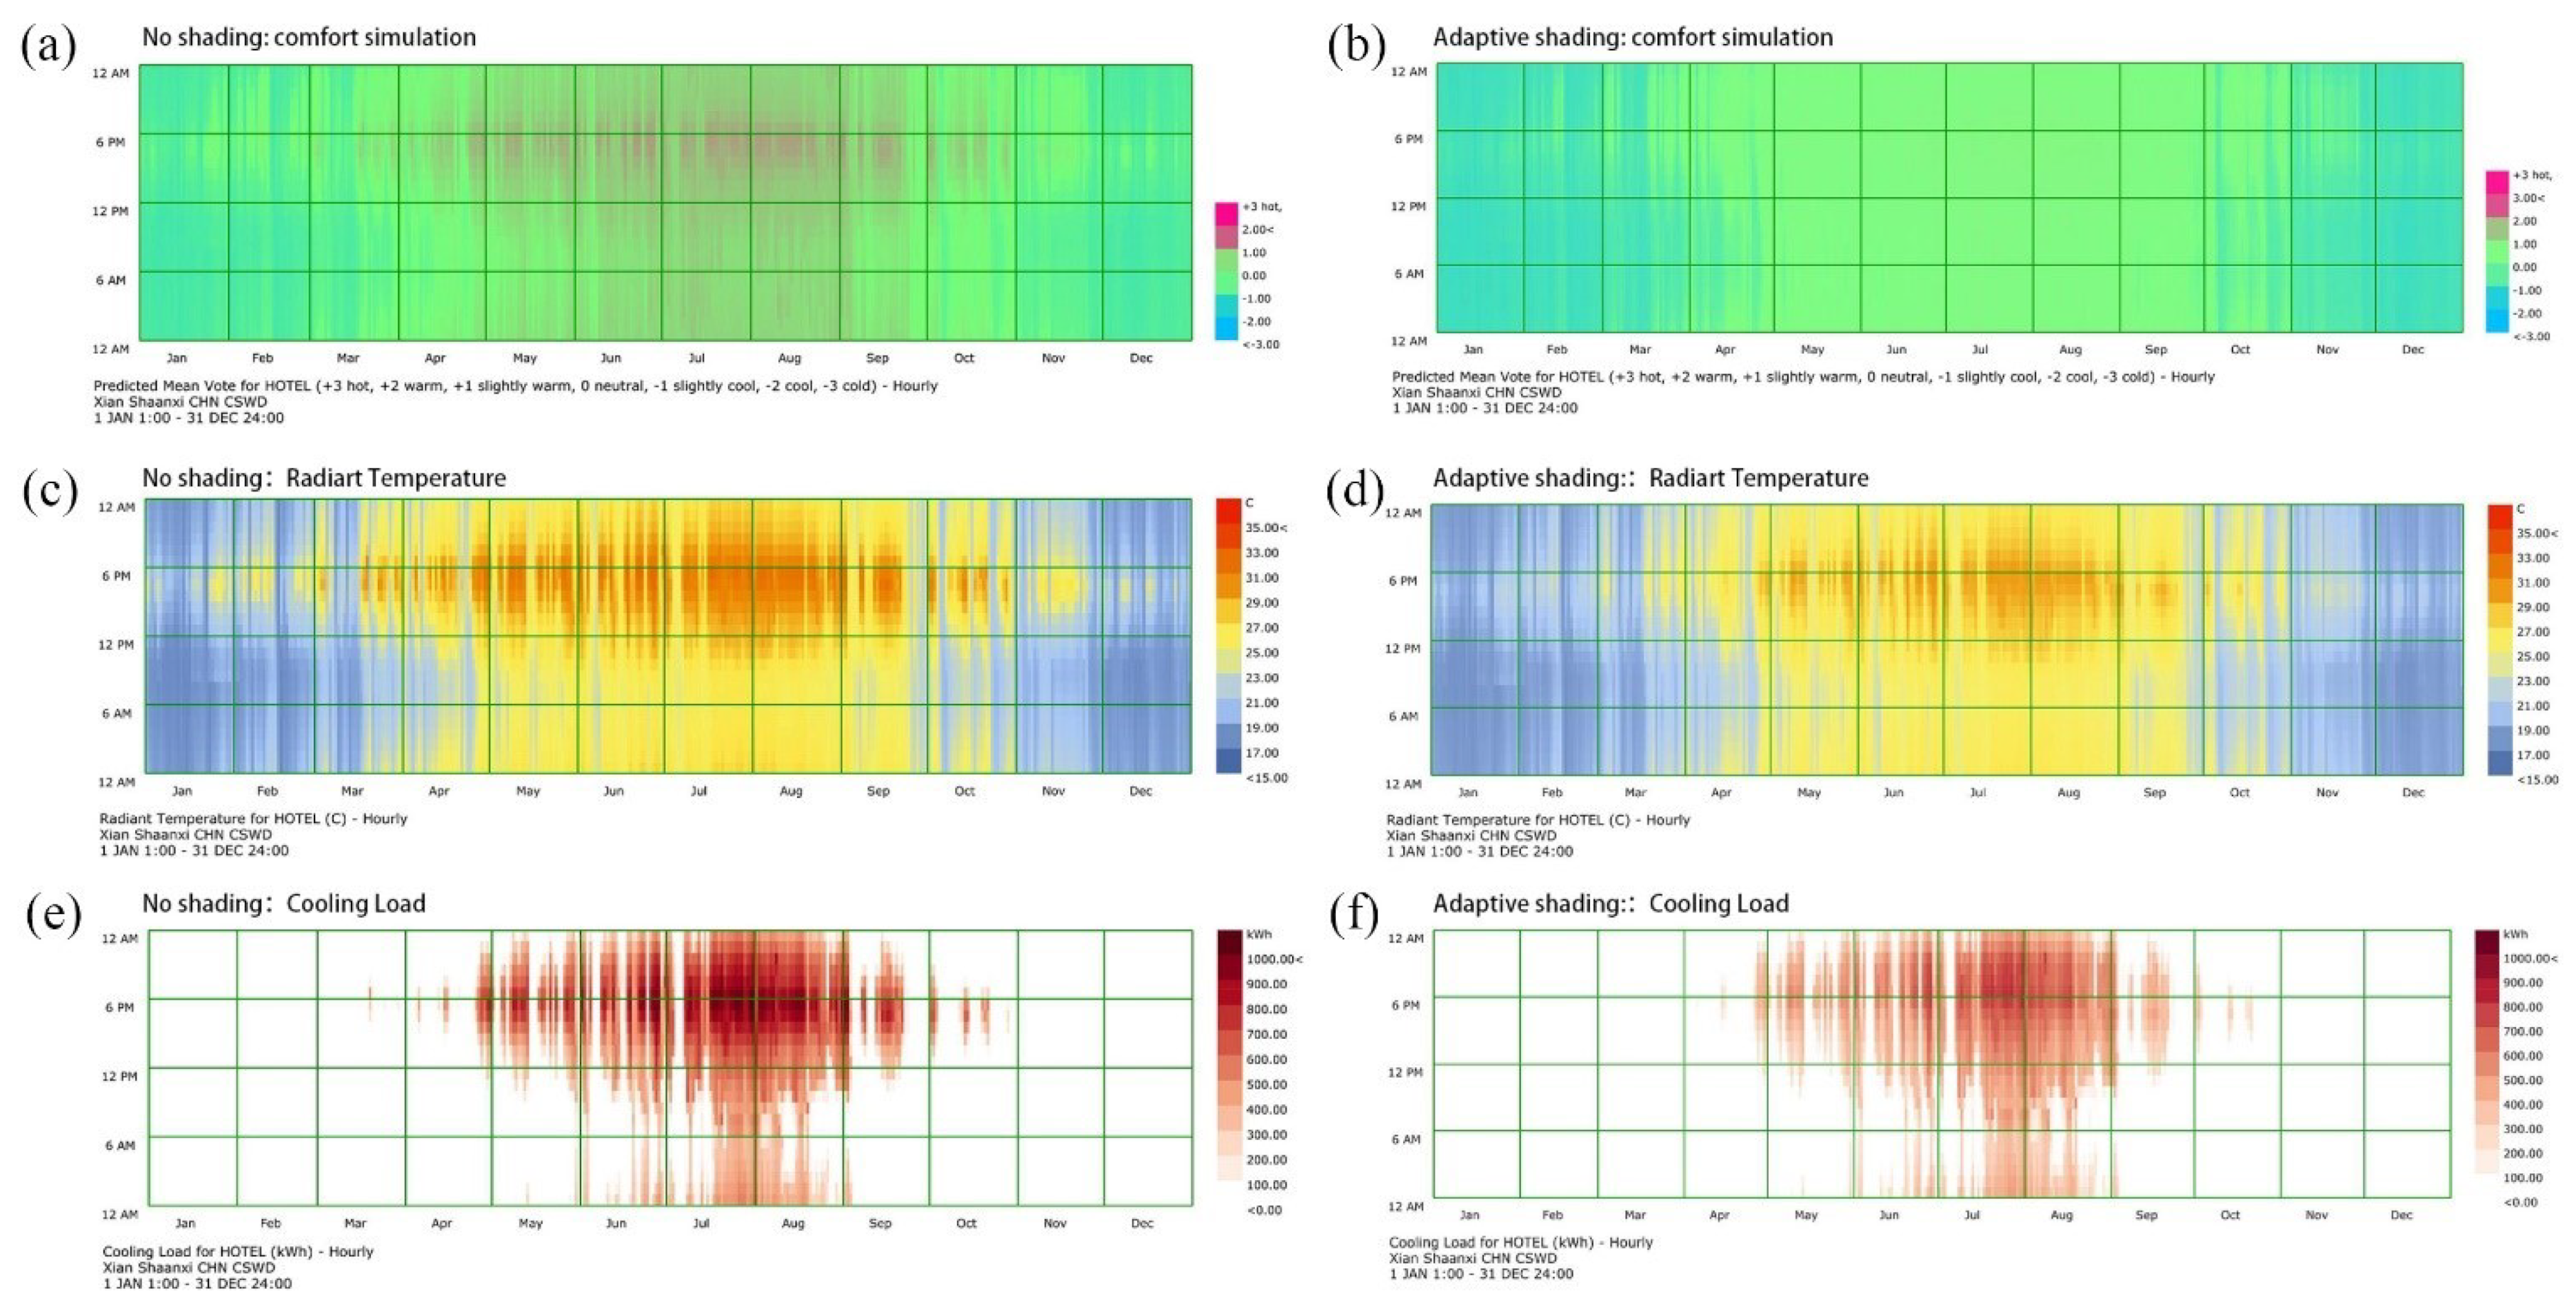
5. Simulation Verification of the Optimization Results

The automatically-optimized parametric shading system is generated with indoor performance objectives in mind, so it is necessary to perform simulation verification of the relevant performance indicators to demonstrate that the results are acceptable. The PMV value is selected as the verification indicator for the verification simulation. The PMV value is a simulation value under closed ideal conditions, without considering changes in human psychological expectations and window opening ventilation [38]. Fanger first developed a thermal comfort model to evaluate the level of occupant thermal comfort, in which the predicted mean vote (PMV) is an important evaluation metric [39]. This metric relies on the steady-state heat transfer conditions between the human body and its surroundings. PMV is related to room air temperature, radiation temperature, air velocity and relative humidity, human metabolic rate, and clothing thermal resistance. The definition of PMV values is shown in Table 4 and Table 5.
According to the target performance settings under the influence of the light environment outlined in Section 4.1, the PMV comfort evaluation (Figure 15a), solar radiation intensity on the building surface (Figure 15b), and annual cooling energy consumption (Figure 15c) of 255 hotel rooms were simulated under the conditions of unshaded construction and an adaptive shading system. According to the simulation results, the relevant performance targets were statistically analyzed (Table 6). Figure 15a shows that, under this model, the optimized adaptive shading system significantly improves indoor comfort, with the range of the PMV value adjusted from 0 ≤ PMV ≤ 3 to 0 ≤ PMV ≤ 1. Figure 15b shows that the high temperature part decreases significantly, the cooling energy consumption decreases, and the proportion of high-temperature periods (>30 °C) decreases significantly. Research shows that, in hot climates, the cooling energy of buildings is much greater than the heating energy over the whole year’s cycle [40]. To analyze the influence of shading on the energy consumption of building cooling systems in summer, we also applied a simulation comparison. Figure 15c shows that the adaptive shading system can significantly reduce the total cooling energy consumption and energy consumption per unit area in summer by 20% and 15%, respectively. The comfort level throughout the year was found to improve by 14.8% (air conditioning on) and 4.7% (air conditioning off). To summarize, the adaptive shading system based on L&H tools can not only produce multiple forms of the facade and assist architects in completing facade design but also meet the requirements of good interior performance.

6. Discussion

6.1. Building Performance and Building Design

Although architectural design has an important impact on the performance of a building in the vast majority of actual construction projects, the use of high-performance materials (e.g., lightweight insulation materials), active energy-saving technologies (light guide lighting, ground source heat pumps, etc.), and high-performance equipment systems (adaptive lighting, radiation cooling, etc.) represent the main measures used to improve building performance [41,42]. A review of active solar installations noted that an existing adaptive photovoltaic facade offered 20–80% net energy savings compared to an equivalent static facade. However, these savings also entailed significant installation and maintenance costs [43]. The authors suggested that affordable performance improvements may be achievable through building design. However, there is a gap between current building design and building performance assessment. In contrast, architectural design professionals have had difficulty actively participating in the discussion and design practices of architectural performance. In the scheme stage, architects often have to passively follow building energy-saving standards, such as the shape coefficient and window–wall ratio, to estimate building performance and adjust the corresponding architectural designs based on these standards.
On the one hand, architects are unfamiliar with the optimization strategies for building performance-based design; on the other hand, there remains a lack of tools and measures that can provide effective guidance and assist architects in building performance optimization. Although energy conservation standards and codes have certain universality, they are very limited in providing design guidance related to building performance and lack site-specific and task-specific information under different design conditions (e.g., building site and local climate). Based on L&H, climate-adaptive facade-shading automatic optimization design represents a refined design upgrade combined with a green building development strategy under the background of the computer age. Our work emphasizes the inclusion of climate and environment in the design of shading systems. The proposed approach automatically generates optimal shading schemes and helps architects to balance building performance with morphological design in the early stages of design. This paper will promote more research on the morphological optimization of shading systems.

6.2. Exterior Shading Systems and Building Facades

In recent years, parametric design has expanded the ability of architects to design a building’s morphology and improve the aesthetic level of architecture. Under climate change, many designers have pursued parametric design to produce complex building facade forms and aesthetic values, resulting in inadequate building performance. However, these new design methods are often founded on questionable reasoning, and sometimes, aesthetic interests dominate over, or contrast with, the true function of the envelope system. Conversely, too much engineering in the envelope system can create problems with the identity of the facade [44].
In the context of climate change, most research has neglected to discuss the performance of building facades, especially their impacts on indoor thermal comfort and building energy consumption, which do not presently meet the requirements of sustainable development. The performance requirements of parameterized facades designed by architects have gradually become recognized and accepted. However, the parametric shading elements do not mean that the final facade form is determined. The optimal facade form still needs to be found in the solution space of the parametric design. The parametric shading system aims at indoor performance optimization, although the shading design is dominated by single objective optimization. For example, such design can be further optimized using multi-objective methods such as the plane layout, window–wall ratio, and building materials [45,46,47,48]. The results cannot fully reflect the optimal path of indoor performance optimization, but from the perspective of combining facade designs, the shading system design is unique. Therefore, in this study, we sought a better solution to meet both objectives by considering the different needs of both sides through a performance-guided facade design approach. the findings of some state-of-the-art studies indicate that dynamic facades can improve daylight performance by approximately 1–15% compared to static facades [49]. indeed, one study found that an adaptive facade achieved a 14.2–29.0% reduction in energy consumption [50], while other studies showed that dynamic shading systems can achieve a 20% reduction in energy consumption [38,51]. in contrast, our work achieved a maximum 20% reduction in cooling energy consumption and a 14.8% increase in thermal comfort throughout the year, demonstrating our approach’s superiority.

7. Conclusions

This study presented an adaptive automated design method for building facade shading systems, aiming to enhance indoor thermal comfort and to reduce building energy consumption. The automated workflow included climate data analysis, performance target formulation, parametric design of the shading system, automatic optimization using the genetic algorithm, and performance simulation verification. The main findings of the study are as follows.
A visual analysis of the outdoor climate environment based on the digital simulation technology of the L&H tool can effectively translate climate parameters, and the results are crucial for determining optimization objectives. Empirical analysis of a case study showed that using this parameterized facade design method significantly improved cooling energy consumption and indoor comfort in summer while also achieving pre-set performance goals. This method can be applied anywhere that epw meteorological data are available and supports performance-based shading design. Our approach offers advantages compared to state-of-the-art studies.
Limitations of the current study include the fact that the article discusses only two typical louvered shading systems. In fact, parametric adaptive facades have been developed in more forms, all of which have different levels of energy saving and improved indoor thermal comfort properties. In addition, some other performance indicators such as daylight glare probability can be considered in the future to further improve the indoor light environment [52,53].

Author Contributions

Writing—original draft preparation, S.W. and P.L.; writing—review and editing, S.W., P.L., Q.Z., R.L. and Z.F. All authors have read and agreed to the published version of the manuscript.

Funding

This research was funded by National Natural Science Foundation of China, Grant No. 51678466.

Institutional Review Board Statement

Not applicable.

Informed Consent Statement

Informed consent was obtained from all subjects involved in the study.

Data Availability Statement

Not applicable.

Conflicts of Interest

The authors declare no conflict of interest.

References

  1. Faure, X.; Johansson, T.; Pasichnyi, O. The Impact of Detail, Shadowing and Thermal Zoning Levels on Urban Building Energy Modelling (UBEM) on a District Scale. Energies 2022, 15, 1525. [Google Scholar] [CrossRef]
  2. Brozovsky, J.; Gaitani, N.; Gustavsen, A. A systematic review of urban climate research in cold and polar climate regions. Renew. Sustain. Energy Rev. 2020, 138, 110551. [Google Scholar] [CrossRef]
  3. Aldossary, N.A.; Rezgui, Y.; Kwan, A. Establishing domestic low energy consumption reference levels for Saudi Arabia and the Wider Middle Eastern Region. Sustain. Cities Soc. 2017, 28, 265–276. [Google Scholar] [CrossRef]
  4. Haggag, M.; Hassan, A.; Qadir, G. Energy and Economic Performance of Plant-Shaded Building Façade in Hot Arid Climate. Sustainability 2017, 9, 2026. [Google Scholar] [CrossRef]
  5. Shi, X.; Yang, W. Performance-driven architectural design and optimization technique from a perspective of architects. Autom. Constr. 2013, 32, 125–135. [Google Scholar] [CrossRef]
  6. Al-Saeed, Y.W.; Ahmed, A. Evaluating Design Strategies for Nearly Zero Energy Buildings in the Middle East and North Africa Regions. Designs 2018, 2, 35. [Google Scholar] [CrossRef]
  7. Kirimtat, A.; Krejcar, O.; Ekici, B.; Tasgetiren, M.F. Multi-objective energy and daylight optimization of amorphous shading devices in buildings. Sol. Energy 2019, 185, 100–111. [Google Scholar] [CrossRef]
  8. Negendahl, K. Building performance simulation in the early design stage: An introduction to integrated dynamic models. Autom. Constr. 2015, 54, 39–53. [Google Scholar] [CrossRef]
  9. Echenagucia, T.M.; Capozzoli, A.; Cascone, Y.; Sassone, M. The early design stage of a building envelope: Multi-objective search through heating, cooling and lighting energy performance analysis. Appl. Energy 2015, 154, 577–591. [Google Scholar] [CrossRef]
  10. Olbina, S.; Hu, J. Daylighting and thermal performance of automated split-controlled blinds. Build. Environ. 2012, 56, 127–138. [Google Scholar] [CrossRef]
  11. Rizi, R.A.; Eltaweel, A. A user detective adaptive facade towards improving visual and thermal comfort. J. Build. Eng. 2020, 33, 101554. [Google Scholar] [CrossRef]
  12. Tuck, N.W.; Zaki, S.A.; Hagishima, A.; Rijal, H.B.; Yakub, F. Affordable retrofitting methods to achieve thermal comfort for a terrace house in Malaysia with a hot–humid climate. Energy Build. 2020, 223, 110072. [Google Scholar] [CrossRef]
  13. Tuck, N.W.; Zaki, S.A.; Hagishima, A.; Rijal, H.B.; Zakaria, M.A.; Yakub, F. Effectiveness of free running passive cooling strategies for indoor thermal environments: Example from a two-storey corner terrace house in Malaysia. Build. Environ. 2019, 160, 106214. [Google Scholar] [CrossRef]
  14. Luo, S.Q.; Yang, C.Z.; Li, H.Q.; Mao, Y. Study of coupled solar shading and heat collection devices in hot summer and cold winter regions. J. Sol. Energy 2020, 41, 79–85. [Google Scholar]
  15. Huo, H.; Xu, W.; Li, A.; Chu, J.; Lv, Y. Sensitivity analysis and prediction of shading effect of external Venetian blind for nearly zero-energy buildings in China. J. Build. Eng. 2021, 41, 102401. [Google Scholar] [CrossRef]
  16. Zhang, X.Q.; Liu, Y.; Yang, L.; Liu, T.; Zhang, C.; Dong, H. Study on the method of determining outdoor calculation parameters for architectural sunshade design. Build. Sci. 2020, 36, 95–103. [Google Scholar] [CrossRef]
  17. Manzan, M. Genetic optimization of external fixed shading devices. Energy Build. 2014, 72, 431–440. [Google Scholar] [CrossRef]
  18. Eltaweel, A.; Su, Y. Parametric design and daylighting: A literature review. Renew. Sustain. Energy Rev. 2017, 73, 1086–1103. [Google Scholar] [CrossRef]
  19. Nguyen, A.-T.; Reiter, S.; Rigo, P. A review on simulation-based optimization methods applied to building performance analysis. Appl. Energy 2014, 113, 1043–1058. [Google Scholar] [CrossRef]
  20. Taveres-Cachat, E.; Lobaccaro, G.; Goia, F.; Chaudhary, G. A methodology to improve the performance of PV integrated shading devices using multi-objective optimization. Appl. Energy 2019, 247, 731–744. [Google Scholar] [CrossRef]
  21. Wang, L.; Zhang, H.; Liu, X.; Ji, G. Exploring the synergy of building massing and façade design through evolutionary optimization. Front. Arch. Res. 2022, 21, 105462. [Google Scholar] [CrossRef]
  22. Bahdad, A.A.S.; Fadzil, S.F.S.; Onubi, H.O.; BenLasod, S.A. Sensitivity analysis linked to multi-objective optimization for adjustments of light-shelves design parameters in response to visual comfort and thermal energy performance. J. Build. Eng. 2021, 44, 102996. [Google Scholar] [CrossRef]
  23. Abediniangerabi, B.; Makhmalbaf, A.; Shahandashti, M. Deep learning for estimating energy savings of early-stage facade design decisions. Energy AI 2021, 5, 100077. [Google Scholar] [CrossRef]
  24. Ekici, B.; Cubukcuoglu, C.; Turrin, M.; Sariyildiz, I.S. Performative computational architecture using swarm and evolutionary optimisation: A review. Build. Environ. 2018, 147, 356–371. [Google Scholar] [CrossRef]
  25. Wang, Y. Pre-lighting daylighting analysis for building planning based on Ladybug+Honeybee parametric design. Settlement 2019, 03, 117–123. [Google Scholar]
  26. Harmim, A.; Boukar, M.; Amar, M.; Haida, A. Simulation and experimentation of an integrated collector storage solar water heater designed for integration into building facade. Energy 2018, 166, 59–71. [Google Scholar] [CrossRef]
  27. Bi, X.J.; Liu, C.H. Future design: A parametric performance design approach based on Ladybug+Honeybee. Architect 2018, 01, 131–136. [Google Scholar]
  28. Naboni, E.; Natanian, J.; Brizzi, G.; Florio, P.; Chokhachian, A.; Galanos, T.; Rastogi, P. A digital workflow to quantify regenerative urban design in the context of a changing climate. Renew. Sustain. Energy Rev. 2019, 113, 109255. [Google Scholar] [CrossRef]
  29. Evola, G.; Costanzo, V.; Magrì, C.; Margani, G.; Marletta, L.; Naboni, E. A novel comprehensive workflow for modelling outdoor thermal comfort and energy demand in urban canyons: Results and critical issues. Energy Build. 2020, 216, 109946. [Google Scholar] [CrossRef]
  30. Ayoub, M. A review on light transport algorithms and simulation tools to model daylighting inside buildings. Sol. Energy 2020, 198, 623–642. [Google Scholar] [CrossRef]
  31. Adaptation in Natural and Artificial Systems|The MIT Press. Available online: https://mitpress.mit.edu/books/adaptation-natural-and-artificial-systems (accessed on 17 July 2022).
  32. Luo, Z.; Lu, Y.; Cang, Y.; Yang, L. Study on dual-objective optimization method of life cycle energy consumption and economy of office building based on HypE genetic algorithm. Energy Build. 2021, 256, 111749. [Google Scholar] [CrossRef]
  33. Ladybug: A Parametric Environmental Plugin for Grasshopper to Help Designers Create an Environmentally-Conscious Design. Available online: https://docplayer.net/33925137-Ladybug-a-parametric-environmental-plugin-for-grasshopper-to-help-designers-create-an-environmentally-conscious-design.html (accessed on 18 July 2022).
  34. Kim, M.; Leigh, S.-B.; Kim, T.; Cho, S. A Study on External Shading Devices for Reducing Cooling Loads and Improving Daylighting in Office Buildings. J. Asian Arch. Build. Eng. 2015, 14, 687–694. [Google Scholar] [CrossRef]
  35. Wang, W.; Li, S.; Guo, S.; Ma, M.; Feng, S.; Bao, L. Benchmarking urban local weather with long-term monitoring compared with weather datasets from climate station and EnergyPlus weather (EPW) data. Energy Rep. 2021, 7, 6501–6514. [Google Scholar] [CrossRef]
  36. Tian, L.; Qin, Y.G.; Lin, B. A discussion of some important issues in building environmental performance assessment. New Archit. 2005, 03, 89–91. [Google Scholar] [CrossRef]
  37. Sun, C.; Han, Y.S.; Zhuang, D. “ Performance-driven” thinking of dynamic building information modeling technology. J. Archit. 2017, 8, 68–71. [Google Scholar]
  38. Liu, P.; Zhang, Q.; Zhong, K.; Wei, Y.; Wang, Q. Climate Adaptation and Indoor Comfort Improvement Strategies for Buildings in High-Cold Regions: Empirical Study from Ganzi Region, China. Sustainability 2022, 14, 576. [Google Scholar] [CrossRef]
  39. Mao, N.; Hao, J.; He, T.; Song, M.; Xu, Y.; Deng, S. PMV-based dynamic optimization of energy consumption for a residential task/ambient air conditioning system in different climate zones. Renew. Energy 2019, 142, 41–54. [Google Scholar] [CrossRef]
  40. Liu, P.; Zhang, Q.; Wei, Y.M. Research on energy-saving design methods for buildings with large spaces. J. Archit. 2020, S1, 12–16. [Google Scholar]
  41. Modeling, Design, and Optimization of Net-Zero Energy Buildings|Wiley. Available online: https://www.wiley.com/en-us/Modeling%2C+Design%2C+and+Optimization+of+Net+Zero+Energy+Buildings-p-9783433030837 (accessed on 18 July 2022).
  42. Chastas, P.; Theodosiou, T.; Bikas, D. Embodied energy in residential buildings-towards the nearly zero energy building: A literature review. Build. Environ. 2016, 105, 267–282. [Google Scholar] [CrossRef]
  43. Vassiliades, C.; Agathokleous, R.; Barone, G.; Forzano, C.; Giuzio, G.; Palombo, A.; Buonomano, A.; Kalogirou, S. Building integration of active solar energy systems: A review of geometrical and architectural characteristics. Renew. Sustain. Energy Rev. 2022, 164, 112482. [Google Scholar] [CrossRef]
  44. Yi, Y.K. Building facade multi-objective optimization for daylight and aesthetical perception. Build. Environ. 2019, 156, 178–190. [Google Scholar] [CrossRef]
  45. Ferrara, M.; Fabrizio, E.; Virgone, J.; Filippi, M. A simulation-based optimization method for cost-optimal analysis of nearly Zero Energy Buildings. Energy Build. 2014, 84, 442–457. [Google Scholar] [CrossRef]
  46. Znouda, E.; Ghrab-Morcos, N.; Hadj-Alouane, A. Optimization of Mediterranean building design using genetic algorithms. Energy Build. 2007, 39, 148–153. [Google Scholar] [CrossRef]
  47. Thalfeldt, M.; Pikas, E.; Kurnitski, J.; Voll, H. Facade design principles for nearly zero energy buildings in a cold climate. Energy Build. 2013, 67, 309–321. [Google Scholar] [CrossRef]
  48. Directive 2010/31/EU. Available online: https://lexparency.org/eu/32010L0031/ (accessed on 1 August 2022).
  49. Shen, L.; Han, Y. Optimizing the modular adaptive façade control strategy in open office space using integer programming and surrogate modelling. Energy Build. 2021, 254, 111546. [Google Scholar] [CrossRef]
  50. Bui, D.-K.; Nguyen, T.N.; Ghazlan, A.; Ngo, N.-T.; Ngo, T.D. Enhancing building energy efficiency by adaptive façade: A computational optimization approach. Appl. Energy 2020, 265, 114797. [Google Scholar] [CrossRef]
  51. Kunwar, N.; Cetin, K.S.; Passe, U. Calibration of energy simulation using optimization for buildings with dynamic shading systems. Energy Build. 2021, 236, 110787. [Google Scholar] [CrossRef]
  52. Zhong, K.; Chen, L. An Intelligent Calculation Method of Volterra Time-Domain Kernel Based on Time-Delay Artificial Neural Network. Math. Probl. Eng. 2020, 2020, 8546963. [Google Scholar] [CrossRef]
  53. Ji, Y.; Xue, J.; Zhong, K. Does Environmental Regulation Promote Industrial Green Technology Progress? Empirical Evidence from China with a Heterogeneity Analysis. Int. J. Environ. Res. Public Health 2022, 19, 484. [Google Scholar] [CrossRef]
Figure 1. Cost–benefit relationship between traditional and digital architectural design methods in terms of time investment–outcome efficiency.
Atmosphere 13 01244 g001
Figure 2. Research flow chart.
Atmosphere 13 01244 g002
Figure 3. Location map of the object.
Atmosphere 13 01244 g003
Figure 4. Standard floor plan layout of the object.
Atmosphere 13 01244 g004
Figure 5. The Radiation intensity distribution model in Xi’an: (a) a-year-round radiation model; (b) high-temperature radiation model; (c) low-temperature radiation model.
Atmosphere 13 01244 g005
Figure 6. The solar trajectory and solar position on high-temperature days in Xi’an (temperatures exceeding 26 °C).
Atmosphere 13 01244 g006
Figure 7. The radiation simulation of the tourist hotel on high-temperature days (a) and low-temperature days (b).
Atmosphere 13 01244 g007
Figure 8. Design optimization application workflow diagram.
Atmosphere 13 01244 g008
Figure 9. The shading parameters: length of sunshade L (a); some sunshade N (b); sunshade angle A (c); sunshade transmittance P (d).
Atmosphere 13 01244 g009
Figure 10. Year-round periodic radiation simulation based on window units.
Atmosphere 13 01244 g010
Figure 11. The simulated radiation value on every window unit.
Atmosphere 13 01244 g011
Figure 12. The relationship between meteorological data, shading form, and performance control.
Atmosphere 13 01244 g012
Figure 13. GA for optimizing shading. (a) Step 1; (b) Step 2; (c) Step 3; (d) Step 4.
Atmosphere 13 01244 g013
Figure 14. The shading form translated by meteorological data under the control of parametric design. (a) Radiation simulation of the façade; (b) Shading system generation based on radiation result; (c) Simulation result of shading performance.
Atmosphere 13 01244 g014
Figure 15. The effects of adaptive shading on comfort, average radiant temperature, and cooling energy consumption. (a) The annual comfort simulation with no shading; (b) The annual comfort simulation with adaptive shading; (c) The annual radiation temperature simulation with no shading; (d) The annual radiation temperature simulation with adaptive shading; (e) The cooling load simulation with no shading; (f) The cooling load simulation with adaptive shading.
Atmosphere 13 01244 g015
Table 1. Architectural information of on the research object.
Basic InformationFacade Surface Area
Area of structure31,707.00 m2South1440 m2
Height36 mNorth2016 m2
Room number50/floorWest4032 m2
Floor area4020East3744 m2
Table 2. Design Strategy and Method of shading system based on light environment.
Performance MetricsControl ContentControl ConditionsOptimization Objective
Daylighting
periods
1. Period of strong solar radiation from June to August.
2. Period of weak solar radiation from December to March.
3. The length of sunshine on the surface of the window.
Typical Meteorological Year data (TMY)Tout ≥ 26 °C; the unfavorable room has a corresponding shading design
Surrounding environmental obstruction
Useful Daylight Illumination (UDI)1. Length of sunshade.
2. Number of sunshades.
3. Sunshade angle.
4. Transmittance of sunshade.
UDI ≤ 100: dimEnsure that the daylight illumination is within an acceptable range
100 < UDI < 2000: Acceptable range
UDI ≥ 2000: bright
Total energy consumption (TEC)1. Control the heat on the surface of the building.
2. Solar radiation intensity on the surface of the window.
Local energy-efficient design standard specifications Reduce cooling energy consumption in summer
Reduce heating energy consumption in winter
−1 ≤ PMV ≤ +1
The Predicted Mean Vote
(PMV) comfort indicator
Subjective
feelings
1. Line-of-sight obstruction.
2. Glare problems.
Line-of-sight angleGuaranteed view of the landscape
Table 3. The building facade shading form driven by building performance.
Control ConditionClimate Data: Solar Radiation Intensity
Control periodSummer (June-August)/Winter (December-February)
Control contentssunshade length (L); sunshade quantity (N); sunshade angle (A); sunshade transparency (P);
Control conditions1. Code for Design of Civil Buildings in China (GB 50352-2019);
2. Design Code for Heating Ventilation and Air Conditioning of Civil Buildings in China (GB50736-2016);
3. The Standard for Daylighting Design of Buildings in China (GB 50033-2013).
Optimization
objectives
1. Energy consumption: cooling energy consumption on high-temperature days in summer; heating energy consumption on low-temperature days in winter.
2. Comfort: Indoor thermal comfort in summer and winter.
3. Radiation intensity: the minimum cumulative value of radiation under high-temperature weather in summer and the maximum cumulative value of radiation in low-temperature weather in winter.
The facade style Atmosphere 13 01244 i001
1. Vertical fixed sunshade; 2. Horizontal fixed sunshade;
Table 4. Corresponding relation between PMV values and the seven-point thermal index.
Thermal SensationColdColdSlightly CoolNeutralSlightly WarmWarmHot
PMV−3−2−10+1+2+3
Table 5. Comfort level based on PMV–PPD.
CategoryEvaluation Index
I−0.5 ≤ PMV ≤ +0.5PPD ≤ 10%
II−1 ≤ PMV < −0.5/ + 0.5 < PMV ≤ +110% < PPD ≤ 25%
IIIPMV < −1/PMV > +1PPD > 25%
Table 6. Comparative analysis of the performance objective optimization results.
No Shading SystemAdaptive Shading System
Annual cooling energy consumption676,078 kWh556,862 kWh
average energy consumption (AEC)/room2651 kWh2184 kWh
average energy consumption (AEC)/m222 kWh/m219 kWh/m2
PMV (June–September)0 ≤ PMV ≤ 30 ≤ PMV ≤ 1
The proportion of area per unit radiation value on the surfaces
(June–September) (kWh/m2)
≥30036.6%≥30020.5%
200–30056.9%200–30018.9%
≤2006.5%≤20060.6%
Year-round
comfort ratio
Air conditioning was running
(Set temperature: 26 °C)
64%Air conditioning was running
(Set temperature: 26 °C)
78.8%
Air conditioning is turned off9.1%Air conditioning is turned off13.8%
Publisher’s Note: MDPI stays neutral with regard to jurisdictional claims in published maps and institutional affiliations.

