Article

The Influences of the Desert Photovoltaic Power Station on Local Climate and Environment: A Case Study in Dunhuang Photovoltaic Industrial Park, Dunhuang City, China in 2019

1
College of Geography and Environmental Science, Northwest Normal University, Lanzhou 730070, China
2
Gansu Natural Energy Research Institute, Gansu Academy of Sciences, Lanzhou 730046, China
*
Author to whom correspondence should be addressed.
Atmosphere 2022, 13(8), 1235; https://doi.org/10.3390/atmos13081235
Submission received: 6 July 2022 / Revised: 30 July 2022 / Accepted: 2 August 2022 / Published: 3 August 2022
(This article belongs to the Section Climatology)

Abstract

:
Based on the meteorological observation data of air temperature, surface temperature and albedo data retrieved from remote sensing images inside and outside the photovoltaic station, as well as the measured soil moisture content and bulk density at different locations of the photovoltaic power station in 2019, the impact of large-scale desert photovoltaic power plants on climate and environment was studied. The results show that air temperature, surface temperature and albedo inside the photovoltaic power station are lower than those outside the station, which are obvious in winter and not obvious in summer. Therefore, the photovoltaic power station is a cold source and an energy sink. The soil moisture content under and between the photovoltaic arrays is larger than other sampling points, and the soil bulk density gradually decreases with the distance from the center of the photovoltaic power station. Therefore, future plans for desert photovoltaic power station construction should take into account the impacts on local climate and environment.

1. Introduction

With the prominence of global warming and energy security issues, renewable energy is recognized as a green and sustainable energy [1] that countries around the world are vigorously developing. By 2020, the global installed capacity of renewable energy reached 2838 GW, of which the installed capacity of photovoltaic power generation was 760 GW, accounting for 27% of the total installed capacity. China’s installed PV capacity accounts for more than half of the world’s installed capacity [2]. The effect of photovoltaic power plants on the environment is a long-term cumulative process, and although they have played a positive role in energy conservation and emission reduction, their impact on the ecological environment and climate cannot be ignored [3]. Therefore, with the growth of photovoltaic installed capacity and the expansion of the scale of power stations, whether large-scale photovoltaic power stations will have an impact on local climates and ecological environments has attracted more and more attention. Since 2000, researchers started to study this field, but there are few studies of the influence of desert photovoltaic stations on local climate and ecological environment in China.
At present, the main research methods for the impact of photovoltaic power plants on the local climate and environment are model research, remote sensing parameter inversion and field observation. International research mainly focuses on the simulation of meteorological parameters by a model. These studies provide important insights into the potential climate impacts of a large-scale PV plant. Barran-Gafford, Millstein, Fthenakis and Yu, and Broadbent used the methods of field measurements, a mesoscale numerical model (WRF), fluid dynamics and observational towers to research the influence of photovoltaic power plants on air temperature in different states of the United States. The results suggest that the temperature inside the power stations is higher than that outside the power stations, and the photovoltaic power stations cause a heat island effect [4,5,6,7]. The research by Chinese scholar Zhao Pengyu came to the same conclusion on the air temperature inside and outside the Ulanbu desert photovoltaic power plant [8]. However, Chang, Taha, Salamanaca, Masson and Lu Xia studied photovoltaic power plants in the Republic Basin of Qinghai, Los Angeles, Arizona, Paris, and Jiuquan, Gansu, and found that the air temperature inside the power station was lower than that outside the power station [9,10,11,12,13]. Gao Xiaoqing et al. conducted air temperature observations inside and outside the photovoltaic power station in Golmud, Qinghai Province, and found that the air temperature inside the station was higher than outside the station during the day, but lower at night [14]. The different research conclusions on the air temperatures inside and outside the power stations may be related to the different natural and geographical conditions of the areas. However, the research on the surface albedo inside and outside the photovoltaic power stations is relatively consistent, that is, due to the strong absorption of solar radiation by photovoltaic modules, the surface albedo inside the stations is lower than that outside the stations [5,9,15,16,17]. In addition, through simulation experiments, Li found that the decrease in albedo increases the surface evaporation, which leads to an increasing precipitation, which, in turn, promotes the growth of vegetation. Better vegetation growth further reduces surface albedo, thus forming a positive feedback mechanism of albedo–precipitation–vegetation [17]. Gao Xiaoqing observed the soil temperature of Qinghai Golmud photovoltaic power station for one year and found that the daily difference of soil temperature in the shallow layer is significantly lower than outside the station, and the photovoltaic power station has the effect of heat insulation [18]. Wang Tao’s and Wang Zhenyi et al.’s research show that after the completion of the photovoltaic power station, the soil moisture content increased by 30–34% compared with the surrounding area of the power station, which resulted from the shading effect of photovoltaic panels [19,20]. However, compared with studies on temperature and albedo, there are few studies on soil parameters inside and outside photovoltaic power plants.
The impact of photovoltaic power plants on climate and environment has attracted the attention of universities and research institutions across the world, but compared with climate and photovoltaic technology research, this study area is still in its infancy. The conclusions drawn by relevant studies are also different, and there is no precise and unified explanation and demonstration. This may be due to the different geographical locations, climatic conditions and underlying surface conditions of each study area.
At present, there are few studies on the climate and environmental impact from desert photovoltaic power station construction in Gansu province, and existing research is only composed of theoretical numerical calculation studies without field observation. Based on this, the study uses the observation data of air temperature inside and outside the desert photovoltaic power station, albedo and surface temperature data retrieved from remote sensing images, and soil moisture content and soil bulk density data from field sampling experiments to analyze the influence of desert photovoltaic power plants on the local climate and environment.
The paper is organized as follows. Firstly, the materials and methods including study area and data resources and methods are presented in Section 2. Then, air temperature, land surface temperature, albedo inside and outside the photovoltaic park, soil moisture content and soil bulk density in different locations are analyzed and discussed in the Results section. Finally, the conclusions and discussion are given.

2. Materials and Methods

2.1. Study Area

The Hexi Corridor in Gansu province of China is the concentrated distribution area of the country’s photovoltaic power generation industry, and it is also a desert area with a relatively fragile ecological environment.
Dunhuang is located at the westernmost end of the Hexi Corridor in Gansu Province (39°40′ N~41°35′ N, 92°13′ E~95°30′ E), with an area of 3,120,000 km2 and an altitude range of 800~1800 m. It is known as the “Gobi Oasis”, which is surrounded by deserts. It is a typical warm, temperate, arid climate with an annual average temperature of 9.9 °C, maximum temperature of 41.7 °C, minimum temperature of −30.5 °C, annual precipitation of 42.2 mm and annual evaporation of 2505 mm. In the context of climate change, in recent decades, the average annual temperature in Dunhuang has generally been on the rise with fluctuations, which is consistent with the changes in the world and China, but the increase is relatively low [21]. Meanwhile, the precipitation in Dunhuang has generally shown an increasing trend. The precipitation is mainly concentrated in spring and summer. Furthermore, the evapotranspiration also shows a general increasing trend that is large in spring and summer, but small in autumn and winter. The rate of increase in evaporation is much faster than that in precipitation, which makes the trend of aridification in Dunhuang more obvious [22]. With the annual sunshine hours of 3257.9 h, Dunhuang is one of the areas with the highest solar radiation in China, where the percentage of sunshine is 75% and the annual accumulative solar radiation amount is about 6800 MJ/m2. Thus, the development potential of the photovoltaic industry is huge [23].
Dunhuang Photovoltaic Industrial Park is located in Qili Town of Dunhuang City, about 13 km away from the urban area. The site range is 39°58′ N~40°5′ N, 94°11′ E~94°26′ E, covering an area of about 254 km2. The total planned installed capacity of the power plant is 4200 MW, of which the photovoltaic installed capacity is 2000 MW and the concentrating solar power installed capacity is 2200 MW.
The terrain of the park is flat and open. It slopes slightly from the southwest to the northeast, with slight fluctuations in some parts, and the natural slope drops by about 1%. There is no vegetation distribution on the surface of this Gobi Desert. It can meet the land demand for solar photovoltaic and solar thermal power generation with low cost, making it an ideal site for solar power generation project construction (Figure 1).

2.2. Data Resources and Methods

For the research, the hourly observation data of 1.5 m air temperature from the meteorological station inside the photovoltaic park (MSIP) (40°5′47.76″ N, 94°29′2.34″ E) and meteorological station outside the park (MSOP) (40°5′57.17″ N, 94°33′36.38″ E) were selected to analyze the diurnal, monthly and seasonal changes of air temperature in 2019. In addition, ΔT is the air temperature difference between the air temperature inside and outside the photovoltaic park and the relative error percentage (RE) is used to reflect the temperature difference between the meteorological station inside and outside the park, as shown in the following formula:
ΔT = Tinside − Toutside
RE = Δ T T outside × 100 %
The research used four remote sensing images of Sentinel-2A (10 m resolution) in spring (20190402), summer (20190711), autumn (20190929) and winter (20191208) to invert the surface albedo in different seasons inside and outside the photovoltaic power station. Meanwhile, four remote sensing images from the Landsat OLI/TIRS (resolution of 30 m) in spring (20190413), summer (20190803), autumn (20191006) and winter (20191225) were used to invert the surface temperature inside and outside the photovoltaic power station. The cloud cover of all remote sensing images obtained did not exceed 10%, and there was no snow cover in winter. In order to further quantitatively compare the surface albedo and surface temperature inside and outside the park, ArcGIS software was used to extract the surface albedo and surface temperature inside and outside the photovoltaic power station (0–1.5 km from the edge of the power station) pixel by pixel and calculate their average value.
In addition, in mid-June 2019, sampling experiments were carried out on the soil moisture content and soil bulk density of the topsoil in different locations inside and outside the photovoltaic park. The layout of the sample plot was as follows (Figure 1): in the photovoltaic power station, sampling points were set up in front of the photovoltaic arrays (FPV), between the photovoltaic arrays (BPV), and under the photovoltaic modules (UPV); from the perspective of the distance from the photovoltaic power station in the park (MSIP), there was a point outside the park that was 1 km away from the center of the photovoltaic power station (OP-1) (40°5′47.92″ N, 94°30′30.95″ E), a point 3 km away (OP-2) (40°5′59.55″ N, 94°31′15.38″ E) and a point 5 km away (OP-3) (40°5′54.10″ N, 94°32′41.82″ E). The soil moisture content was measured by the drying weight method, and soil bulk density was determined by the ring knife method. Firstly, the undisturbed soil was collected, at a volume of 100 cm3, with a ring knife at each sample point; three samples were needed to be collected for averaging. The fresh weight was found by weighing immediately. Additionally, then it was packed and taken back to the laboratory in an aluminum box. The soil samples were dried at 105 °C for no less than 16 h. When the quality was constant, the dried soil was weighted. The soil water content and soil bulk density were calculated according to the following equations [24,25]:
SMC = ( M f s M d s ) M d s × 100 % = M water M d s × 100 %
SBD = M d s 100
where SMC stands for soil moisture content (%), SBD stands for soil bulk density (g/cm3), Mfs is the mass of the fresh soil sample (g) and Mds is the mass of the dried soil sample (g).

3. Results

3.1. The Temperature

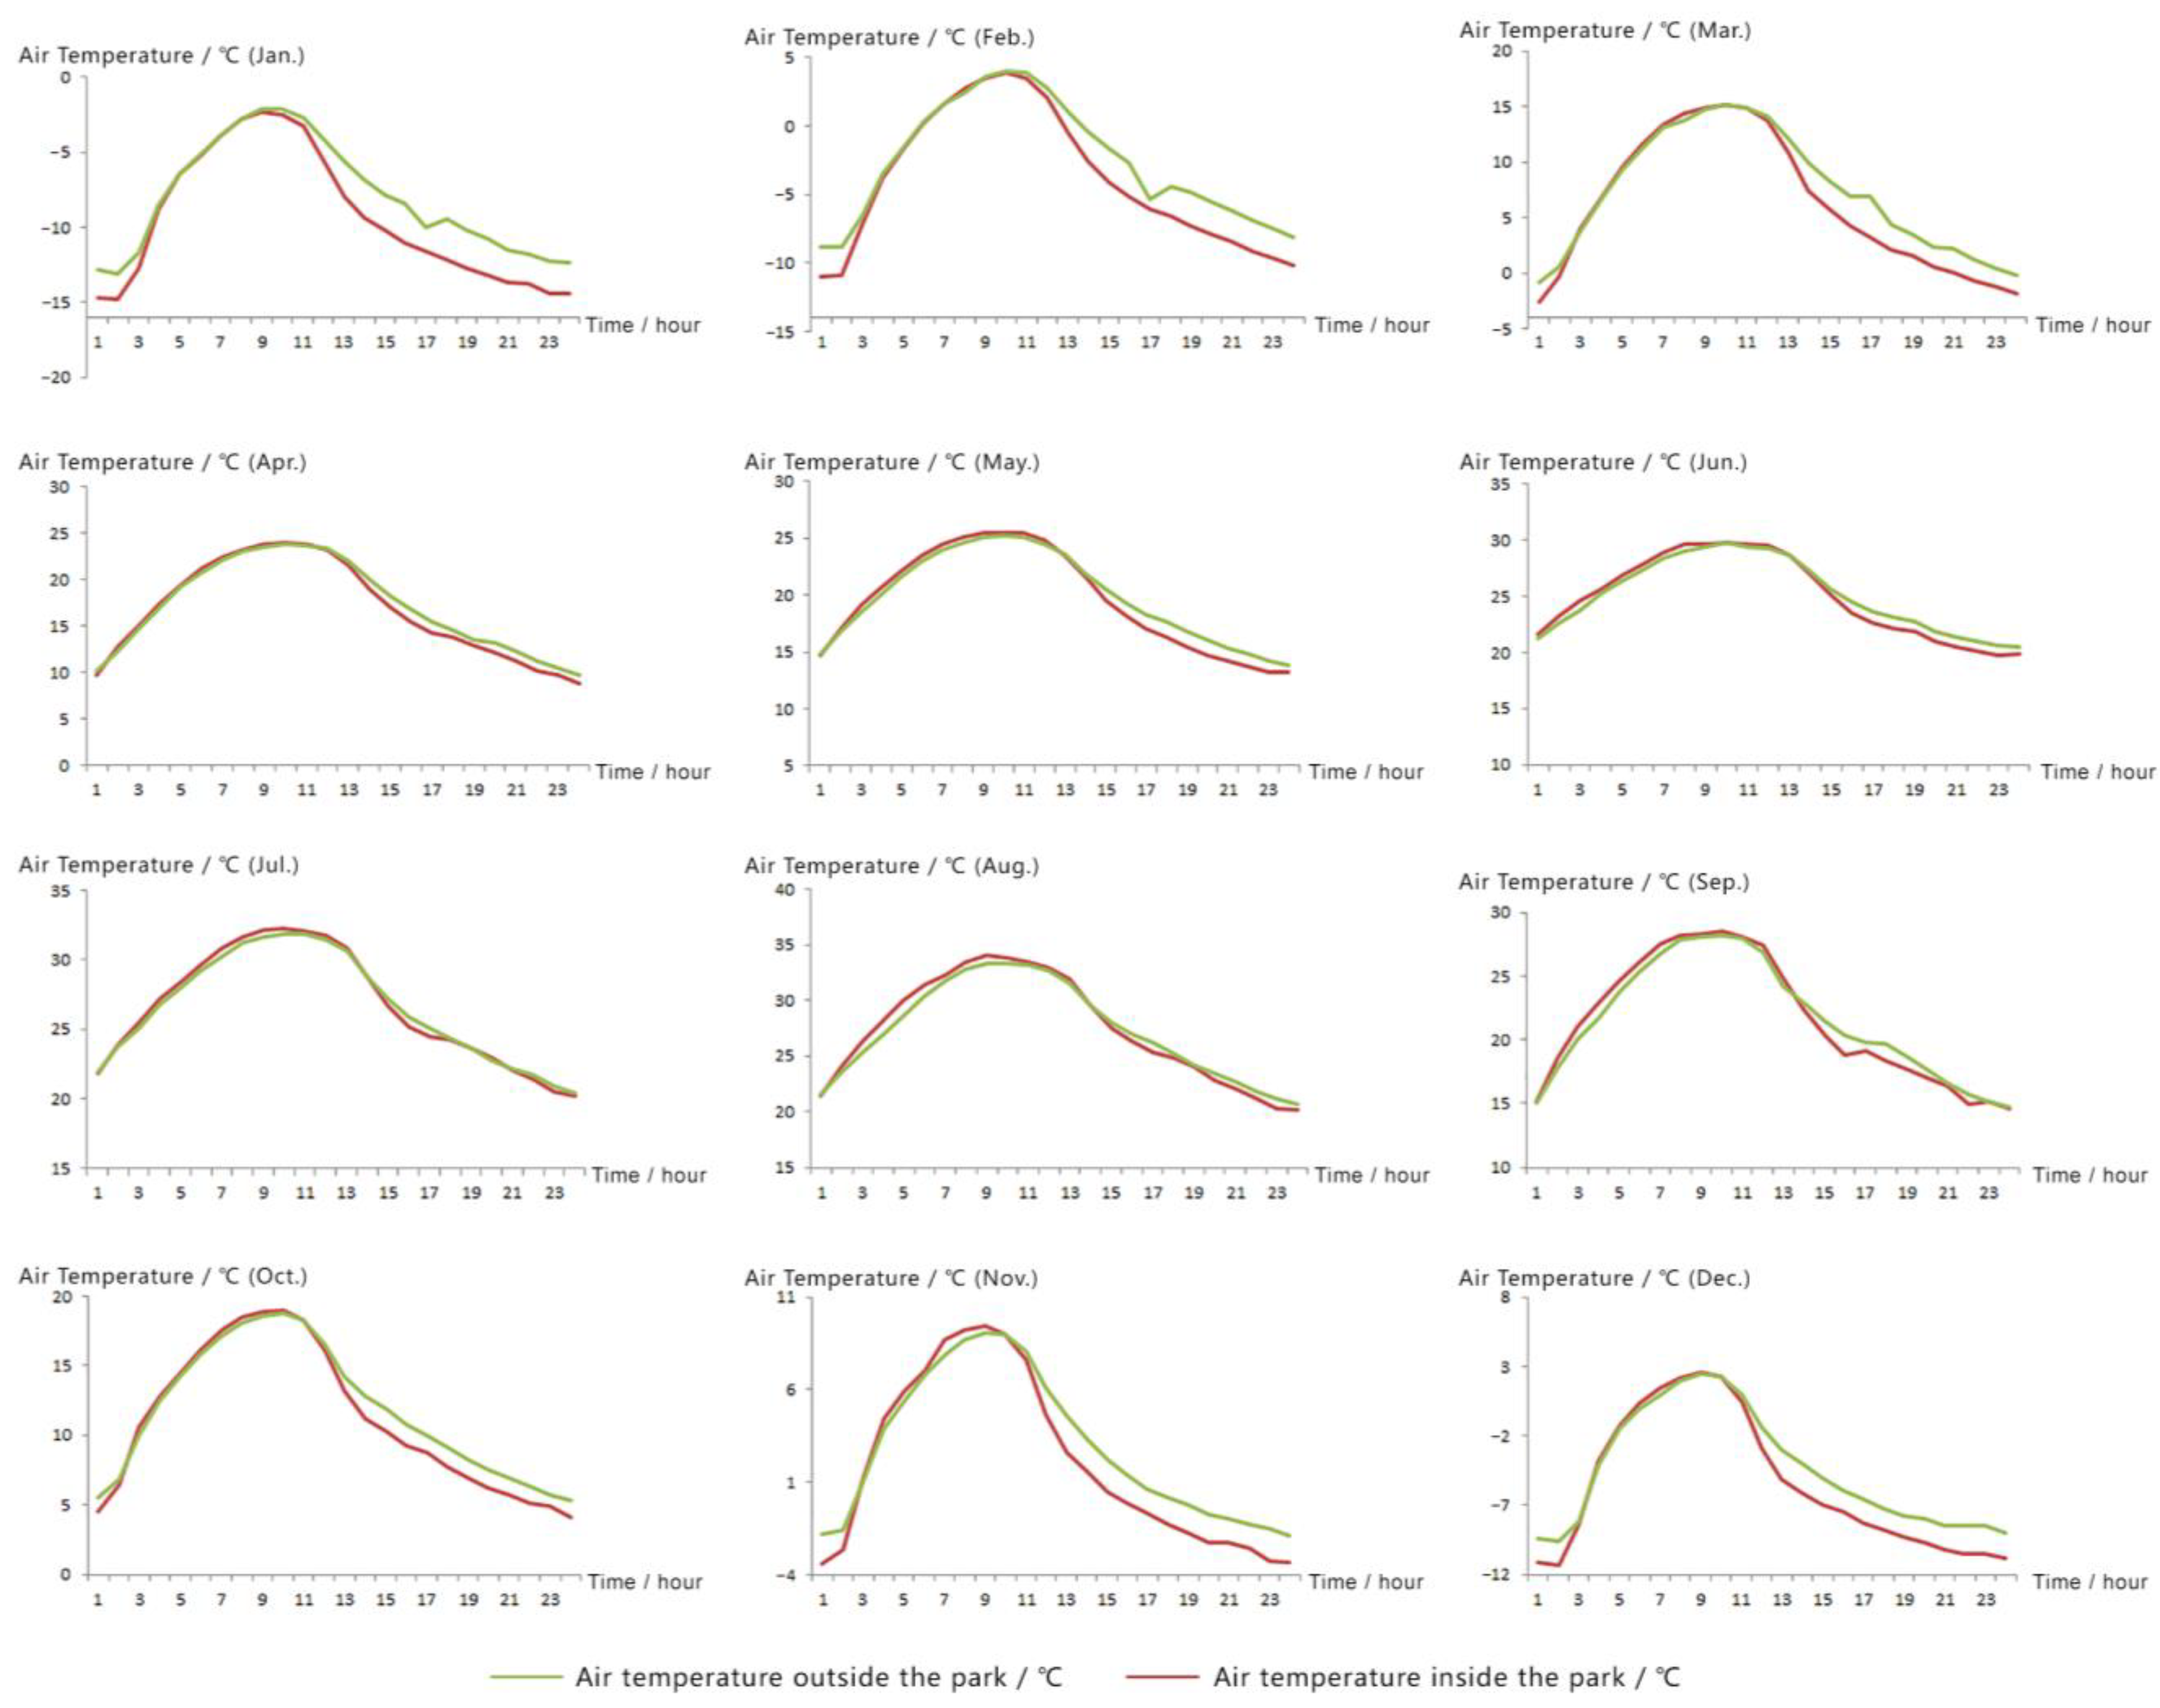
3.1.1. Diurnal, Monthly and Seasonal Variations of Air Temperature

According to the hourly data of the air temperature inside (MSIP) and outside (MSOP) the photovoltaic park throughout 2019, the average temperature at different times of all the days in a month, from January to December, were obtained (Figure 2). From dawn to noon, the temperatures inside and outside the PV park are basically the same, that is, Tinside ≈ Toutside. After noon and to early morning, the air temperature inside the park is significantly lower than outside the park, that is, Tinside < Toutside. After noon, as solar radiation reaches the maximum, the PV absorbs more solar radiation than the underlying surface due to being a darker color compared with the surrounding underlying surface. In addition, the photovoltaic panel converts a part of the solar energy into electrical energy. Therefore, the temperature inside the photovoltaic park is lower than that outside. After the sun sets, this phenomenon continues until the early morning of the next day and reaches the temperature equilibrium. The air temperature in the park does not drop immediately when the sun is rising, but gradually decreases after noon due to the photoelectric effect of the photovoltaic power station. Therefore, the photovoltaic power station has an impact on the air temperature of the surrounding environment, which is not only an energy sink, but also a cold source.
Regarding the monthly variation of the air temperature inside and outside the photovoltaic power station, as shown in Table 1, the air temperature inside the station is usually lower than that of the outside, except for in July and August. For the whole year, the temperature inside the station is lower than that outside. The absolute value of the average temperature difference between the inside and outside of the park gradually decreased from January, and then reached the minimum value (0.01) in September, after which it increased gradually. The maximum absolute value of ΔT is 1.45 °C in January, whereas the minimum values are in July, August and September when the radiation resources are relatively better and the air temperature is relatively higher; thus, the photovoltaic power station has little effect on the local air temperature. This may be because the higher temperature could lead to a stronger negative temperature effect. Because the increase in panel temperature leads to a decrease in the photovoltaic output, and the reduced output becomes heat energy, this increases the air temperature inside the photovoltaic park and reduces the temperature difference between the inside and outside of the park. The relative error percentage of the average temperature inside and outside the park was larger in winter (November, December, January) and early spring than other periods, and reached the maximum value of 50.2% in February. As shown in Table 2, in summer, the temperature difference between inside and outside the park is 0, whereas in winter the difference is the largest, and the relative error percentage between inside and outside the park is also the highest (25.39%). This may be due to the fact that the air temperature and the panel temperature are relatively low in winter, resulting in an insignificant negative temperature effect which may contribute to the higher output efficiency of PV as more electricity is converted from solar radiation. According to energy conservation law, the temperature inside the photovoltaic park is lower than outside the park. Therefore, the cold-source effect of photovoltaic panels is particularly obvious in winter, but not in summer.

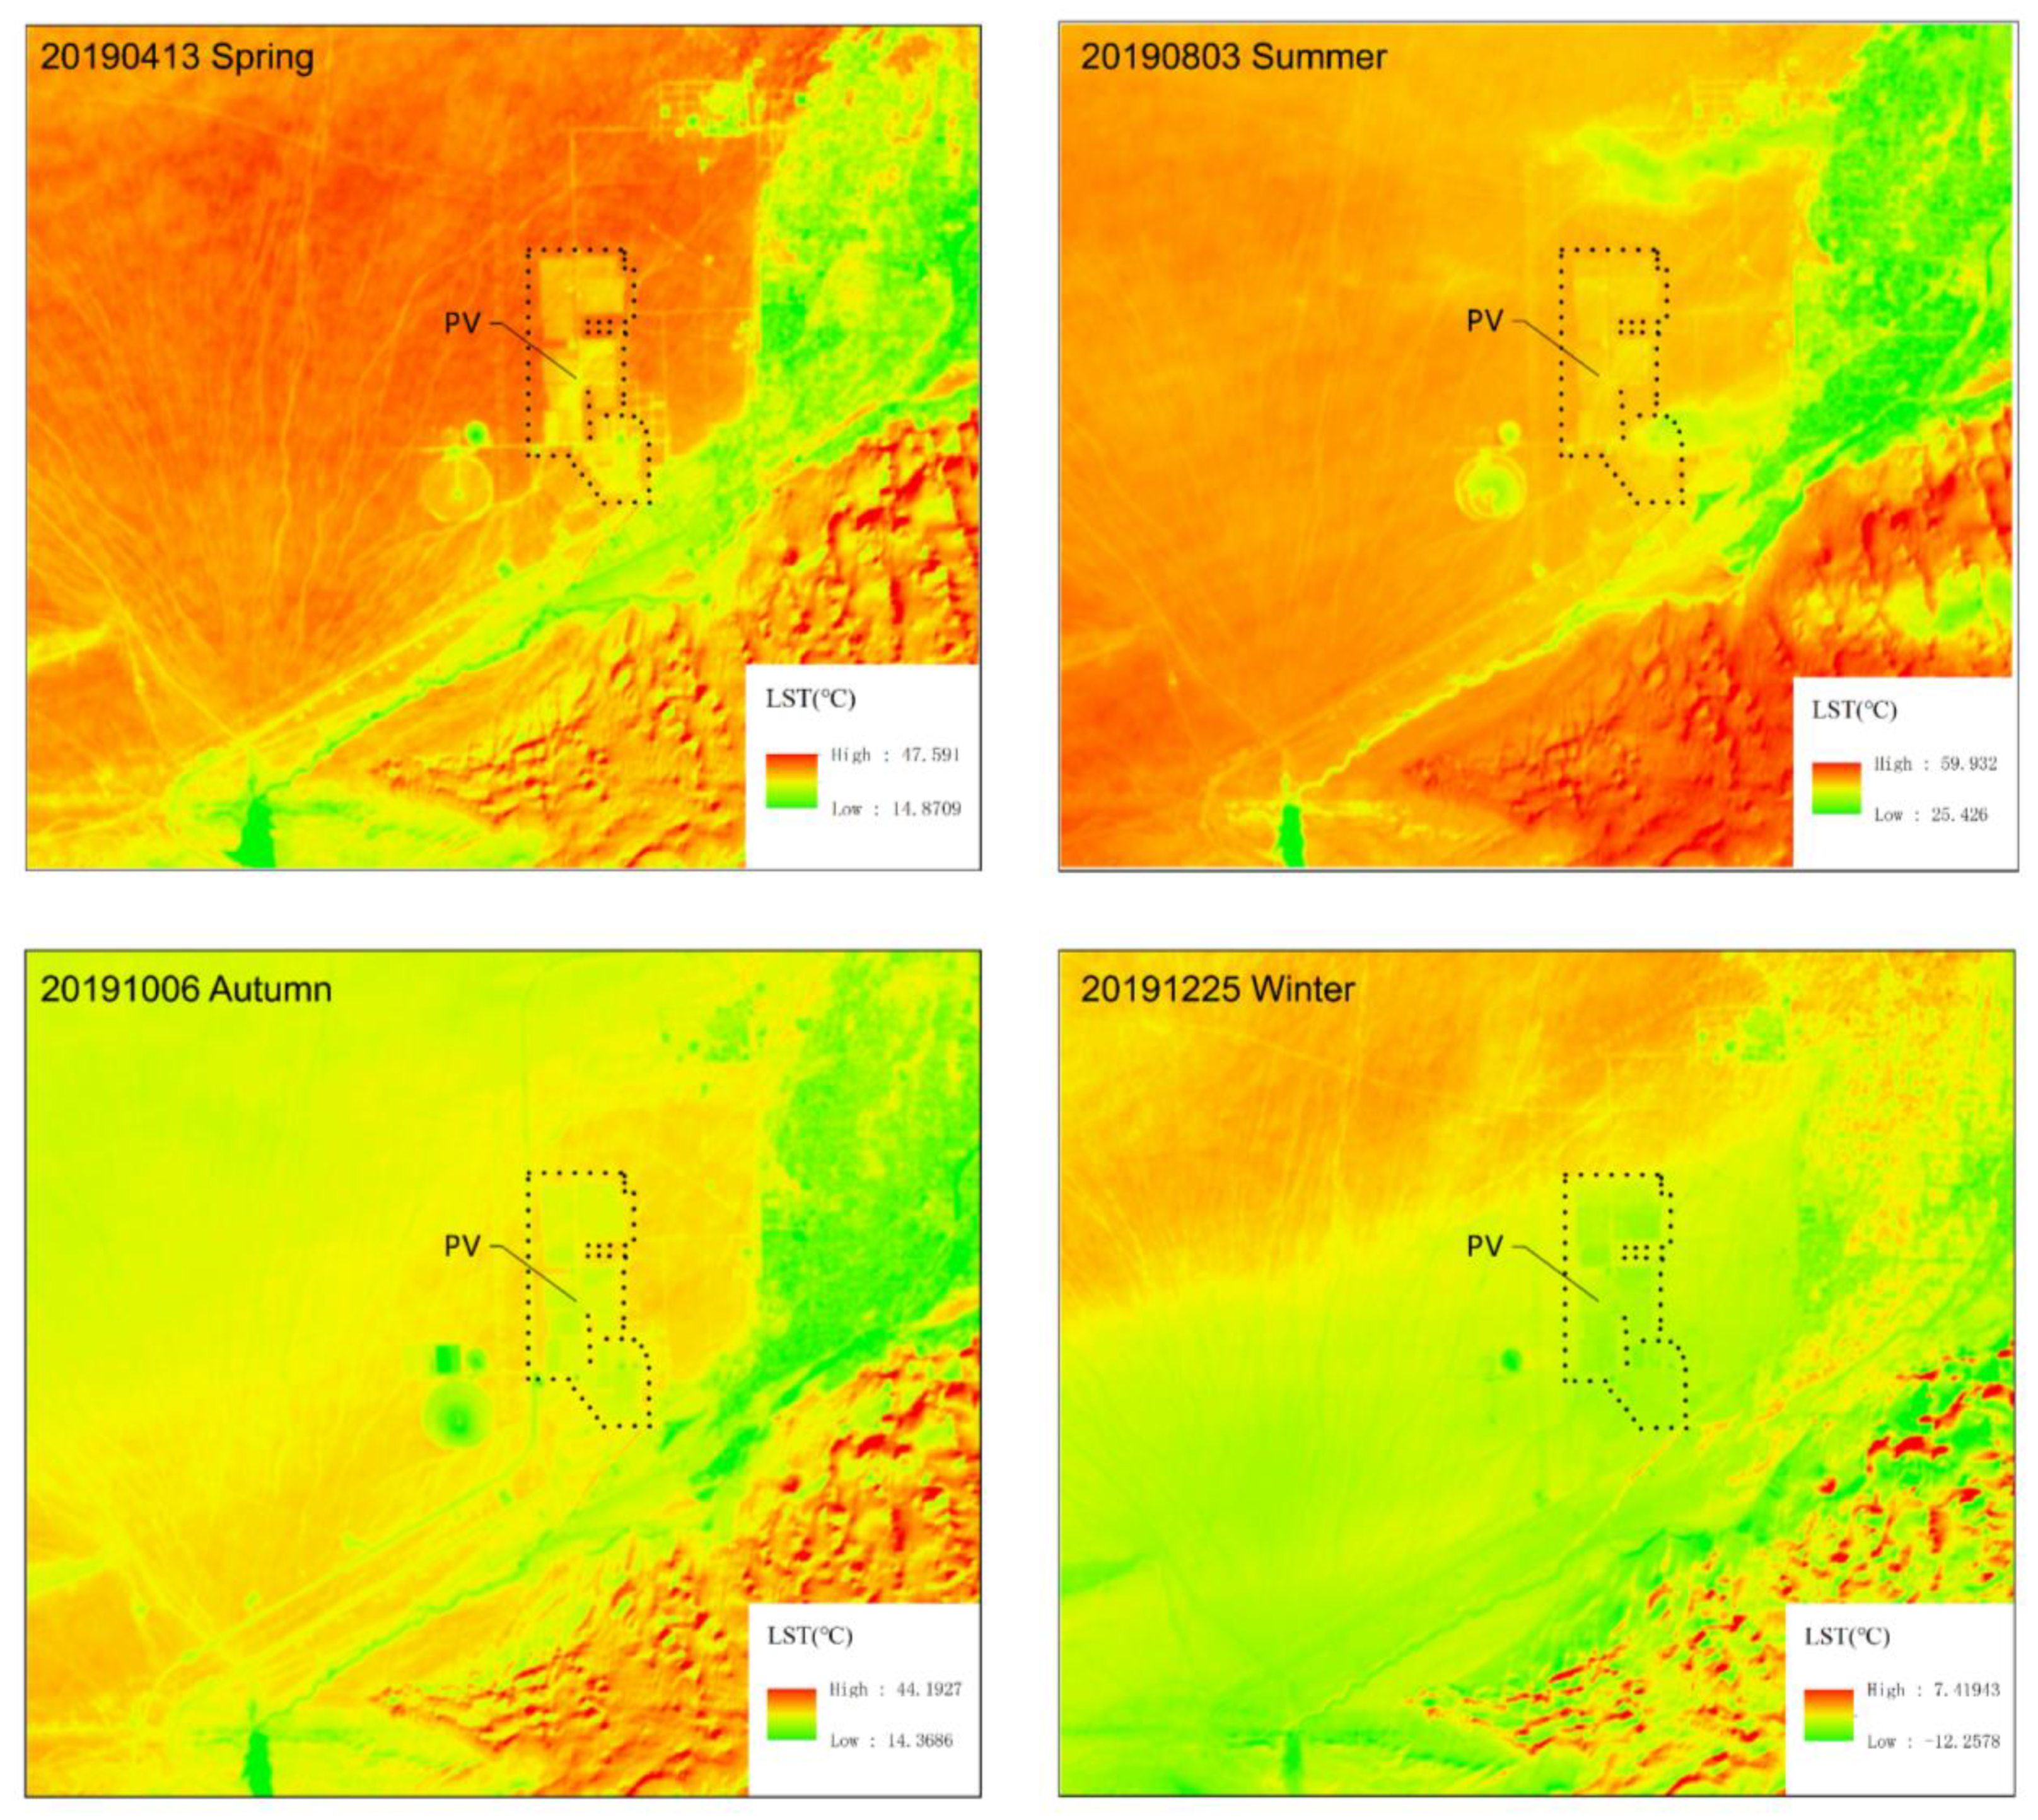
3.1.2. Surface Temperature
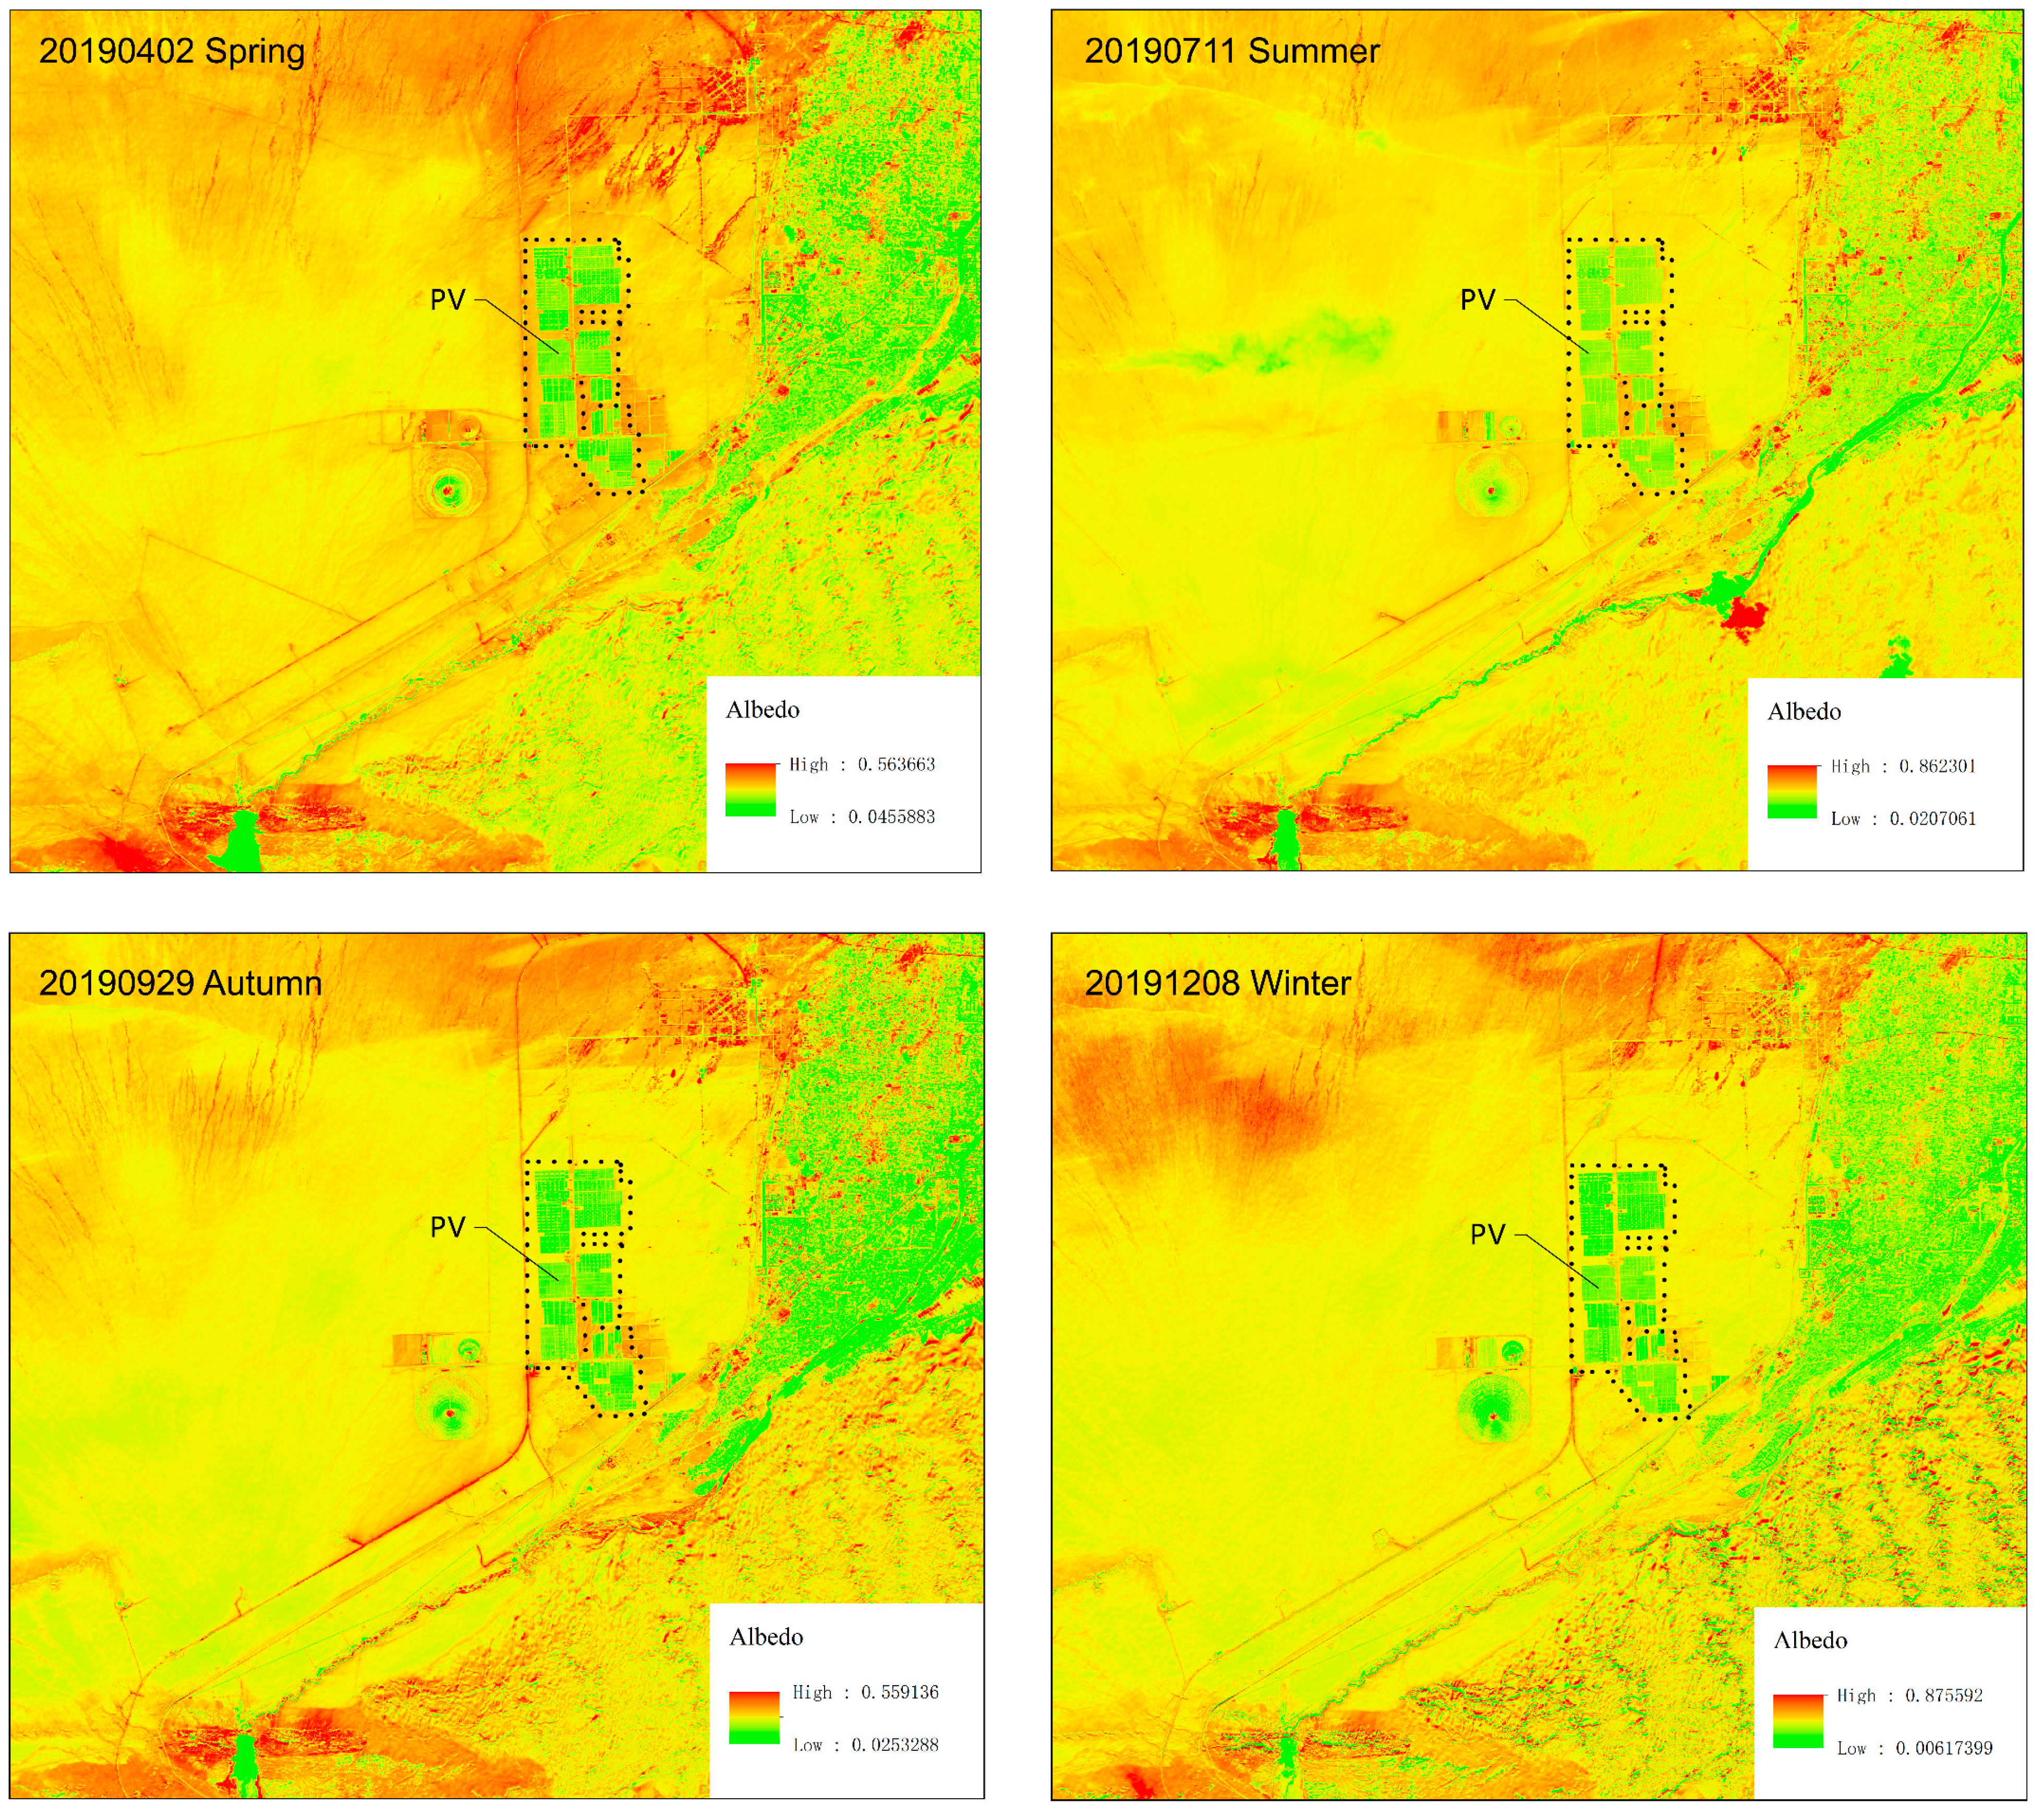
The surface temperatures are the PV surface temperature inside and land surface temperature outside the park, which is also an important parameter reflecting the impact of photovoltaic power plants on the local climate. The spatial distribution of surface temperature retrieved from remote sensing images is shown in Figure 3. Photovoltaic panels absorb solar radiation and convert solar energy into electrical energy output, resulting in the surface temperature inside the photovoltaic park being lower than outside the park all year round, which is similar to the air temperature inside and outside the park in winter.
In addition, the impact of photovoltaic power stations on the surface temperature is greater than that on the air temperature, because the air temperature is the heat energy of the sun absorbed by the ground and transferred to the air through radiation, conduction and convection. The surface temperature is generally higher than the air temperature, which can directly reflect the effect of solar radiation on the temperature of the underlying surface. The difference and relative error percentage of the surface temperature inside and outside the park are also the largest in winter and the smallest in summer (Table 3). This is consistent with the comparison results of the air temperature inside and outside the park. The negative temperature effect of the photovoltaic panel is strong in summer and weak in winter; therefore, the inside and outside surface temperatures are closer in summer, and are far apart in winter. Inside and outside surface temperatures also reflect that the photovoltaic power station is a cold source and the effect is more intense in winter.

3.2. Albedo

Surface albedo is an important parameter of remote sensing inversion. It refers to the ratio of the reflected flux of the surface to the incident solar radiation, which determines how much radiation energy can be absorbed by the underlying surface. Therefore, the surface albedo, including the PV surface albedo inside and land surface albedo outside the park, is another important parameter in the study of surface energy balance. The spatial distribution of the surface albedo over the four seasons retrieved from the remote sensing images is shown in Figure 4. The albedo in the park is lower than that outside during the four seasons. That is to say, the proportion of solar radiation reflected inside the park to the total incident radiation is smaller than that outside, mainly because the absorption of solar radiation by the photovoltaic power station is greater than that by the underlying surface (Gobi) due to dark-colored, sunlight-absorbing PV panels [26]. The albedo inside and outside the park has obvious seasonal variation characteristics, and the albedo inside the park is lower than that outside throughout the year. The albedo inside and outside the park is larger in spring and summer and smaller in the other two seasons. The difference between the albedo inside and outside the park is the largest in winter and smallest in summer. The relative error percentage of the two is the smallest in summer and the largest in winter (Table 4).
This phenomenon may also be related to the small negative temperature effect of photovoltaic power plants in winter, where more energy is absorbed and converted. It may also be related to the local precipitation. As we all know, there is less precipitation and greater evaporation in Dunhuang throughout the year. In autumn and winter, the surface humidity increases and the albedo is smaller due to the lower temperature and slower evaporation.

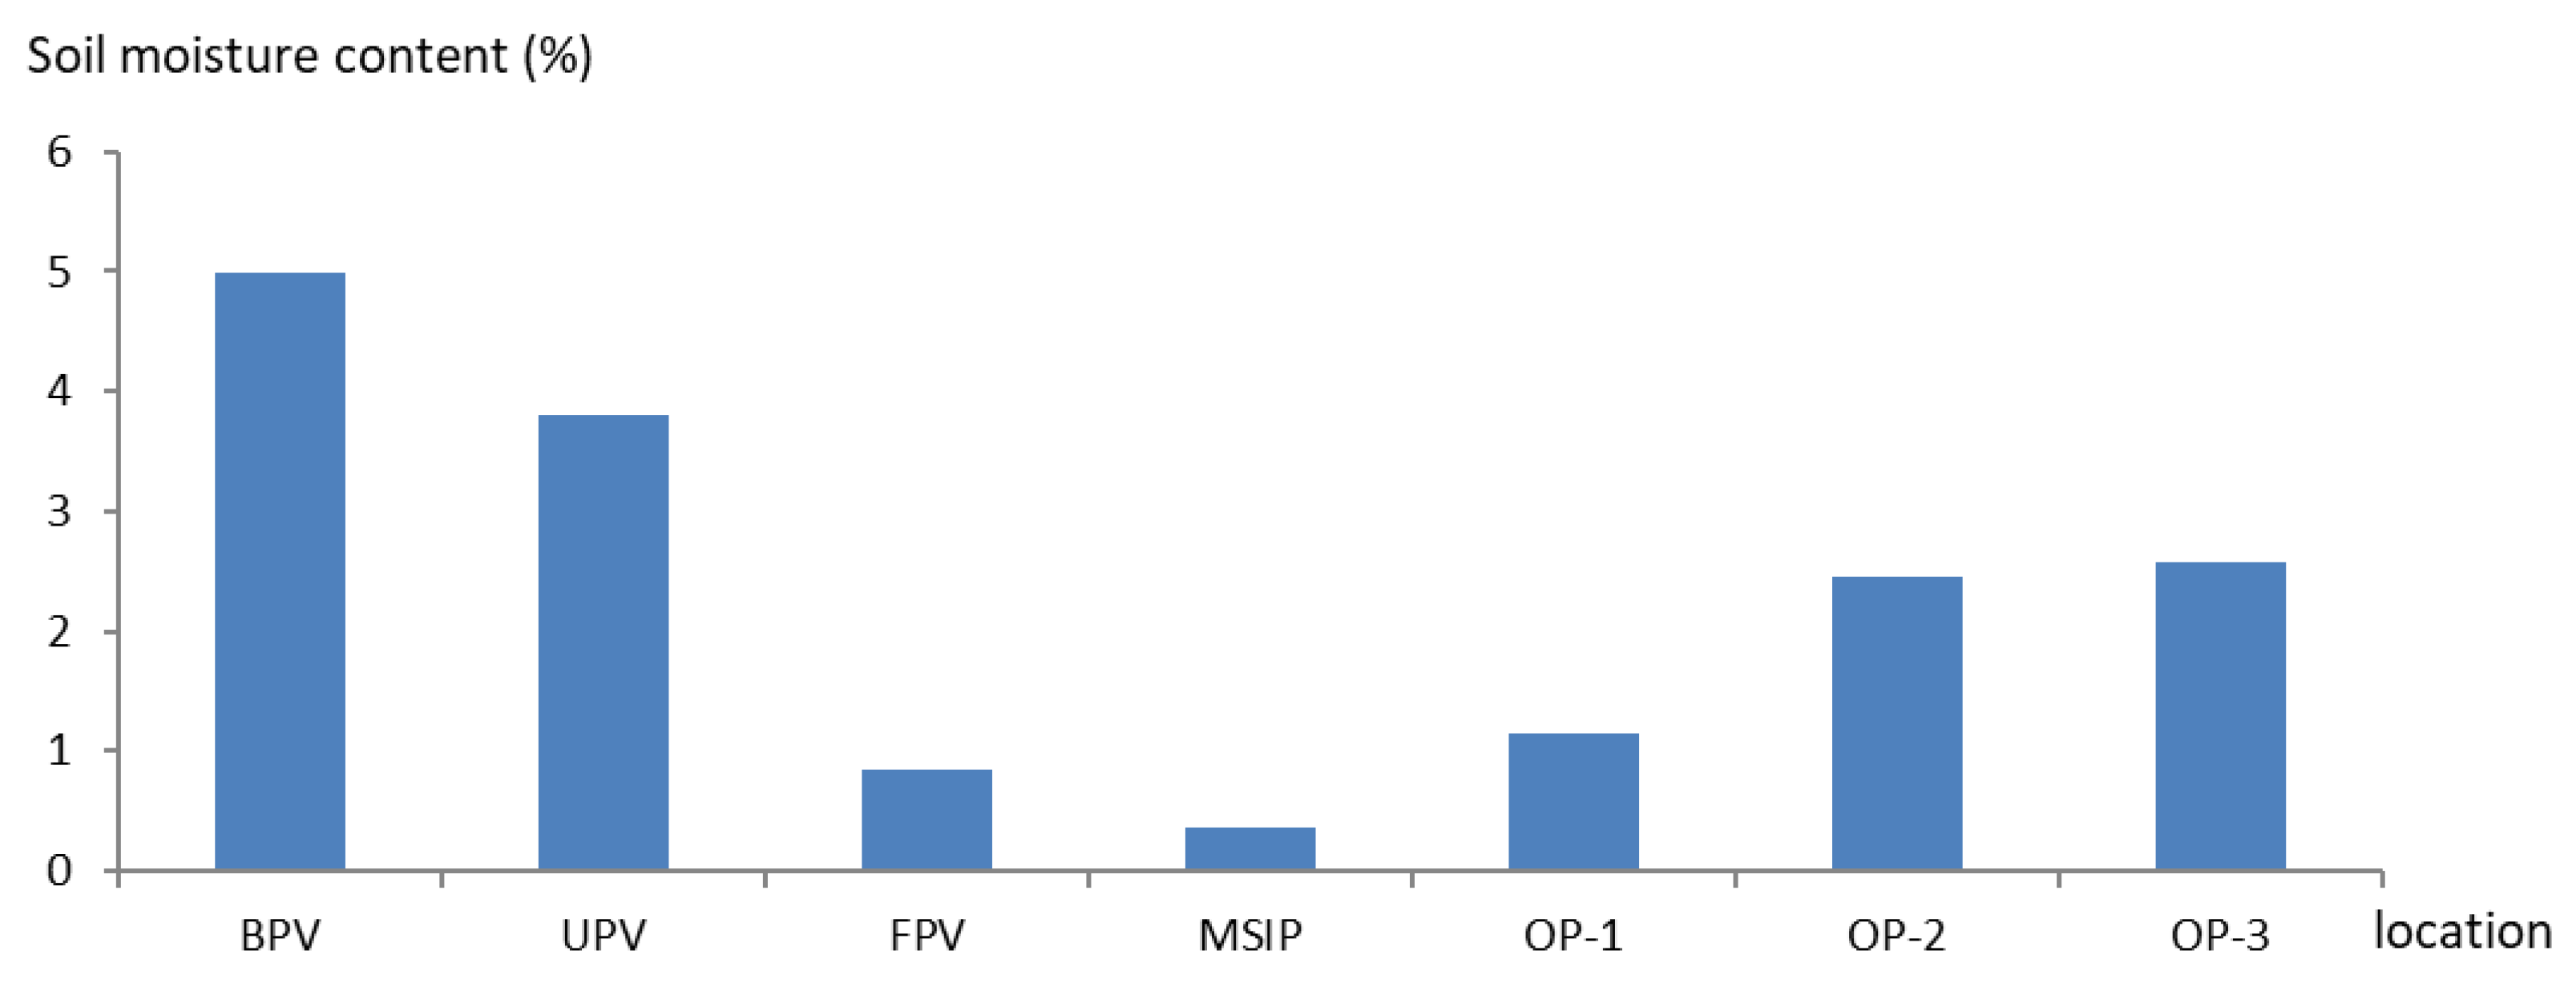
3.3. Soil Moisture Content

Soil moisture content reflects the moisture content in the soil. The construction of photovoltaic power plants affects soil moisture content by changing the local microclimate, especially by changing the process of surface evapotranspiration. In the study area, the overall soil moisture content is very low, less than 5% (Figure 5), which is caused by the special underlying surface (Gobi) of Dunhuang, where precipitation is scarce and there is no vegetation. Meanwhile, there are also differences in soil moisture content at different locations. The shading effect between photovoltaic modules and the modules themselves inhibits the evaporation of soil moisture; therefore, the soil moisture content is relatively high between photovoltaic modules and under the modules, but low values occur in front of the modules due to the absence of the shading effect (Figure 5).
The weather station in the park is located in the center of the photovoltaic park, far from the photovoltaic modules, thus the soil moisture content here is low. As the distance from the power station increases, the soil moisture content gradually increases, but it is still smaller than the soil moisture content between the arrays and under the modules, and the difference is obvious. Therefore, the photovoltaic power station has a significant impact on the moisture condition of the underlying surface.

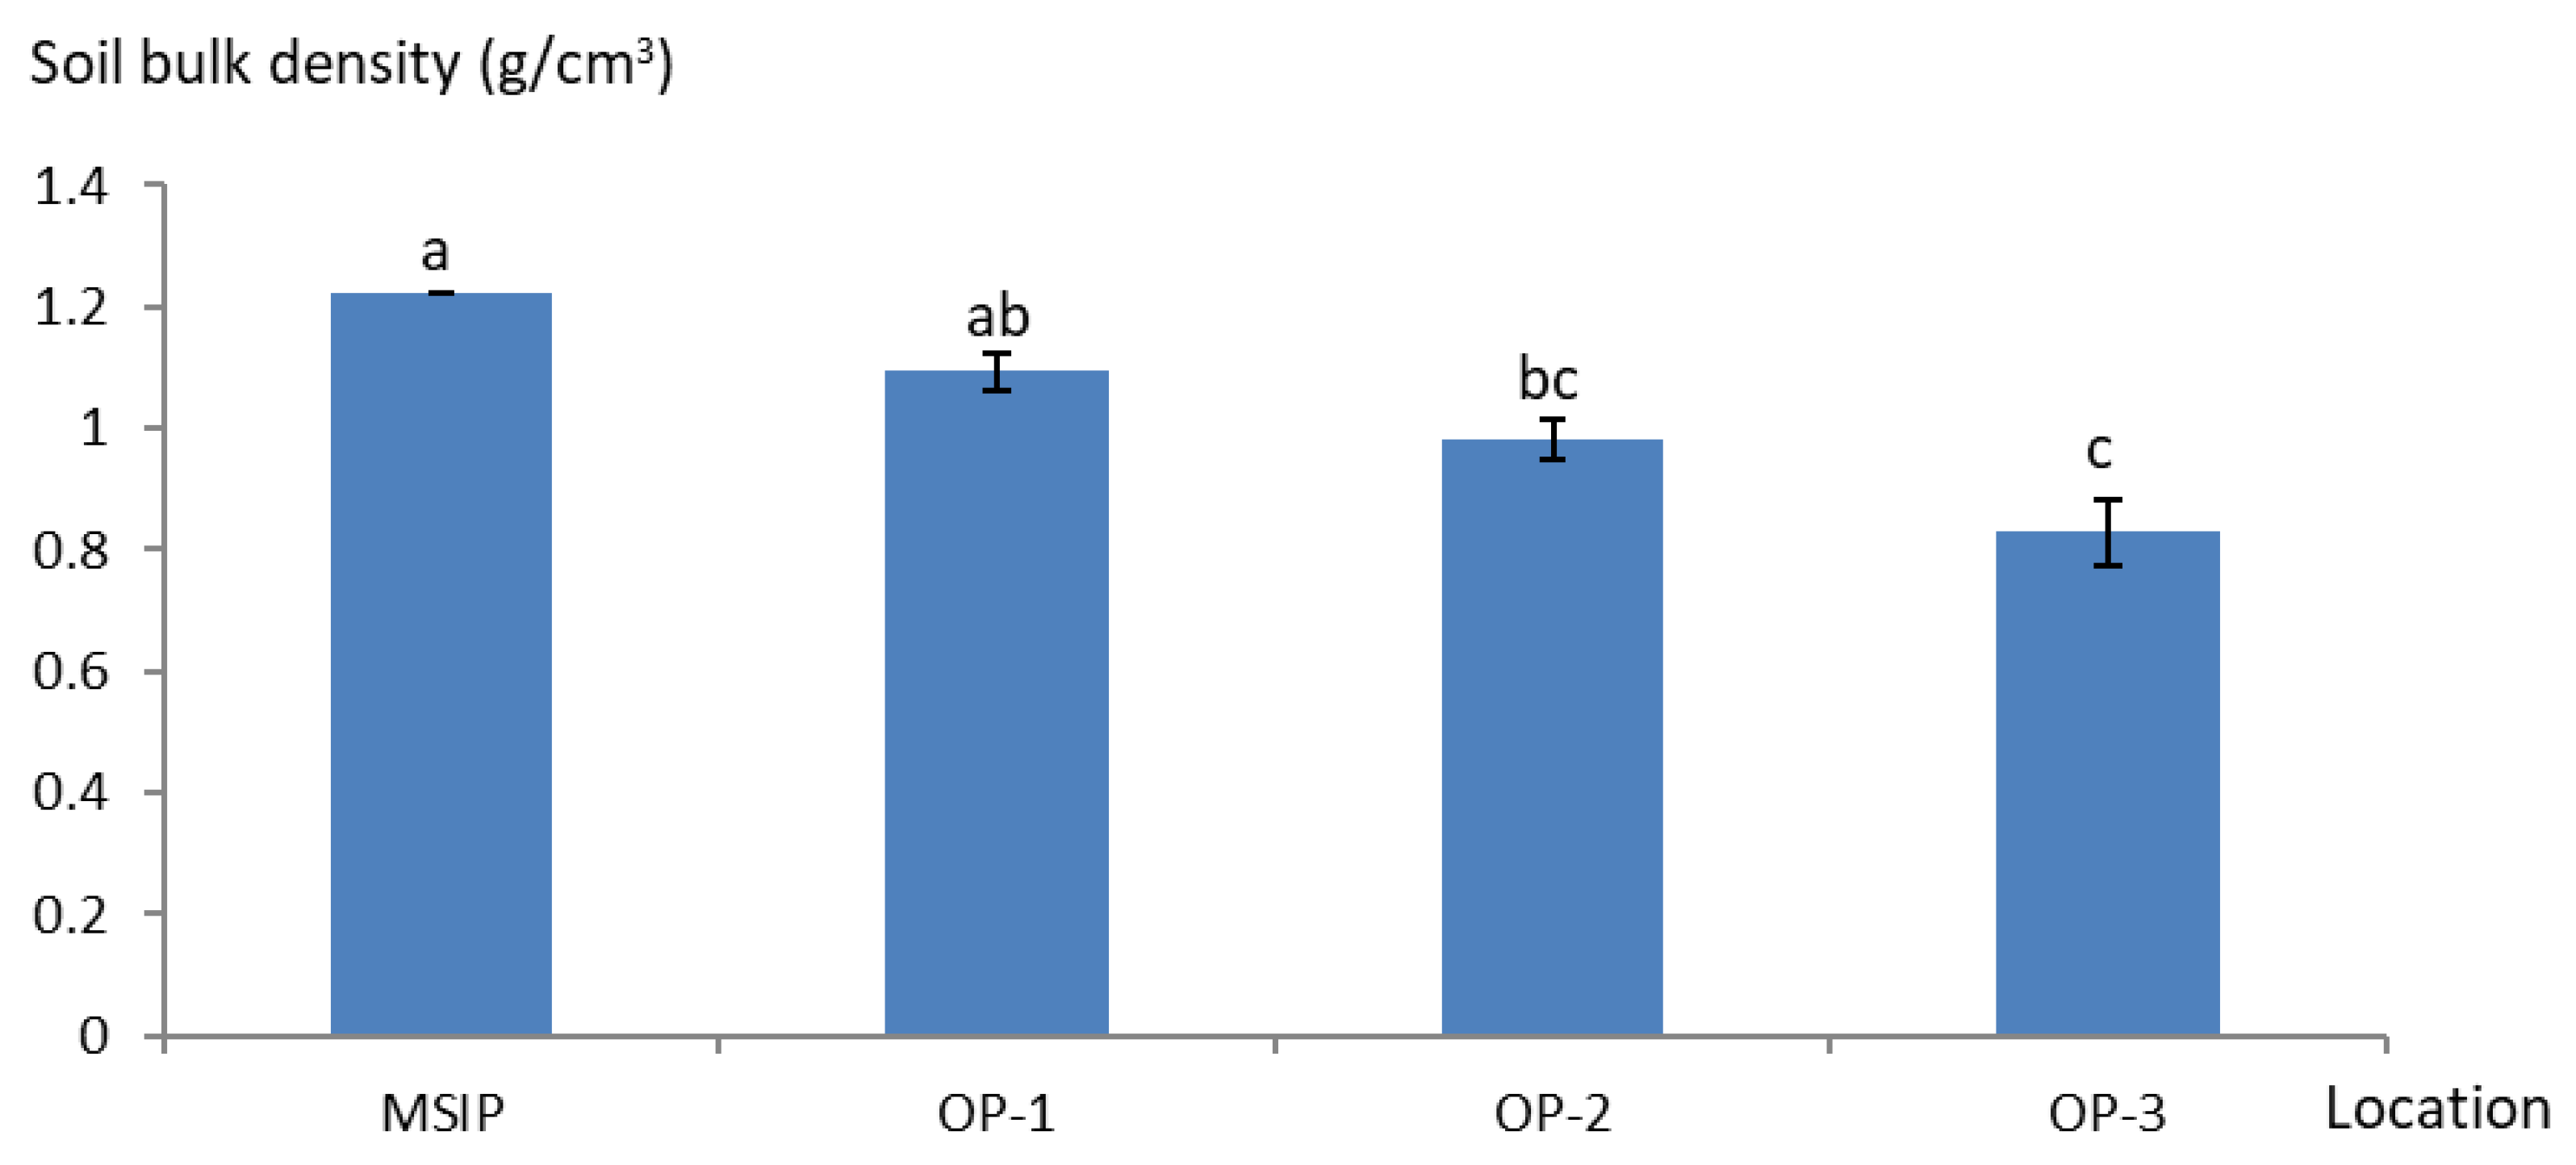
3.4. Soil Bulk Density

Soil bulk density refers to the mass or weight of a unit volume of soil (including soil particles and voids) in the state of natural bundling in the field (g/cm3). It is a comprehensive index of soil physical properties, and a comprehensive characterization of soil permeability, infiltration performance, water-holding performance, solute migration characteristics and soil erosion resistance [24]. Soil bulk density is mostly 1.0–1.5 g/cm3. The value of bulk density is affected by both density and voids, and voids have a greater impact, as the bulk density of loose and porous soil is small, and vice versa.
In general, the soil bulk density value in the study area is relatively small (Figure 6), which is related to the arid area environment. The soil in this area has the characteristics of large surface evaporation, weak water holding capacity, poor wind erosion resistance and large soil porosity. This may be due to the increase in human disturbance factors such as stepping during the construction and the later operation and maintenance of the photovoltaic power station, which leads to an increase in the compactness of the soil. The soil bulk density tends to decrease gradually.
In addition, the results of a one-way ANOVA showed that the difference between the two adjacent sample points was not significant, whereas the difference between the MSIP and OP3 was the most significant (p < 0.05), which also conforms to the basic rules. This is also in line with the law that the farther away from the park, the smaller the human disturbance factor and the larger the soil void. Therefore, the soil bulk density at the farthest point outside the park is the smallest. Then, it is concluded that the construction of photovoltaic power stations has a significant impact on soil bulk density.

4. Conclusions and Discussion

Since photovoltaic panels absorb solar radiation and convert solar energy into electrical energy output, according to energy conservation law, the air temperature and surface temperature inside the photovoltaic park are lower than those outside, which is consistent with [9,10,11,12,13] and Chang’s studies [27]; however, in Chang’s study, he found the maximum decreased temperature can arrive at 1 °C in January and 2 °C in July, which is contrary to our findings that the cold-source effect of the photovoltaic power station is more intense in winter but gentle in summer. This may be related to the negative temperature effect of photovoltaic panels, which is more obvious in summer than in winter.
In terms of albedo, the albedo in the park is lower than that outside all year round, which complies with the studies from [5,9,15,16,17]. This is because the absorption of solar radiation by the photovoltaic power station is greater than that of the underlying surface (Gobi), and the difference between the albedo inside and outside the park is the smallest in summer and the largest in winter, which is consistent with the changes in air temperature and surface temperature.
In addition, the soil moisture contents of the photovoltaic power station and its surroundings are generally low. Soil moisture content is relatively higher between the photovoltaic arrays and under the modules, but a lower value occurs in front of the arrays. At the sampling points farther away from the arrays, the soil moisture content is lower than that of the photovoltaic panel area, which is in accordance with Wang Zhenyi’s study [20], in which shading is considered as a dominant factor. Thus, it can be concluded that the photovoltaic power station does have an impact on the soil moisture content due to its shading effect. Therefore, the photovoltaic power station has a cooling and humidifying effect on the local microclimate.
As the distance from the center of the photovoltaic park becomes farther and farther, the soil bulk density shows a trend of gradually decreasing, because the farther away from the photovoltaic power station, the less human disturbance factors there are. Therefore, the photovoltaic power station also has an impact on the soil bulk density.
The results demonstrate that desert photovoltaic power plants do have an impact on the local climate and environment, which should be fully considered during future construction planning to ensure that photovoltaic power stations provide sustainable green energy for human beings without causing harm to the environment.
Referring to the limitations of the research, the paper only analyzed the meteorological and remote sensing data from one year (2019), and only two meteorological stations inside and outside the PV plant were selected as sampling points. On the other hand, due to funding constraints, other climate and soil parameters, such as solar radiation, precipitation, soil temperature, etc., were not discussed in this paper. A future study will focus on the impact of the PV plant on local climate and environment during a relatively long period, in which various data from more meteorological stations inside and outside the PV plant constructed in different environments (desert and places with vegetation) will be observed and the models will be built to explore deeper mechanisms.

Author Contributions

Conceptualization and methodology, Y.H. and L.C.; software, J.C.; formal analysis, Y.H.; investigation, Y.H. and L.C.; resources, J.C.; data curation, Y.H.; writing—original draft preparation, Y.H.; writing—review and editing, J.C.; visualization, J.C.; supervision, P.L.; project administration, Y.H.; funding acquisition, Y.H. All authors have read and agreed to the published version of the manuscript.

Funding

This research was funded by the Key Research and Development Projects of Gansu Natural Energy Research Institute, 2019YF-03.

Institutional Review Board Statement

Not applicable.

Informed Consent Statement

Not applicable.

Data Availability Statement

The remote sensing images were obtained from the USGS (https://earthexplorer.usgs.gov/ (accessed on 20 December 2021)).

Conflicts of Interest

The authors declare no conflict of interest.

References

  1. Hua, Y.P.; Oliphant, M.; Hu, E.J. Development of renewable energy in Australia and China: A comparison of policies and status. J. Renew. Energy 2016, 85, 1044–1051. [Google Scholar] [CrossRef]
  2. Renewable Energy Policy Network for the 21st Century (REN21). Renewables 2021 Global Status Report. Available online: https://www.ren21.net/wp-content/uploads/2019/05/GSR2021_Full_Report.pdf (accessed on 16 March 2022).
  3. Li, P.D.; Gao, X.Q. The impact of photovoltaic power plants on ecological environment and climate: A literature review. J. Plateau Meteorol. 2021, 40, 702–710. [Google Scholar] [CrossRef]
  4. Barron-Gafford, G.; Minor, R.; Allen, N.; Cronin, A.; Brooks, A.; Pavao-Zuckerman, M. The Photovoltaic Heat Island Effect: Larger solar power plants increase local temperatures. J. Sci. Rep. 2016, 6, 35070. [Google Scholar] [CrossRef] [PubMed] [Green Version]
  5. Millstein, D.; Menon, S. Regional climate consequences of large-scale cool roof and photovoltaic array deployment. J. Environ. Res. Lett. 2011, 6, 034001. [Google Scholar] [CrossRef]
  6. Fthenakis, V.; Yu, Y. Analysis of the potential for a heat island effect in large solar farms. In Proceedings of the IEEE 40th Photovoltaic Specialists Conference, Denver, CO, USA, 8 June 2014. [Google Scholar]
  7. Broadbent, A.M.; Krayenhoff, E.S.; Georgescu, M.; Sailor, D.J. The observed effects of utility-scale photovoltaics on near-surface air temperature and energy balance. J. Appl. Meteorol. Climatol. 2019, 58, 989–1006. [Google Scholar] [CrossRef]
  8. Zhao, P.Y.; Gao, Y.; Chen, X. Research on Influence of Desert Photovoltaic Power Station on Air Temperature and Humidity. J. West. Resour. 2016, 3, 4. (In Chinese) [Google Scholar]
  9. Chang, R.; Shen, Y.; Luo, Y.; Wang, B.; Yang, Z.; Guo, P. Observed surface radiation and temperature impacts from the large-scale deployment of photovoltaics in the barren area of Gonghe, China. J. Renew. Energy 2018, 118, 131–137. [Google Scholar] [CrossRef]
  10. Taha, H. The potential for air-temperature impact from large-scale deployment of solar photovoltaic arrays in urban areas. J. Sol. Energy 2013, 91, 358–367. [Google Scholar] [CrossRef]
  11. Salamanca, F.; Georgescu, M.; Mahalov, A.; Moustaoui, M.; Martilli, A. Citywide impacts of cool roof and rooftop solar photovoltaic deployment on near-surface air temperature and cooling energy demand. J. Bound.-Layer Meteorol. 2016, 161, 203–221. [Google Scholar] [CrossRef] [Green Version]
  12. Masson, V.; Bonhomme, M.; Salagnac, J.; Briottet, X.; Lemonsu, A. Solar panels reduce both global warming and urban heat island. J. Front. Environ. Sci. 2014, 2, 14. [Google Scholar] [CrossRef]
  13. Lu, X.; Zhang, M.Q.; Qiao, S. Analysis of Environmental Effects of Photovoltaic Power Station Construction in Gobi Area. Master’s Thesis, Lanzhou University, Lanzhou, China, 2013. Available online: https://kns.cnki.net/kcms/detail/detail.aspx?dbcode=CMFD&dbname=CMFD201302&filename=1013237744.nh&uniplatform=NZKPT&v=8Av73w4juY05EqYB6-H3BUls-Yok-DmzyTrpYB_ygQyittsNOEKzoZyxyjMIro4- (accessed on 12 June 2022).
  14. Gao, X.Q.; Yang, L.W.; Lv, F.; Ma, L.Y.; Li, H.L.; Hui, X.Y.; Hou, X.H. Observational study on the impact of the large solar farm on air temperature and humidity in desert area of Golmud. J. Acta Energ. Sol. Sin. 2016, 37, 2909–2915. [Google Scholar]
  15. Yang, L.W.; Gao, X.Q.; Lv, F.; Hui, X.Y.; Ma, L.Y.; Hou, X.H.; Li, H.L. Influence of photovoltaic power station on solar radiation field in desert area of Golmud. J. Acta Energ. Sol. Sin. 2015, 36, 2160–2166. [Google Scholar] [CrossRef]
  16. Li, S.; Weigand, J.; Ganguly, S. The potential for climate impact from widespread deployment of utility-scale solar energy installations: An environmental remote sensing perspective. J. J. Remote Sens. GIS 2017, 6, 1000190. [Google Scholar] [CrossRef]
  17. Li, Y.; Kalnay, E.; Motesharrei, S.; Rivas, J.; Kucharski, F.; Kirk-Davidoff, D.; Bach, E.; Zeng, N. Climate model shows large-scale wind and solar farms in the Sahara increase rain and vegetation. J. Sci. 2018, 361, 1019–1022. [Google Scholar] [CrossRef] [Green Version]
  18. Gao, X.Q.; Yang, L.W.; Lv, F.; Ma, L.Y.; Hui, X.Y.; Hou, X.H.; Li, H.L. Observational research on the effect of photovoltaic power station on air temperature and humidity in desert area of Golmud. J. Acta Energ. Sol. Sin. 2016, 37, 1339–1445. [Google Scholar] [CrossRef]
  19. Wang, T. Research on the Influence of Photovoltaic Power Station Construction on Soil and Vegetation in Jingbian County. Master’s Thesis, Northwest A&F University, Yangling, China, 2015. Available online: https://kns.cnki.net/kcms/detail/detail.aspx?dbcode=CMFD&dbname=CMFD201601&filename=1015329905.nh&uniplatform=NZKPT&v=y8MkYTPmQca8ymU07QVGAu2IeHxUK3TjL-VQA_DU4R19mQYORQGZUiKyZLAj8FlU (accessed on 7 May 2022).
  20. Wang, Z.Y.; Wang, J.; Gao, Y.; Dang, X.H.; Meng, Z.J. Impacts of photovoltaic power station construction on ecology environment in sandy area. J. Bull. Soil Water Conserv. 2019, 39, 191–196. [Google Scholar] [CrossRef]
  21. Liu, P.X.; Zhang, R.; Wu, S.X. Study on the characteristics of climate change in Dunhuang oasis in recent 54 years. J. Arid Land Resour. Environ. 2010, 24, 98–102. [Google Scholar] [CrossRef]
  22. Chen, X.H. Analysis on the characteristics of arid climate in Dunhuang City, Gansu Province. J. Beijing Agric. 2015, 29, 141–142. [Google Scholar] [CrossRef]
  23. Dunhuang Municipal People’s Government. Overview of Dunhuang. Available online: http://www.dunhuang.gov.cn/dunhuang/dh10/common_index_list.shtml (accessed on 22 February 2022).
  24. Huang, C.Y.; Xu, J.M. Soil Science, 3rd ed.; China Agricultural Press: Beijing, China, 2012; p. 25. [Google Scholar]
  25. Chen, L.; Ma, S.Y.; Shang, L.P.; Ding, A.J.; Teng, Z.Y. Effects of wind farm on surface soil in desert steppe, China. J. E3S Web Conf. 2019, 131, 01030. [Google Scholar] [CrossRef]
  26. Nemet, G.F. Net radiative forcing from widespread deployment of photovoltaics. J. Environ. Sci. Technol. 2009, 43, 2173–2178. [Google Scholar] [CrossRef]
  27. Chang, R.; Luo, Y.; Zhu, R. Simulated local climatic impacts of large-scale photovoltaics over the barren area of Qinghai, China. J. Renew. Energy 2020, 145, 478–489. [Google Scholar] [CrossRef]
Figure 1. Satellite image of Dunhuang Photovoltaic Industrial Park.
Atmosphere 13 01235 g001
Figure 2. Air temperatures inside and outside of the photovoltaic park at different times of the year.
Atmosphere 13 01235 g002
Figure 3. Surface temperature of PV power station and surroundings retrieved from remote sensing in different seasons.
Atmosphere 13 01235 g003
Figure 4. Albedo of photovoltaic power station and surroundings retrieved from remote sensing inversion in four seasons.
Atmosphere 13 01235 g004
Figure 5. Soil moisture content at different locations of photovoltaic power station.
Atmosphere 13 01235 g005
Figure 6. Soil bulk density inside and outside the photovoltaic park.
Atmosphere 13 01235 g006
Table 1. Monthly average air temperature inside and outside the park (°C/%).
MonthJanFebMarAprMayJunJulAugSepOctNovDec
Tinside−9.48−3.946.1516.7719.5324.9526.5827.3821.4711.152.01−5.55
Toutside−8.03−2.627.2817.1719.8225.1226.5227.2721.4811.752.85−4.48
ΔT−1.45−1.32−1.14−0.41−0.30−0.160.060.11−0.01−0.60−0.83−1.07
RE18.1050.215.612.361.500.650.230.390.045.0829.2523.97
Table 2. Seasonal average air temperature inside and outside the park (°C/%).
SeasonSpringSummerFallWinter
Tinside14.1426.3011.55−6.32
Toutside14.7526.3012.03−5.04
ΔT−0.610.00−0.48−1.28
RE−4.150.00−3.9925.39
Table 3. Comparison of surface temperature inside and outside the park (°C/%).
SeasonSpringSummerAutumnWinter
Tinside35.3545.5527.64−5.66
Toutside36.3845.8928.34−5.027
ΔT−1.03−0.34−0.7−0.633
RE2.80.742.412.6
Table 4. Comparison of surface albedo inside and outside the park (%).
SeasonSpringSummerAutumnWinter
Albedoinside0.24710.2280.21050.2007
Albedooutside0.27380.24890.23660.2418
ΔAlbedo−0.0267−0.0209−0.0261−0.0411
RE9.758.411.0317
Publisher’s Note: MDPI stays neutral with regard to jurisdictional claims in published maps and institutional affiliations.

