Abstract
The change in the spatial distribution of agroclimatic conditions based on the sum of active temperatures (SAT), growing degree days (GDD), and latitude–temperature index (LTI) is discussed in this article. Data from 20 meteorological stations of IMGW-PIB (Institute of Meteorology and Water Management—National Research Institute) in Poland from the years 1966–2020 were used. The temporal and spatial diversity of mean air temperature and the chosen indices were analyzed for the period from April to October. Designating areas of diverse thermal conditions with respect to plant comfort on the basis of agroclimatic indices was attempted, together with mean air temperature and its temporal changes. The clustering, using the Ward’s method, yielded four regions with different thermal resources in Poland. The study period showed an increase in the values of all agroclimatic indices and air temperature during the growing season, suggesting an increase in the thermal resources in the territory of Poland.
1. Introduction
The observed and broadly discussed increase in air temperature [1] correlates with other features of climate and the environment, and is not without reaction both in natural and managed ecosystems at different levels, and by agriculture [2,3,4].
An increase in temperature also determines vegetation development. Thermal conditions are one of the environmental factors responsible for crop distribution [5,6,7]. Many plant and animal species expanded their ranges of occurrence toward the poles during the last century [8,9]. It should be emphasized, however, that the prolongation of the growing season may result in competitive relations between plants in various ecosystems [10]. The unfavorable effects of the prolongation of the growing season are also manifested in decreasing yields of some crops, among others, rice [11].
Most of the territory of Europe is expected to experience further northward migration of climatic zones. The changing climatic conditions affect agroclimatic resources. In the temperate zone, they can be the cause of limited growth of plants [12]. It is expected that some tree and forest species will expand their range (e.g., oak), and others (maple, beech, birch, spruce, fir) will experience range reductions [13,14]. Over the next several decades, the migration of agroclimatic zones in East Europe may reach double the rate observed in the period 1975–2016 [15]. Several Mediterranean regions may become unsuitable for cultivation of particular plants in favor of North Europe [15]. Considerable zonal and temporal changes in crops and cultivars co-occur with warmer growing seasons in Finland [16]. According to Ceglar et al. [15], potential benefits from the prolongation of the thermal growing season in North and East Europe are frequently balanced by the risk of late frosts, and an increased risk of hot days during early spring and summer.
A positive aspect of the prolongation and early start of warm seasons is the possibility of cultivating plants with higher thermal requirements, such as soy, sunflower, and maize. The occurring transformations allow for the introduction of viticulture [17]. During Poland’s growing season for the period 1966–2015, changes in thermal conditions (increase in mean air temperature and total air temperatures) were greater than those for precipitation conditions [18]. The transformed thermal resources imply ways of adaptation of agriculture to any possible environmental changes [3]. It is difficult to accurately predict the future state of the agroclimate and the resulting level of agricultural production, because irrespective of the global trends, the role of local conditions will be substantial [19].
Thermal resources are measured by agroclimatic indices such as the sum of active temperatures (SAT), growing degree days (GDD), and latitude–temperature index (LTI). They are variables closely related to plant development, and highly useful in agronomy. Knowledge of these indices and ongoing temperature monitoring throughout the season permit highly accurate planning for the optimal time of conducting particular agrotechnical treatments. GDD is used as a method to predict growth stages of main crops such as soy, maize, and wheat (in particular, temperate crops). It is also useful in undertaking safety measures against insects, pests, and diseases threatening the crops [12,20,21,22,23,24].
In climatological research, SAT is calculated based on meteorological data from a site at a height of 2 m above ground level. If SAT aims at the identification of conditions favorable for the life processes of plants, temperature should be determined for the “areas” of the environment where vegetation occurs. In the case of traditional crops, SAT should be determined in the air and soil at different depths (depending on the type of root system): in the case of aquatic plants—in air and water; in the case of epiphytes—in air and at a height typical of the plant [25].
Jackson and Schuster developed the latitude–temperature index (LTI) that considers the latitude of the region, and therefore day duration, which makes it more applicable, particularly in more marginal and more marine regions [26,27,28].
The main objective of this paper is to present and discuss the transformation of the spatial distribution of agroclimatic conditions based on the sum of active temperatures (SAT), growing degree days (GDD), and latitude–temperature index (LTI). The main research question addressed in this study is: How does contemporary warming impact the trends of the analyzed agroclimatic parameters? Lastly, designating areas of diverse thermal conditions with respect to plant comfort was attempted.
2. Materials and Methods
This paper employed meteorological data from 20 stations in Poland (Figure 1), belonging to the observation network of the Institute of Meteorology and Water Management—National Research Institute (IMGW-PIB), located below 400 m a.s.l.; i.e., mountain areas were excluded (https://danepubliczne.imgw.pl/, accessed on 1 March 2022). The analysis covered the period 1966–2020. The calculations were based on mean daily air temperature values measured at 2 m above ground level (a.g.l.) All the stations used in the study had a complete series of daily observations for the entire study period.
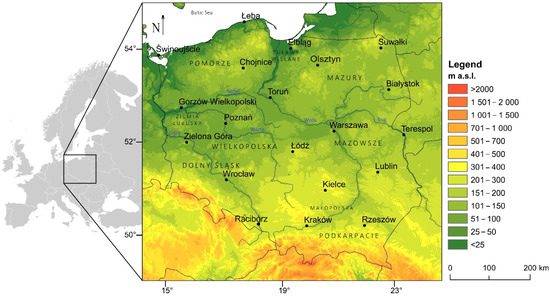
Figure 1.
Locations of the analyzed stations in Poland.
The first stage involved the analysis of the spatial distribution of mean temperature in the period from April to October for which agroclimatic indices were calculated along with the trend of its changes. The study employed three agroclimatic indices describing thermal conditions: SAT (sum of active temperatures), GDD (growing degree days), and LTI (latitude–temperature index).
SAT (sum of active temperatures), considered the most important thermal parameter in agroclimatology, is calculated as the sum of mean daily air temperature equal and higher than 10 °C in the period from 1 April to 31 October [29,30], in accordance with the following formula:
where:
- Td—mean daily air temperature, °C.
SAT is an index describing, among others, the demand for heat of various grapevine species. The mean sum of active temperatures below 2500 °C is unsuitable for cultivating grapevines. The best conditions are provided in the case of SAT of more than 2900 °C [31].
GDD (growing degree days) defines thermal resources by means of sums of active temperatures describing the amount of heat energy supplied during a given time [32,33,34,35] in accordance with the formula:
where:
- Td—mean daily air temperature, °C;
- Tbase—threshold air temperature, °C.
GDD is defined as the accumulated sum of degrees above a specified reference temperature [36]. It is a commonly applied agroclimatic index for the determination of the amount of energy needed for obtaining particular development stages of crops, terms of optimal sawing and harvests [37,38], and threat of the occurrence of pests [39,40]. The GDD variable is counted from the so-called physiological zero temperature (also called thermal threshold), individual for each plant, i.e., from the start of its growing period. The lowest threshold is recorded for winter crops (0–4 °C), and the highest for extremely thermophilic crops, e.g., maize (8–10 °C). The growing degree days value, similar to the thermal threshold, is determined for a given species and its particular development stages. For example, for winter triticale, obtaining complete maturity requires GDD of 1158 °C, and for maize, depending on cultivar and purpose, 1390–1685 °C. GDD for a threshold of 10 °C (GDD10) is an index also determining the demand for heat of different grapevine species. Mean GDD10 below 945 °C is unsuitable for the cultivation of grapevines. The best conditions are provided at GDD10 above 1164 °C [31].
Among many applied air temperature threshold values dependent on the plant species for the purpose of the analysis [32,41,42,43,44], values of 0, 5, and 10 °C were selected, determining the nonwinter period (GDD0), growing period (GDD5), and active growth period (GDD10), respectively. They are usually used for the assessment of the effect of thermal conditions of the growth and development of plants [7,45].
LTI (latitude–temperature index) is an index determining the maturing potential of grapevines [46], calculated with the application of mean monthly temperature of the warmest month in a year and the latitude of a given area, as below:
where:
- tmwm—mean air temperature of the warmest month, °C;
- φ—latitude.
The indices calculated for particular stations provided the basis for the analysis of their spatial distribution in Poland. Their temporal variability was presented with trend estimation. The assessment of the statistical significance of changes employed a nonparametric Mann–Kendall test, and their statistical significance was assessed by means of the Sen method [47].
The last stage was the attempt to designate regions characterized by specified agroclimatic conditions in Poland. For this purpose, stations were grouped by means of the Ward hierarchical clustering method [48,49]. The objects subject to clustering were meteorological stations; indices SAT, GDD, and LTI, mean air temperature, and trends of changes served as variables.
3. Results
3.1. Mean Air Temperature in the Period from April to October
Mean temperature in Poland during the years 1966–2020 in the period from April to October was 13.6 °C. The spatial distribution of air temperature evidently reflects the effect of the central European continent on the territory of Poland. Mean annual values decreased from the southwest of the country toward the northeast (Figure 2a). The area of the Silesian Lowland is the warmest, with the highest mean value reaching 14.4 °C in Wrocław and Ziemia Lubuska (Zielona Góra and Gorzów Wlkp., 14.2 °C), and in the Wielkopolska Lowland (Poznań, 14.2 °C), and the lowest in the Suwalszczyzna region (Suwałki, 12.5 °C) and in the eastern part of the coast (Łeba, 12.6 °C). Mean temperature of more than 14.0 °C is characteristic of areas located along the Oder and Warta Rivers, the center of Poland, and a belt in the south of the country (Małopolska and Podkarpacie). The lowest mean temperature in the warm period is recorded in the northeast.
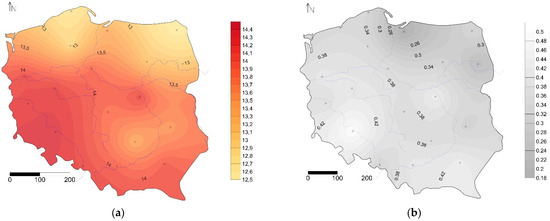
Figure 2.
Mean air temperature (°C) (a) and changes during 10 years (b) for the period from April to October in Poland (1966–2020).
For the period studied, the greatest variability in mean air temperature from April to October occurred in Suwałki and Wrocław, where the coefficient of variation was 7.2%. The lowest coefficient of variation occurred in Elbląg and it was 5.5%. On average in Poland, the coefficient of variation for air temperature in the period reached 6.4%.
During the years 1966–2020 in Poland, air temperature in the warm half year increased by an average of 0.36 °C per 10 years. The changes were statistically significant at a level of 0.01 in Elbląg, and at a level of 0.001 in all the remaining stations. The greatest increase occurred in Wrocław (0.5 °C/10 years), and the smallest in Elbląg (0.19 °C/10 years) (Figure 2b). Such changes have been particularly evident since the 2000s, as evidenced by deviations from the average for the period 1966–2020 (Figure 3). This confirms earlier results [18,50]. Lisek [30] emphasizes that current climate changes favor the development of Polish wine production. Mean annual temperature shows an increasing trend, the transitional periods are reduced, and warm periods are prolonged.
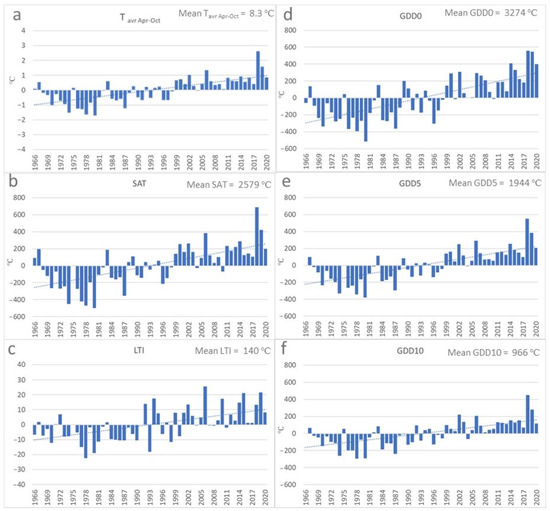
Figure 3.
Long-term variability of the deviation from the average values of air temperature (April–October) and agroclimate indices in Poland (1966–2020). Explanation: (a) mean air temperature from April to May; (b) SAT; (c) LTI; (d) GDD0; (e) GDD5; (f) GDD10.
3.2. SAT
Mean SAT value in Poland in the years 1966–2020 reached 2582 °C, and varied from an average of 2293 °C in northeast Poland (Suwałki) to 2777 °C in the southwest (Wrocław). The highest SAT values, exceeding 2700 °C, occurred along the Odra and Warta rivers and in Podkarpacie (Figure 4a). Heat resources favoring thermophilic crops and grapevines exceeding 2500 °C occurred over two-thirds of the country’s territory, covering the area outside northeastern Pomorze and Mazury. Analogical results were earlier obtained by Koźmiński et al. [50].
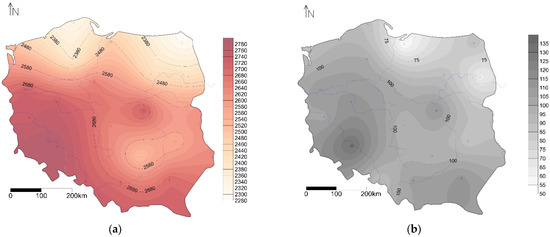
Figure 4.
Spatial distribution of SAT (a) and changes during 10 years (b) in Poland (1966–2020).
The variability coefficient averages 9.4%, varying from 8.2% in Żuławy Wiślane to more than 10.7% in Suwałki in east Poland. Maximum SAT of more than 3500°C occurred in Wrocław and Zielona Góra, and minimum below 1700 °C in Suwałki. In the years 1966–2020, SAT increased by an average of 95 °C/10 years—the greatest increase in south and central Poland with a maximum in Wrocław (132 °C/10 years), and the lowest in the northeastern part with a minimum in Elbląg (55 °C/10 years) (Figure 4b). The spatial distribution is characterized by high variability of heat resources in the territory of Poland, although values above 3000 °C had not occurred before 2000 (Figure 3). At most stations, they occurred in 2018 and 2019. Since 1998, mean SAT value has not decreased below 2500 °C. A considerable increase in SAT in the period 1971–2010 in the area of the Polish–German–Czech border area was observed by Kryza et al. [31], contributing to conditions more favorable for the cultivation of grapevines, which require greater heat resources.
3.3. GDD
Thermal resources determined based on the GDD index in the years 1966–2020 in Poland reached 3270 °C for a threshold of 0 °C, 1900 °C for a threshold of 5 °C, and 960 °C for a threshold of 10 °C, respectively. According to research by Sulikowska et al. [51], the thermal resources of Poland defined based on the GDD index in the years 1951–2010 were lower and reached 3150 °C for the air temperature threshold value of 0 °C, 1880 °C for 5 °C, and 920 °C for 10 °C.
The spatial distribution of total GDD for all thresholds is similar, as reflected in the temperature distribution and effect of local conditions (Figure 5). An increase in thermal resources occurs from the southeast to the southwest of Poland. Smaller amounts of heat also reach the eastern part of Pomorze and the belt extending from central toward eastern Poland. The region of Warsaw is characterized by somewhat greater thermal resources.
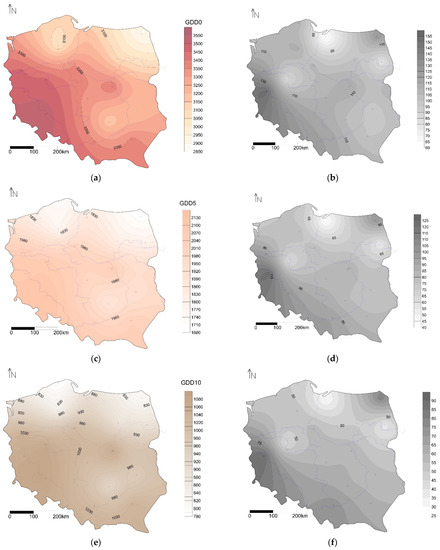
Figure 5.
Spatial distribution of GDD for Tbase 0 °C (a), 5 °C (c), and 10 °C (e), and changes during 10 years (b,d,f) in Poland (1966–2020).
The range of GDD fluctuations for a threshold of 0 °C (GDD0) averages 1100 °C, varying from 850 °C in Elbląg to 1300 °C in Wrocław. The variation coefficient ranges from 6.4% in Elbląg to 8.9% in Wrocław, averaging 7.8%. In the case of a threshold of 5 °C, GDD (GDD5) averages 945 °C in Poland, and varies from 700 °C in Świnoujście to 1120 °C in Wrocław. The coefficient of variation averages 9.9%: from 8.4% in Elbląg to 11.3% in Wrocław. For a threshold of 10 °C, GDD (GDD10) averages 770 °C—from 560 °C in Świnoujście to 920 °C in Wrocław. The average variation coefficient in Poland is 15.6%, with the lowest value of 13.7% in Elbląg and highest 17.8% in Wrocław. The variability of thermal resources during the study period was the highest for the highest thermal threshold, and the lowest for GDD in the case of a 0 °C threshold.
The highest GDD0 values are typical of southwest Poland (Figure 5a), where the maximum occurred in 2018 in Wrocław, and in Poznań and Zielona Góra (4260, 4120, and 4105 °C, respectively). The lowest values occurred in 1980 at the northeastern borders, with minimums recorded in Suwałki (2450 °C) and in Pomorze in Chojnice (2615 °C).
The spatial distribution of GDD5 is similar: the highest values occur in southwestern Poland (2811 °C in Wrocław during 2018), and the lowest in the northeastern part of the country (1318 °C in Suwałki during 1987) (Figure 5c). The GDD10 thermal resources decrease from the southwest (maximum in Wrocław 1660 °C during 2018) toward the north and northeast (minimum in Suwałki 521 °C during 1987) (Figure 5e). In 2018, exceptionally high GDD totals also occurred in Finland, among other areas. According to Lehtonen and Pirinen (2019), they exceeded typical values within a range 1200–1500 °C in south Finland and 600–900 °C in the northern part by 300–400 °C. It is expected that at the end of the 21st century, GDD totals approximate to those from 2018 will become typical in Finland [52,53].
Thermal resources are characterized by a statistically significant increasing trend in the study period. In Poland during the years 1966–2020, GDD10 increased by an average of 108 per 10 years, GDD5 by an average of 82 per 10 years, and GDD10 by an average of 59 per 10 years (Figure 5b,d,f). The greatest increase in GDD0, GDD5, and GDD10 occurred in Zielona Góra (152, 122, and 90 per 10 years, respectively), and the smallest in Elbląg (61, 43, and 29 per 10 years, respectively) (Figure 5b,d,f). The changes have been evident since the beginning of the 2000s, as suggested by deviations from the average from the period 1966–2020 (Figure 3d–f). Based on earlier data, Spinoni et al. [54], Sulikowska et al. [51], and Wypych et al. [55] point to positive deviations from the average already since the early 1980s. Lehtonen and Pirinen [56] suggest that the rapid increase in total GDD observed in Finland after the 1980s can be partially attributed to the Atlantic Multidecade Oscillation (AMO) [57], and only slightly to anthropogenic climate changes.
3.4. LTI
The assessment of agroclimatic conditions is supplemented with values of LTI that express the conditions of maturing of grapes, which depends on latitude [58]. LTI values change with latitude in Poland by an average of 90 in central coast of Baltic Sea to approximately 180 in Podkarpacie and Małopolska (Figure 6a). The coefficient of variation averages 8.1%, varying from 7% at the coast to more than 9% in Zielona Góra in west Poland. Maximum LTI values occurred in Rzeszów (222 in 2015), Kraków (222 in 2019), and Racibórz (221 in 2015), and the lowest ones were recorded in Łeba (79 in 1970) and Suwałki (89 in 1978). During the years 1966–2020, LTI increased by an average of 3.8 per 10 years in Poland. The greatest change occurred in Wrocław and Kraków (6.1 per 10 years) and in south Poland, i.e., in Raciborz and Rzeszów (5.9 and 5.4 per 10 years, respectively) (Figure 6b). The smallest increase occurred in the north of the country, namely in Elbląg and Łeba (1.8 and 2.0 per 10 years, respectively). The changes have been evident, as in case of other indices, since the beginning of the 2000s, as suggested by deviations from the average from the period 1966–2020 (Figure 3c).
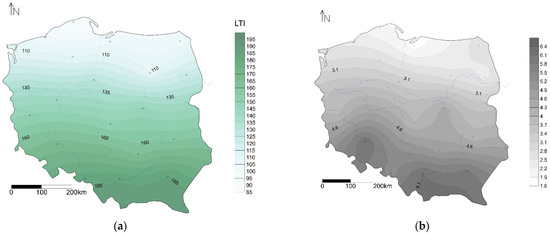
Figure 6.
Spatial distribution of LTI (a) and changes during 10 years (b) in Poland (1966–2020).
According to Robinson [59], the so-called wine belt, the most suitable for viticulture, is located at latitudes between 32°00′ and 52°00′ in the Northern Hemisphere, meaning that approximately half of the country is within the area of interest. For Podkarpacie, the LTI value averages 180–190, and is comparable with the majority of cooler regions of the cultivation in Europe [58]. In Poland, the most famous wine region with a long tradition is Zielona Góra. The Zielona Góra wine region has been the northernmost compact area of industrial viticulture in Europe, and perhaps in the world [60]. In the conditions of the current increase in LTI in Poland, the boundary will probably move northward. LTI values higher than 180 correspond with conditions occurring in well-known wine regions in Europe, e.g., Champagne, Mozel, and Milnik [61].
3.5. Regions of Thermal Resources
The analysis of the spatial distribution of particular agroclimatic indices in Poland permitted the observation of certain patterns in different parts of the study area. Finally, the determination of the spatial distribution of SAT, GDD, and LTI, and mean air temperature in the period from April to October involved attempts to designate separate regions with analogical thermal resources.
The basis adopted for the division were values of particular indices, i.e., SAT, GDD0, GDD5, GDD10, LTI, and mean air temperature, together with trends of their changes for the stations studied. Among many methods of hierarchical clustering of multicharacteristic objects, the method of minimum variance was selected, the so-called Ward method, based on Euclidean distances. The clustered objects included meteorological stations, and the aforementioned indices were adopted as variables. The clustering yielded four regions with different thermal resources (Figure 7).
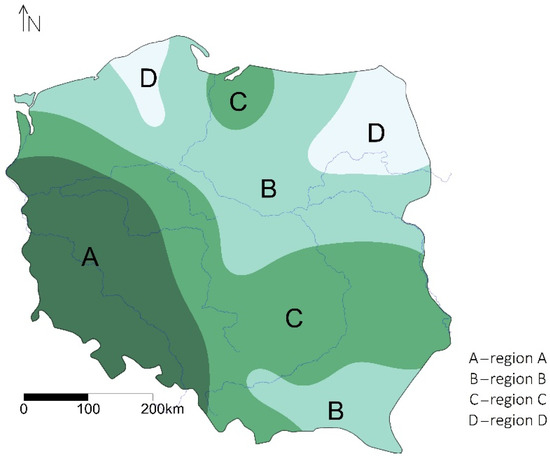
Figure 7.
Thermal resource regions in Poland. For explanation, see Table 1.
The greatest thermal resources are characteristic of region A, covering the southwestern part of Poland, i.e., the Oder and Warta River catchments (Figure 7). It includes the following stations: Gorzów Wlkp. Zielona Góra, Poznań, Wrocław, and Racibórz. Air temperature during the period from April to October averages 14.2 °C. Mean SAT value in the region is 2738 °C, varying from 2717 to 2777 °C. GDD adopts the following average values for subsequent thresholds: GDD0—3477 °C, GDD5—2088 °C, and GDD10—1061 °C. Values of particular GDD and SAT indices are the lowest in Gorzów Wlkp. and the highest in Wrocław (Table 1). LTI changes with the latitude of stations. In the study period, a statistically significant increase occurred in all the analyzed indices, although it shows spatial variability.

Table 1.
Mean values of agrometeorological indices for designated thermal resource regions in Poland.
Region B with vast thermal resources covers two areas. The first one is central Poland (Toruń, Łódź, and Warsaw) and the second one is Podkarpacie (Rzeszów and Kraków). It is characterized by somewhat lower mean temperature in the warm half-year, reaching 13.9 °C (Table 1). Mean SAT value in the region is 2666°C, ranging from 2618 to 2721 °C. GDD adopts the following average values for subsequent thresholds: GDD0—3337 °C, GDD5—2012 °C, and GDD10—1024 °C. Higher values of particular indices are recorded in the southern part of the region, although the changes occurring during the analyzed period are variable. Similarly, LTI shows an increase from 130 to 185 from the north toward the south.
Region C with moderate thermal resources also covers two areas. The first one extends from the northwest (Świnoujście), along the Warta River valley, to the southeast, reaching the uplands in central and east Poland (Kielce and Lublin). The second one is located near the mouth of the Vistula River (Elbląg). Air temperature in the region during the period from April to October averages 13.5 °C (Table 1). Mean SAT value is 2517 °C, and varies from 2490 to 2557 °C. GDD adopts the following average values for subsequent thresholds: GDD0—3221 °C, GDD5—1891 °C, and GDD10—923 °C. During the study period, the smallest changes in the selected agrometeorological indices and air temperature occurred in Elbląg. LTI obviously adopts the lowest values at stations in the north of the region.
Region D with small thermal resources is the area of northeast Poland (Białystok, Olsztyn, Suwałki) and the eastern part of the coast and Pomorze (Łeba, Chojnice). It is characterized by the lowest mean temperature in the warm half-year in comparison to the remaining regions, reaching 12.8 °C (Table 1). Mean SAT value in the region is 2365 °C, ranging from 2293 to 2428 °C. GDD adopts the following average values for subsequent thresholds: GDD0—3039 °C, GDD5—1758 °C, and GDD10—838 °C. The greatest changes in particular agrometeorological indices occurred in Suwałki, i.e., the easternmost station of the region. The greatest increase in temperature was observed in Pomorze (Chojnice).
A shift of agroclimatic regions is forecasted in Europe. Ceglar et al. [15] presented a forecast of migration of regions (zones) designated based on growing season length and sum of active temperatures (SAT) for the period between 1975 and 1995. The continental and Pannonian zones are moving northward by almost 70 km per 10 years. The continental zone covers the areas of northeast Poland. The Pannonian zone, characterized by scarce precipitation, among others, increasingly extends over the southwestern part of Poland. The observed changes have already shifted the time of phenological phases of the main crops in Europe [15].
4. Discussion and Conclusions
This paper presents temporal and spatial changes in agroclimatic conditions based on mean air temperature during the period from April to October, sums of active temperatures (SAT), growth degree days (GDD), and latitude–temperature Index (LTI) in Poland.
Mean temperature of the growing season during the years 1966–2020 was 13.6 °C. Its spatial distribution reflects the effect of oceanic and continental influences meeting over Poland, and its location on the Baltic Sea. The study period showed an increase in air temperature in Poland in the warm half-year by an average of 0.36°C per 10 years.
Mean SAT value averaged 2582 °C. Over approximately two-thirds of the territory of the country, the index value exceeds 2500 °C, which suggests heat resources suitable for the cultivation of thermophilic plants. Since 1998, mean SAT has not decreased below that value.
Values of the GDD index for particular temperature thresholds, i.e., 0 °C, 5 °C, and 10 °C reached 3270 °C, 1900 °C, and 960 °C, respectively. GDD values increase from the northeast toward the southwest. A cooling effect of the Baltic Sea is also observed.
The division of the country into regions of thermal resources, designated based on mean temperature in the growing season and the discussed agroclimatic indices and trends of changes during the study period, provided the basis for the designation of four regions with different heat resources.
The study period showed an increase in the values of all agroclimatic indices, suggesting an increase in the thermal resources in the territory of Poland.
An increase in thermal resources is a consequence of a global increase in temperature, and the consequences are observed in agriculture, horticulture, and forestry. Greater heat resources can increase plant production at temperate and high latitudes, increase potential production during harvests, and improve forest productivity [62,63,64]. The rate of the observed changes, however, can have a considerable effect on the current distribution of species and expansion of insects, and can affect yields of cereals and production of plant seeds [62,65]. Based on the results of phenological research, among others [66,67,68], confirming that an increase in thermal resources during the spring period accelerates plant development by several days. Sulikowska et al. [51] determined that it is possible to develop horticulture in Poland toward the introduction of new thermophilic cultivars. Studies by Kryza et al. [31] confirmed the favorable changes in the structure of the climate in Poland with respect to viticulture. The prolonged vegetation causes a strong densification of the field, which in turn weakens the plants, which compete with each other for water and nutrients. Cereals should be adequately supplied with all necessary macro- and microelements at this time. The field, free from diseases and pests, is able to overwinter more easily and start vegetation in a much better condition in spring. It is expected that climate change can contribute to increase in the yield of maize (6–43%) and winter rape (2–8%), decreases in winter wheat yield (from −18 to −5%), and negligible changes in yields of spring barley due to the impact of climate change on the efficiency of nitrogen use and its losses [69].
Future projections simulated until 2090 made by Graczyk and Kundzewicz [70] evidently show an increase in heat resources in Poland, and the temperature changes appear favorable for agriculture, although water availability may become a limiting factor [70]. Changes in the seasonal distribution of precipitation are negative (a decrease in the ratio of total precipitation in the warm half-year to total precipitation in the cold half-year), and even more unfavorable changes are forecasted for the future [71].
Conditions are forecasted to become gradually worse, e.g., for maize cultivation in Poland, although earlier forecasts of its production for seed have been optimistic due to an increase in heat resources [72]. The worsening of conditions for maize production according to the adopted scenarios of climate change results from a considerable decrease in total atmospheric precipitation in July and August, when the plant is at the pivotal stage of forming yield [73].
The contemporary warming causes the increase in thermal resources in Poland manifested by increasing values of agroclimatic indices. The temperature increase will speed the rate of plant development, which is of particular importance for some thermophilic plants (soybeans, millet, sunflower), which, already in the current climatic conditions, can mature within a much larger area of Poland than before. Owing to the climate changes, Poland may become a country with conditions suitable for viticulture and production of grape wine [74].
The spatial comparison of the present agricultural systems with their future equivalents, and exchange of knowledge between agricultural systems in different European agroclimatic zones, as suggested by Kahiluoto et al. [75], may point to suitable adaptation strategies and technologies for testing and validation.
Funding
This research received no external funding.
Informed Consent Statement
Not applicable.
Data Availability Statement
The data are available at: https://danepubliczne.imgw.pl/ (accessed on 1 March 2022).
Conflicts of Interest
The author declares no conflict of interest.
References
- IPCC. Summary for Policymakers. In Climate Change 2021: The Physical Science Basis; Contribution of Working Group I to the Sixth Assessment Report of the Intergovernmental Panel on Climate Change; Masson-Delmotte, V., Zhai, P., Pirani, A., Connors, S.L., Péan, C., Berger, S., Caud, N., Chen, Y., Goldfarb, L., Gomis, M.I., et al., Eds.; IPCC: Geneva, Switzerland, 2021. [Google Scholar]
- Bootsma, A. Long term (100 yr) climatic trends for agriculture at selected locations in Canada. Clim. Chang. 1994, 26, 65–88. [Google Scholar] [CrossRef]
- Karing, P.; Kallis, A.; Tooming, H. Adaptation principles of agriculture to climate change. Clim. Res. 1999, 12, 175–183. [Google Scholar] [CrossRef] [Green Version]
- Schwartz, M.D.; Ahas, R.; Aasa, A. Onset of spring starting earlier across the Northern Hemisphere. Glob. Chang. Biol. 2006, 12, 343–351. [Google Scholar] [CrossRef]
- Cross, H.Z.; Zuber, M.S. Prediction of flowering dates in maize based on different methods of estimating thermal units. Agron. J. 1972, 64, 351–355. [Google Scholar] [CrossRef]
- Russelle, M.P.; Wilhelm, W.W.; Olson, R.A.; Power, J.F. Growth analysis based on degree days. Crop. Sci. 1984, 24, 28–32. [Google Scholar] [CrossRef] [Green Version]
- Gordon, R.; Bootsma, A. Analyses of growing degree-days for agriculture in Atlantic Canada. Clim. Res. 1993, 3, 169–176. [Google Scholar] [CrossRef]
- Parmesan, C.; Yohe, G. A globally coherent fingerprint of climate change impacts across natural systems. Nature 2003, 421, 37–42. [Google Scholar] [CrossRef] [PubMed]
- Haggerty, B.; Mazer, S.J. The Phenology Handbook; Santa Barbara Phenology Stewardship Program; University of California: Santa Barbara, CA, USA, 2008; 111p. [Google Scholar]
- Kolářová, E.; Nekovář, J.; Adamík, P. Long-term temporal changes in central European tree phenology (1946–2010) confirm the recent extension of growing seasons. Int. J. Biometeorol. 2014, 58, 1739–1748. [Google Scholar] [CrossRef] [PubMed]
- Peng, S.; Huang, J.; Sheehy, J.E.; Laza, R.C.; Visperas, R.M.; Zhong, X.; Centeno, G.S.; Khush, G.S.; Cassman, K.G. Rice yields decline with higher night temperature from global warming. Proc. Natl. Acad. Sci. USA 2004, 101, 9971–9975. [Google Scholar] [CrossRef] [PubMed] [Green Version]
- Førland, E.J.; Skaugen, T.E.; Benestad, R.E.; Hanssen-Bauer, I.; Tveito, O.E. Variations in thermal growing, heating, and freezing indices in the Nordic Arctic, 1900–2050. Arct. Antarct. Alp. Res. 2004, 36, 347–356. [Google Scholar] [CrossRef] [Green Version]
- Ryan, M.G.; Archer, S.R.; Birdsey, R.A.; Dahm, C.N.; Heath, L.S.; Hicke, J.A.; Hollinger, D.Y.; Huxman, T.E.; Okin, G.S.; Oren, R.; et al. Land Resources: Forest and Arid Lands. In The Effects of Climate Change on Agriculture, Land Resources, Water Resources, and Biodiversity in the United States; United States Climate Change Science Program Synthesis and Assessment Product; Backlund, P., Janetos, A., Schimel, D., Eds.; U.S. Environmental Protection Agency: Washington, DC, USA, 2008; pp. 75–120. [Google Scholar]
- Fagre, D.B.; Charles, C.W.; Allen, C.D.; Birkeland, C.; Chapin, F.S.; Groffman, P.M.; Guntenspergen, G.R.; Knapp, A.K.; McGuire, A.D.; Mulholland, P.J.; et al. Case Studies. In Thresholds of Climate Change in Ecosystems; United States Climate Change Science Program Synthesis and Assessment Product; U.S. Environmental Protection Agency: Washington, DC, USA, 2009; pp. 15–34. [Google Scholar]
- Ceglar, A.; Zampieri, M.; Toreti, A.; Dentener, F. Observed northward migration of agroclimatezones in Europe will further accelerate under climate change. Earth’s Future 2019, 7, 1088–1101. [Google Scholar] [CrossRef] [Green Version]
- Peltonen-Sainio, P.; Jauhiainen, L. Large zonal and temporal shifts in crops and cultivars coincide with warmer growing seasons in Finland. Reg. Environ. Chang. 2020, 20, 89. [Google Scholar] [CrossRef]
- Kopeć, B. Uwarunkowania termiczne wegetacji winorośli na obszarze południowo-wschodniej części Polski. Infrastrukt. Ekol. Teren. Wiej. 2009, 4, 251–262. [Google Scholar]
- Tomczyk, A.M.; Szyga-Pluta, K. Variability of thermal and precipitation conditions in the growing season in Poland in the years 1966–2015. Theor. Appl. Climatol. 2019, 135, 1517–1530. [Google Scholar] [CrossRef] [Green Version]
- Szwejkowski, Z.; Kuchar, L.; Dragańska, E.; Cymes, I.; Cymes, I. Current and future agroclimate conditions in Poland in perspective of climate change. Acta Agrophys. 2017, 24, 355–364. [Google Scholar]
- Cesaraccio, C.; Spano, D.; Duce, P.; Snyder, R.L. An improved model for determining degree-day values from daily temperature data. Int. J. Biometeorol. 2001, 45, 161–169. [Google Scholar] [CrossRef]
- Matzarakis, A.; Ivanova, D.; Balafoutis, C.; Makrogiannis, T. Climatology of growing degree days in Greece. Clim. Res. 2007, 34, 233–240. [Google Scholar] [CrossRef]
- Fealy, R.; Fealy, R.M. The spatial variation in degree days derived from locational attributes for the 1961 to 1990 period. Irish. J. Agric. Food. Res. 2008, 47, 1–11. [Google Scholar]
- Hakala, K.; Hannukkala, A.; Huusela-Veistola, E.; Jalli, M.; Peltonen-Sainio, P. Pests and diseases in a changing climate a major challenge for Finnish crop production. Agric. Food Sci. 2011, 20, 3–14. [Google Scholar] [CrossRef] [Green Version]
- Juroszek, P.; von Tiedemann, A. Climate change and potential future risks through wheat diseases: A review. Eur. J. Plant Pathol. 2013, 136, 21–33. [Google Scholar] [CrossRef] [Green Version]
- Kowalski, W.; Nawalany, G. New Approach to Determine the Sum of the Active Temperatures (SAT) Exemplified by Weather Conditions of Western Malopolska. In Infrastructure and Environment; Krakowiak-Bal, A., Vaverkova, M., Eds.; Springer: Cham, Switzerland, 2019; pp. 203–216. [Google Scholar] [CrossRef]
- Jackson, D.I.; Schuster, D. The Production of Grapes and Wine in Cool Climates; Butterworths: Wellington, New Zealand, 1987. [Google Scholar]
- Kenny, G.J.; Harrison, P.A. The effects of climate variability and change on grape suitability in Europe. J. Wine Res. 1992, 3, 163–183. [Google Scholar] [CrossRef]
- Goldammer, T. Grape Grower’s Handbook: A Guide to Viticulture for Wine Production; Apex Publishers: Holland-on-Sea, UK, 2018. [Google Scholar]
- Jones, G.V.; Davis, R.E. Climate influences on grapevine phenology, grape composition, and wine production and quality for Bordeaux, France. Am. J. Enol. Vitic. 2000, 51, 249–261. [Google Scholar]
- Lisek, J. Climatic factors affecting development and yielding of grapevine in central Poland. J. Fruit Ornam. Plant Res. 2008, 286, 285–293. [Google Scholar]
- Kryza, M.; Szymanowski, M.; Błaś, M.; Migała, K.; Werner, M.; Sobik, M. Observed changes in SAT and GDD and the climatological suitability of the Poland-Germany-Chech Republic transboundary region for wine grapes cultivation. Theor. Appl. Climatol. 2015, 122, 207–218. [Google Scholar] [CrossRef] [Green Version]
- Yang, S.S.; Logan, J.; Coffey, D.L. Mathematical formulas for calculating the base temperature for growing degree-days. Agric. For. Meteorol. 1995, 74, 61–74. [Google Scholar] [CrossRef]
- McMaster, G.S.; Wilhelm, W.W. Growing degree-days: One equation, two interpretations. Agric. For. Meteorol. 1997, 87, 291–300. [Google Scholar] [CrossRef] [Green Version]
- Bonhomme, R. Bases and limits to using ‘degree.day’ units. Eur. J. Agron. 2000, 13, 1–10. [Google Scholar]
- Miller, P.; Lanier, W.; Brandt, S. Using Growing Degree Days to Predict Plant Stages; MT00103 AG 7/2001; Montana State University Extension Service: Bozeman, MO, USA, 2001. [Google Scholar]
- Carter, T.R. Changes in the thermal growing season in Nordic countries during the past century and prospects for the future. Agric. Food Sci. 1998, 7, 161–179. [Google Scholar] [CrossRef]
- Worthington, C.; Hutchinson, C. Accumulated growing degree days as a model to determine key developmental stages and evaluate yield and quality of potato in Northeast Florida. Proc. Fla. State Hortic. Soc. 2005, 118, 98–101. [Google Scholar]
- Łysiak, G. The Sum of Active Temperatures as a Method of Determining the Optimum Harvest Date of ‘Šampion’ and ‘Ligol’ Apple Cultivars. Acta Sci. Pol. Hort. Cultus 2012, 11, 3–13. [Google Scholar]
- Herms, D. Using Degree-Days and Plant Phenology to Predict Pest Activity. In IPM (Integrated Pest Management) of Midwest Landscapes; Krischik, V., Davidson, J., Eds.; Minnesota Agricultural Experiment Station Publication 58–07645; Minnesota Agricultural Experiment Station: St. Paul, MN, USA, 2004; pp. 49–59. [Google Scholar]
- Juszczak, R.; Leśny, J.; Olejnik, J. Sumy temperatur efektywnych jako element prognozy agrometeorologicznej wielkopolskiego internetowego serwisu informacji agrometeorologicznej (WISIA). Acta Agrophys. 2008, 12, 409–426. [Google Scholar]
- Nyéki, J.; Soltész, M. Floral Biology of Temperate Zone Fruit Trees and Small Fruits; Akademiai Kiado: Budapest, Hungary, 1996. [Google Scholar]
- Snyder, R.L.; Spano, D.; Cesaraccio, C.; Duce, P. Determining degree-day thresholds from field observations. Int. J. Biometeorol. 1999, 42, 177–182. [Google Scholar] [CrossRef]
- Zavalloni, C.; Andresen, J.A.; Flore, J.A. Phenological models of flower bud stages and fruit growth of “Montmorency” sour cherry based on growing degree-day accumulation. J. Am. Soc. Hortic. Sci. 2006, 131, 601–607. [Google Scholar] [CrossRef] [Green Version]
- Matzneller, P.; Blümel, K.; Chmielewski, F.-M. Models for the beginning of sour cherry blossom. Int. J. Biometeorol. 2014, 58, 703–715. [Google Scholar] [CrossRef]
- Grigorieva, E.; Matzarakis, A. Growing Degree Days at the Russian Far East. 2005. Available online: http://www.urbanclimate.net/matzarakis/papers/BIOMET7_Grigorieva_Matzarakis_44_49.pdf (accessed on 25 April 2022).
- Jackson, D.I.; Cherry, N.J. Prediction of a district’s grape-ripening capacity using a latitude- temperature index (LTI). Am. J. Enol. Vitic. 1988, 39, 19–28. [Google Scholar]
- Salmi, T.; Maatta, A.; Anttila, P.; Ruoho-Airola, T.; Amnel, T. Detecting Trends of Annual Values of Atmospheric Pollutants by the Mann-Kendall Test and Sen’s Slope Estimates—The Excel Template Application MAKESENS; Publications on Air Quality; Finnish Meteorological Institute: Helsinki, Finland, 2002; Volume 31, pp. 1–35. [Google Scholar]
- Ward, J.H. Hierarchical Grouping to Optimize an Objective Function. J. Am. Stat. Assoc. 1963, 58, 236–244. [Google Scholar] [CrossRef]
- Wilks, D.S. Statistical Methods in the Atmospheric Sciences, 3rd ed.; Academic Press: Oxford, UK, 2011. [Google Scholar]
- Koźmiński, C.; Mąkosza, A.; Michalska, B.; Nidzgorska-Lencewicz, J. Thermal Conditions for Viticulture in Poland. Sustainability 2020, 12, 5665. [Google Scholar] [CrossRef]
- Sulikowska, A.; Wypych, A.; Ustrnul, Z.; Czekierda, D. Zmienność zasobów termicznych w Polsce w aspekcie obserwowanych zmian klimatu. Acta Sci. Pol. Form. Circumiectus 2016, 15, 127–139. [Google Scholar] [CrossRef]
- Ruosteenoja, K.; Räisänen, J.; Pirinenet, P. Projected changes in thermal seasons and the growing season in Finland. Int. J. Climatol. 2011, 31, 1473–1487. [Google Scholar] [CrossRef]
- Ruosteenoja, K.; Räisänen, J.; Venäläinen, A.; Kämäräinenet, M. Projections for the duration and degree days of the thermal growing season in Europe derived from CMIP5 model output. Int. J. Climatol. 2016, 36, 3039–3055. [Google Scholar] [CrossRef]
- Spinoni, J.; Vogt, J.; Barbosa, P. European degree-day climatologies and trends for the period 1951–2011. Int. J. Climatol. 2015, 36, 25–36. [Google Scholar] [CrossRef] [Green Version]
- Wypych, A.; Sulikowska, A.; Ustrnul, Z.; Czekierda, D. Variability of growing degree days in Poland in response to ongoing climate changes in Europe. Int. J. Biometeorol. 2017, 61, 49–59. [Google Scholar] [CrossRef] [PubMed] [Green Version]
- Lehtonen, I.; Pirinen, P. 2018: An exceptionally warm thermal growing season in Finland. FMI’s Clim. Bull. Res. Lett. 2019, 1, 5. [Google Scholar] [CrossRef]
- Polonskii, A.B. Atlantic multidecadal oscillation and its manifestations in the Atlantic-European region. Phys. Oceanogr. 2008, 18, 227–236. [Google Scholar] [CrossRef]
- Bosak, W. Uprawa Winorośli i Winiarstwo w Małym Gospodarstwie na Podkarpaciu; Polski Instytut Winorośli i Wina: Kraków, Poland, 2004. [Google Scholar]
- Robinson, J. The Oxford Companion to Wine; Oxford University Press: Oxford, UK, 2006. [Google Scholar]
- Kuleba, M. Ampelografia Zielonej Góry; Pro Libris: Zielona Góra, Poland, 2005. [Google Scholar]
- Ostrowski, S.; Kaszuba, M.; Gajewski, K. Uprawa Winorośli i Amatorskie Przetwórstwo Winogron; Lubuskie Stowarzyszenie Winiarskie: Zielona Góra, Poland, 2004; p. 78. [Google Scholar]
- Winkler, J.A.; Andresen, J.A.; Guentchev, G.; Kriegel, R.D. Possible impacts of projected temperature change on commercial fruit production in the Great Lakes region. J. Great Lakes Res. 2002, 28, 608–625. [Google Scholar] [CrossRef]
- Linderholm, H.W.; Walther, A.; Chen, D. Twentieth-century trends in the thermal growing season in the Greater Baltic area. Clim. Chang. 2008, 87, 405–419. [Google Scholar] [CrossRef]
- Trnka, M.; Olesen, J.E.; Kersebaum, K.C.; Skjelvåg, A.O.; Eitzinger, J.; Seguin, B.; Peltonen-Sainio, P.; Rötter, R.; Iglesias, A.; Orlandini, S.; et al. Agroclimatic conditions in Europe under climate change. Glob. Chang. Biol. 2011, 17, 2298–2318. [Google Scholar] [CrossRef] [Green Version]
- Thuiller, W.; Lavorel, S.; Araújo, M.B.; Sykes, M.T.; Prentice, I.C. Climate change threats to plant diversity in Europe. Proc. Natl. Acad. Sci. USA 2005, 102, 8245–8250. [Google Scholar] [CrossRef] [Green Version]
- Chmielewski, F.M.; Rötzer, T. Annual and spatial variability of the beginning of growing season in Europe in relation to air temperature changes. Clim. Res. 2002, 19, 257–264. [Google Scholar] [CrossRef] [Green Version]
- Menzel, A.; Sparks, T.H.; Estrella, N.; Koch, E.; Aasa, A.; Ahas, R.; Alm-Kübler, K.; Bissolli, P.; Braslavská, O.; Briede, A.; et al. European phenological response to climate change matches the warming pattern. Glob. Chang. Biol. 2006, 12, 1969–1976. [Google Scholar] [CrossRef]
- Jatczak, K.; Walawender, J. Average rate of phenological changes in Poland according to climatic changes—Evaluation and mapping. Adv. Sci. Res. 2009, 3, 123–126. [Google Scholar] [CrossRef]
- Faber, A.; Jarosz, Z.; Król, A. Wpływ zmian klimatu na efektywność wykorzystywania azotu oraz jego straty. Zesz. Nauk. SGGW 2019, 19, 37–46. [Google Scholar] [CrossRef] [Green Version]
- Graczyk, D.; Kundzewicz, Z. Changes of temperature-related agroclimatic indices in Poland. Theor. Appl. Climatol. 2016, 124, 401–410. [Google Scholar] [CrossRef] [Green Version]
- Pińskwar, I. Projections of Changes in Precipitation Extremes in Poland; Monografie Komitetu Gospodarki Wodnej PAN: Warszawa, Poland, 2010; 153p. [Google Scholar]
- Sadowski, M.; Wyszyński, Z.; Górski, T.; Liszewska, M.; Olecka, A.; Łoboda, T.; Pietkiewicz, S. Adaptacja Produkcji Rolnej w Województwie Podlaskim do Oczekiwanych Zmian Klimatu; IOŚ: Warszawa, Poland, 2009. [Google Scholar]
- Nieróbca, A.; Kozyra, J. Wpływ Warunków Pogodowych na Plonowanie Kukurydzy w Polsce; Materiały Konferencyjne: Produkcja i Wykorzystanie Kukurydzy Uprawianej na Cele Spożywcze i Przemysłowe; IUNG: Sielinko, Poland, 2010; pp. 29–30. [Google Scholar]
- Maciejczak, M.; Mikiciuk, J. Climate change impact on viticulture in Poland. Int. J. Clim. Chang. Strateg. Manag. 2019, 11, 254–264. [Google Scholar] [CrossRef] [Green Version]
- Kahiluoto, H.; Kaseva, J.; Balek, J.; Olesen, J.E.; Ruiz-Ramos, M.; Gobin, A.; Kersebaum, K.C.; Takáč, J.; Ruget, F.; Ferrise, R.; et al. Decline in climate resilience of European wheat. Proc. Natl. Acad. Sci. USA 2018, 116, 201804387. [Google Scholar] [CrossRef] [Green Version]
Publisher’s Note: MDPI stays neutral with regard to jurisdictional claims in published maps and institutional affiliations. |
© 2022 by the author. Licensee MDPI, Basel, Switzerland. This article is an open access article distributed under the terms and conditions of the Creative Commons Attribution (CC BY) license (https://creativecommons.org/licenses/by/4.0/).