Article

Numerical Simulation of a Giant-Hail-Bearing Mediterranean Supercell in the Adriatic Sea

1
National Research Council-Institute of Atmospheric Sciences and Climate (CNR-ISAC), 40129 Bologna, Italy
2
Department of Biological and Environmental Sciences and Technologies, University of Salento, 73100 Lecce, Italy
3
National Research Council-Institute of Atmospheric Sciences and Climate (CNR-ISAC), 73100 Lecce, Italy
4
Center of Excellence Telesensing of Environment and Model Prediction of Severe Events (CETEMPS), 67100 L’Aquila, Italy
5
National Research Council-Institute of Atmospheric Sciences and Climate (CNR-ISAC), 00133 Rome, Italy
6
HIMET S.R.L., 67100 L’Aquila, Italy
7
Civil Protection Department, Presidency of the Council of Ministers, 00189 Rome, Italy
8
Department of Physics and Chemistry, University of L’Aquila, 67100 L’Aquila, Italy
9
National Research Council-Institute of Atmospheric Sciences and Climate (CNR-ISAC), 35127 Padua, Italy
*
Author to whom correspondence should be addressed.
Atmosphere 2022, 13(8), 1219; https://doi.org/10.3390/atmos13081219
Submission received: 25 May 2022 / Revised: 13 July 2022 / Accepted: 27 July 2022 / Published: 2 August 2022
(This article belongs to the Section Atmospheric Techniques, Instruments, and Modeling)

Abstract

:
On 10 July 2019, a giant hail-bearing supercell hit the Adriatic coast of central Italy. Hailstones with a maximum diameter of 14 cm were reported in the city of Pescara between 10:00 and 11:00 UTC. In this work, the main synoptic and mesoscale features, responsible for the triggering and the development of the supercell, are analyzed using the WRF model. The intrusion of Bora wind over the northern and central Adriatic was relevant for two reasons: on the one side, the arrival of low-level cold air produced an uplift of the pre-existing warm air and favored the triggering of convection; on the other side, the strong vertical wind shear, also due to the presence of intense upper-level southwesterlies, created conditions favorable to the formation of the supercell. The predictability of the event is also discussed, comparing simulations starting at different initial times and forced with GFS and IFS forecasts. The model results show that the runs initialized at earlier times reproduced more accurately the track and the time evolution of the supercell. The HAILCAST module of WRF was also used to simulate hailstorm characteristics, such as the average hailstone diameter. WRF-HAILCAST simulations proved to be in fair agreement with the radar reflectivity retrievals and with local reports.

1. Introduction

Hailstorms represent one of the most challenging systems to simulate with numerical models. In fact, the skill of numerical models in the simulation of such events suffers from the limitations in microphysics parameterization schemes, even at high horizontal resolution; this is mainly due to the limited knowledge of the mechanisms responsible for hail nucleation and growth inside convective systems, which require further investigation [1,2,3,4]. This is also a consequence of the limited availability of hail surface observations at the ground, which are confined to a few regional networks of hailpads [5] and do not allow a proper validation and verification of the numerical simulations.
However, in the last years data from remote sensing platforms can support the detection of hail-bearing clouds. For example, radar reflectivity retrievals can be used to infer the hail content in clouds, which is, in general, a good proxy for the estimation of hailfall at the ground [6], and satellite-based observations of overshooting tops can be used to infer the updraft strength [7]. Punge et al. [8] assessed the probability of hail in Europe through the SEVIRI instrument on board the Meteosat Second Generation (MSG) using the ERA-INTERIM reanalysis, finding a peak of occurrence in northeast Italy. However, the limited laboratory observations, the uncomplete knowledge of the spectral features of ice crystals, and the approximations in hail models and parametrizations have limited the progress in the field [3].
The importance of the study of intense hailstorms is enhanced also considering that the climate projections indicate a global intensification of such extreme events [9,10]. Punge et al. [11] gave a general perspective about the future occurrence of hail in Europe, identifying the Mediterranean basin as one of the main hotspots. The Italian peninsula, due to its complex morphology, is prone to supercell formation, which sometimes is responsible for hailfall [12]. In fact, the presence of mountains and of coastlines favors low-level horizontal wind shear, a necessary ingredient for supercell development [13]; also, the warm Mediterranean Sea is a source of energy and moisture that may feed the storm development [14].
The Adriatic basin, especially on its northern side, is strongly affected by hailstorms; in fact, the Apennines, the Dinaric Alps, and the Alps form a natural corridor confined between the Italian peninsula and the Balkans, where southeasterlies (Sirocco) travel nearly undisturbed over the sea, bringing warm and moist air to the northern Adriatic basin, where they may meet cold northeasterlies (Bora), thus favoring windshear and strong instability conditions [12,15,16]. The supercell developed on 10 July 2019 along the Italian Adriatic coast, which is the subject of the present study, represents an event of this kind, with considerable hailstone sizes up to 14 cm at the surface [17].
The central Adriatic regions of Italy are characterized by complex orography: moving from the coast across the region, the elevation grows from sea level to nearly 3000 m in less than 150 km. The main synoptic pattern favorable to heavy rainfall is characterized by the presence of a cut-off low over the Tyrrhenian Sea: the latter is responsible for a cyclonic circulation over the central Mediterranean; hence, an intense bora flow is generated over the Adriatic Sea, whose interaction with the Apennines produces intense rainfall [18].
Unfortunately, the conditions responsible for the development of hailstorms in the Adriatic areas are still uncertain and need a deeper investigation from an integrated observational-numerical perspective. To our knowledge, there is not a single study dealing with these storms in the central part of the basin. Manzato et al. [19] investigated an intense case affecting the Friuli-Venezia Giulia region in the northern Adriatic, but the triggering of convergence was mainly due to the convergence between the southerly flow and cold pools generated by earlier convective activity originated over the Alps. Therefore, the environmental conditions appear quite different from those analyzed here.
In the present work, the synoptic and mesoscale conditions in which the supercell developed are analyzed; the study is carried out by means of numerical simulations performed with the WRF model [20]. Hail is modeled using the HAILCAST module, which simulates the formation and the growth of five original embryos and calculates the final average dimensions of the hailstones reaching the ground [21,22,23]. The work is organized as follows. Section 2 presents a brief description of the synoptic scenario; Section 3 describes the model setup; Section 4 is devoted to the analysis of the dynamics of the supercell, taking into account the “best” configuration of the model; Section 5 includes a final discussion and conclusions.

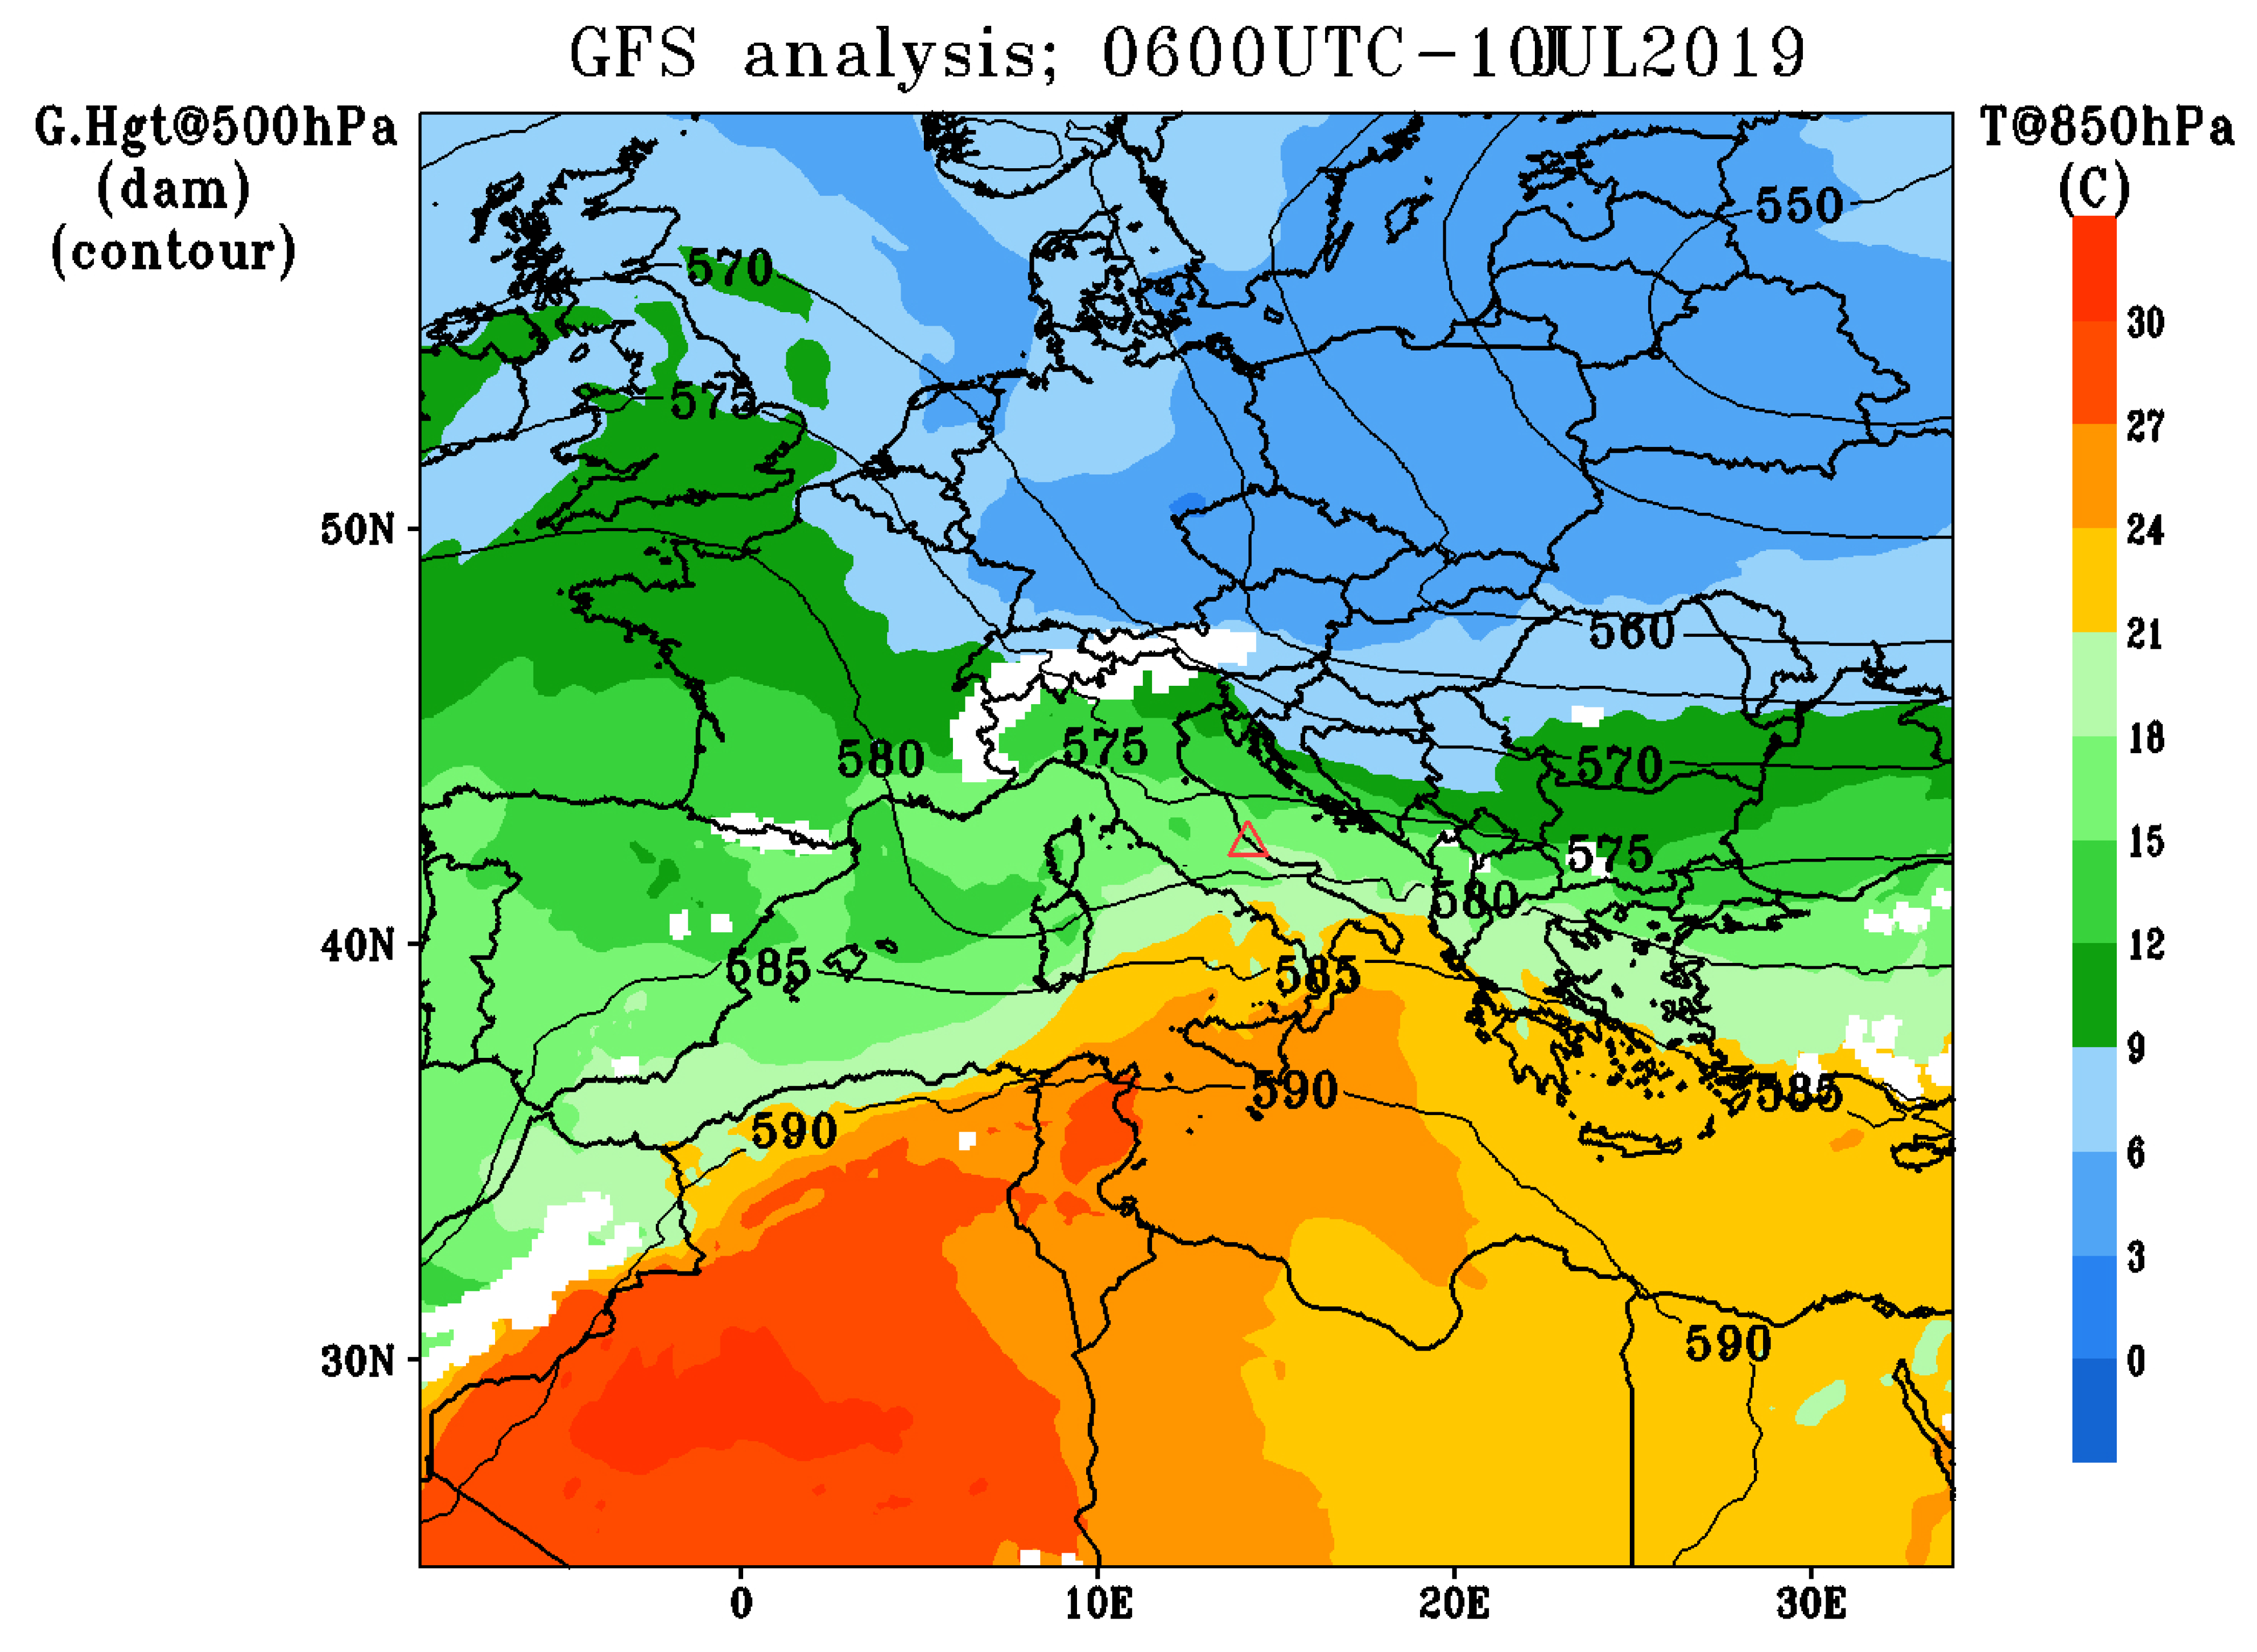
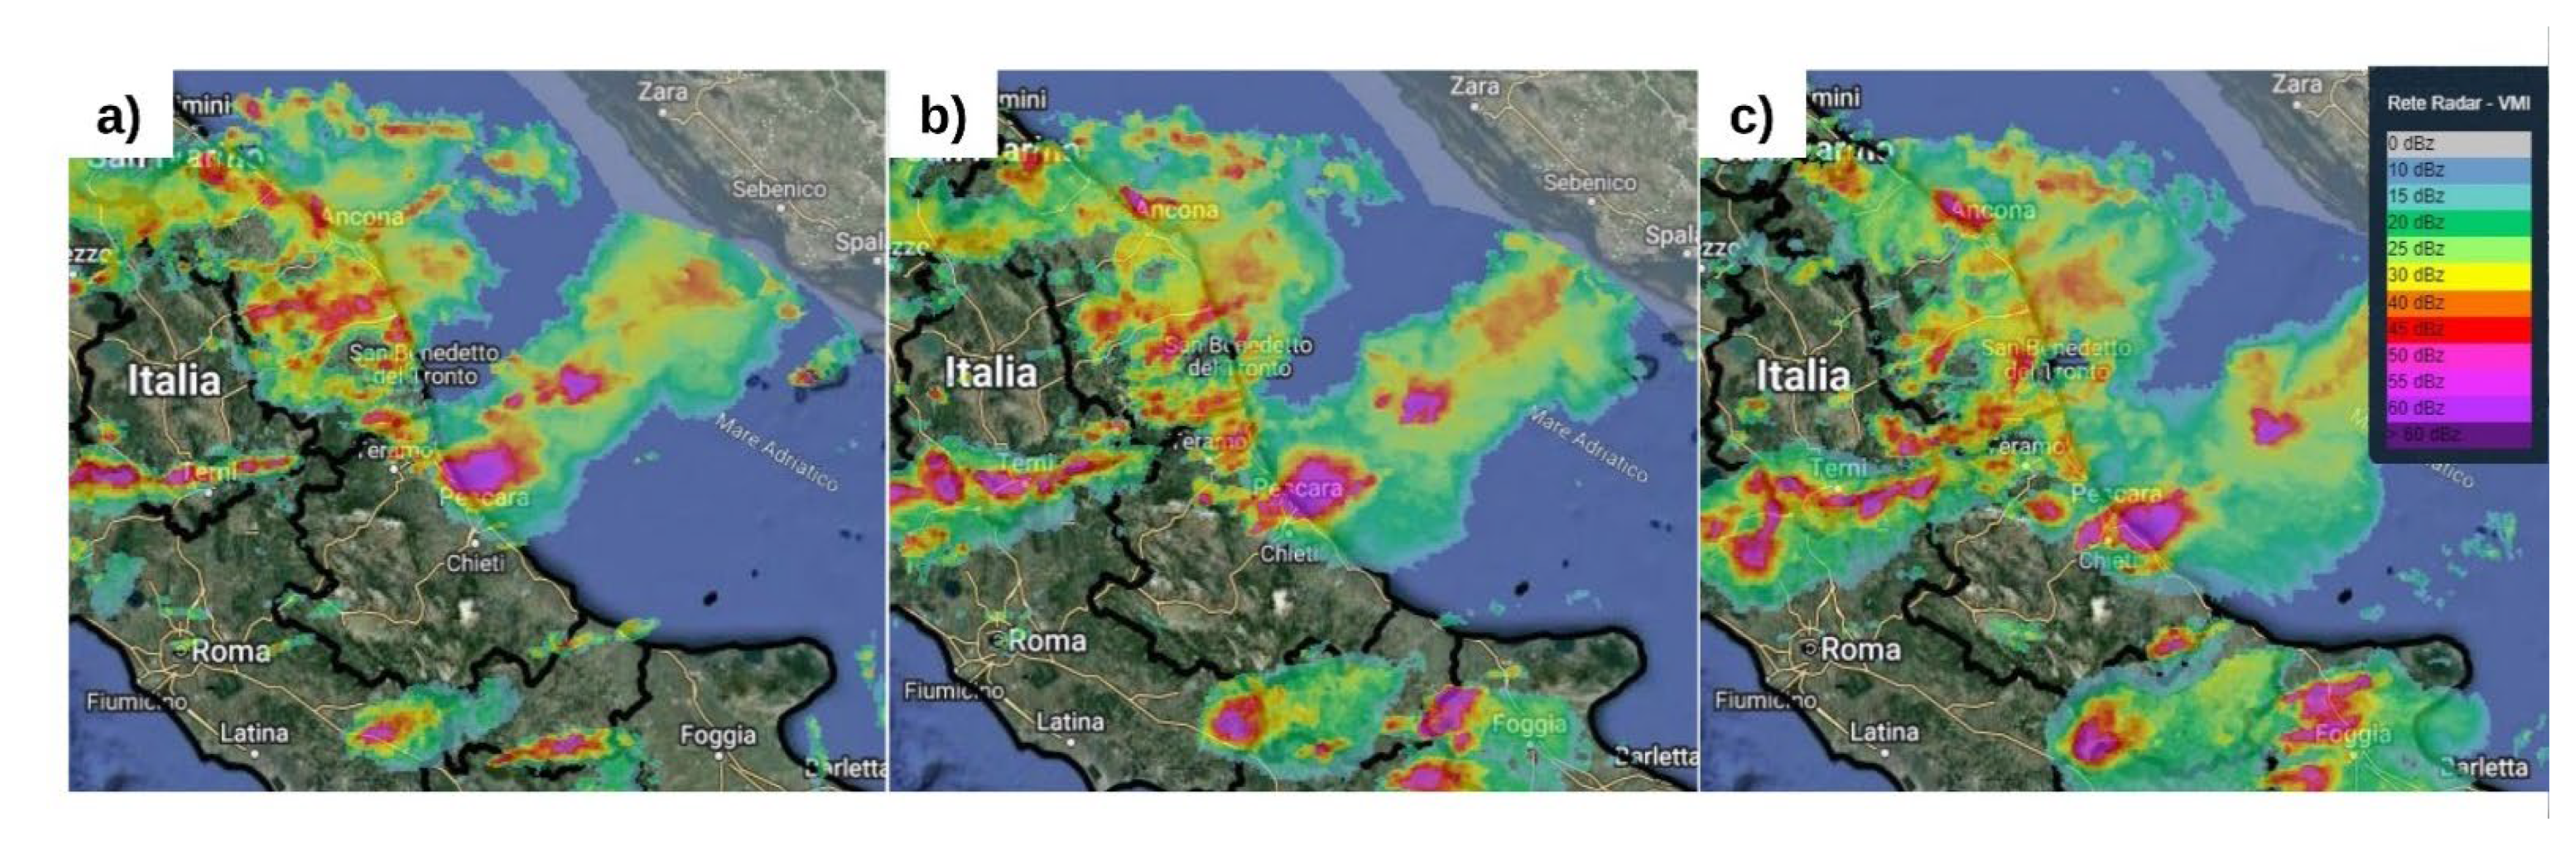
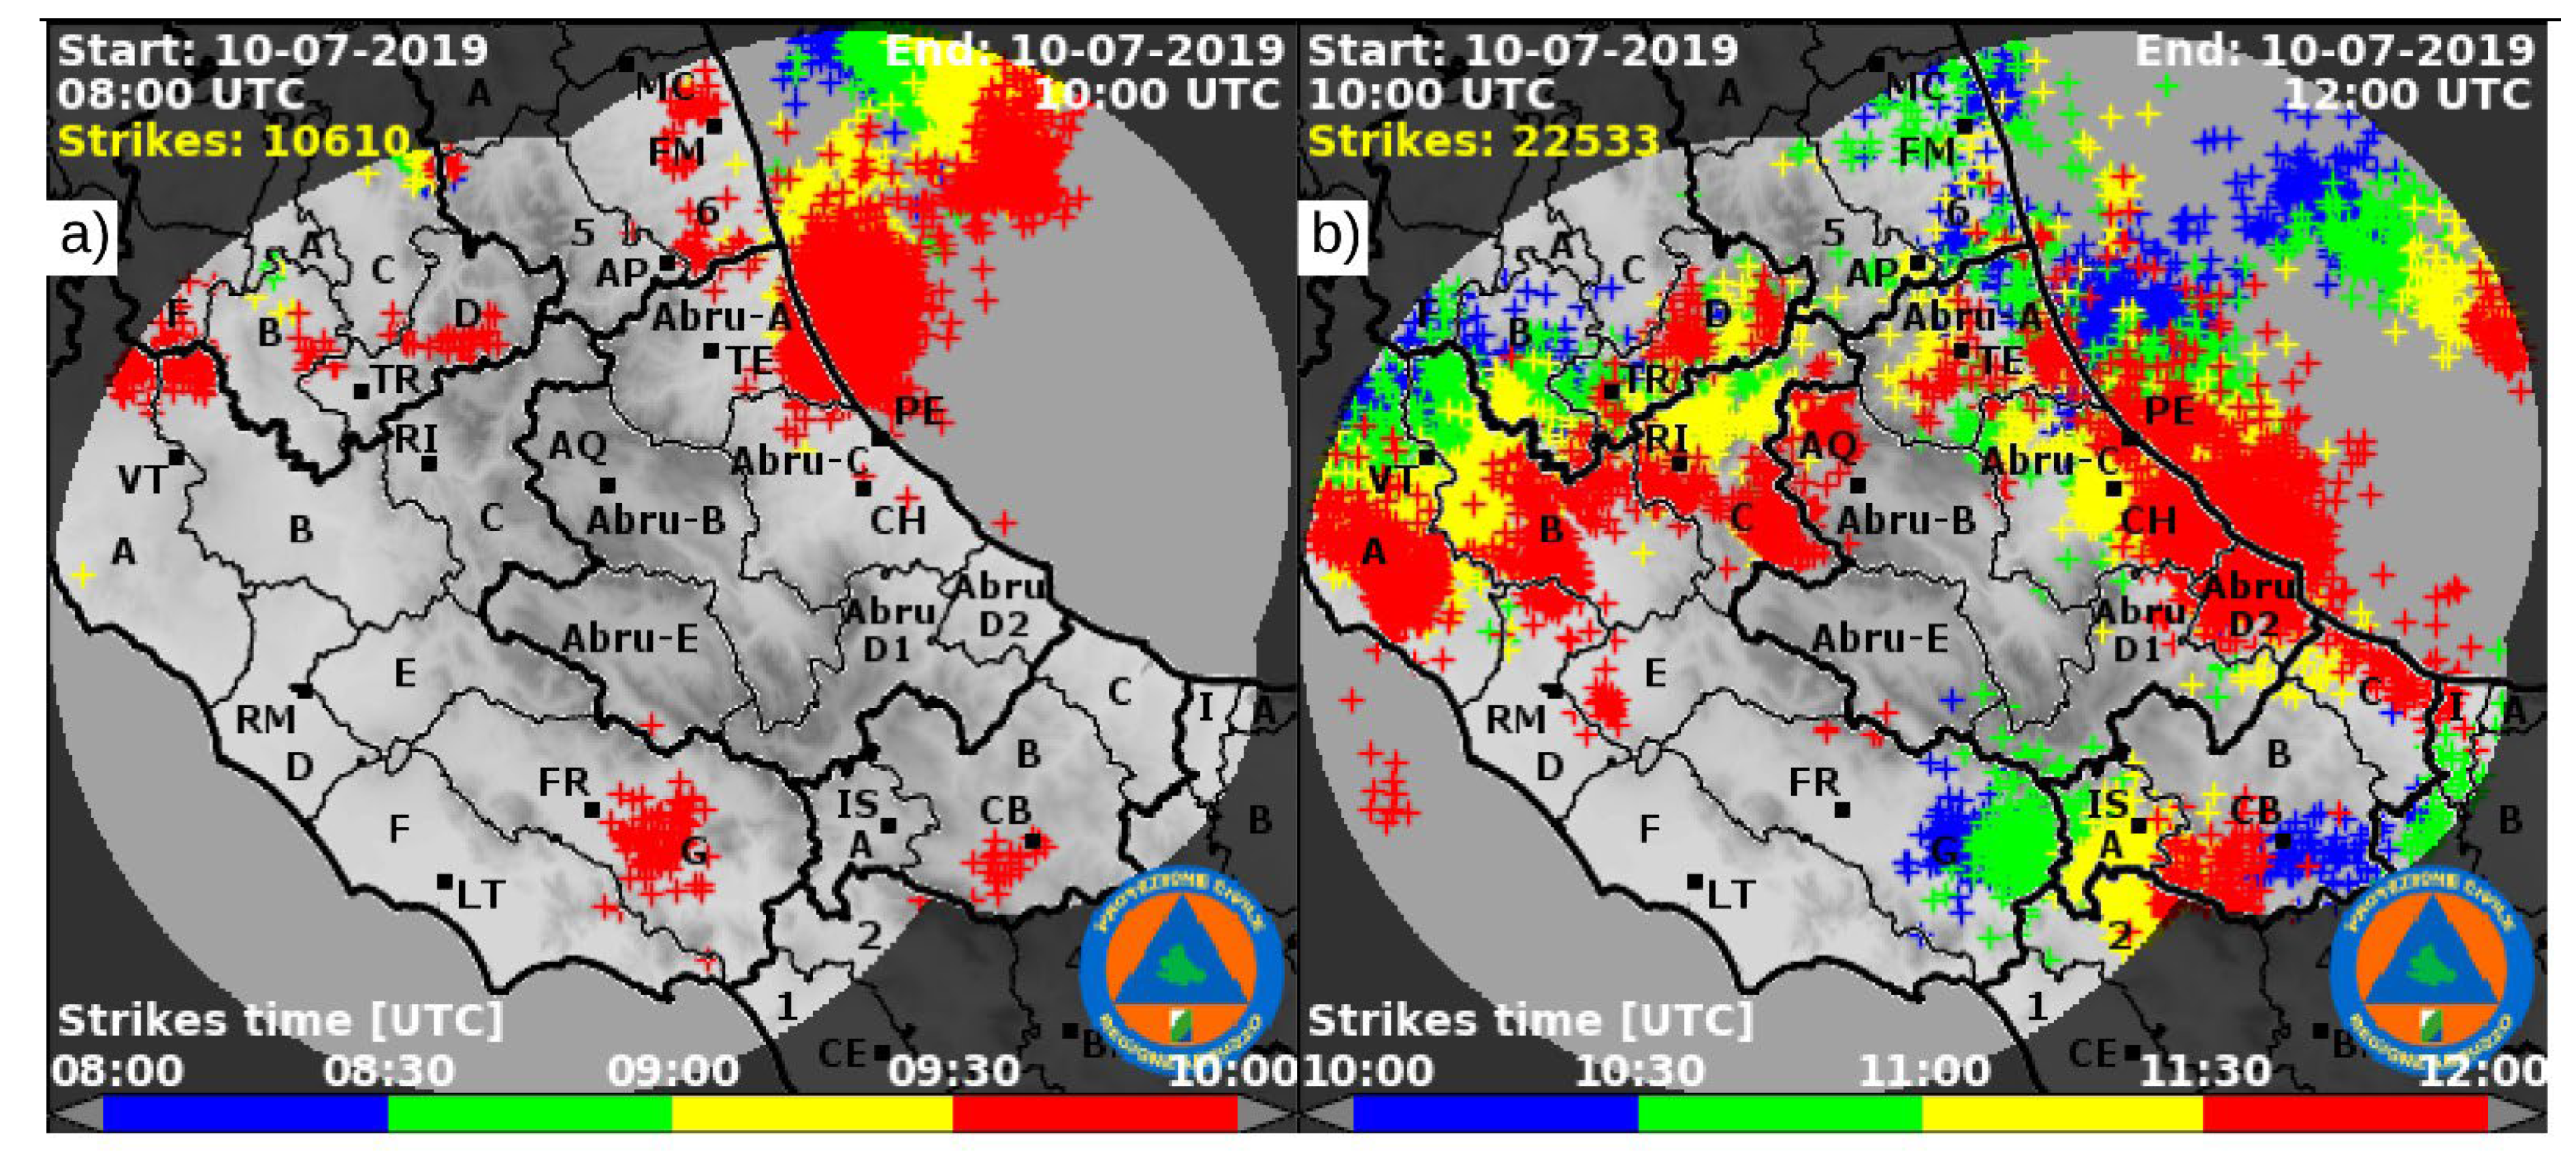
2. Synoptic Description and Observations

Between 6 and 11 July 2019, a severe weather outbreak developed across the northern and central Mediterranean basin spreading into the Alpine region and the Balkans (European Severe Weather Database; [24]). It was associated with a trough extending from Eastern Europe to the central Mediterranean: Figure 1 shows the analysis of 850 hPa temperature and 500 hPa geopotential height at 06:00 UTC, 10 July 2019, provided by the National Centers for Environmental Prediction (NCEP). The low-level cold air extends from the pressure low in Eastern Europe toward the western Mediterranean, thus affecting the northern and central part of the Adriatic Sea, while warmer air masses extend from the southern Mediterranean toward the southern Adriatic Sea. The match of these two air masses and their interaction with the surrounding complex orography favored the generation of several storm features (a supercell and some intense squall lines) along the eastern Italian coast, from the morning to the late afternoon [17].
The radar data report the intense convective activity occurring already in the early morning (Figure 2). Intense thunderstorms, leading to heavy precipitation and hail, formed in the northern Adriatic coast of Italy, while several waterspouts were reported along the coast. The supercell started to develop on the morning of July 10, 2019. The system hit the surroundings of Pescara (red triangle in Figure 1) between 10:00 UTC and 11:00 UTC, with a distinct overshooting top, as analyzed in [17]. The supercell continued its south-eastern track along the coast until the Apulia region; then, it reached Albania and Greece in the afternoon. Montopoli et al. [17] estimated the dimension of the hailstones through an analysis of the radar reflectivity and dual-polarization radar variables. Based on state-of-the-art radar inversion models, the hailstone size was estimated in the range of 4 cm and 14 cm, depending on the inversion method they used. Hence, the radar inversion methods were able to detect large hail sizes only marginally, since the measurements of the hailstones collected at Pescara were up to 14 cm in diameter.
Figure 2 shows the vertical maximum intensity (VMI) from the radar composite of the Italian National Radar Network in use to the Civil Protection of Italy. For each point, the VMI, reporting the columnar maximum in the radar reflectivity, shows a strong signal (up to 65 dBZ) crossing the coast around Pescara from north to south. The VMI images also capture an intense convective system offshore moving southeastward.
Figure 3 shows the lightning strokes sensed every 30 min between 08:00 and 10:00 UTC (a), and from 10:00 to 12:00 UTC (b). The images indicate the intense lightning activity along the Adriatic coast of Abruzzo, where the density of strokes appears very intense, but also across the Apennines and offshore, as shown from some intense convective cells in Figure 2.

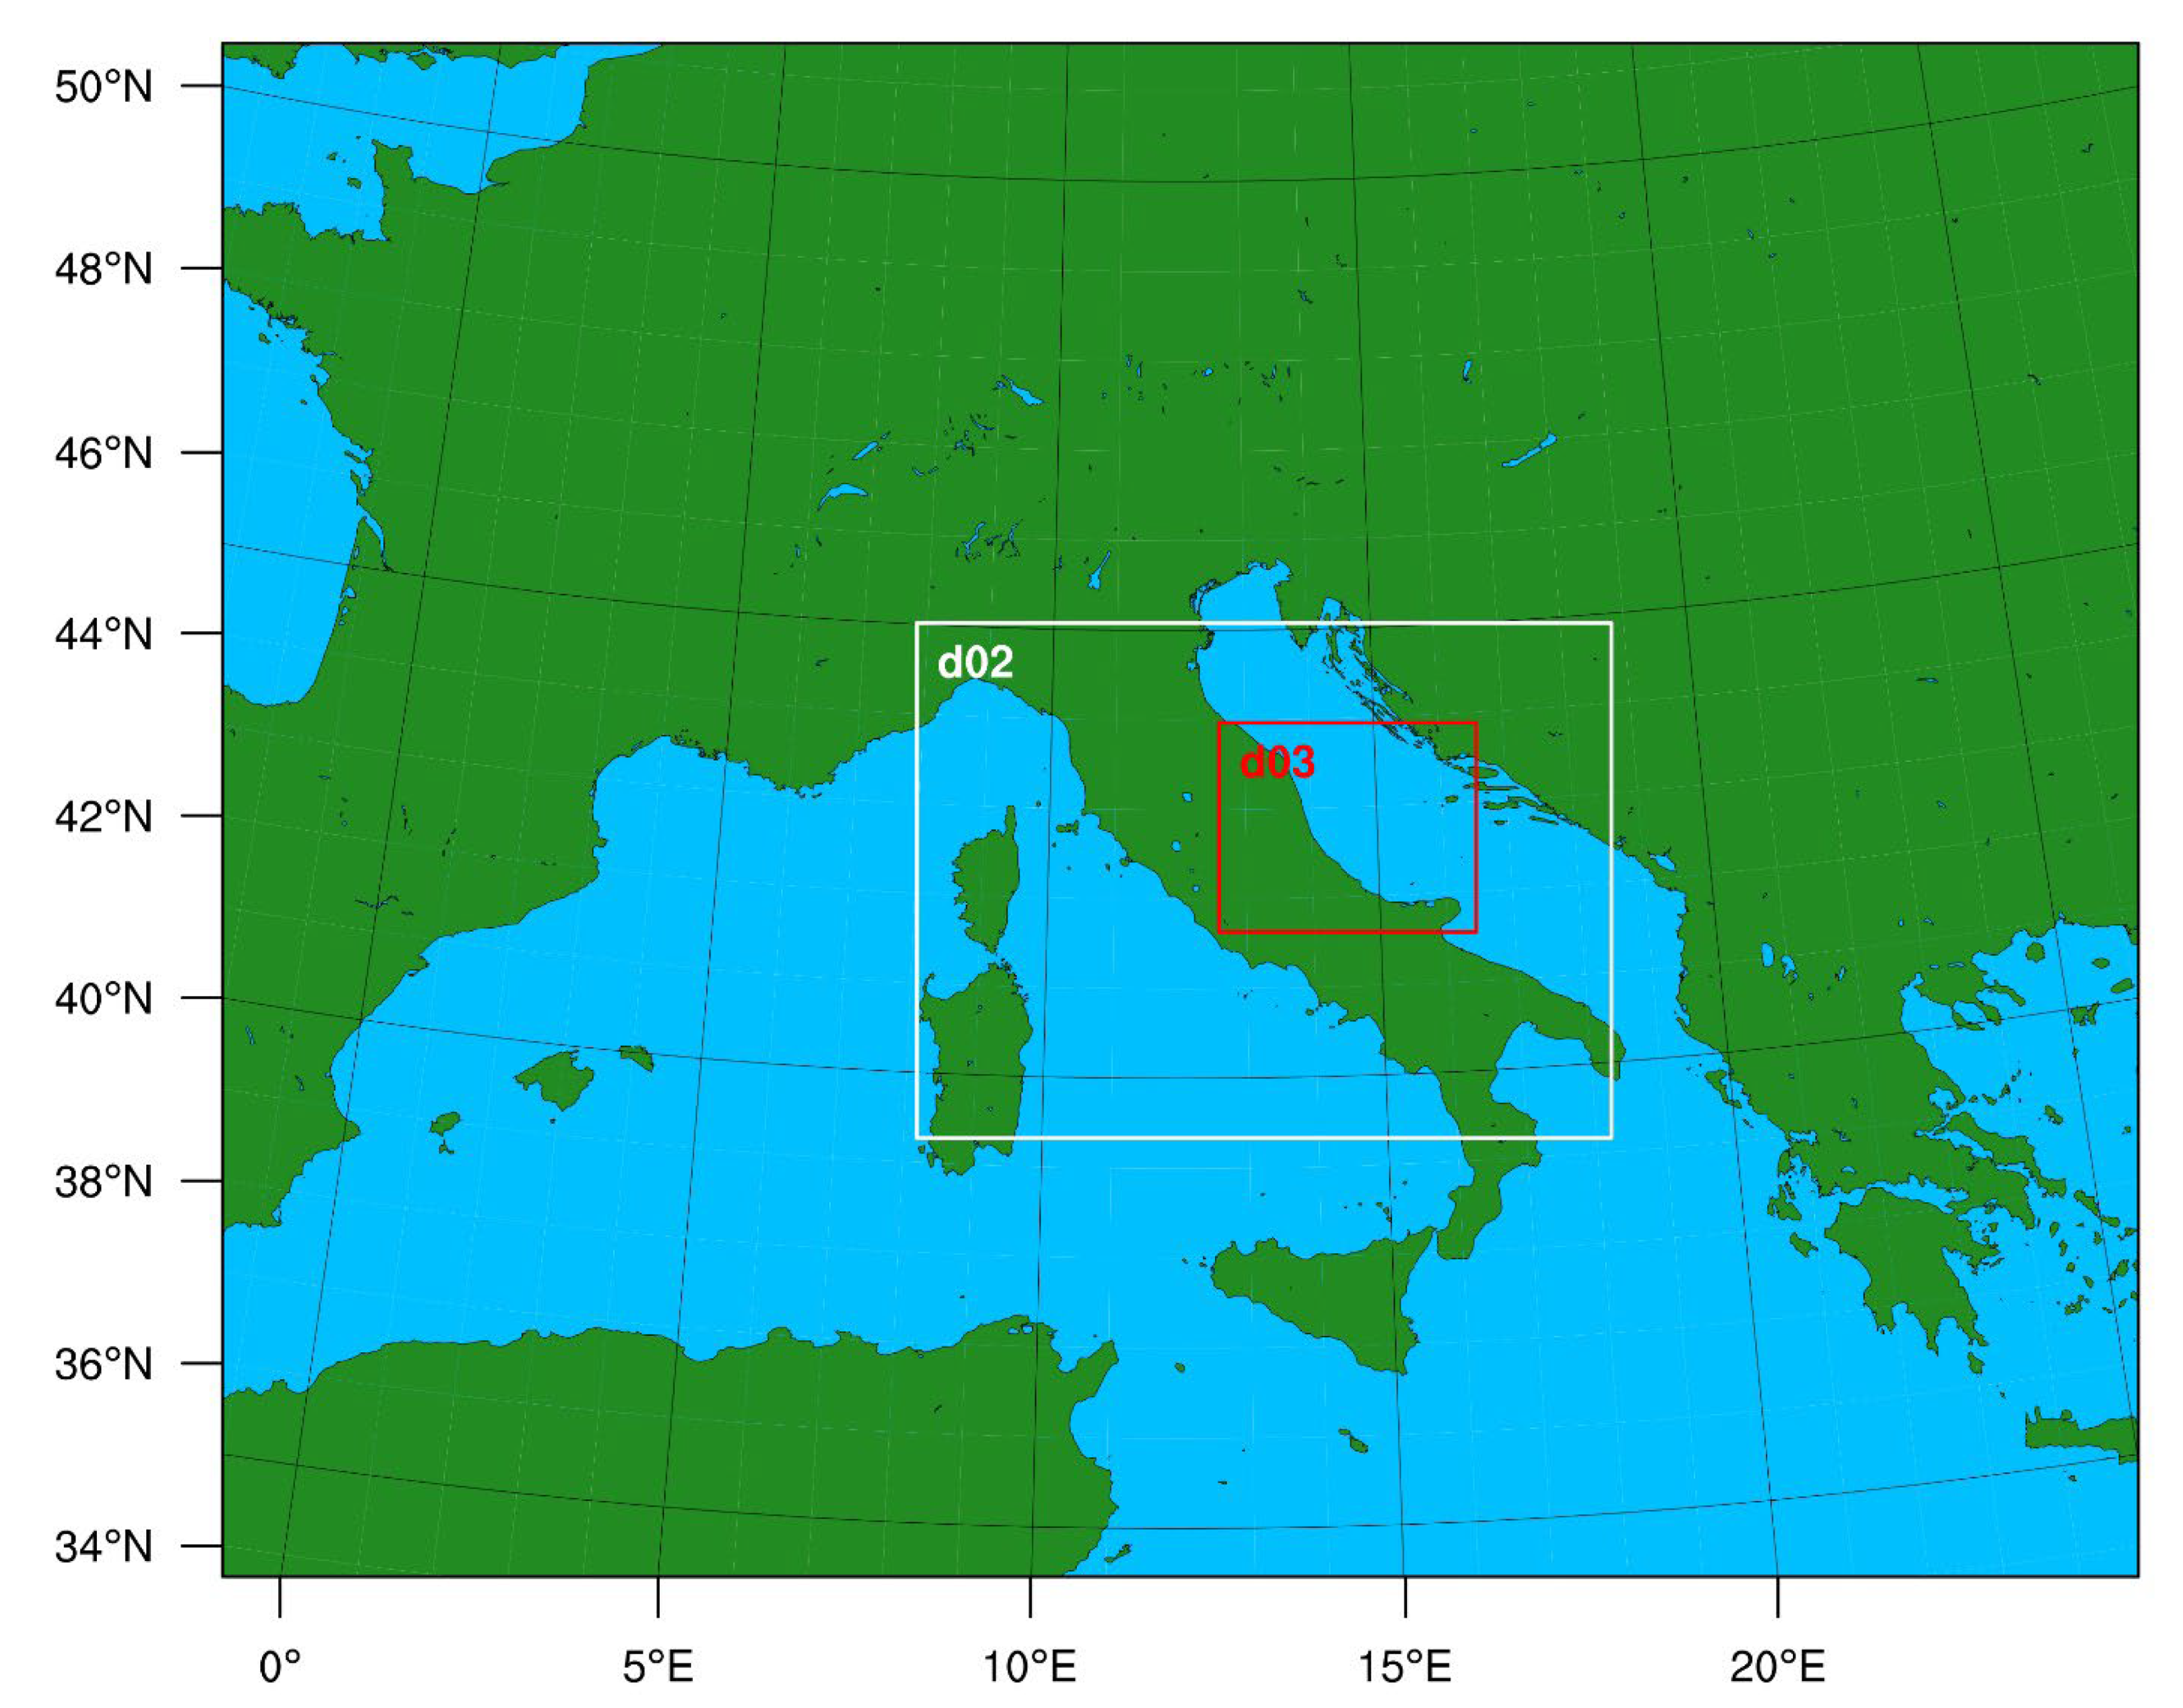
3. Numerical Experiment and Set Up

The meteorological model WRF-ARW version 4.0 [20] is used to simulate the synoptic and mesoscale environment in which the hailstorm developed. The WRF-HAILCAST module is also implemented to simulate the growth and the development of hailstones [23]. In the case the model triggers convection and the vertical wind component overcomes the threshold of 10 m s−1, the module activates five hail-originating embryos; then, the WRF model dynamics determine the time evolution inside the convective clouds. HAILCAST provides output fields relative to the hailstorm, such as the hailstone mean and maximum diameter, and the hailstone fall speed. A full description of WRF-HAILCAST is provided in [23].
Numerical simulations of the WRF-HAILCAST model are implemented over three one-way nested domains (Figure 4), with grid spacings of 16 km (d01), 4 km (d02), and 1 km (d03), and with 150 × 120, 217 × 161, 321 × 261 grid points, respectively; 41 vertical hybrid levels are used in each grid.
The model setup is chosen following the sensitivity experiments in [19] for a severe hailstorm over northeast Italy. The following parameterization schemes are used: the WSM6 microphysics scheme [25], the RRTM longwave [26] and shortwave [27] radiation, the unified Noah land-surface model [28], and the YSU boundary layer [29]. The Kain–Fritsch cumulus scheme [30] is active in the two outer domains, while convection is resolved explicitly in the inner grid. The HAILCAST module was only applied to the inner domain, too. Recently, Malečić et al. [31] performed a thorough sensitivity study of microphysics and boundary layer schemes for some hail events in Croatia, showing a general agreement with the results in [19].
In the present study, four different model runs have been performed to assess the sensitivity of the model simulations to different global model analyses/forecasts, used as initial conditions (IC) and boundary conditions (BC). The simulations are named as:
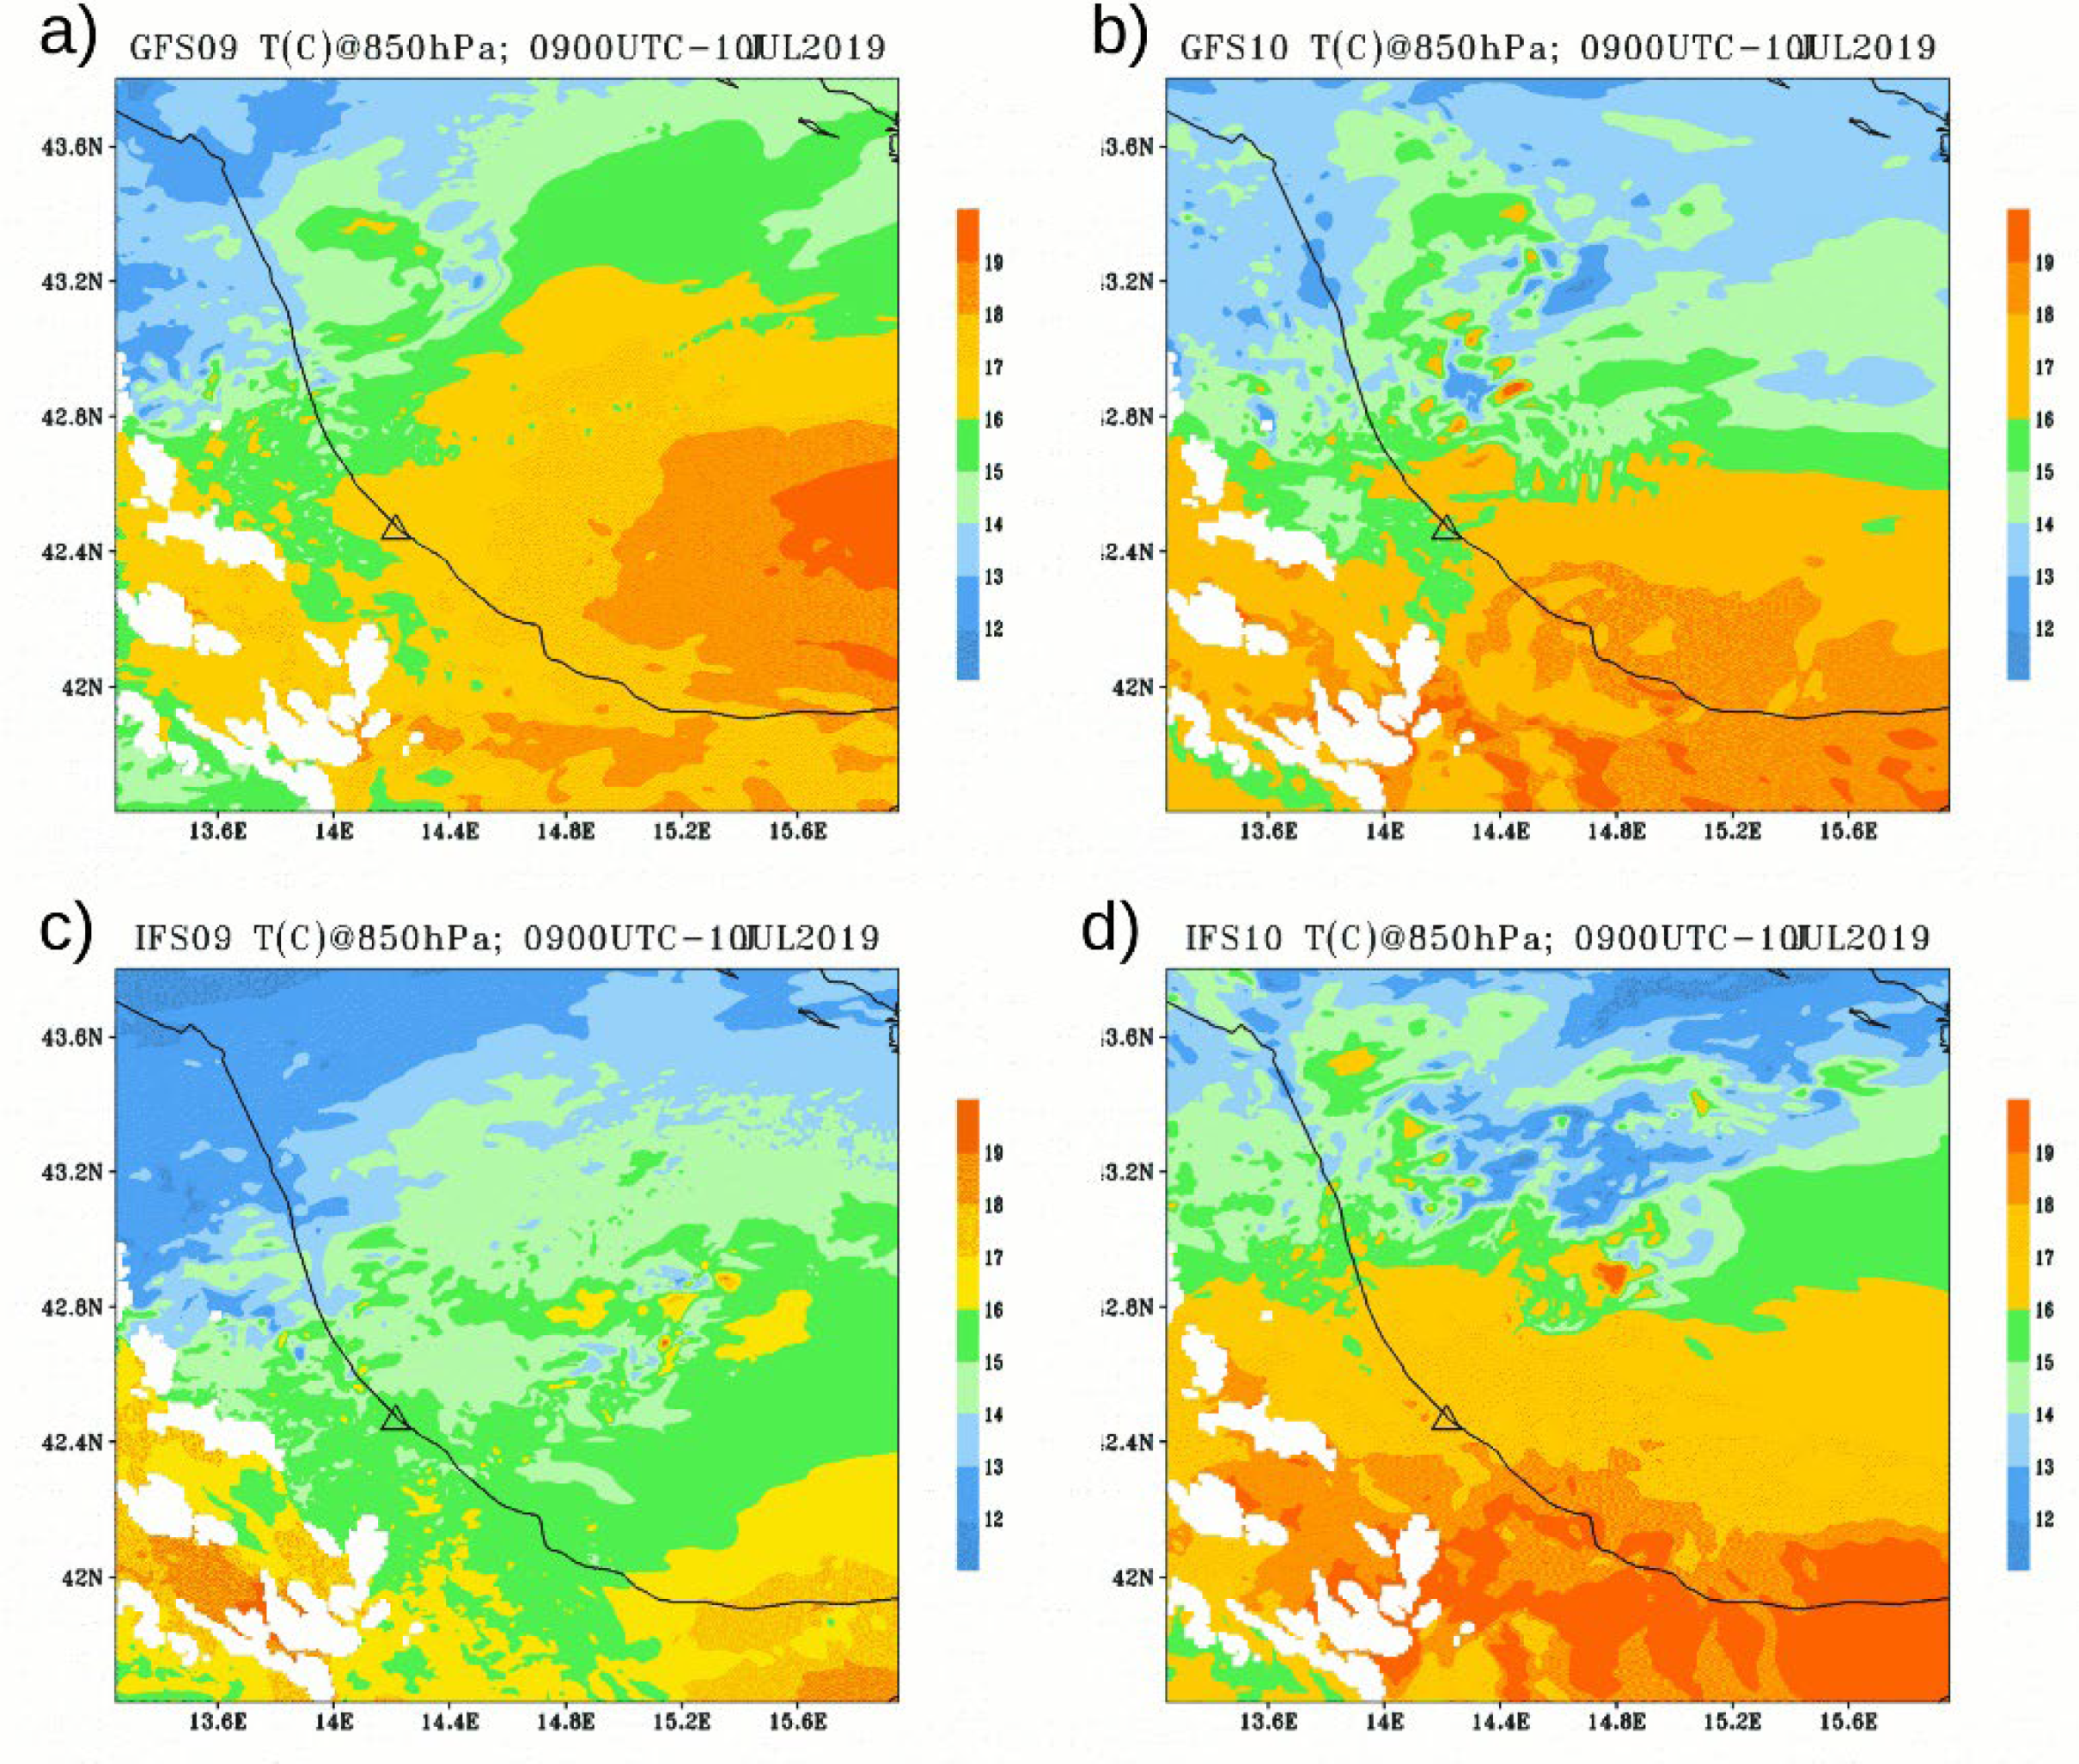
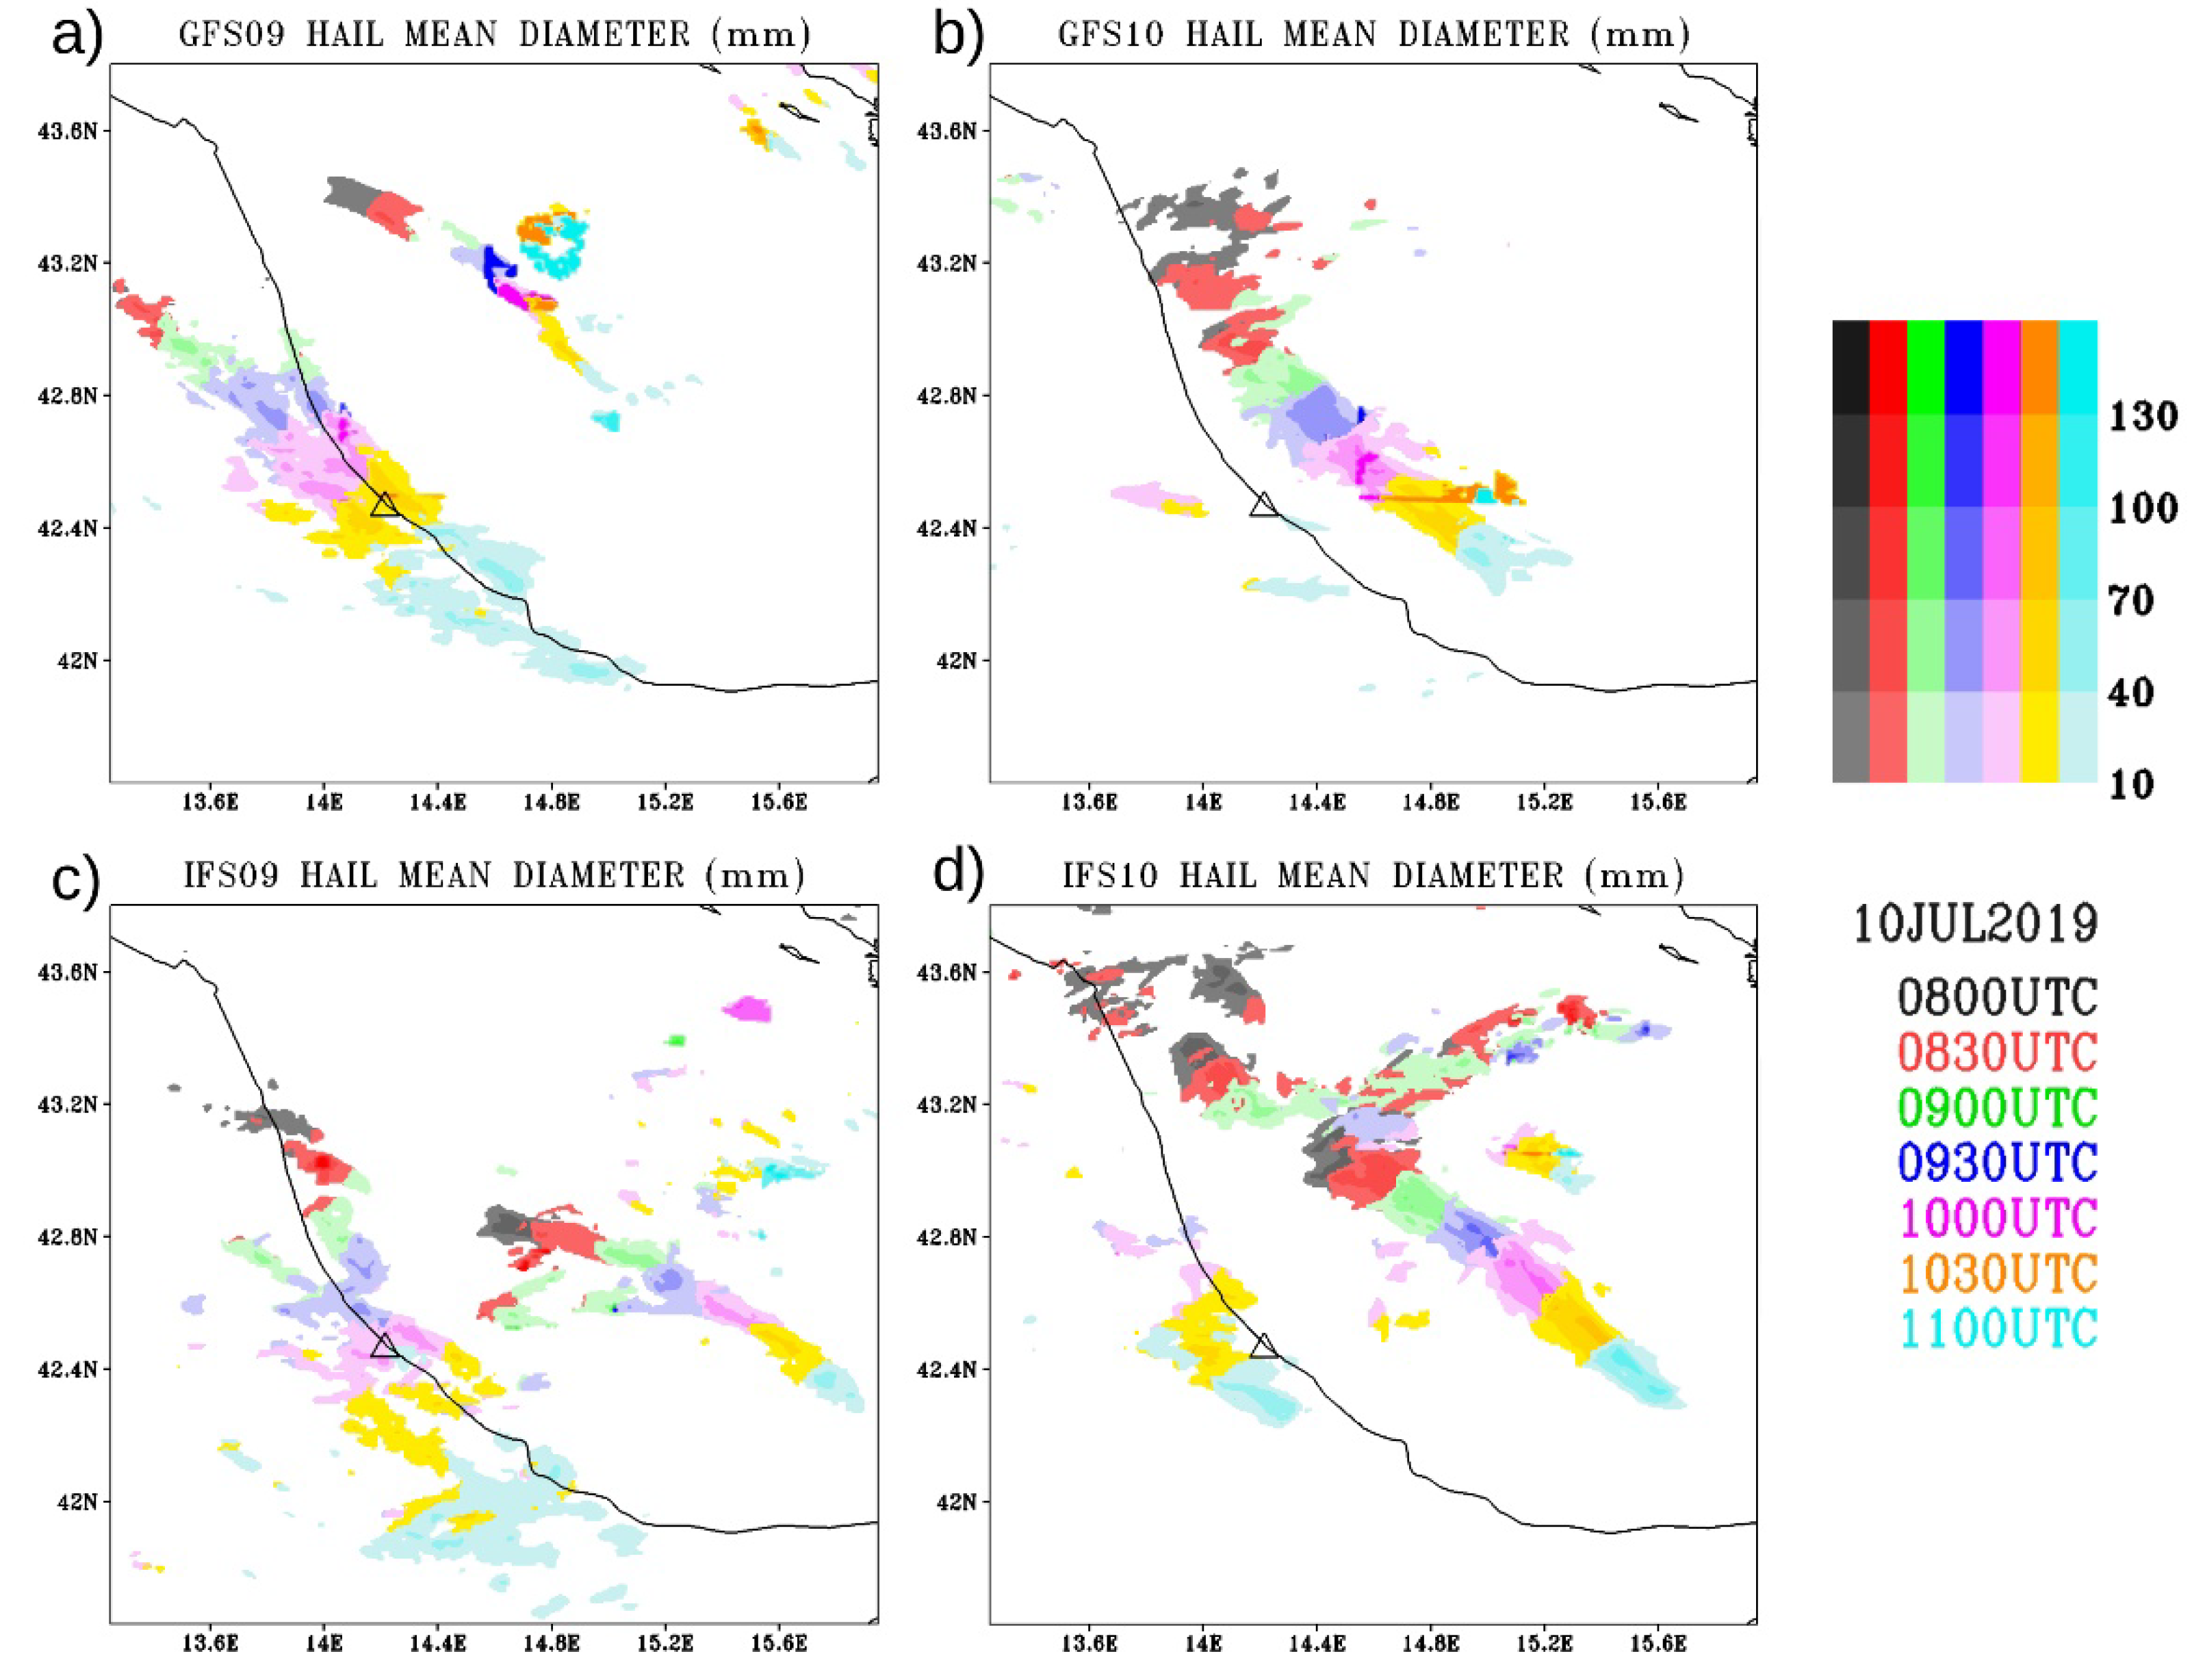
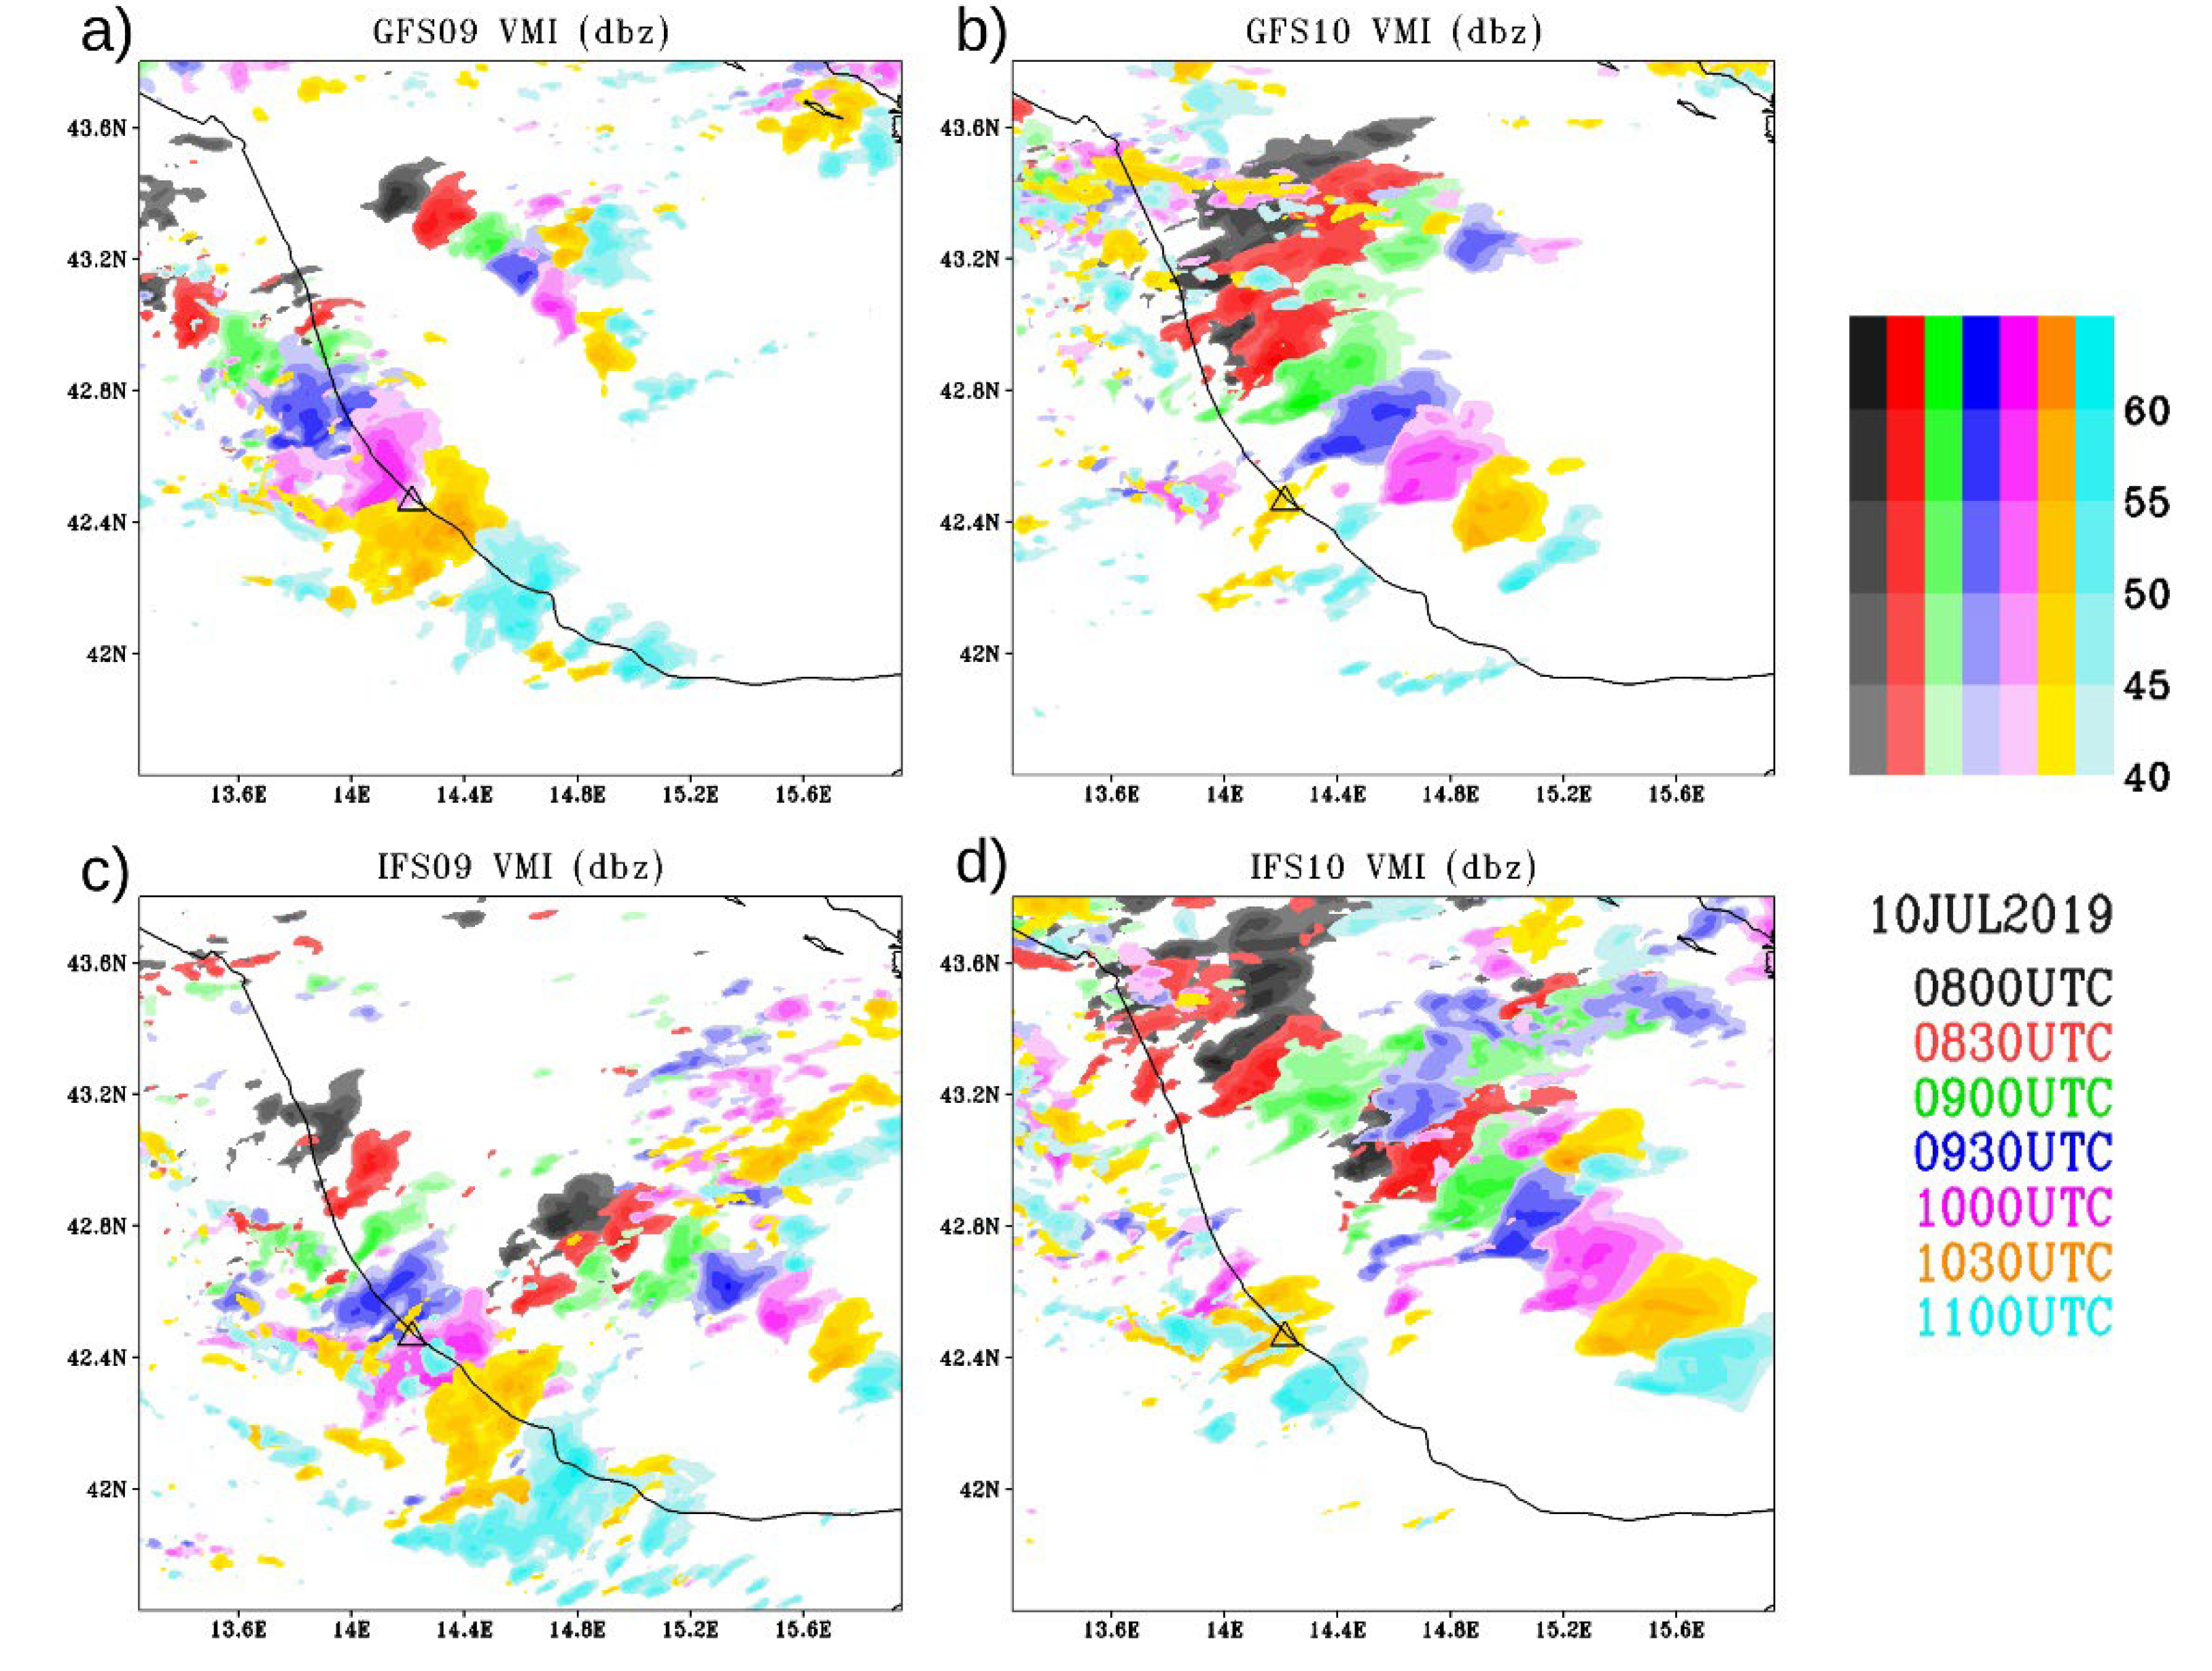
  • GFS09: run initialized at 00:00 UTC, 9 July 2019, forced with the GFS analyses/forecasts;
  • IFS09: run initialized at 00:00 UTC, 9 July 2019, forced with the IFS analyses /forecasts;
  • GFS10: run initialized at 00:00 UTC, 10 July 2019, forced with the GFS analyses/forecasts;
  • IFS10: run initialized at 00:00 UTC, 10 July 2019, forced with the IFS analyses forecasts.
All simulations end at 15:00 UTC, 10 July 2019. The IC and the BC fields necessary to initialize and update the model runs are provided by the global models:
  • GFS (Global Forecast System), run operatively at the NCEP at the resolution of 0.25º, provided at 34 pressure levels;
  • IFS (Integrated Forecasting System), run operatively at the ECMWF (https://www.ecmwf.int) at the resolution of 0.125º; for the present runs 26 standard pressure levels are extracted to force the WRF model.
For each run, the boundary conditions (GFS and IFS) are updated every 3 h.

4. Results and Discussion

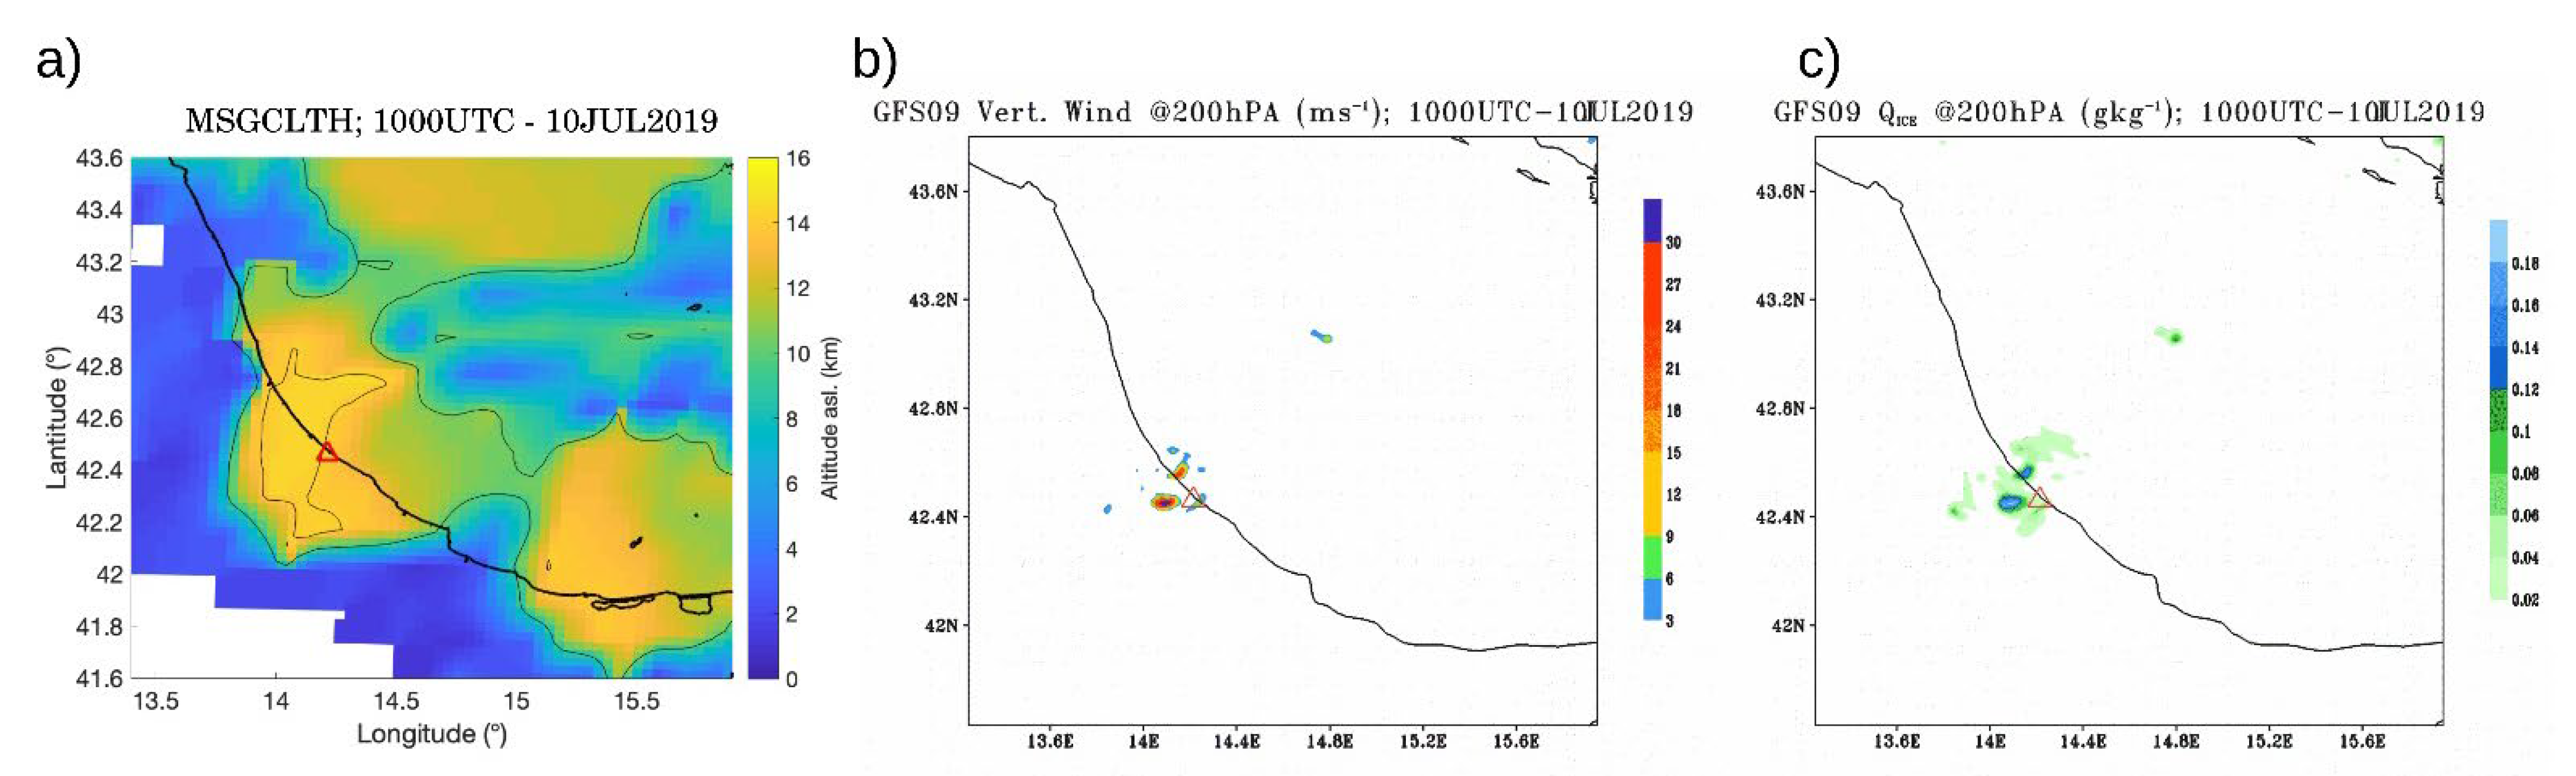
4.1. Comparison with the Observations

To assess the ability of the model to simulate the model evolution using different initial and boundary conditions, the modeled VMIs in Figure 5 are compared with the retrieved VMIs in Figure 2. The field is produced at different output times (every 30 min from 08:00 to 11:00 UTC, 10 July 2019; different colors refer to different times, the color tone refers to the VMI value).
The GFS09 run (Figure 5a) correctly reproduces the development of the convective system along the coast of Abruzzo and it is also in fair agreement with the convective system located offshore. In particular, for the main system along the coast, the frames at 10:00 and 10:30 UTC (in purple and orange, respectively) are in striking agreement with the observations in Figure 2 and Figure 3, and with [17], showing that the system crosses the city of Pescara (the triangle in the Figure) at the right time. However, a weak misplacement can be observed, as the convective system appears inland for most of its extent, and not offshore as in the observations.
The GFS10 run (Figure 5b) produces a general eastward shift of the main convective system, which is now entirely located offshore, and anticipates its time evolution; moreover, the offshore convective system appears weaker and propagates eastward instead of southeastward. The IFS09 run (Figure 5c) also reproduces both a coastal and an offshore system; however, the modeled VMI along the coast shows a time lag, as the model anticipates the transit of the convective system over Pescara by about 30 min, and its location is shifted even more inland; on the contrary, the offshore system is shifted to the south-east with respect to the observations. Lastly, the IFS10 run (Figure 5d) strongly amplifies the intensity of the offshore system to the detriment of the main system, which has strongly weakened.
Figure 6 shows a comparison between some parameters representing convection at high altitude for the GFS09 run and the cloud top height based on the retrievals of the sensor SEVIRI on board of the Eumetsat geostationary platform MSG. Figure 6a shows the cloud top height product (MSGCLTH, available at https://www.eumetsat.int/) at 10:00 UTC. The cloud top height exceeds 14 km west of Pescara with maxima reaching 14.5 km. Figure 6b and 6c show the vertical wind component w (upward positive) and the ice content QICE at 200 hPa, about 12 km. The strength of the convection at such a pressure level is characterized by a maximum vertical velocity reaching 30 ms−1 (Figure 6b) corresponding to a content of ice cloud exceeding 0.18 gkg−1 (Figure 6c). Significant values of the model vertical velocity w and the cloud ice content QICE extend also above 150 hPa (about 14 km) confirming the presence of deep convection breaking through the tropopause. Hence, the GFS09 run appears in good agreement with the strong convection retrieved by SEVIRI/MSG regarding both the height and the position.
Figure 7 shows the strong sensitivity of the model to the IC: the GFS09 run produces a different location of the cold front, that appears more consistent with the temporal evolution of the hailfall in the observations. Thus, this preliminary analysis identifies the GFS09 run as the best in the simulation of the convective systems developed on the morning of 10 July 2019. Hence, unless specified, the GFS09 run will be analyzed in the rest of this work.

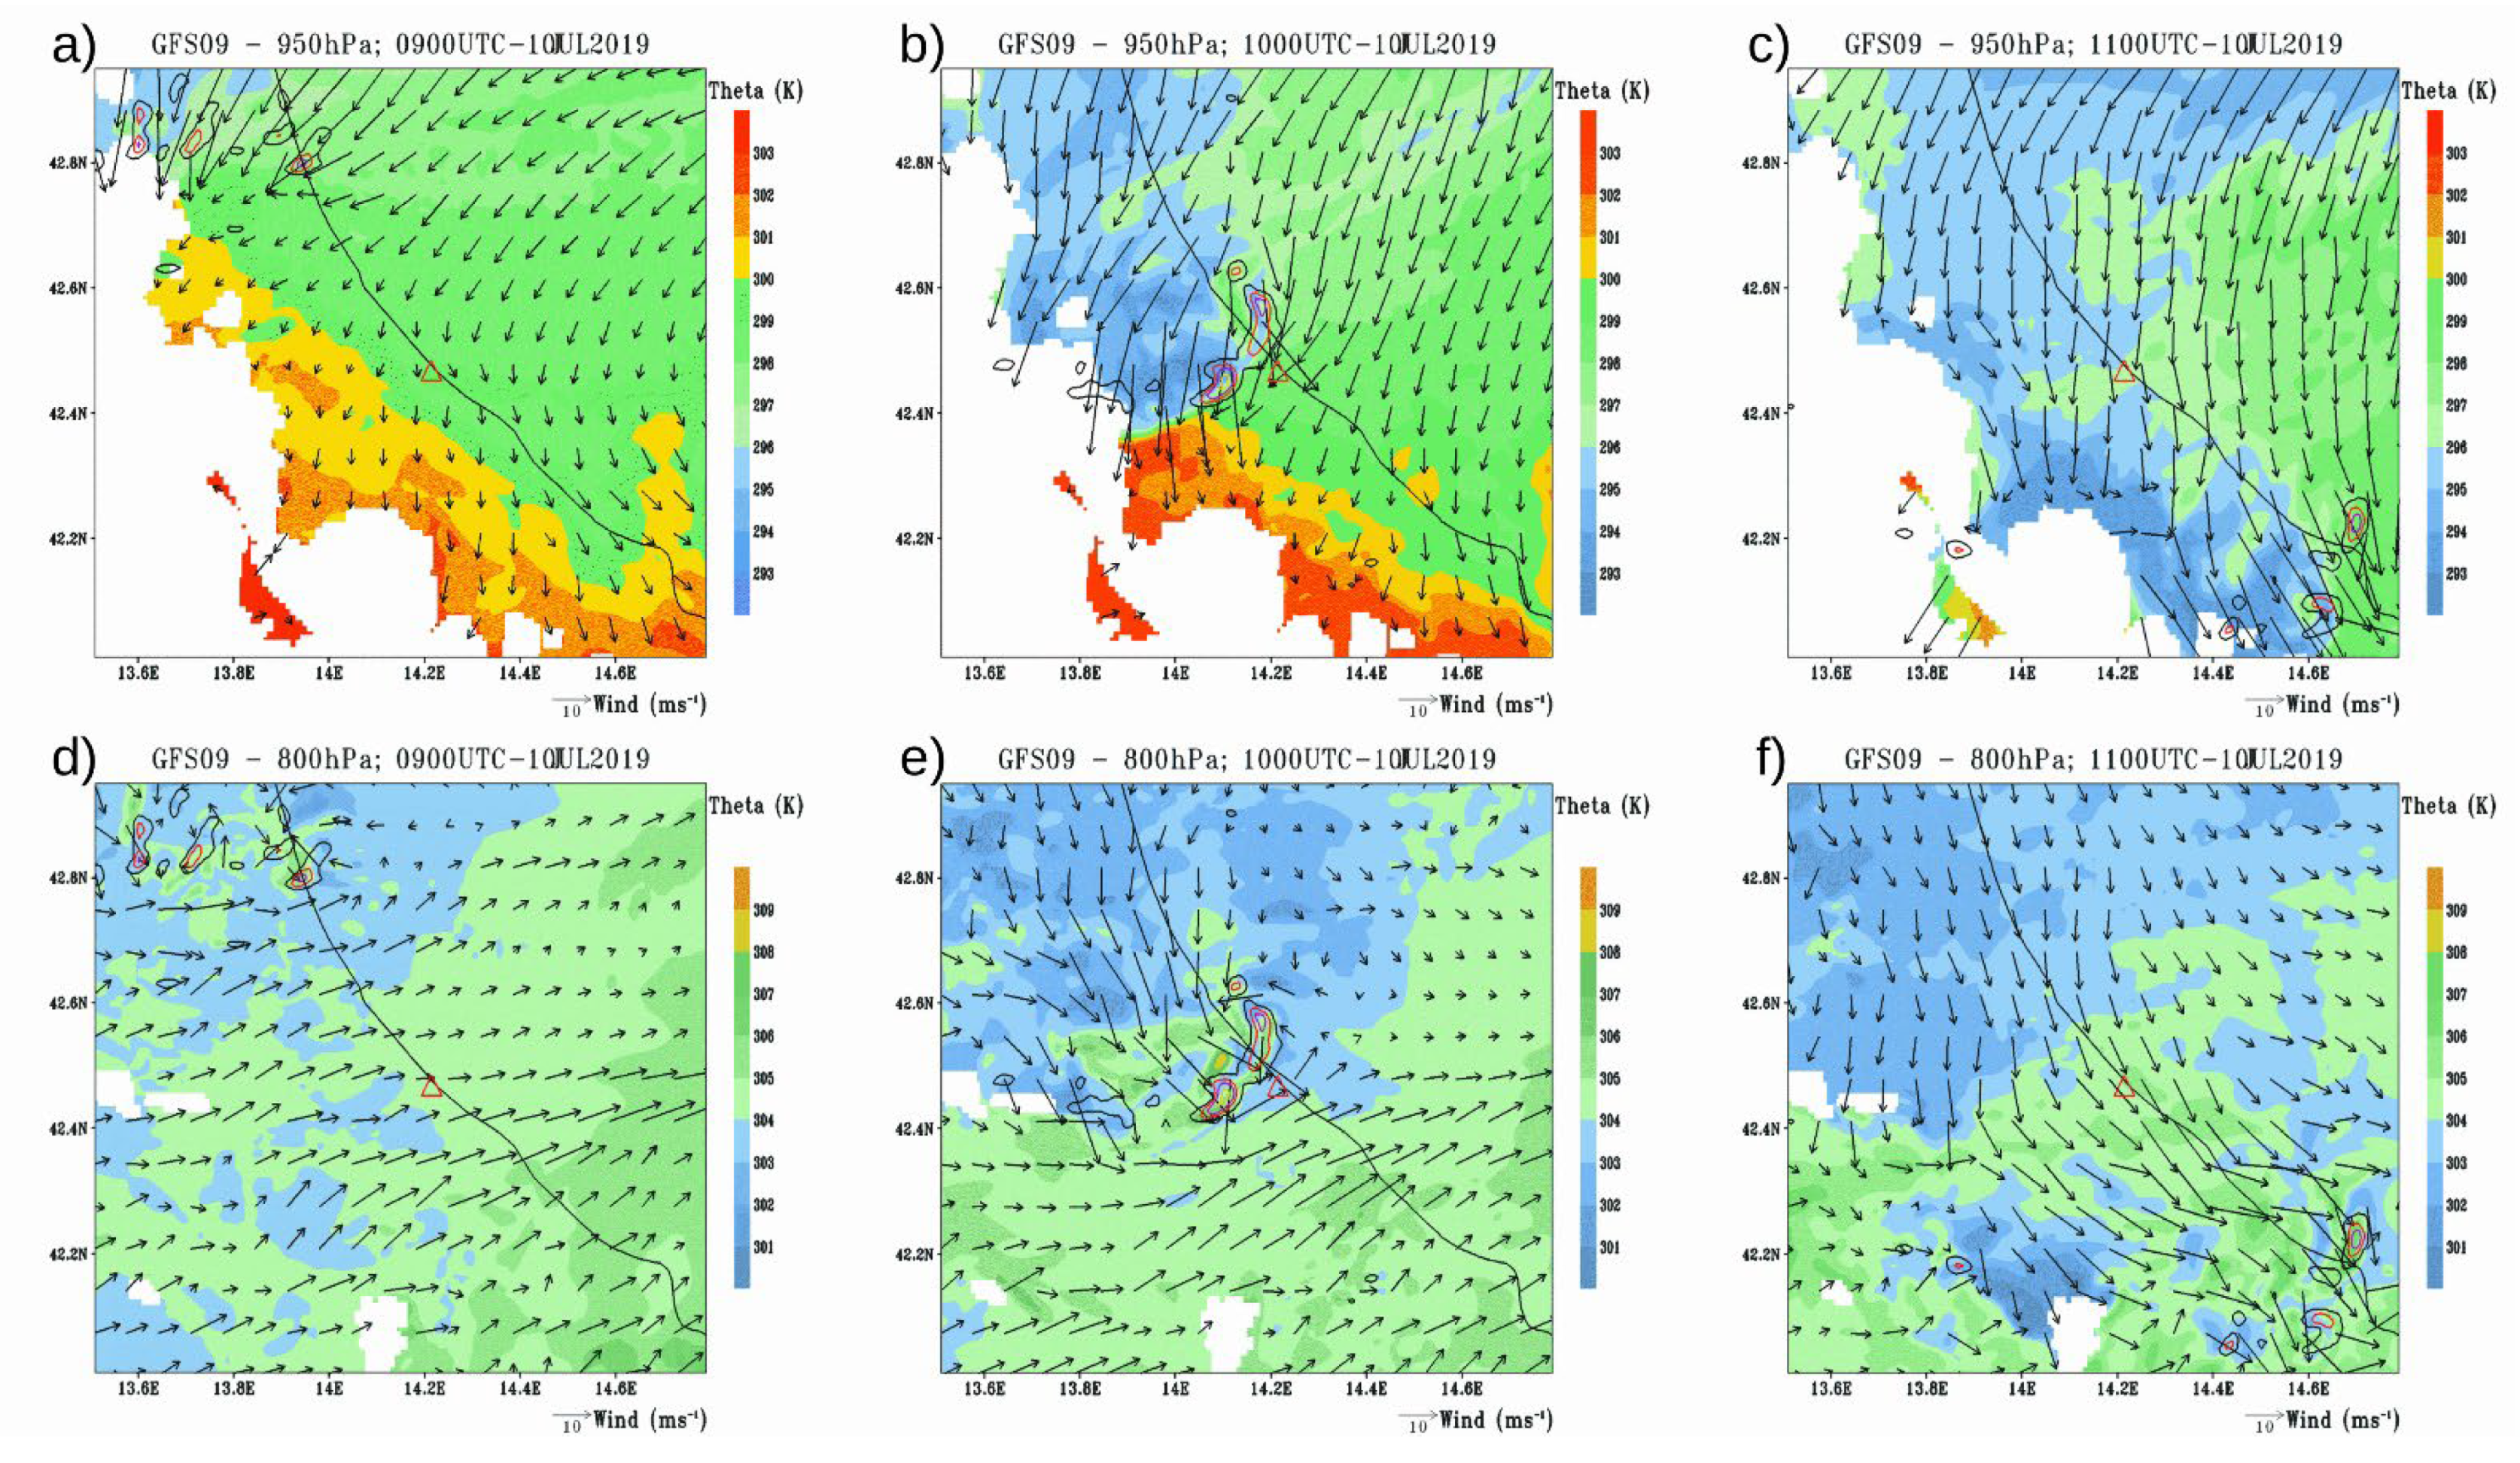
4.2. Development of the Supercell

In this section, the mechanisms responsible for the triggering of the supercell are investigated using the GFS09 run. Figure 8 shows the structure of the wind field modeled in the domain d02 (approximately covering the Adriatic Sea) at four different pressure levels at 08:00 UTC, 10 July 2019, i.e., at an early stage of the convective system lifetime. Intense northeasterlies (Bora) blow over the northern and central Adriatic in the low levels (1000 hPa; Figure 8a). At 850 hPa (Figure 8b), the Bora is confined to the northern Adriatic and the intensity is much weaker than near the ground, whereas in the central Adriatic the wind is weaker than 6 m/s and without a prevailing direction. The situation changes dramatically at 700 hPa (Figure 8c): whereas the wind in the northern Adriatic rotates from northwesterly to northeasterly, and its intensity remains weak, in the central Adriatic the wind shows a strong horizontal gradient, as a consequence of the intense southwesterly flow (35 m/s) crossing the southern Adriatic. The horizontal wind shear is even more apparent at 300 hPa (Figure 8d), where a jet stream of about 40 m/s crosses the southern Adriatic and the Apennines. The city of Pescara appears located near the left exit of the southern branch of the jet stream axis, thus in an area favorable to ascending motion and development of convection. At the same time, the wind pattern at different levels indicates the presence of strong wind shear over the area, thus indicating conditions favorable to supercell development.
Figure 9 shows the wind vectors and potential temperature Θ at 950 hPa (top) and 800 hPa (bottom), modeled in the domain d03, together with the updraft helicity UH. UH identifies the presence of helicoidal vertical motion within the cell, since it is defined as:
U H = z 1 z 2 w ζ d z ;
where w is the vertical wind component and ζ is the vertical component of the vorticity, whereas z1 = 2 km and z2 = 5 km are the extremes of integration. High values of helicity (generally, around 150 m2/s2 or more) indicate the development of mid-level rotation (i.e., mesocyclones). Figure 8 show a zoom on the coast around Pescara in order to enhance readability.
The time evolution shows that at 09:00 UTC some isolated maxima of UH (greater than 250 m s−2) are observed near the coastline (Figure 9a) and one offshore, corresponding to the VMI peaks in Figure 5; both are located at the southern border of the cold air advected from the east. Hence, one may speculate that the cold air arriving in the low-level causes an uplift of the preexisting air, triggering vertical motion. The map at 800 hPa (Figure 9d) shows that counterclockwise rotation can be easily identified around the maxima of UH located closer to the Adriatic coast, thus indicating the presence of a mesocyclonic circulation. At 10:00 UTC (Figure 9b), the UH maxima intensify (greater than 1000 m s−2) as they move southward along the coast, whereas a strong northwesterly wind component can be clearly identified at 800 hPa (Figure 9e). The pattern of UH assumes a linear shape, indicating that the presence of a very strong rear-inflow jet deforms the leading active line of convection into a bow-shaped arrangement (see also Figure 9 in [17]). This behavior generally occurs in the presence of high CAPE and high shear environments, such as in the present case study, as they favor deep lifting and rotation along the border of a strong cold pool. A clear anticlockwise rotation, associated with the mesocyclonic circulation, can be identified especially at the northern end of the line (Figure 9e). Lastly, at 11:00 UTC (Figure 9c), the line loses its coherence, splitting in some UH maxima still located at the southern border of the cold air. Also, the mesocyclonic circulation is no longer apparent (Figure 9f) and the system enters the last phase of its lifetime (comma echo in the Fujita conceptual model [32]).
The values of convective available potential energy (CAPE) are represented in Figure 10 at 10:00 UTC. At that moment, the convective system approaches Pescara from the northwest (cfr. with Figure 9b). Whereas the air behind the system is characterized by a low CAPE (less than 500 J kg−1), extreme instability can be identified ahead (CAPE greater than 3000 J kg−1). Hence, the incoming cold pool has the effect of lifting the unstable airmass up to the level of free convection, overcoming the weak inhibition (not shown), and releasing the instability.
A synthetic sounding and a hodograph extracted from the GFS09 run at the grid point closest to the city of Pescara display the modeled vertical structure at 09:00 UTC (Figure 11). The small inversion at about 900 hPa appears to play a fundamental role in preventing the initial release of the very-high potential instability (CAPE higher than 3000 J kg−1). In less than one hour (not shown), the arrival of northerly winds (Figure 9) cools the boundary layer, so that the inhibition is reduced, and convection can be easily triggered by the uplift induced by the cold air boundary. Moreover, a strong directional shear is apparent in the low levels.
Figure 12 displays the mean hailstone diameter produced by the WRF-HAILCAST model for each configuration. The geographical distributions of the hail produced by the four model realizations correspond to the VMI described in Figure 5 for the convective cloud systems. In Figure 12a, the GFS09 model simulation shows a localized peak greater than 13 cm (16 cm) near Pescara at 10:30 UTC, in excellent agreement with the observations. Although the sensitivity to the initial conditions is significant in terms of position and timing of the cell, the results of the present paper provide a clear indication of the skill of the model in simulating hailstorms, at least when appropriate large-scale forcings are provided.
Remarkably, all four runs simulated hailfall in or near the correct location at the right timing, although with a different intensity, horizontal extent, and timing. With such a set of simulations available in real time, a meteorological office in charge of the weather forecasts in the region would have been able to issue a warning for hailfall in the coast near Pescara, also providing an accurate timing for the occurrence of the event.

5. Conclusions

The present study analyzed the hailstorm that hit the city of Pescara (central Adriatic coast of Italy) between 10:00 and 11:00 UTC, 10 July 2019. The hail was generated by a supercell that originated in the northern Adriatic Sea; the diameter of the hailstones reached 14 cm. The triggering of the supercell was associated with the arrival of the low-level cold Bora wind coming from the Dinaric Alps as it reached the central Adriatic coast. The cold air generated a strong vertical wind shear, mainly concentrated in the low level, which favored mesocyclonic rotation; also, it removed the convective inhibition, associated with a small thermal inversion a few hundred meters above the ground, and lifted the preexistent unstable warm air up to (and above) the tropopause.
The analysis of the event was performed through four numerical simulations performed with the meteorological WRF model, including the HAILCAST module for the simulation of hailstones. The runs started at different initial times and were forced with different large-scale forcings. The model realization forced with GFS and initialized at 00:00 UTC, 9 July 2019 (GFS09) reproduced the supercell in better agreement with the observations. However, all simulations were able to capture the supercell dynamics, although with a slight temporal and spatial shift. Moreover, the mean dimension of the hailstones simulated by HAILCAST was in good agreement with the observations.
The present study underlines the importance of a dedicated module, such as HAILCAST, and of accurate initial conditions for the proper simulation of hailstorms. A better description of such events may have an important impact on real-time forecasting, aimed at civil protection purposes, and may be of strong relevance for insurance companies, also from a climate change perspective.

Author Contributions

Conceptualization, A:T., M.M.M. and S.M.; methodology, A.T., S.M., M.M. and M.M.M.; software, A.T., S.M., M.M., E.P. and G.V.; validation, A.T., S.M., M.M., E.P. and G.V.; formal analysis, A.T., S.M., M.M. and M.M.M.; investigation, A.T., S.M., D.C., A.R., L.B., M.M., E.P., G.V., R.F. and M.M.M.; resources, A.T., S.M., M.M., E.P. and G.V.; data curation, A.T., S.M., A.R., M.M., E.P. and G.V.; writing—original draft preparation, A.T., S.M., M.M., E.P., G.V. and M.M.M.; writing—review and editing, A.T., S.M., D.C., A.R., L.B., M.M., E.P., G.V., R.F. and M.M.M.; visualization, A.T., S.M., D.C., A.R., L.B., M.M., E.P., G.V., R.F. and M.M.M.; supervision, A.T., S.M., D.C., A.R., L.B., M.M., E.P., G.V., R.F. and M.M.M.; project administration, A.T., M.M. and M.M.M. All authors have read and agreed to the published version of the manuscript.

Funding

This research received no external funding.

Informed Consent Statement

Informed consent was obtained from all subjects involved in the study.

Data Availability Statement

Radar and lightings data were obtained from https://www.blitzortung.org, and http://cfa.aquila.infn.it for. IC and BC for the WRF model were obtained from ECMWF (https://www.ecmwf.int) and UCAR (https://rda.ucar.edu). Satellite products derived from the SEVIRU/MSG geostationary mission were obtained from https://www.eumetsat.int.

Acknowledgments

The authors acknowledge the Department of the Italian Civil Protection for the data provided.

Conflicts of Interest

The authors declare no conflict of interest.

References

  1. Rasmussen, R.M.; Heymsfield, A.J. Melting and shedding of graupel and hail. Part I: Model physics. J. Atmos. Sci. 1987, 44, 2754–2763. [Google Scholar] [CrossRef] [Green Version]
  2. Dennis, E.J.; Kumjian, M.R. The impact of vertical wind shear on hail growth in simulated supercells. J. Atmos. Sci. 2017, 74, 641–663. [Google Scholar] [CrossRef]
  3. Martius, O.; Hering, A.; Kunz, M.; Manzato, A.; Mohr, S.; Nisi, L.; Trefalt, S. Challenges and recent advances in hail research. Bull. Am. Meteorol. Soc. 2018, 99, ES51–ES54. [Google Scholar] [CrossRef] [Green Version]
  4. Raupach, T.H.; Martius, O.; Allen, J.T.; Kunz, M.; Lasher-Trapp, S.; Mohr, S.; Rasmussen, K.L.; Trapp, R.J.; Zhang, Q. The effects of climate change on hailstorms. Nat. Rev. Earth Environ. 2021, 2, 213–226. [Google Scholar] [CrossRef]
  5. Sánchez, J.L.; Marcos, J.L.; Dessens, J.; López, L.; Bustos, C.; García-Ortega, E. Assessing sounding-derived parameters as storm predictors in different latitudes. Atmos. Res. 2009, 93, 446–456. [Google Scholar] [CrossRef]
  6. Nisi, L.; Martius, O.; Hering, A.; Kunz, M.; Germann, U. Spatial and temporal distribution of hailstorms in the Alpine region: A long-term, high resolution, radar-based analysis. Q. J. R. Meteorol. Soc. 2016, 142, 1590–1604. [Google Scholar] [CrossRef]
  7. Bluestein, H.B.; Lindsey, D.T.; Bikos, D.; Reif, D.W.; Wienhoff, Z.B. The Relationship between Overshooting Tops in a Tornadic Supercell and Its Radar-Observed Evolution. Mon. Weather Rev. 2019, 147, 4151–4176. [Google Scholar] [CrossRef]
  8. Punge, H.; Bedka, K.; Kunz, M.; Reinbold, A. Hail frequency estimation across Europe based on a combination of overshooting top detections and the era-interim reanalysis. Atmos. Res. 2017, 198, 34–43. [Google Scholar] [CrossRef]
  9. IPCC. Managing the Risks of Extreme Events and Disasters to Advance Climate Change Adaptation; Special Report of the Intergovernmental Panel on Climate Change; Cambridge University Press: Cambridge, UK, 2012. [Google Scholar] [CrossRef]
  10. Gleeson, T.; Wang-Erlandsson, L.; Porkka, M.; Zipper, S.C.; Jaramillo, F.; Gerten, D.; Fetzer, I.; Cornell, S.E.; Piemontese, L.; Gordon, L.J.; et al. Illuminating water cycle modifications and earth system resilience in the anthropocene. Water Resour. Res. 2020, 56, e2019WR024957. [Google Scholar] [CrossRef] [Green Version]
  11. Punge, H.J.; Bedka, K.; Kunz, M.; Werner, A. A new physically based stochastic event catalog for hail in Europe. Nat. Hazards 2014, 73, 1625–1645. [Google Scholar] [CrossRef]
  12. Miglietta, M.M.; Manzato, A.; Rotunno, R. Characteristics and Predictability of a Supercell during HyMeX SOP1. Q. J. R. Meteorol. Soc. 2016, 142, 2839–2853. [Google Scholar] [CrossRef]
  13. Miglietta, M.M.; Mazon, J.; Rotunno, R. Numerical simulations of a tornadic supercell over the Mediterranean. Weather Forecast. 2017, 32, 1209–1226. [Google Scholar] [CrossRef]
  14. Miglietta, M.M.; Mazon, J.; Motola, V.; Pasini, A. Effect of a positive Sea Surface Temperature anomaly on a Mediterranean tornadic supercell. Sci. Rep. 2017, 7, 12828. [Google Scholar] [CrossRef] [Green Version]
  15. Manzato, A. Hail in NE Italy: Climatology and bivariate analysis with the sounding–derived indices. J. Appl. Meteorol. Clim. 2012, 51, 449–467. [Google Scholar] [CrossRef]
  16. Manzato, A.; Cicogna, A.; Pucillo, A. 6-hour maximum rain in Friuli Venezia Giulia: Climatology and ECMWF-based forecasts. Atmos. Res. 2016, 169, 465–484. [Google Scholar] [CrossRef]
  17. Montopoli, M.; Picciotti, E.; Baldini, L.; Di Fabio, S.; Marzano, F.S.; Vulpiani, G. Gazing inside a giant-hail-bearing Mediterranean supercell by dual-polarization Doppler weather radar. Atmos. Res. 2021, 264, 105852. [Google Scholar] [CrossRef]
  18. Miglietta, M.M.; Davolio, S. Dynamical forcings in heavy precipitation events over Italy: Lessons from the HyMeX SOP1 campaign. Hydrol. Earth Syst. Sci. 2022, 3, 627–646. [Google Scholar] [CrossRef]
  19. Manzato, A.; Riva, V.; Tiesi, A.; Miglietta, M.M. Observational analysis and simulations of a severe hailstorm in northeastern Italy. Q. J. R. Meteorol. Soc. 2020, 146, 3587–3611. [Google Scholar] [CrossRef]
  20. Skamarock, W.C.; Klemp, J.B.; Dudhia, J.; Gill, D.O.; Liu, Z.; Berner, J.; Wang, W.; Powers, J.G.; Duda, M.G.; Barker, D.M.; et al. A Description of the Advanced Research WRF Model Version 4; No. NCAR/TN-556+STR; National Center for Atmospheric Research: Boulder, CO, USA, 2019. [Google Scholar] [CrossRef]
  21. Brimelow, J.C.; Reuter, G.W.; Poolman, E.R. Modeling maximum hail size in Alberta thunderstorms. Weather Forecast. 2002, 17, 1048–41062. [Google Scholar] [CrossRef]
  22. Adams-Selin, R.D.; Ziegler, C.L. Forecasting hail using a one-dimensional hail growth model within WRF. Mon. Weather Rev. 2016, 144, 4919–4939. [Google Scholar] [CrossRef]
  23. Adams-Selin, R.D.; Clark, A.J.; Melick, C.J.; Dembek, S.R.; Jirak, I.L.; Ziegler, C.L. Evolution of WRF-HAILCAST during the 2014–16 NOAA/hazardous weather testbed spring forecasting experiments. Weather Forecast. 2019, 34, 61–79. [Google Scholar] [CrossRef]
  24. Dotzek, N.; Groenemeijer, P.; Feuerstein, B.; Holzer, A.M. Overview of essl’s severe convective storms research using the european severe weather database eswd. Atmos. Res. 2009, 93, 575–586. [Google Scholar] [CrossRef] [Green Version]
  25. Hong, S.-Y.; Lim, J.-O.J. The WRF single-moment 6-class microphysics scheme (WSM6). J. Korean Meteorol. Soc. 2006, 42, 129–151. [Google Scholar]
  26. Mlawer, E.J.; Taubman, S.J.; Brown, P.D.; Iacono, M.J.; Clough, S.A. Radiative transfer for inhomogeneous atmospheres: RRTM, a validated correlated-k model for the longwave. J. Geophys. Res. 1997, 102, 16663–16682. [Google Scholar] [CrossRef] [Green Version]
  27. Dudhia, J. Numerical study of convection observed during the Winter Monsoon experiment using a mesoscale two-dimensional model. J. Atmos. Sci. 1989, 46, 3077–3107. [Google Scholar] [CrossRef]
  28. Tewari, M.; Chen, F.; Wang, W.; Dudhia, J.; LeMone, M.A.; Mitchell, K.; Ek, M.; Gayno, G.; Wegiel, J.; Cuenca, R.H. Implementation and verification of the unified NOAH land surface model in the WRF model. In Proceedings of the 20th Conference on Weather Analysis and Forecasting/16th Conference on Numerical Weather Prediction, Seattle, WA, USA, 12–16 January 2004; American Meteorological Society: Boston, MA, USA. [Google Scholar]
  29. Hong, S.-Y.; Noh, Y.; Dudhia, J. A new vertical diffusion package with an explicit treatment of entrainment processes. Mon. Weather Rev. 2006, 134, 2318–2341. [Google Scholar] [CrossRef] [Green Version]
  30. Kain, J.S. The Kain–Fritsch convective parameterization: An update. J. Appl. Meteorol. 2004, 43, 170–181. [Google Scholar] [CrossRef] [Green Version]
  31. Malečić, B.; Prtenjak, M.T.; Horvath, K.; Jelić, D.; Jurković, P.M.; Ćorko, K.; Mahović, N.S. Performance of HAILCAST and the Lightning Potential Index in simulating hailstorms in Croatia in a mesoscale model—Sensitivity to the PBL and microphysics parameterization schemes. Atmos. Res. 2022, 272, 106143. [Google Scholar] [CrossRef]
  32. Fujita, T.T. Manual of Downburst Identification for Project Nimrod; Satellite and Mesometeorology Research Paper; Department of Geophysical Sciences, University of Chicago: Chicago, IL, USA, 1978; p. 156. [Google Scholar]
Figure 1. NCEP analysis of the temperature at 850 hPa and the geopotential height at 500 hPa at 06:00 UTC, 10 July 2019.
Atmosphere 13 01219 g001
Figure 2. Composite radar VMI at 10:00 (a), 10:30 (b), and 10:55 UTC (c), 10 July 2019. The images are retrieved from the Italian Radar Network data.
Atmosphere 13 01219 g002
Figure 3. Lightning strokes on 10 July 2019: (a) lightning strokes between 08:00 and 10:00 UTC, (b) strokes between 10:00 and 12:00 UTC. Images are built from blitzortung network data (https://www.blitzortung.org accessed on 20 January 2022). In the map the codes RM, AQ, and PE correspond to Rome, L’Aquila, and Pescara, respectively.
Atmosphere 13 01219 g003
Figure 4. The three nested domains d01, d02, and d03, set for the WRF-HAILCAST simulations.
Atmosphere 13 01219 g004
Figure 5. Simulated VMI (dBZ) at 7 instants from 08:00 until 11:00 UTC, 10 July 2019, according to: GFS09 (a), GFS10 (b), IFS09 (c), and IFS10 (d). In order to avoid superimposition between VMIs and to allow readability, the VMI values below 40 dBz are cut off.
Atmosphere 13 01219 g005
Figure 6. Cloud top height product retrieved by SEVIRI/MSG (MSGCLTH) (a), GFS09 vertical wind component w (b), and QICE (c) at 10:00 UTC 10 July 2019. The red triangle indicates the city of Pescara.
Atmosphere 13 01219 g006
Figure 7. Temperature at 850 hPa at 09:00 UTC, 10 July 2019, according to: GFS09 (a), GFS10 (b), IFS09 (c), and IFS10 (d).
Atmosphere 13 01219 g007
Figure 8. Run GFS09 at 08:00 UTC, 10 July 2019. Wind at 1000 hPa (a), 850 hPa (b), 700 hPa (c), and 300 hPa (d).
Atmosphere 13 01219 g008
Figure 9. Run GFS09 at 08:00 UTC, 10 July 2019. Θ and wind vectors at 950 hPa at 09:00 (a), 10:00 (b), and 11:00 UTC (c); Θ and wind vectors at 800 hPa at 09:00 (d), 10:00 (e), and 11:00 UTC (f). In the maps, the contour lines near the convective system represent UH: contours in black, red, purple, and yellow correspond to 50, 250, 500, and 1000 m 2 s−2, respectively. The red triangle indicates the city of Pescara.
Atmosphere 13 01219 g009
Figure 10. Run GFS09. CAPE at 10:00 UTC, 10 July 2019.
Atmosphere 13 01219 g010
Figure 11. Run GFS09. Skew-T and hodograph at the grid point closest to Pescara at 09:00 UTC, 10 July 2019.
Atmosphere 13 01219 g011
Figure 12. Mean hail diameter simulated every 30 min from 08:00 until 11:00 UTC, 10 July 2019, according to GFS09 (a), GFS10 (b), IFS09 (c), and IFS10 (d).
Atmosphere 13 01219 g012
Publisher’s Note: MDPI stays neutral with regard to jurisdictional claims in published maps and institutional affiliations.

