Article

Higher Heat Stress Increases the Negative Impact on Rice Production in South China: A New Perspective on Agricultural Weather Index Insurance

1
Anhui Agrometeorological Center, Hefei 230031, China
2
Atmospheric Science and Satellite Remote Sensing Key Laboratory of Anhui Province, Anhui Meteorological Institute, Hefei 230031, China
3
Anhui Climate Center, Hefei 230031, China
*
Authors to whom correspondence should be addressed.
Atmosphere 2022, 13(11), 1768; https://doi.org/10.3390/atmos13111768
Submission received: 7 September 2022 / Revised: 23 October 2022 / Accepted: 25 October 2022 / Published: 27 October 2022
(This article belongs to the Special Issue Meteorological Extremes in China)

Abstract

:
Rice is a major staple food grain for more than half of the world’s population, and China is the largest rice producer and consumer in the world. In a climate-warming context, the frequency, duration and intensity of heat waves tend to increase, and rice production will be exposed to higher heat damage risks. Understanding the negative impacts of climate change on the rice supply is a critical issue. In this study, a new perspective on agricultural weather index insurance is proposed to investigate the impact of extreme high-temperature events on rice production in South China in the context of climate change. Based on data from meteorological stations in Anhui Province in China from 1961 to 2018 and the projected data from five Global Climate Models under three representative concentration pathway (RCP) scenarios from 2021 to 2099, the spatial–temporal characteristics of heat stress and its influence on rice production were analyzed by employing a weather index insurance model. The interdecadal breakpoints in the trends of the heat stress weather insurance index (HSWI) and the payout from 1961 to 2018 in 1987 were both determined, which are consistent with the more significant global warming since the 1980s. The largest increase after 1987 was found in the southeastern part of the study area. The projected HSWI and the payout increased significantly from 2021 to 2099, and their growth was faster with higher radiative forcing levels. The HSWI values were on average 1.4 times, 3.3 times and 6.1 times higher and the payouts were on average 3.9 times, 9.8 times and 15.0 times higher than the reference values for the near future, mid-future and far future, respectively. The results suggest that a more severe influence of heat damage on rice production will probably happen in the future, and it is vital to develop relevant adaptation strategies for the effects of a warmer climate and heat stress on rice production. This paper provides an alternative way to transform the evaluation of the extreme climate event index into the quantitative estimation of disaster impacts on crop production.

1. Introduction

Rice is one of the most important staple food crops in the world [1]. Being the largest rice producer and consumer, China’s total rice production was about 27.7% of the global rice production, with nearly 18.5% of the global rice farming area [2]. The livelihood of most of the world’s population relies on rice. Therefore, it is essential to study the impact of climate change on rice yields.
Rice growth and productivity are affected by climatic factors. Temperature is the most important climatic variable and needs more attention in the context of climate change since most rice production in China is irrigated [3]. Temperatures below or above the threshold required for rice growth, especially during crucial developmental stages, such as the blooming and filling stages, can have negative impacts on rice growth [4,5]. Long exposure to high temperatures may cause sterility in rice plants by affecting dehiscence, pollination and pollen germination [6,7,8,9,10,11]. Moreover, high temperatures affect rice production by shortening the filling stage, leading to reduced yields [12,13,14].
In the past few decades, extreme climate and weather events, particularly heat stress, have occurred more frequently and led to large negative consequences on crop yields [15]. In 2003, 2013, 2017 and 2022, large-scale sustained high-temperature events occurred in China, which had serious impacts on agriculture, especially rice production in South China. Moreover, in a climate-warming context, the frequency, duration and intensity of heat waves will tend to increase in China in the future [16]. As a result, rice production will be exposed to higher heat damage risks. It is estimated that the global farming area of rice suffering from heat stress will increase from 8% to 27% from the 2000s to the 2050s [17,18,19]. If the average annual temperature is projected to increase by 1.5 and 2.0 °C, a reduction of 2% and 5% in rice yield will occur due to heat stress in China [20]. Therefore, extreme high-temperature events are expected to have increasingly negative impacts on rice production in China [21,22,23,24,25].
Insurance payout evaluation is one of the methods to estimate the impacts of meteorological disasters. Some studies have focused on estimating the impact of global natural disasters by employing the insurance payout [26,27,28,29]. Agricultural weather index insurance was a new insurance form emerging in the late 1990s. The premium rate and payout of weather index insurance were both determined on the basis of meteorological data. Thus, the payout of weather index insurance is not based on actual losses experienced by policyholders but on the weather index, which is highly correlated with actual losses [30]. This new insurance form has gained wide attention and has been discussed and applied in many countries around the world because of its objectivity, standardization and negotiability [31,32,33,34,35,36]. Moreover, quantitative models have been established so that the weather insurance index can be directly related to economic losses due to damages. Thus, with the help of a weather index insurance model, not only can the spatial–temporal characteristics of meteorological disasters be analyzed by using the weather index, but the impact of extreme climate events can also be quantitatively assessed based on the insurance payout.
In this study, we focused on investigating the impact of increasingly high temperatures on rice production by employing an agricultural weather index insurance model. Taking rice production in Anhui Province as an example, the spatial–temporal characteristics of heat stress and its influence in the past and future were analyzed. Meteorological observations from 1961 to 2018 and projected data from five Global Climate Models (GCMs) from 2021 to 2099 were used in this study. Section 2 and Section 3 describes the study area, data and methodology. Section 4 presents the results on the spatial–temporal characteristics of heat stress and its influence on rice production. Finally, Section 5 and Section 6 summarizes the results and presents our conclusions and discussion.

2. Data

2.1. Observation Data

The study was carried out in Anhui Province. Anhui is located in the eastern part of South China and includes developed agriculture. It is also in the transitional region between the warm temperate zone and the subtropical zone. With Huai River as the dividing line, the area north of the Huai River has a warm temperate semi-humid monsoon climate, while the area south of the Huai River has a subtropical humid monsoon climate. The annual average air temperature of Anhui Province ranges between 14.5 and 17.2 °C, which is higher in the southern part than in the northern part and higher in the plains than in the mountains. Anhui has four distinct seasons and is cold in winter and hot in summer. The air temperature is lowest in January at 2.7 °C and reaches its peak in July at 28.0 °C. The annual precipitation ranges between 747 and 1798 mm and is greater in the south than in the north and greater in the mountains than in the plains. Of the four seasons, summer has the most precipitation, followed by spring and autumn, while winter has the least. However, the transitional climate and complex terrain lead to the frequent occurrence of meteorological disasters. Rice is one of the most important food crops and mainly planted in the area south of the Huai River in Anhui Province. The data used in this study are the boreal summer (June to August) daily maximum air temperature data for the period from 1961 to 2018 at 62 meteorological stations in Anhui Province from the National Meteorological Information Center (NMIC) of the China Meteorological Administration (CMA). The spatial distribution of the 62 meteorological stations is shown in Figure 1. All of the above meteorological observations were carefully checked by NMIC using quality control procedures.

2.2. Model Data

Data from five GCMs from the Inter-Sectoral Impact Model Intercomparison Project (ISI-MIP) archive were used as input: GFDL-ESM2M (GFDL), HaDGem2-ES (HadGem), IPSL_CM5A_LR (IPSL), MIROC-ESM-CHEM (MIROC) and NorESM1-M (NorESM). The available climate model outputs are bilinearly interpolated in space to a 0.5 × 0.5 grid. The model data covered the period from 1 January 1950 to 31 December 2099 [37]. The two periods from 1950 to 2005 and 2006 to 2099 are often considered historical and projection periods, respectively. In addition, three representative concentration pathway (RCP) scenarios [38], namely, RCP4.5, RCP6.0 and RCP8.5, were selected. RCP4.5 and RCP6.0 represent scenarios under two different government climate policies, while RCP8.5 is a counter-policy against the established policy, which is used to discuss extreme situations in this paper.
Here, we mainly used data for a 30-year baseline period (1976 to 2005) and a 79-year period until the end of this century (2021 to 2099). The rice heat stress weather insurance index (HSWI) and the payout were estimated for the near future (2021 to 2040), mid-future (2041 to 2070) and far future (2071 to 2099) in the 21st century using a weather index insurance model driven by the 5 GCMs mentioned above under 3 RCPs.

3. Methods

3.1. Rice Heat Stress Weather Index Insurance Model

Rice heat stress in Anhui Province mainly occurs from July to August, just from the booting to filling stages, and will induce rice yield loss. The following steps are required to establish the rice heat stress weather insurance index (HSWI). Firstly, a high-temperature process is defined as a period of more than three consecutive days with daily maximum air temperatures greater than or equal to 35 °C from 21 July to 15 August. Secondly, the daily effective high-temperature difference (∆T) of each process is calculated as the difference between the daily maximum air temperature and 35 °C from the start date. Finally, each ∆T of every process from 21 July to 15 August is summed to obtain the HSWI [36]. So, the HSWI is calculated as
H S W I = i = d 1 d 2 Δ T = i = d 1 d 2 ( T i 35 )
where d1 and d2 denote the start date and the end date of each high-temperature process from 21 July to 15 August, and Ti is the daily maximum air temperature.
The trigger value and payout standard (Table 1) of heat stress weather index insurance were determined by historical climate data and the rice yield loss due to heat stress [36]. The trigger value is 10 °C, and the payout (CNY (RMB) mu−1) is calculated as [36]
P a y o u t = ( H S W I C ) × A + B
where C denotes the trigger value, A is the payout coefficient, and B is the payout base [36]. The HSWI was first calculated based on the daily maximum temperature using Equation (1). Then, according to the range that the HSWI belonged to, the corresponding C, A and B were found from Table 1. Finally, the payout was estimated by Equation (2) with the HSWI, C, A and B values above.
In the context of climate warming, rice growth will occur 7 days, 12 days and 16 days earlier in the near future, mid-future and far future under RCP4.5 in Anhui Province [39]. Thus, the HSWI under the 3 RCPs in the future was evaluated considering the advanced rice growth periods shown in Table 2.

3.2. Bias Correction Methods

The downscaling method is an effective way to transform model data into the local scale and improve the accuracy of projections. The spatial disaggregation and bias correction (SDBC) method [40] was applied to obtain the downscaled daily maximum air temperature data from the 5 GCMs for the two periods from 1961 to 2005 and 2021 to 2099. It has two steps. Firstly, the model data are interpolated to the station by inverse distance weighting (IDW). The control point number of neighbors of IDW is 4, and the weighting function is the inverse power of the distance [41]. Secondly, the interpolated data of the model are bias-corrected based on the station observation data using the quantile mapping approach, which focuses not only on the mean of the distribution but also on correcting the quantiles of the distribution [40,41,42,43]. The cumulative probability distribution function (CDF) of the daily maximum air temperature is first estimated from the simulation data in the calibration period (1961–2005), and then the corresponding percentile values of the model projections are found. The corrected projections can be derived through the inverse CDF of the observations [42]. If some of the observed values fall out of the range in the control simulation, the quantile–quantile relationship needs to be extrapolated beyond the simulated range [43].

3.3. Model Performance Evaluation

The performance of the 5 GCMs and multi-model ensemble (MME) before and after bias correction was evaluated by employing a Taylor diagram [44] based on simulations and observations from 1961 to 2005 (Figure 2). After bias correction, the mean of the simulations of 5 GCMs ranged from 8.6 to 10 °C, closer to the mean of observations (9.1 °C) than that before correction. Moreover, the root-mean-square errors (RMSEs) were greatly reduced, and the correlation coefficients (R) between the simulations and the observations were higher. Among the 5 GCMs, the NorESM1-M model showed the highest performance with the largest R (0.56) and lowest RMSE (0.86 °C) in Anhui Province. Therefore, the corrected simulations of the HSWI with the NorESM1-M model were selected and applied in this study.

3.4. Piecewise Linear Fitting Model (PLFIM)

The piecewise linear fitting model (PLFIM) put forward by Tomé and Miranda [45] was used to examine the transition of trends in the long time series of the HSWI and payout. The PLFIM can judge when trend turning takes place based on the given discriminatory condition, determine the best combination of segments and yield the test results of the trend turning points on the imposed time scale and the linear trend for each time segment.
With the PLFIM, we estimated the breakpoints and trends of two time segments separated by the breakpoints in the HSWI and payout series (1961 to 2018) for the whole study area. In our calculations, two restrictions were made for our data. Firstly, because of the short time span (58 years) in this study, we assumed that only one breakpoint existed in the series of the HSWI and payout. Secondly, we ensured that the two divided time segments were both longer than 10 years. The discriminatory condition was the changing sign or the changing significance of linear trends between the two consecutive time segments.

4. Results

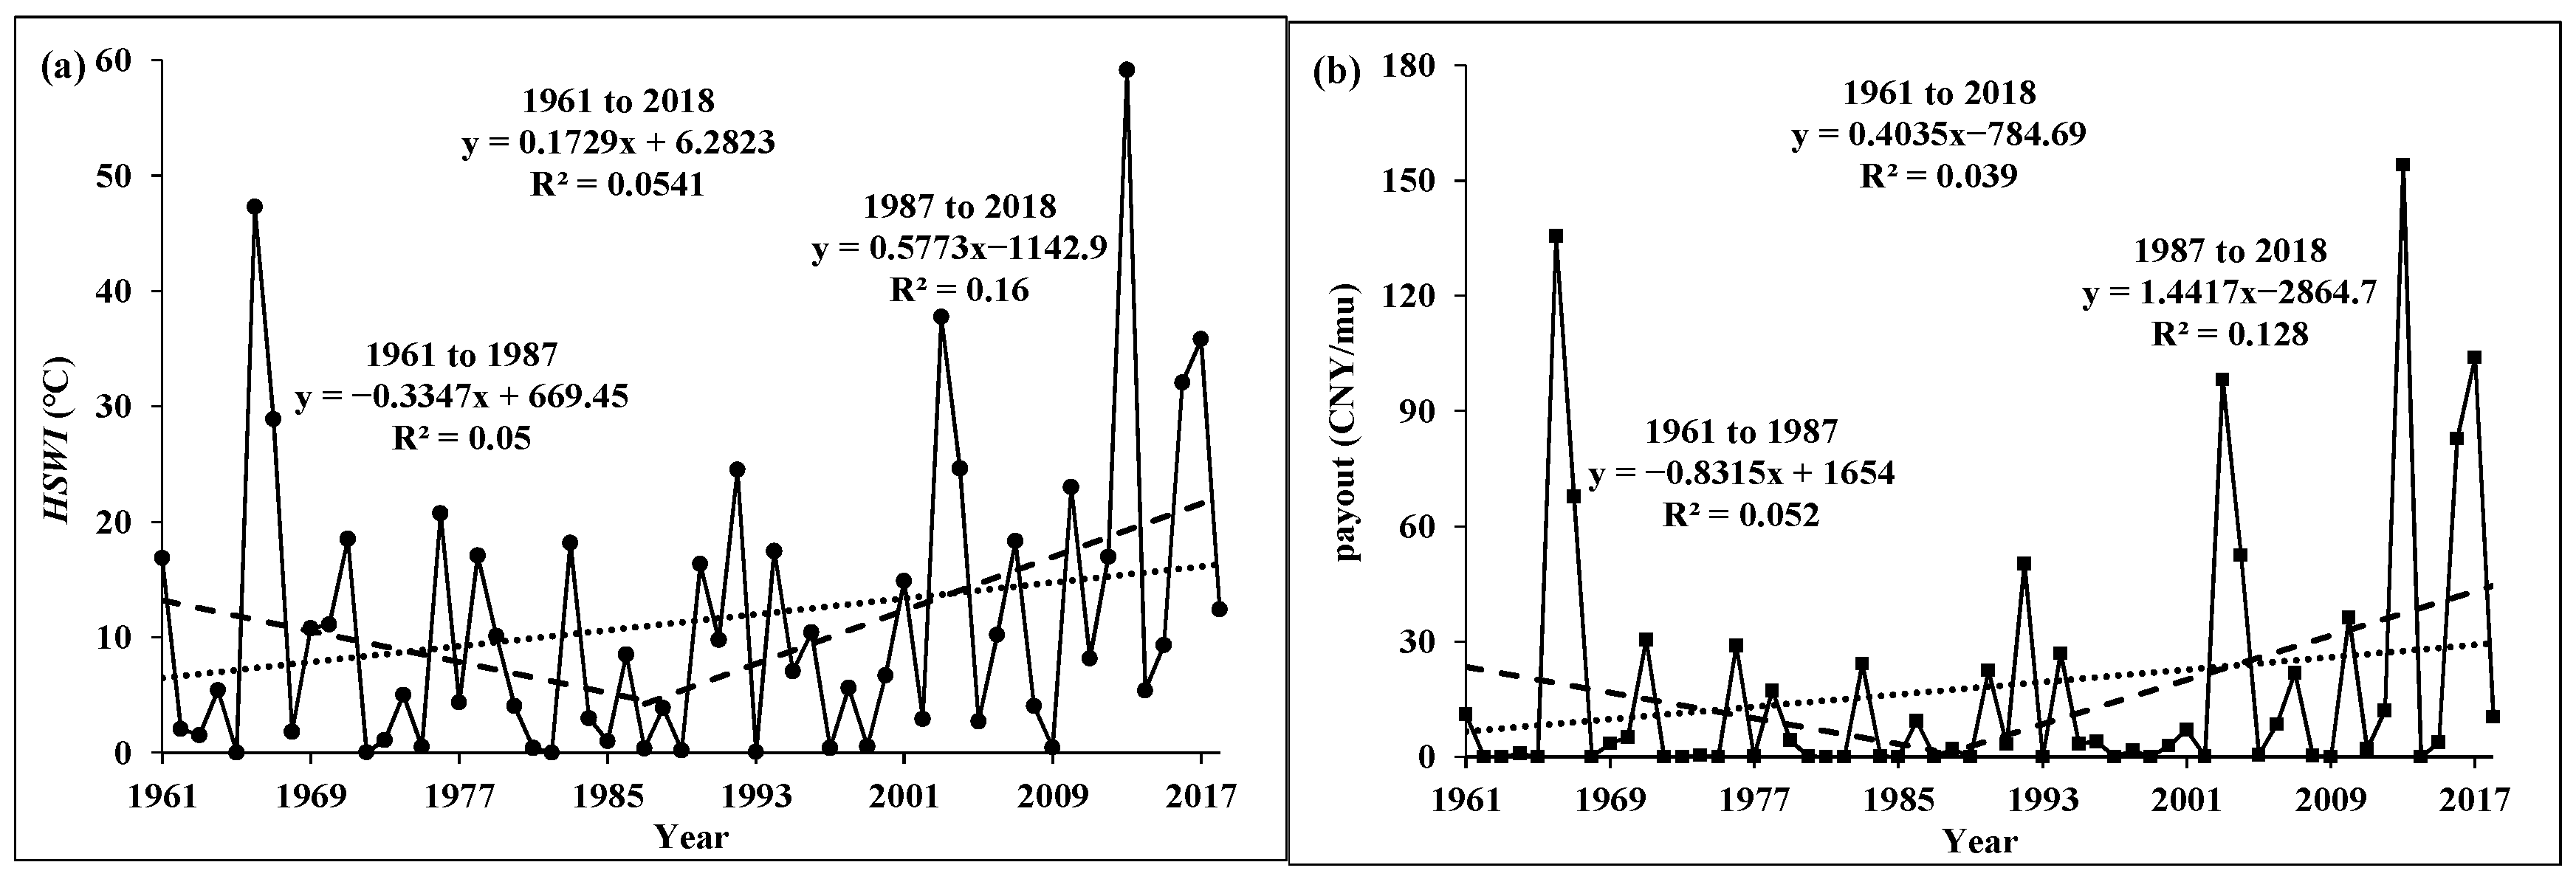
4.1. Spatial–Temporal Characteristics of HSWI and Payout Based on Observations

The HSWI can reflect the level of heat stress, and the payout can be regarded as a quantitative expression of the impact. Figure 3 shows the spatial distribution of the HSWI and the insurance payout based on observations. The HSWI and its payout ranged between 2.6 and 28.3 °C and 1.0 and 67.4 CNY mu−1, with an average of 12.8 °C and 21.3 CNY mu−1 in the study area. The HSWI and the payout both had similar spatial distributions to that of the maximum air temperature and were larger in the south than in the north of Anhui Province. HSWI values higher than 13.0 °C were found in the area south of the Yangtze River and the northwestern part of the Yangtze–Huai River Basin and led to a large payout of over 20 CNY mu−1, while the values were from 5.5 to 13.0 °C in most other areas with a payout less than 20 CNY mu−1. Notably, the payout in the western part of the area south of the Yangtze River was over 40 CNY mu−1, which is 2 to 3 times more than that of other areas. The largest HSWI (higher than 20 °C) detected in this area suggests more serious heat stress.
As shown in Figure 4, in the period from 1961 to 2018, the HSWI and the payout increased at rates of 1.7 °C per decade (p < 0.1) and 4.0 CNY mu−1 per decade (p < 0.1) in the study area as a whole. In the 1960s, the HSWI reached its highest value (47.3 °C) in 1966 with a payout of 135.5 CNY mu−1, then declined from the 1970s to the 1980s and rose again in the 1990s. The interdecadal breakpoints in HSWI trends were detected in 1987 using Tomé and Miranda’s piecewise linear fitting model (PLFIM) [45]. The HSWI decreased slightly at a rate of −3.3 °C per decade before 1987 and increased significantly at a rate of 5.8 °C per decade after 1987. Especially since the beginning of the 21st century, very high values occurred in 2003 (37.8 °C), 2013 (59.1 °C) and 2017 (35.9 °C). The highest payout was 154.1 CNY mu−1 in 2013. From 1971 to the 2000s, HSWI values less than the trigger value (10 °C) resulted in zero payouts, despite the occurrence of mild heat damage. The average payout (33.0 CNY mu−1) from 2001 to 2018 was about 3 times more than that in the period from 1971 to 2000 (7.8 CNY mu−1), indicating significantly increased losses caused by heat stress since 2001.
Global warming was determined to be more significant after the 1980s. From 1987 to 2018, the HSWI and the payout increased at all meteorological stations in the study area, and the variation rates ranged from 2.0 to 11.5 °C per decade and 3.0 to 31.7 CNY mu−1 per decade, respectively. The largest increasing trend was found in the area south of the Yangtze River, followed by the middle part of the Yangtze–Huai River Basin, and the western mountain area had the smallest (Figure 5).

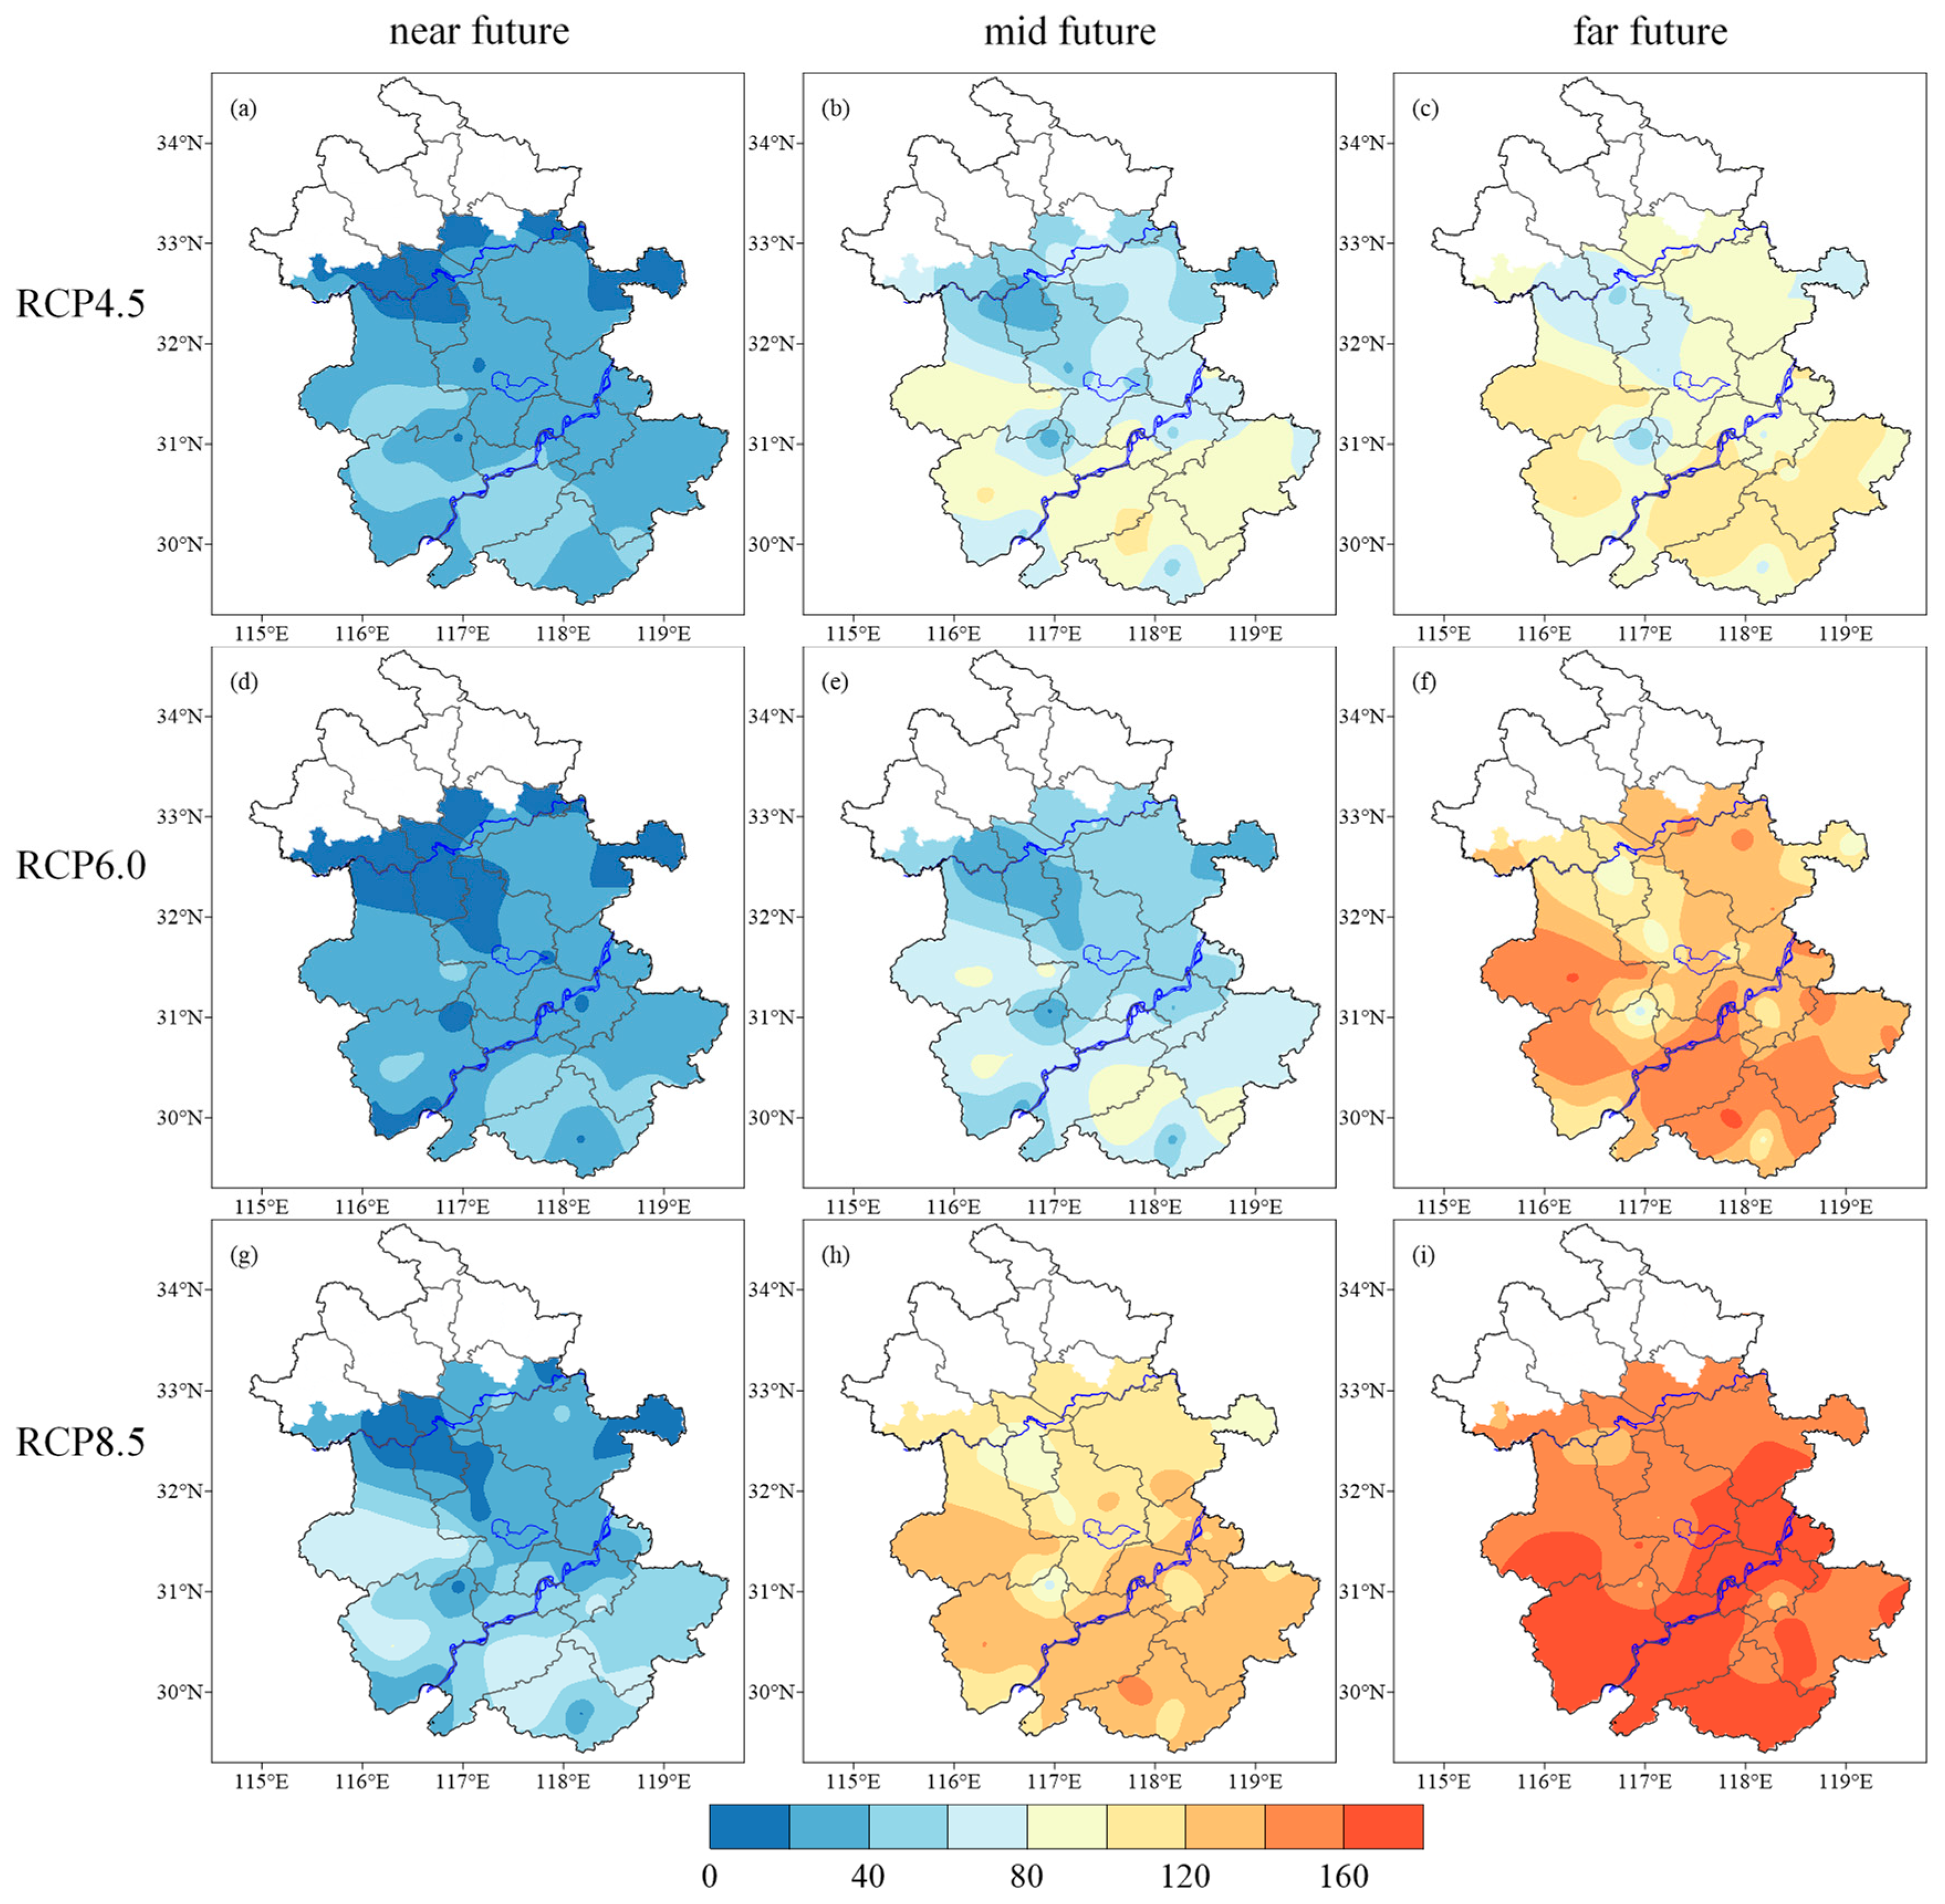
4.2. Spatial–Temporal Characteristics of HSWI and Payout Based on Projections

The analysis of observed data in Section 4.1 showed that the HSWI and its payout could reflect the intensity and impact of rice heat stress, and the increasing trends are consistent with climate warming. The IPCC reported that the rising CO2 concentration will lead to further warming and a significant increase in high-temperature days [46]. With global warming of 1.5 °C and 2.0 °C, the estimated annual high-temperature days with a daily maximum air temperature greater than or equal to 35 °C in Anhui Province will probably increase by 10 and 18 days compared with that in the baseline period [39]. As a result, the growth and productivity of rice will be significantly influenced by heat stress.
From 2021 to 2099, the projected HSWI showed marked interannual fluctuations and increased significantly at rates of 5.2 °C per decade (p < 0.001), 7.2 °C per decade (p < 0.001) and 11.7 °C per decade (p < 0.001) under RCP 4.5, RCP 6.0 and RCP8.5, respectively (Figure 6a,c,e), all greater than 1.7 °C per decade based on observations. The rise was faster with higher radiative forcing levels, and the rate under RCP8.5 was twice that under RCP4.5. The projected payout presented similar variation characteristics to those of the HSWI from 2021 to 2099. It also fluctuated considerably and increased at rates of 13.1 CNY mu−1 per decade (p < 0.001), 18.8 CNY mu−1 per decade (p < 0.001) and 20.9 CNY mu−1 per decade (p < 0.001) under the three RCPs (Figure 6b,d,f), all greater than 4.0 CNY mu−1 per decade based on observations.
The projected HSWI under the three RCPs ranged between 18.4 and 23.1 °C, 27.4 and 50.2 °C, and 43.1 and 82.9 °C for the near future, mid-future and far future (Figure 7a) and, on average, rose by 1.4 times, 3.3 times and 6.1 times compared with the reference value. The greatest increase was 8.8 times in the far future under RCP8.5. There were minor differences between the HSWI under the three RCPs in the near future, while larger differences were detected in the far future, and the HSWI under RCP8.5 was nearly 2 times higher than that under RCP4.5.
The payout of the projected HSWI under the three RCPs ranged between 36.2 and 49.5 CNY mu−1, 66.9 and 128.5 CNY mu−1, and 100.5 and 167.3 CNY mu−1 for the near future, mid-future and far future (Figure 7b), which are, on average, 3.9 times, 9.8 times and 15 times higher than the reference value. The greatest increase was 18.7 times in the far future under RCP8.5. The payouts under the three RCPs in the near future had minor differences, while larger differences were found in the mid-future, and the payout under RCP8.5 was 1.9 times higher than that under RCP6.0. According to the insurance model, the payout of the HSWI was up to 180 CNY mu−1. However, the number of years with a payout reaching 180 CNY mu−1 was 2 years, 6 years and 17 years in the near future, mid-future and far future, that is, 10%, 20% and 59% of the total years. The results suggest that a more severe influence of heat damage on rice production will probably occur in the future.
Figure 8 shows the spatial distribution of the differences between the projected and reference HSWI under the three RCPs. The reference HSWI and the payout ranged from 1.9 to 25.0 °C and from 0.0 to 58.4 CNY mu−1, with an average of 8.4 °C and 8.5 CNY mu−1. The payout was zero at most stations in the area north of the Yangtze River, where the HSWI was lower than the trigger value, and was less than 60 CNY mu−1 in the area south of the Yangtze River. Positive differences under the three RCPs indicate a higher HSWI than the reference. The largest increases were found in the far future under all three RCPs, ranging from 20.0 to 48.3 °C, 28.7 to 64.9 °C and 51.9 to 96.8 °C for RCP4.5, RCP6.0 and RCP8.5, followed by the mid-future, with the HSWI ranging from 13.5 to 36.2 °C, 10.8 to 29.5 °C and 25.2 to 58.3 °C, and the near future had the smallest HSWI, ranging from 4.8 to 15.8 °C, 4.6 to 15.4 °C and 8.2 to 22.7 °C. Therefore, increases in the HSWI showed little difference in the near future under the three RCPs, while it presented great differences in the far future. The area south of the Yangtze River and the western part of the Yangtze–Huai River Basin had the largest rise in HSWI, with values up to 80 °C in the far future under RCP8.5. The smallest increases were detected in the middle part of the Yangtze–Huai River Basin.
The differences between projected and reference payouts were positive, as shown in Figure 9, indicating a rising trend of payouts. The largest increases were detected in the far future, ranging from 40.5 to 121.1 CNY mu−1, 69.7 to 166.7 CNY mu−1 and 121.6 to 175.0 CNY mu−1 for RCP4.5, RCP6.0 and RCP8.5, followed by the mid-future, with the payout ranging from 21.9 to 105.1 CNY mu−1, 15.8 to 92.1 CNY mu−1 and 71.6 to 146.2 CNY mu−1, and the near future had the smallest payout, ranging from 14.1 to 49.4 CNY mu−1, 7.4 to 52.1 CNY mu−1 and 9.9 to 81.8 CNY mu−1. Thus, similar to the HSWI, increases in the payout also showed little difference in the near future, while it presented large differences in the far future. The rise in the payout was largest in the area south of the Yangtze River and the western part of the Yangtze–Huai River Basin, with values up to 160 CNY mu−1 in the far future under RCP8.5, while it was smallest in the middle part of the Yangtze–Huai River Basin with the lowest HSWI.

5. Discussion

Based on data from meteorological stations in Anhui Province in China from 1961 to 2018 and projected data from five GCMs under three RCPs from 2021 to 2099, the spatial–temporal characteristics of heat stress and its influence on rice production were analyzed by employing a weather index insurance model.
From 1961 to 2018, the HSWI and its payout increased at rates of 1.7 °C per decade (p < 0.1) and 4.0 CNY mu−1 per decade (p < 0.1) over the whole study area, and the largest increase was found in the southeastern part, while the interdecadal breakpoints in their variation trends were detected in 1987. The HSWI and its payout decreased slightly at rates of −3.3 °C per decade and −8.3 CNY mu−1 per decade before 1987, and they increased significantly at rates of 5.8 °C per decade (p < 0.05) and 14.4 CNY mu−1 per decade (p < 0.05) after 1987. An increasing trend was found at each meteorological station after 1987, ranging between 2.0 and 11.5 °C per decade and 3.0 and 31.7 CNY mu−1 per decade. The rising trend of the HSWI detected in this study is consistent with the findings that the frequency and intensity of heat waves have increased in the past few decades [42,46,47,48]. The negative impact and economic loss represented by the insurance payout also agree with the results of some research that heat waves have had large negative consequences and reduced rice yields by up to 30% [49].
From 2021 to 2099, the projected HSWI showed considerable interannual fluctuations and increased significantly at rates of 5.2 °C per decade, 7.2 °C per decade and 11.7 °C per decade under the three RCPs. The growth was faster with higher radiative forcing levels, and the rate under RCP8.5 was twice that under RCP4.5. The IPCC also reported that extreme high-temperature events are expected to increase and become more severe in the future warming context [46,48]. Consequently, the HSWI in the near future, mid-future and far future rose by an average of 1.4 times, 3.3 times and 6.1 times compared with the reference value. Despite the different indexes used, it was concluded by some researchers that the risk of high-level and medium-level extreme warm events would be 2.14 and 1.93 times that in the baseline period from 1986 to 2005 [50], which agrees with our findings. Larger differences between various RCPs were predicted to occur in the far future. For example, the HSWI under RCP8.5 was nearly 2 times that under RCP4.5. Spatially, the area south of the Yangtze River and the western part of the Yangtze–Huai River Basin had the largest rise in HSWI.
The projected payout also increased at rates of 13.1 CNY mu−1 per decade, 18.8 CNY mu−1 per decade and 20.9 CNY mu−1 per decade under the three RCPs from 2021 to 2099. Payouts in the near future, mid-future and far future were on average 3.9 times, 9.8 times and 15.0 times higher than the reference value. Large differences in payouts were detected between various RCPs, especially for the mid-future when the payout under RCP8.5 was 1.9 times higher than that under RCP6.0. The increasing insurance payout simulated in our study agrees with the general conclusions of several studies that rice yields will be negatively influenced by heat stress in the future and that the effects will probably worsen [24,25,51].
In the coming decades until the end of the century, the average temperature is projected to continue to increase, and extreme climate events will probably occur frequently [46]. The negative influence of high temperatures on rice production in South China will likely be more serious, making rice production more vulnerable [15]. The study area south of the Huai River has a subtropical humid monsoon climate, where the air temperature is lowest in winter and highest in summer. Although the rice growth period will be earlier in the future due to sufficient heat resources [39], the booting and filling stages are still in the period with the most hot days of the whole year. The sensitivity of rice to high temperatures in the reproductive growth period is higher than that in the vegetative growth period. Therefore, the increased heat stress during the booting and filling stages in the future will not be conducive to the formation of rice yield and will ultimately lead to a serious decline in rice yield [15]. Moreover, from the perspective of spatial distribution, the higher air temperature resulted in a larger HSWI and more serious heat stress in the southern part of the study area compared with the northern part.
It is vital to develop relevant adaptation strategies for the effects of a warmer climate and heat stress on rice production. One strategy is to breed rice varieties that are more resistant to high temperatures. It is also important to advise and help farmers to take appropriate field management actions so that rice is less exposed to extremely high temperatures [15]. Moreover, to mitigate the negative impact of heat stress on rice, the cost of manpower and fertilizer for disaster prevention will probably rise. Weather index insurance is one of the important ways to reduce disaster losses and compensate for production costs. However, the model parameters in this study were determined based on historical data. Thus, it is necessary to improve the heat stress weather index insurance model for future scenarios and introduce it in the study area to promote disaster defense and risk transference.
The results for the future in this paper have some uncertainties due to the complexity of simulating heat stress and its impact on rice production. On the one hand, although the model data were corrected, the projected accuracy still depends on model performance and is probably subject to model completeness, model parameterization and the radiative forcing scenario [52,53,54]. On the other hand, the HSWI model simplified the evaluation of heat stress on rice and was established by applying historical observation and rice yields. Simulations of the HSWI and the payout considered the altered rice growth periods while neglecting the variation in the rice variety, sowing date, trigger value and premium rate, leading to some deviations in projections for the future. Moreover, the estimation of the future HSWI and payout was mainly based on the daily maximum air temperature. The insufficient consideration of variations in other climate factors, such as precipitation and solar radiation, and the improvement of management technologies, such as irrigation and fertilization, will also lead to some uncertainties in our results for the future.

6. Conclusions

Differing from existing studies, this study proposed a new perspective on agricultural weather index insurance to investigate the impact of extreme high-temperature events on rice production in South China in the context of climate change. The interdecadal breakpoints in the trends of the heat stress weather insurance index (HSWI) and the payout from 1961 to 2018 were both detected in 1987, which are consistent with the more significant global warming since the 1980s. The largest increase after 1987 was found in the southeastern part of the study area. The projected HSWI and the payout will increase significantly from 2021 to 2099, and the growth will be faster with higher radiative forcing levels. The HSWI was on average 1.4 times, 3.3 times and 6.1 times higher and the payouts were on average 3.9 times, 9.8 times and 15.0 times higher than the reference values for the near future, mid-future and far future, respectively. The results suggest that a more severe influence of heat damage on rice production will probably occur in the future. This paper provides an alternative way to transform the evaluation of the extreme climate event index into the quantitative estimation of disaster impacts on crop production.

Author Contributions

Conceptualization, C.D.; Formal analysis, S.W.; Methodology, T.Y.; Writing—original draft, W.C. All authors have read and agreed to the published version of the manuscript.

Funding

This research was funded by the Climate Change Project of China Meteorological Administration (Grant No. CCSF201832) and Innovation Team Construction Plan of Anhui Meteorological Bureau.

Conflicts of Interest

The authors declare no conflict of interest.

References

  1. Food and Agricultural Organization of the United Nations; FAO: Rome, Italy, 2019.
  2. Zhu, C.; Xiang, J.; Zhang, Y.; Zhang, Y.; Zhu, D.; Chen, H. Innovation and practice of high-yield rice cultivation technology in China. Sci. Agric. Sin. 2015, 48, 3404–3414. [Google Scholar]
  3. Peng, S.; Tang, Q.; Zou, Y. Current Status and Challenges of Rice Production in China. Plant Prod. Sci. 2009, 12, 3–8. [Google Scholar] [CrossRef] [Green Version]
  4. Fahad, S.; Adnan, M.; Hassan, S.; Saud, S.; Hussain, S.; Wu, C.; Wang, D.; Hakeem, K.R.; Alharby, H.F.; Turan, V. Rice responses and tolerance to high temperature. In Advances in Rice Research for Abiotic Stress Tolerance; Elsevier: Amsterdam, The Netherlands, 2019; pp. 201–224. [Google Scholar]
  5. Matsui, T.; Omasa, K.; Horie, T. High temperature at flowering inhibit swelling of pollen grains, a driving force for thecae dehiscence in rice (Oryza sativa L.). Plant Prod. Sci. 2000, 3, 430–434. [Google Scholar] [CrossRef]
  6. Matsui, T.; Omasa, K.; Horie, T. The Difference in Sterility due to High Temperatures during the Flowering Period among Japonica-Rice Varieties. Plant Prod. Sci. 2001, 4, 90–93. [Google Scholar] [CrossRef]
  7. Matsui, T.; Omasa, K. Rice (Oryza sativa L.) cultivars tolerant to high temperature at flowering, anther characteristics. Ann. Bot. 2002, 89, 683–687. [Google Scholar] [CrossRef] [Green Version]
  8. Jagadish, S.; Craufurd, P.; Wheeler, T. High temperature stress and spikelet fertility in rice (Oryza sativa L.). J. Exp. Bot. 2007, 58, 1627–1635. [Google Scholar] [CrossRef] [PubMed] [Green Version]
  9. Jagadish, S.V.K.; Craufurd, P.Q.; Wheeler, T.R. Phenotyping parents of mapping populations of rice (Oryza sativa L.) for heat tolerance during anthesis. Crop Sci. 2008, 48, 1140–1146. [Google Scholar] [CrossRef]
  10. Jagadish, S.V.K.; Muthurajan, R.; Oane, R.; Wheeler, T.R.; Heuer, S.; Bennett, J.; Craufurd, P.Q. Physiological and proteomic approaches to address heat tolerance during anthesis in rice (Oryza sativa L.). J. Exp. Bot. 2010, 61, 143–156. [Google Scholar] [CrossRef] [PubMed]
  11. Matsui, T.; Omasa, K.; Horie, T. Comparison between anthers of two rice (Oryza sativa L.) cultivars with tolerance to high temperatures at flowering or susceptibility. Plant Prod. Sci. 2001, 4, 36–40. [Google Scholar] [CrossRef] [Green Version]
  12. Endo, M.; Tsuchiya, T.; Hamada, K.; Kawamura, S.; Yano, K.; Ohshima, M.; Higashitani, A.; Watanabe, M.; Kawagishi-Kobayashi, M. High Temperatures Cause Male Sterility in Rice Plants with Transcriptional Alterations During Pollen Development. Plant Cell Physiol. 2009, 50, 1911–1922. [Google Scholar] [CrossRef]
  13. Kobata, T.; Uemuki, N. High Temperatures during the Grain-Filling Period Do Not Reduce the Potential Grain Dry Matter Increase of Rice. Agron. J. 2004, 96, 406–414. [Google Scholar] [CrossRef]
  14. Jagadish, S.V.K.; Muthurajan, R.; Rang, Z.W.; Malo, R.; Heuer, S.; Bennett, J.; Craufurd, P.Q. Spikelet Proteomic Response to Combined Water Deficit and Heat Stress in Rice (Oryza sativa cv. N22). Rice 2011, 4, 1–11. [Google Scholar] [CrossRef] [Green Version]
  15. Song, Y.; Wang, C.; Linderholm, H.W.; Fu, Y.; Cai, W.; Xu, J.; Zhuang, L.; Wu, M.; Shi, Y.; Wang, G.; et al. The negative impact of increasing temperatures on rice yields in southern China. Sci. Total Environ. 2022, 820, 153262. [Google Scholar] [CrossRef] [PubMed]
  16. Gourdji, S.M.; Sibley, A.M.; Lobell, D.B. Global crop exposure to critical high temperatures in the reproductive period, Historical trends and future projections. Environ. Res. Lett. 2013, 8, 24–41. [Google Scholar] [CrossRef]
  17. Zhao, C.; Liu, B.; Piao, S.L.; Wang, X.H.; Lobell, D.B.; Huang, Y.; Huang, M.T.; Yao, Y.T.; Bassu, S.; Ciais, P.; et al. Temperature increase reduces global yields of major crops in four independent estimates. Proc. Natl. Acad. Sci. USA 2017, 114, 9326–9331. [Google Scholar] [CrossRef] [PubMed] [Green Version]
  18. Lesk, C.; Rowhani, P.; Ramankutty, N. Influence of extreme weather disasters on global crop production. Nature 2016, 529, 84–87. [Google Scholar] [CrossRef] [PubMed] [Green Version]
  19. Tao, F.; Zhang, Z.; Liu, J.; Yokozawa, M. Modelling the impacts of weather and climate variability on crop productivity over a large area: A new super-ensemble-based probabilistic projection. Agric. For. Meteorol. 2009, 149, 1266–1278. [Google Scholar] [CrossRef]
  20. Chen, Y.; Zhang, Z.; Tao, F. Impacts of climate change and climate extremes on major crops productivity in China at a global warming of 1.5 and 2.0 °C. Earth Syst. Dyn. 2018, 9, 543–562. [Google Scholar] [CrossRef] [Green Version]
  21. Tao, F.; Zhang, S.; Zhang, Z. Changes in rice disasters across China in recent decades and the meteorological and agronomic causes. Reg. Environ. Chang. 2013, 13, 743–759. [Google Scholar] [CrossRef]
  22. Zhang, Z.; Wang, P.; Chen, Y.; Song, X.; Wei, X.; Shi, P. Global warming over 1960–2009 did increase heat stress and reduce cold stress in the major rice-planting areas across China. Eur. J. Agron. 2014, 59, 49–56. [Google Scholar] [CrossRef]
  23. Shi, P.; Tang, L.; Lin, C.; Liu, L.; Wang, H.; Cao, W.; Zhu, Y. Modeling the effects of post-anthesis heat stress on rice phenology. Field Crop. Res. 2015, 177, 26–36. [Google Scholar] [CrossRef]
  24. Piao, S.L.; Ciais, P.; Huang, Y.; Shen, Z.H.; Peng, S.S.; Li, J.S.; Zhou, L.P.; Liu, H.Y.; Ma, Y.C.; Ding, Y.H.; et al. The impacts of climate change on water resources and agriculture in China. Nature 2010, 467, 43–51. [Google Scholar] [CrossRef]
  25. Ling, X.; Zhang, Z.; Zhai, J.; Ye, S.; Huang, J. A review for impacts of climate change on rice production in China. Acta Agron. Sin. 2019, 45, 323–334. [Google Scholar] [CrossRef]
  26. Crompton, R.P.; Mcaneney, K.J. Normalised Australian insured losses from meteorological hazards, 1967–2006. Environ. Sci. Policy 2008, 11, 371–378. [Google Scholar] [CrossRef]
  27. Sangha, K.K.; Russell-Smith, J.; Edwards, A.C.; Surjan, A. Assessing the real costs of natural hazard-induced disasters, A case study from Australia’s Northern Territory. Nat. Hazards J. Int. Soc. Prev. Mitig. Nat. Hazards 2021, 108, 479–498. [Google Scholar] [CrossRef]
  28. Clarke, D.; Mahul, O.; Rao, K.N.; Verma, N. Weather Based Crop Insurance in India; Policy Research Working Paper Series 5985; The World Bank: Washington, DC, USA, 2021. [Google Scholar]
  29. Biswas, B.; Dhaliwal, L.; Singh, S.P.; Sandhu, S. Weather based crop insurance in India, Present status and future possibilities. J. Agrometeorol. 2009, 11, 238–241. [Google Scholar]
  30. Liu, B.C.; Li, M.S.; Guo, Y. Analysis of the Demand for Weather Index Agricultural Insurance on Household level in Anhui, China. Agric. Agric. Sci. Procedia 2010, 1, 179–186. [Google Scholar] [CrossRef] [Green Version]
  31. Barry, J.B.; Olivier, M. Weather index insurance for agriculture and rural areas in lower-income countries. Am. J. Agric. Econ. 2007, 89, 1241–1247. [Google Scholar]
  32. Hess, U.; Syroka, J. Weather-Based Insurance in Southern Africa, The Case of Malawi; Agriculture and Rural Development Discussion; The World Bank: Washington, DC, USA, 2005. [Google Scholar]
  33. Paulson, N.D.; Hart, C.E. A spatial approach to addressing weather derivative basis risk, A drought insurance example. In Proceedings of the 2006 Annual Meeting of American Agricultural Economics Association, Long Beach, CA, USA, 23–26 July 2006; Iowa State University: Ames, IA, USA, 2006. [Google Scholar]
  34. Raphael, N.K.; Holly, H.W.; Douglas, L.Y. Weather-based crop insurance contracts for African countries. In Proceedings of the International Association of Agricultural Economists Conference, Gold Coast, QL, Australia, 12–18 August 2006. [Google Scholar]
  35. Varangis, P.; Skees, J.; Barnett, B. Weather Indexes for Developing Countries; World Bank: Washington, DC, USA, 2005. [Google Scholar]
  36. Yang, T.; Sun, X.; Liu, B.; Xun, S. Design on weather indices model for insurance of rice heat damage in anhui province. Chin. J. Agrometeorol. 2015, 36, 220–226. [Google Scholar]
  37. Hempel, S.; Frieler, K.; Warszawski, L.; Schewe, J.; Piontek, F. A trend-preserving bias correction—The ISI-MIP approach. Earth Syst. Dyn. 2013, 4, 219–236. [Google Scholar] [CrossRef] [Green Version]
  38. Vuuren, D.; Edmonds, J.; Kaimuma, M.; Riahi, K.; Thomson, A.; Hibbard, K.; Hurtt, G.C.; Kram, T.; Krey, V.; Lamarque, J.-F.; et al. The representative concentration pathways, an overview. Clim. Change 2011, 109, 5–31. [Google Scholar] [CrossRef]
  39. Wang, S.; Song, A.; Xie, W.; Tang, W.; Dai, J.; Ding, X.; Wu, R. Impact Assessment of Future Climate Change on Climatic Productivity Potential of Single-season Rice in the South of the Huaihe River of the Anhui Province. J. Arid. Meteorol. 2020, 38, 179–187. [Google Scholar]
  40. Abatzoglou, J.T.; Brown, T.J. A comparison of statistical downscaling methods suited for wildfire applications. Int. J. Clim. 2011, 32, 772–780. [Google Scholar] [CrossRef]
  41. Duan, C.; Wang, P.; Cao, W.; Wang, X.; Wu, R.; Cheng, Z. Improving the Spring Air Temperature Forecast Skills of BCC_CSM1.1 (m) by Spatial Disaggregation and Bias Correction, Importance of Trend Correction. Atmosphere 2021, 12, 1143. [Google Scholar] [CrossRef]
  42. Shen, C.; Duan, Q.; Miao, C.; Xing, C.; Fan, X.; Wu, Y.; Han, J. Bias Correction and Ensemble Projections of Temperature Changes over Ten Subregions in CORDEX East Asia. Adv. Atmos. Sci. 2020, 37, 1191–1210. [Google Scholar] [CrossRef]
  43. Raeisaenen, J.; Raety, O. Projections of daily mean temperature variability in the future, cross-validation tests with ENSEMBLES regional climate simulations. Clim. Dyn. 2013, 41, 1553–1568. [Google Scholar] [CrossRef]
  44. Taylor, K.E. Summarizing multiple aspects of model performance in a single diagram. J. Geophys. Res. 2001, 106, 7183–7192. [Google Scholar] [CrossRef]
  45. Tomé, A.R.; Miranda, P.M.A. Piecewise linear fitting and trend changing points of climate parameters. Geophys. Res. Lett. 2004, 31, L02207. [Google Scholar] [CrossRef] [Green Version]
  46. IPCC. Climate Change 2021, the Physical Science Basis; Cambridge University Press: Cambridge, UK; New York, NY, USA, 2021. [Google Scholar]
  47. Zhang, X.; Alexander, L.; Hegerl, G.C.; Jones, P.; Tank, A.K.; Peterson, T.C.; Trewin, B.; Zwiers, F.W. Indices for monitoring changes in extremes based on daily temperature and precipitation data. Wires Clim. Change 2011, 2, 851–870. [Google Scholar] [CrossRef]
  48. Xu, Y.; Gao, X.; Giorgi, F.; Zhou, B.; Shi, Y.; Wu, J.; Zhang, Y. Projected Changes in Temperature and Precipitation Extremes over China as Measured by 50-yr Return Values and Periods Based on a CMIP5 Ensemble. Adv. Atmos. Sci. 2018, 35, 376–388. [Google Scholar] [CrossRef]
  49. Zhang, Q.; Zhao, Y.; Wang, C. Study on the impact of high temperature damage to rice in the lower and middle reaches of the Yangtze River. J. Catastrophology 2011, 26, 57–62. [Google Scholar]
  50. Li, D.; Zhou, L.; Zhou, T. Changes of extreme indices over China in response to 1.5 °C global warming projected by a regional climate model. Adv. Earth Sci. 2017, 32, 446–457. [Google Scholar]
  51. Xiong, W.; Feng, L.; Ju, H.; Yang, D. Possible impacts of high temperatures on China’s rice yield under climate change. Adv. Earth Sci. 2016, 31, 515–528. [Google Scholar]
  52. Yao, F.M.; Qin, P.C.; Zhang, J.H.; Lin, E.D.; Vijendra, B. Uncertainties in assessing the effect of climate change on agriculture using model simulation and uncertainty processing methods. Chin. Sci. Bull. 2011, 56, 547–555. [Google Scholar]
  53. Tao, F.L.; Hayashi, Y.; Zhang, Z.; Sakamoto, T.; Yokozawa, M. Global warming, rice production, and water use in China, developing a probabilistic assessment. Agric. For. Meteorol. 2008, 148, 94–110. [Google Scholar] [CrossRef]
  54. Lobell, D.B.; Burke, M.B. Why are agricultural impacts of climate change so uncertain? The importance of temperature relative to precipitation. Environ. Res. Lett. 2008, 3, 034007. [Google Scholar]
Figure 1. Location of observation stations over the area south of the Huai River of Anhui Province in China.
Atmosphere 13 01768 g001
Figure 2. Taylor diagram of HSWI simulated with the 5 climate models compared with observations in the area south of the Huai River of Anhui Province from 1961 to 2005. Observation data were used as a reference. The x- and y-axes refer to the standard deviations (normalized), and the azimuthal axis refers to the time correlation between observations and model simulations.
Atmosphere 13 01768 g002
Figure 3. Spatial distribution of HSWI (a) and payout (b) based on observations in the area south of the Huai River in Anhui Province from 1961 to 2018.
Atmosphere 13 01768 g003
Figure 4. Annual variation in HSWI (a) and payout (b) due to rice heat stress in the area south of the Huai River in Anhui Province from 1961 to 2018.
Atmosphere 13 01768 g004
Figure 5. Spatial distribution of variation trends of HSWI (a) and payout (b) due to rice heat damage in the area south of the Huai River in Anhui Province from 1987 to 2018.
Atmosphere 13 01768 g005
Figure 6. Annual variation in HSWI and payout due to rice heat stress in the area south of the Huai River in Anhui Province from 2021 to 2099 under RCP4.5 (a,b), RCP6.0 (c,d) and RCP8.5 (e,f).
Atmosphere 13 01768 g006
Figure 7. HSWI (a) and payout (b) due to rice heat stress in different periods from 2021 to 2099 under 3 RCPs in the area south of the Huai River in Anhui Province.
Atmosphere 13 01768 g007
Figure 8. Spatial distribution of HSWI differences compared with the reference value in different periods from 2021 to 2099 under 3 RCPs in the area south of the Huai River in Anhui Province. (a) near future under RCP4.5; (b) mid-future under RCP4.5; (c) far future under RCP4.5; (d) near future under RCP6.0; (e) mid-future under RCP6.0; (f) far future under RCP6.0; (g) near future under RCP8.5; (h) mid-future under RCP8.5; (i) far future under RCP8.5.
Atmosphere 13 01768 g008
Figure 9. Spatial distribution of payout differences compared with the reference value in different periods from 2021 to 2099 under 3 RCPs in the area south of the Huai River in Anhui Province. (a) near future under RCP4.5; (b) mid-future under RCP4.5; (c) far future under RCP4.5; (d) near future under RCP6.0; (e) mid-future under RCP6.0; (f) far future under RCP6.0; (g) near future under RCP8.5; (h) mid-future under RCP8.5; (i) far future under RCP8.5.
Atmosphere 13 01768 g009
Table 1. Trigger value and payout standard of rice heat stress weather index insurance [36].
10 < HSWI ≤ 1414 < HSWI ≤ 1818 < HSWI ≤ 2222 < HSWI ≤ 26HSWI > 26
Trigger value C (°C)1014182226
Payout coefficient A (CNY °C−1 mu−1)0.21.52.04.08.0
payout base B (CNY mu−1)00.86.814.830.8
Table 2. Calculation period of HSWI under 3 RCPs in different decades of the 21st century.
RCP4.5RCP6.0RCP8.5
Near future15 July to 9 August16 July to 10 August14 July to 8 August
Mid-future10 July to 4 August11 July to 5 August7 July to 1 August
Far future6 July to 31 July4 July to 29 July27 June to 22 July
Publisher’s Note: MDPI stays neutral with regard to jurisdictional claims in published maps and institutional affiliations.

